-
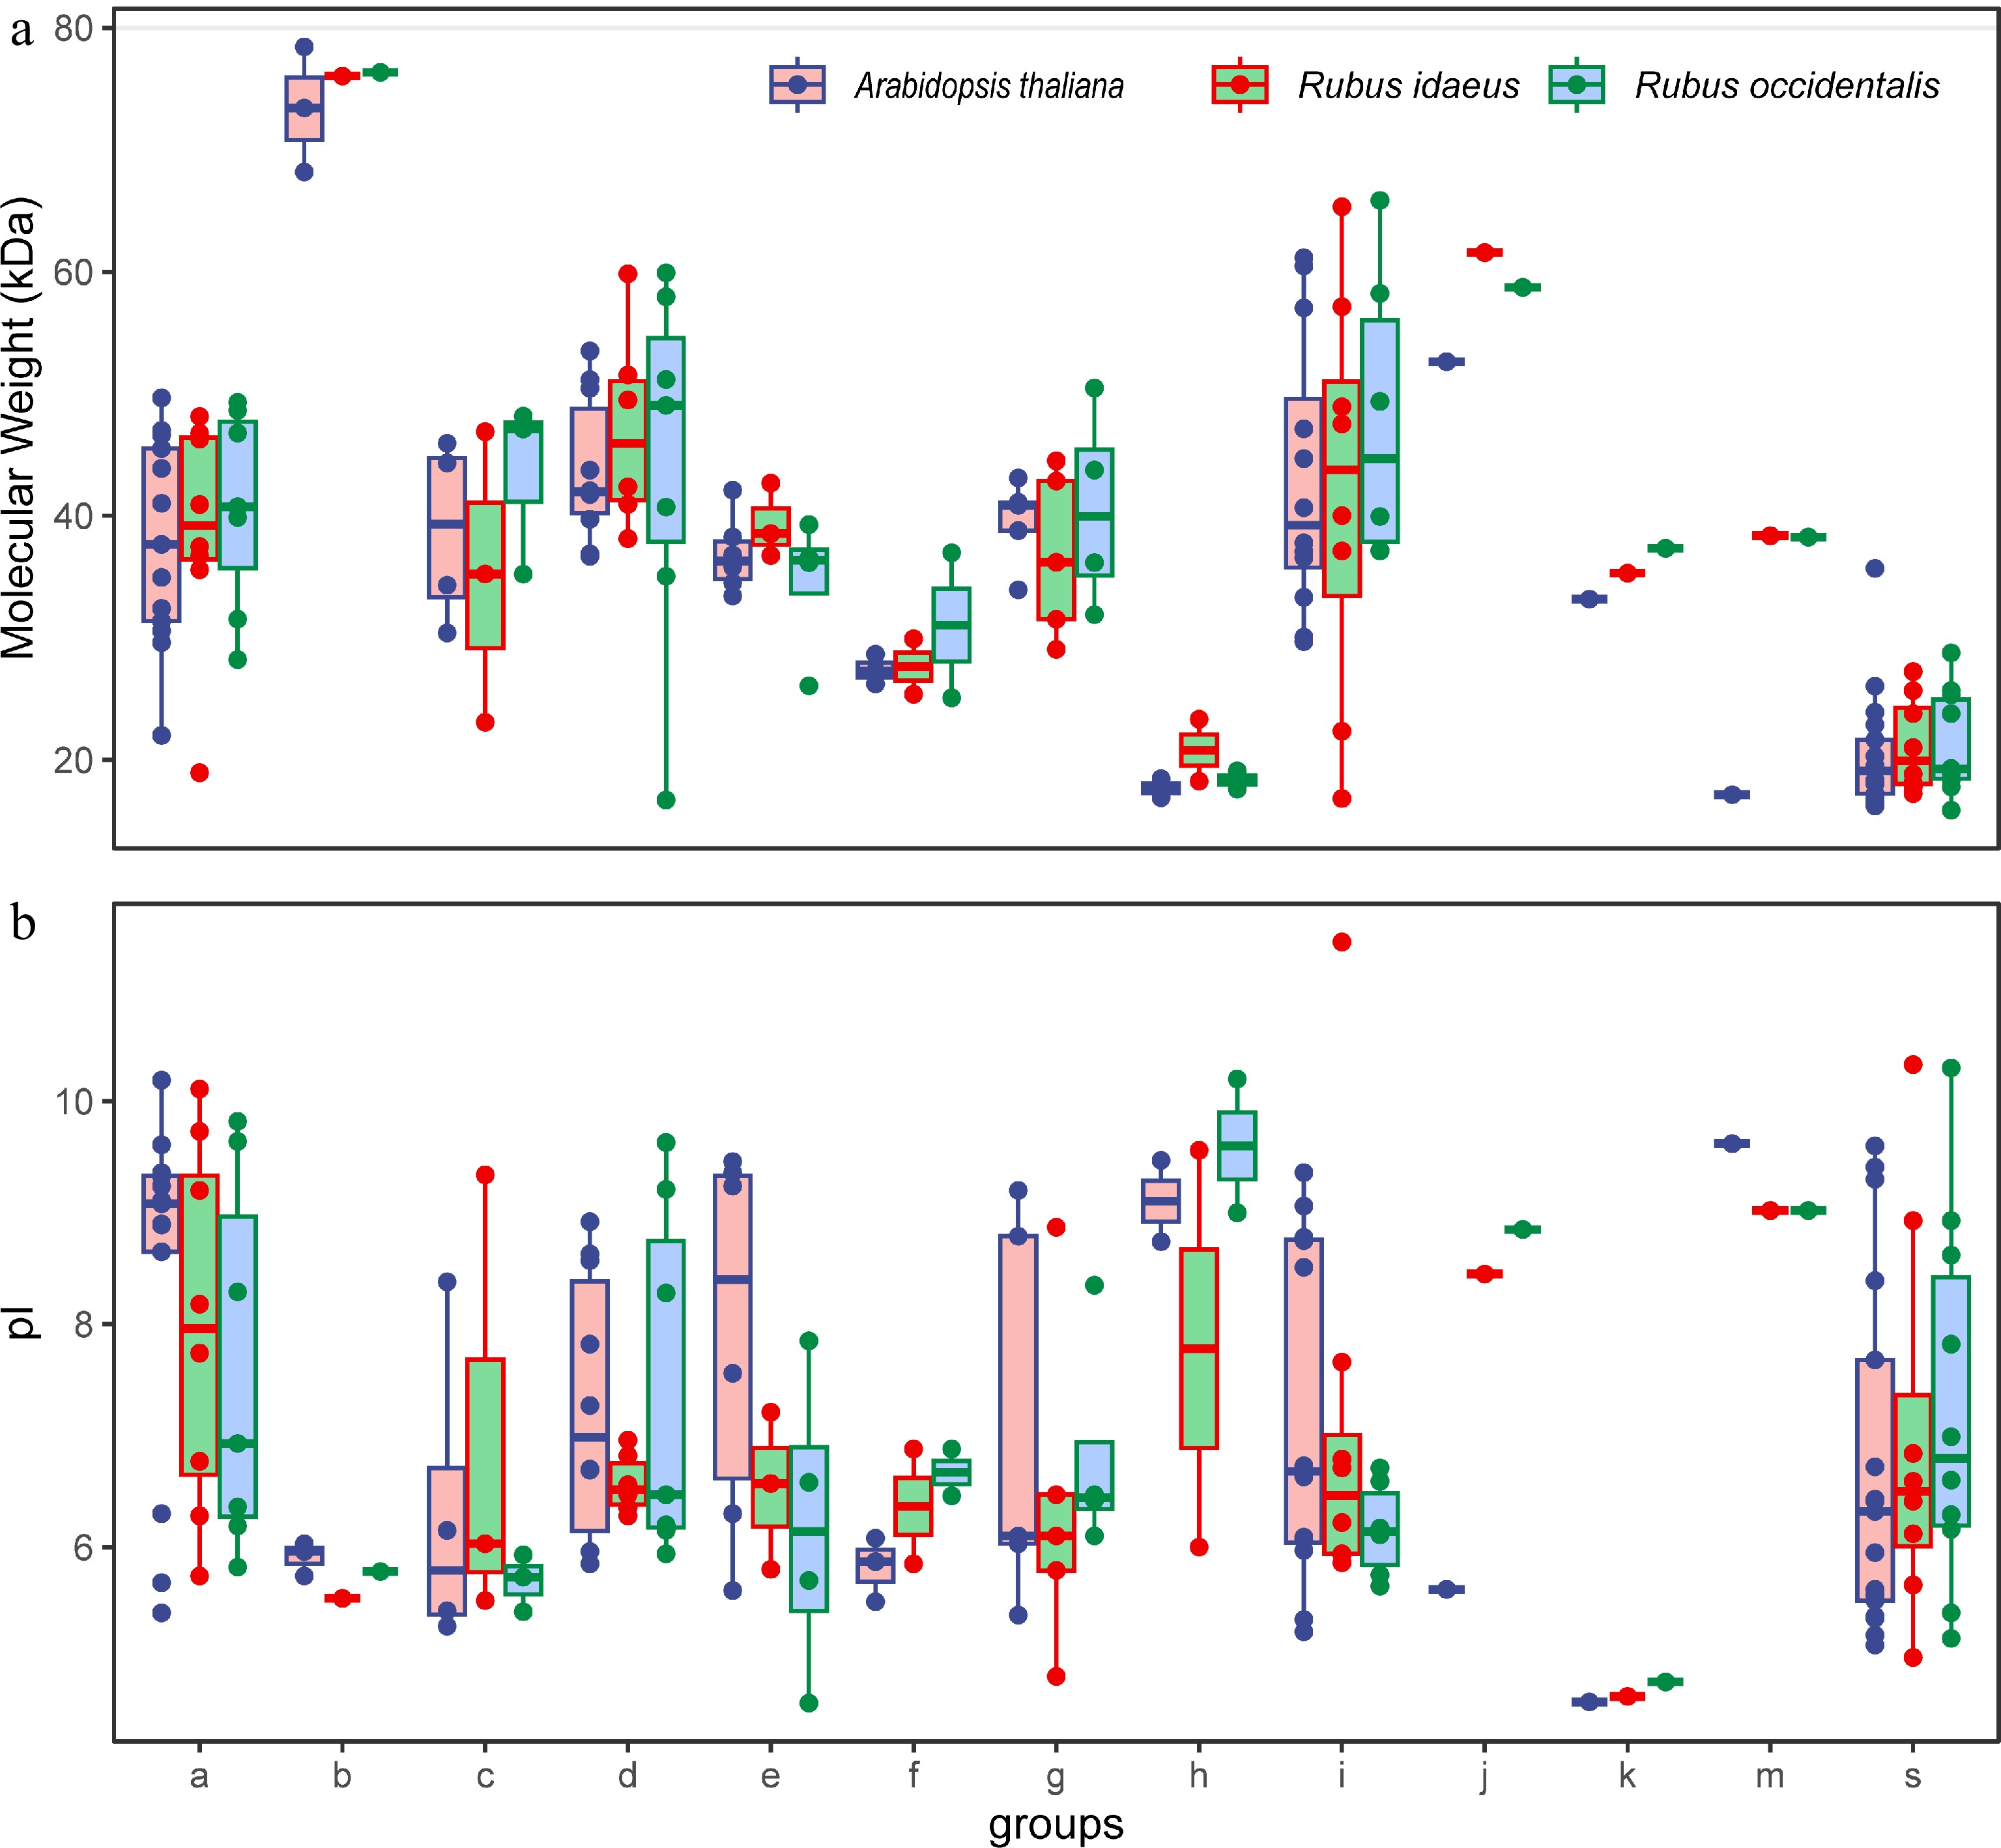
Figure 1.
Molecular weight and protein isoelectric point of the identified bZIPs in each group of Rubus species. Arabidopsis proteins are included as a reference.
-
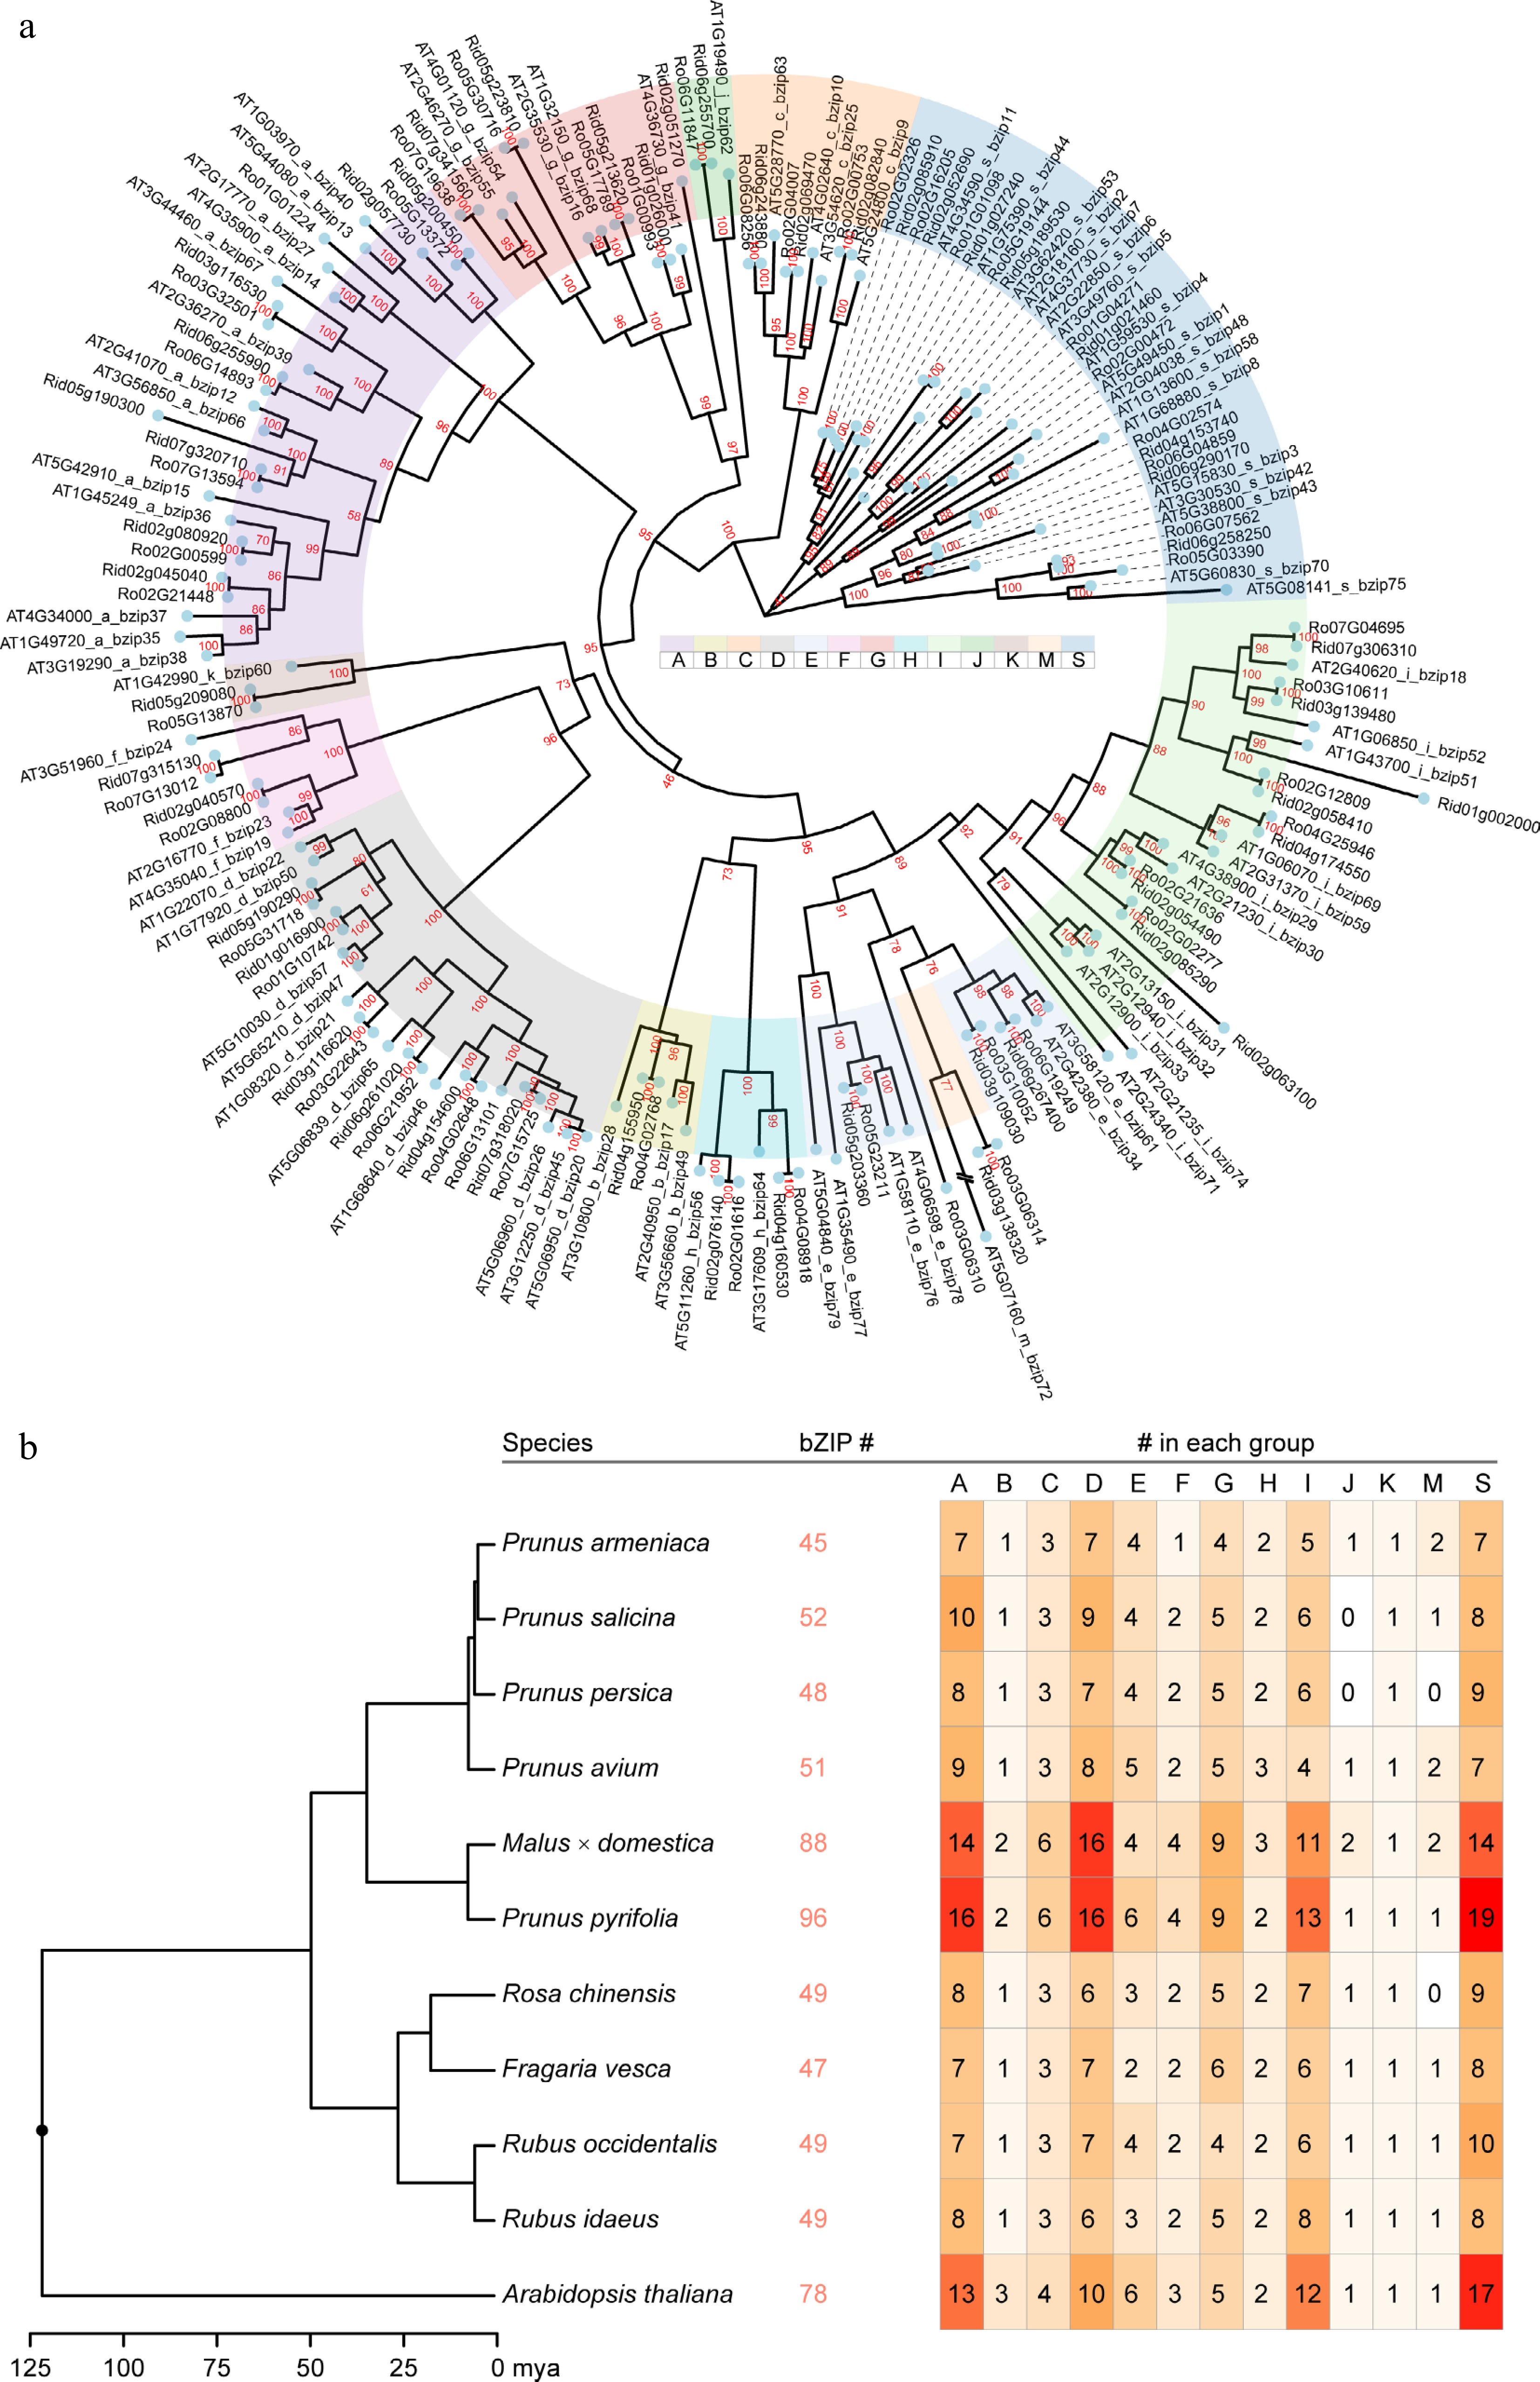
Figure 2.
The phylogenetic tree constructed using the Rubus bZIPs, the number of identified bZIP members in the selected Rosaceae species, and the assigned subgroup members. (a) The tree was constructed using maximum likelihood method implemented in IQ-TREE with 10,000 fast boostraps to validate the tree topology. Bootstrap values were directed labeled on the branches. (b) The ultrametric tree showing the time of divergence within the selected species scaling in million years ago (mya). The identified total bZIP gene number and the number in each subgroup (a to k, plus m and s) were labelled following the species name (tree tip).
-
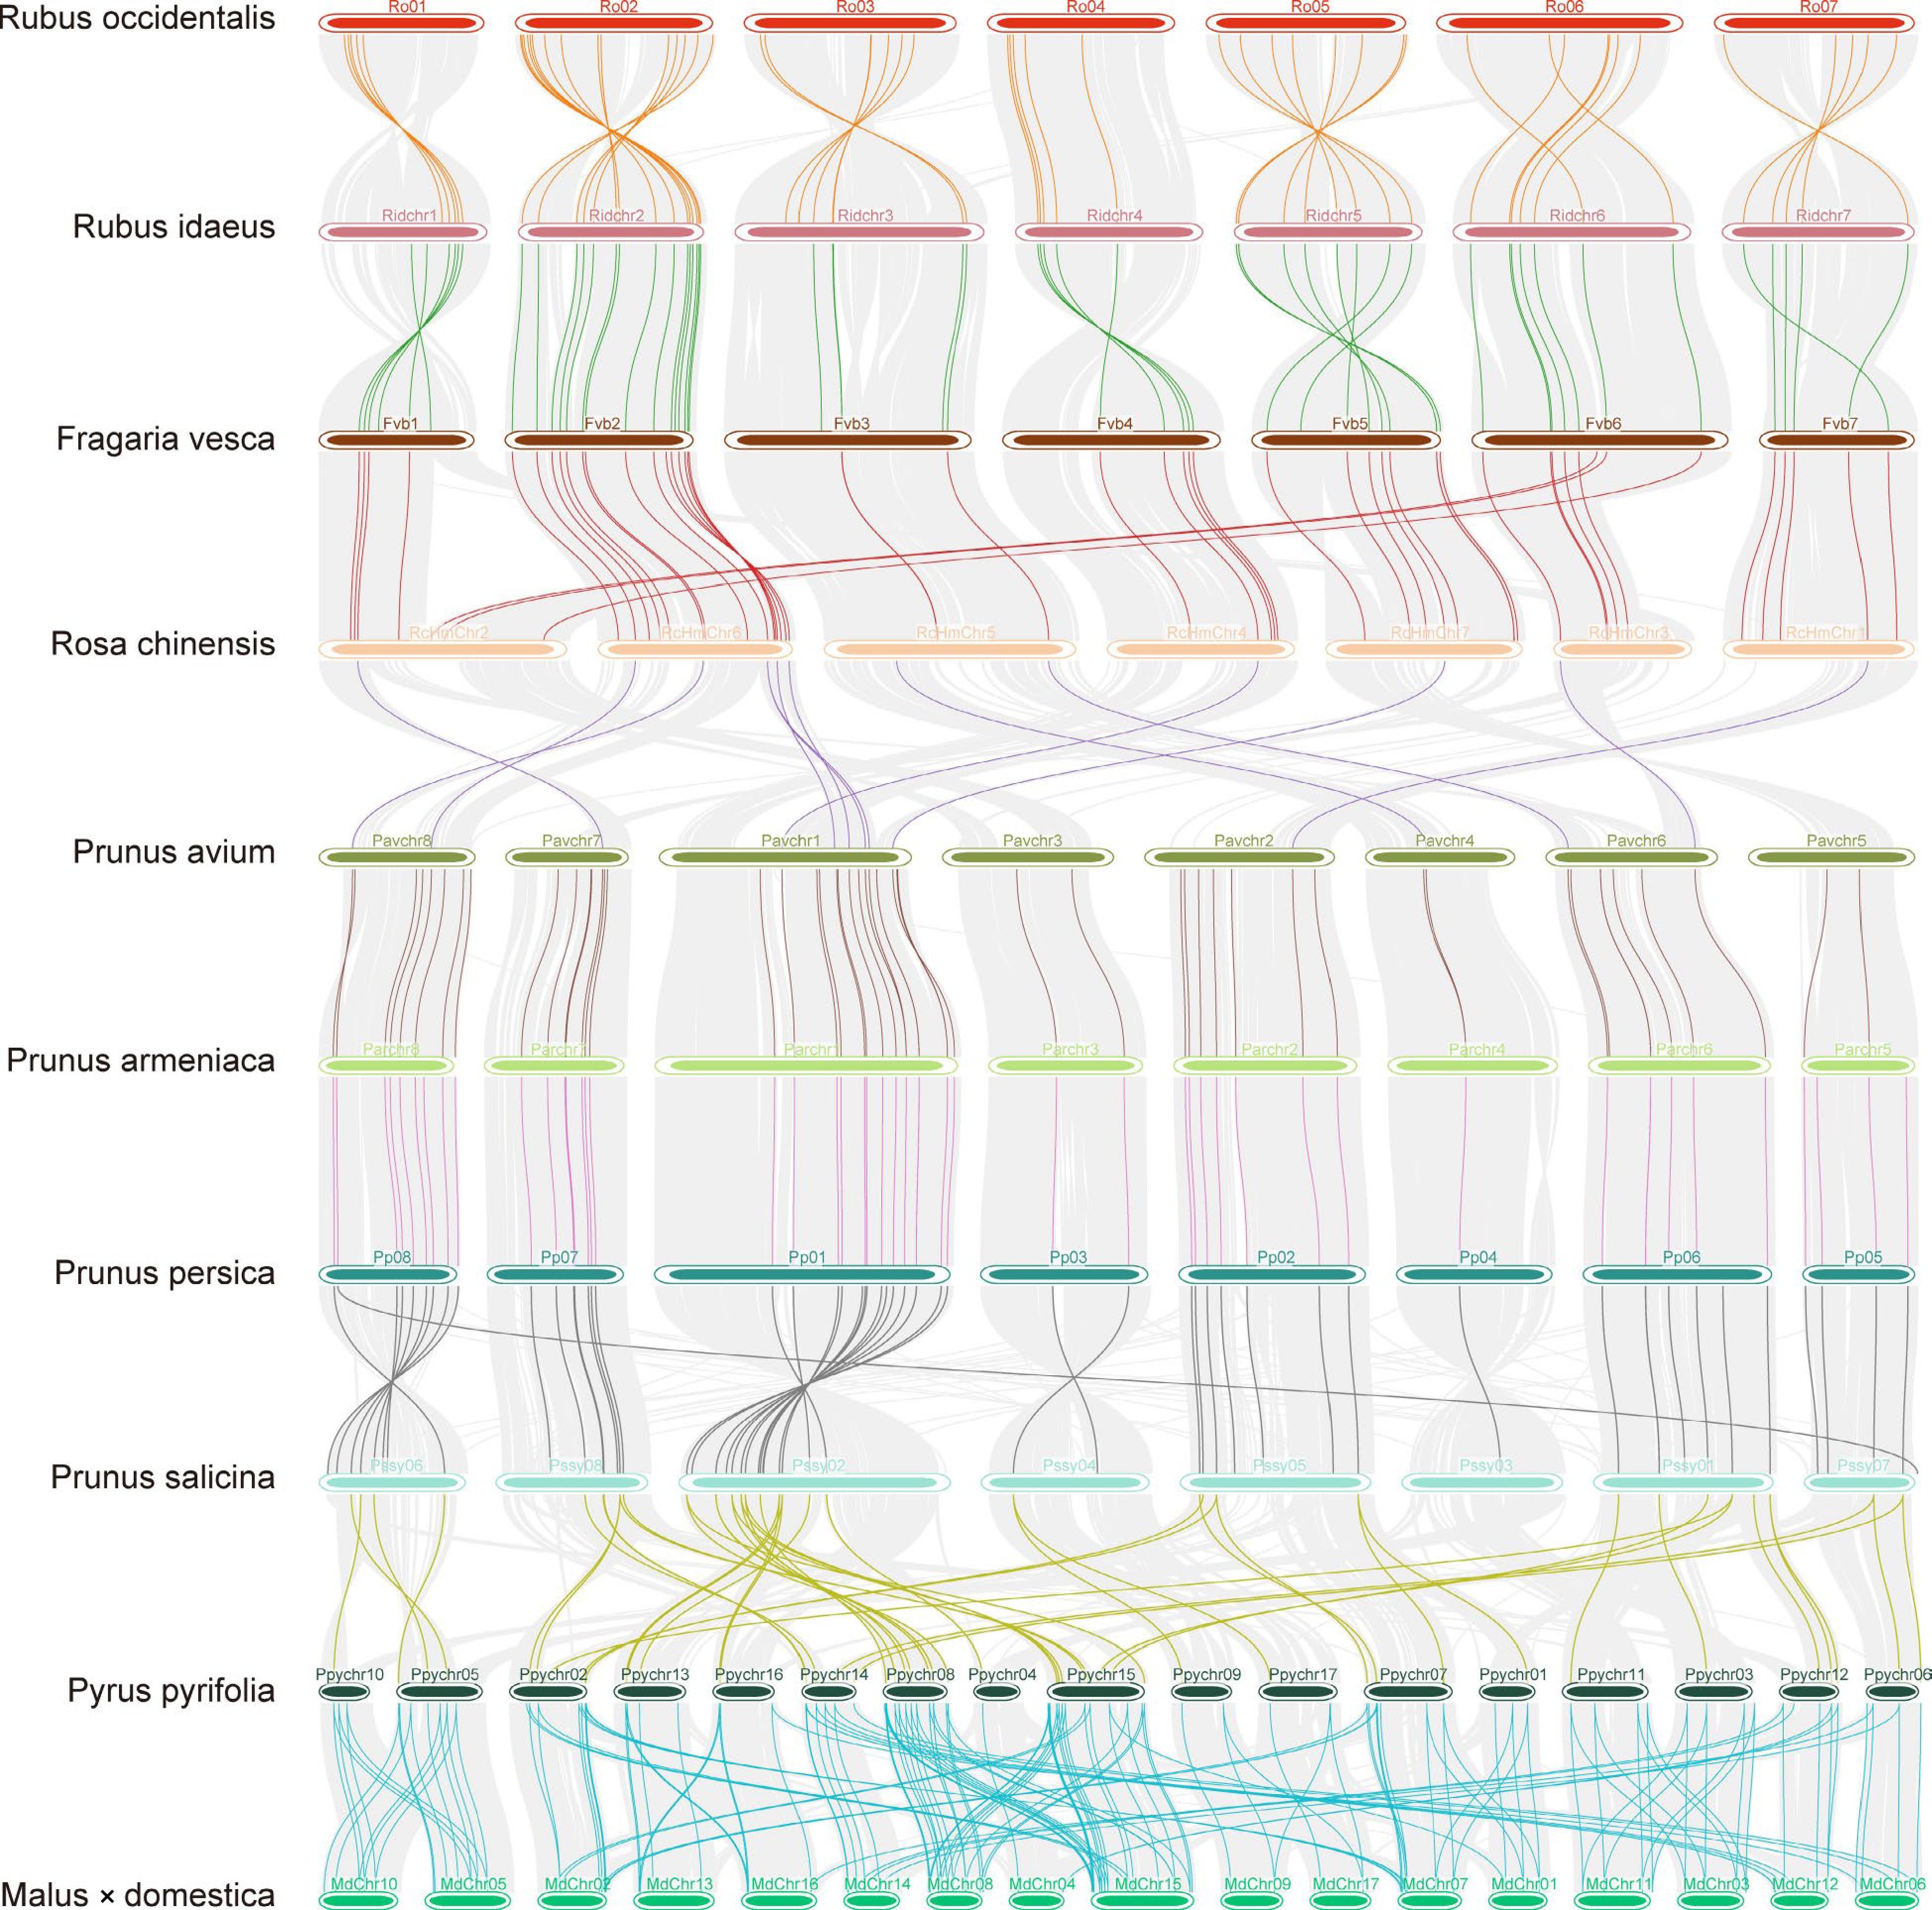
Figure 3.
Micro-synteny of the bZIPs among ten Rosaceae species. Genome-wide syntenic blocks detected by using MCScanX between the adjacient species were linked by gray lines defined by their loci on the chromosoms (horizontal bars) in the background. When there was a (several) syntenic pair(s) of bZIPs located in the syntenic region, they were linked by line(s) of a different color other than gray.
-
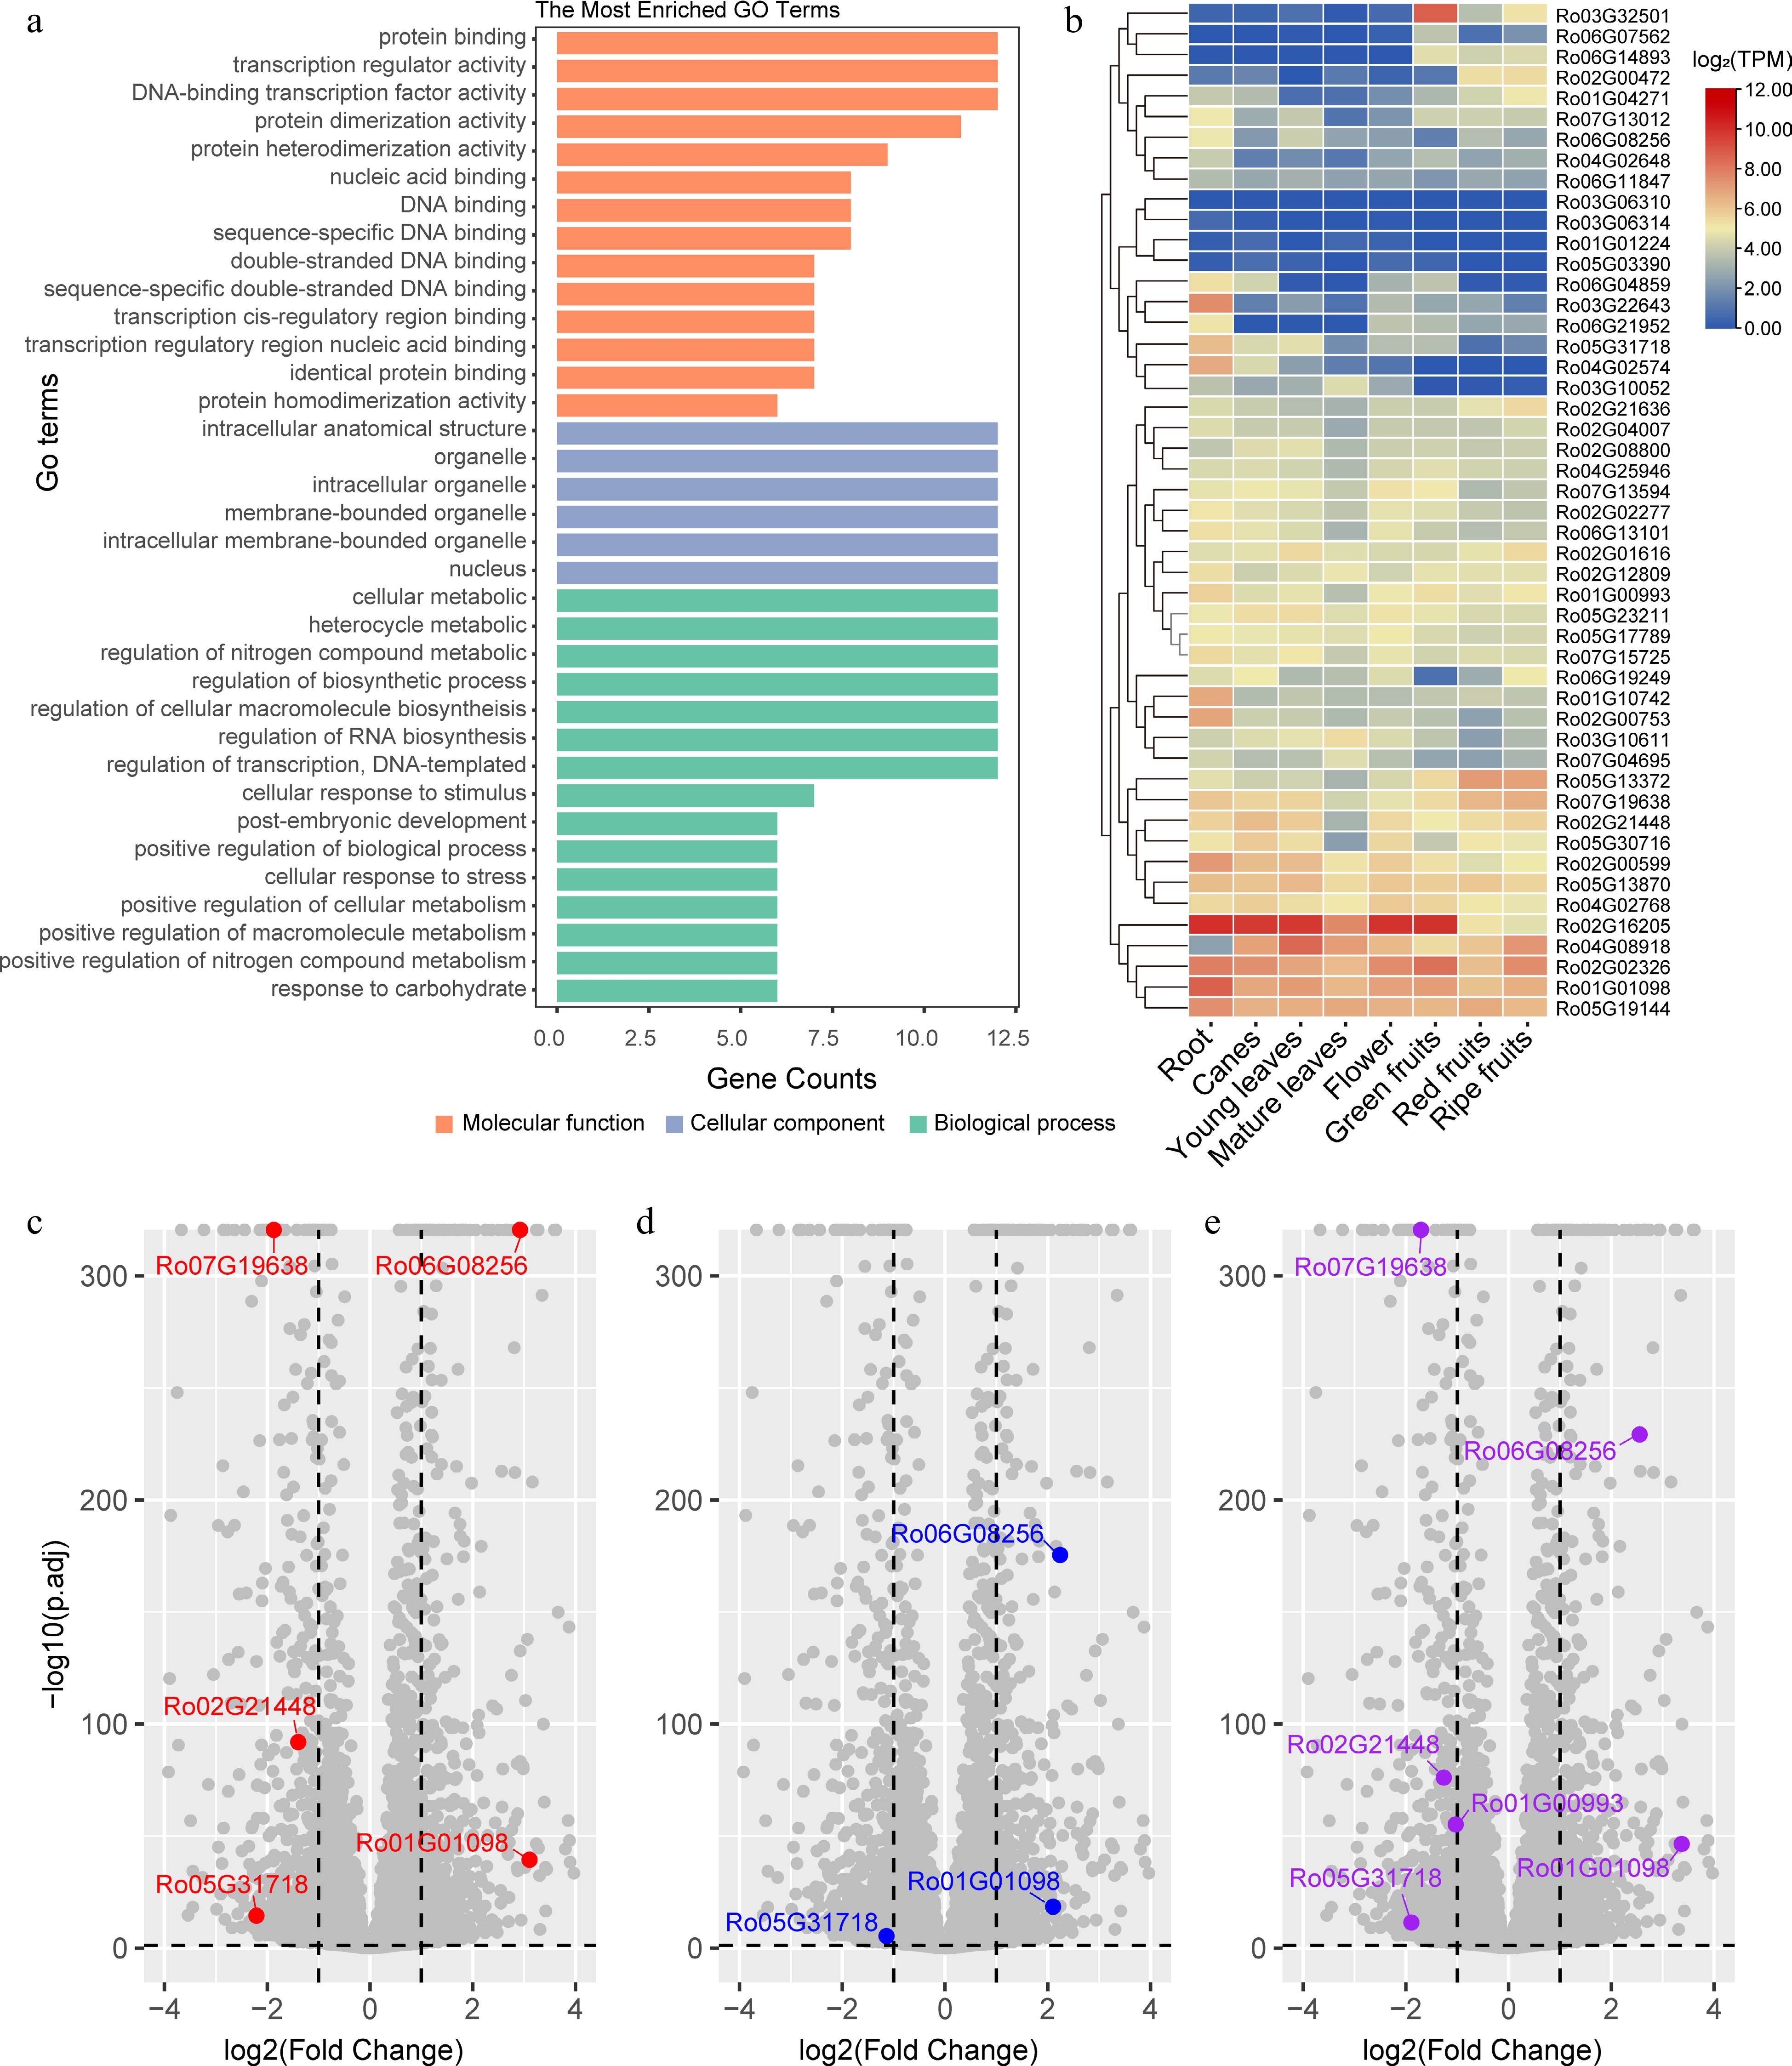
Figure 4.
GO enrichment analysis and expression of the Rubus occidentalis bZIPs in different tissues and in leaves upon treated with different types of nitrogen fertilizers. (a) The most significantly enriched GO terms assigned to the RobZIPs are presented as bar plots. The GO terms categaried in molecular function, cellular component, and biological process are labeled using orange, light blue, and light green color, respectively. (b) The expression level (log2TPM) of bZIP genes in different tissue types are presented as a heatmap. K-means clustering is performed on the rows. Volcano plots showing the differentially expressed genes in the leaves of Rubus spp. when the plants were treated with (c) (NH4)2SO4, (d) Ca(NO3)2, or (e) urea fertilizers. Only differentially expressed RobZIPs are colored, with gene names labeled.
-
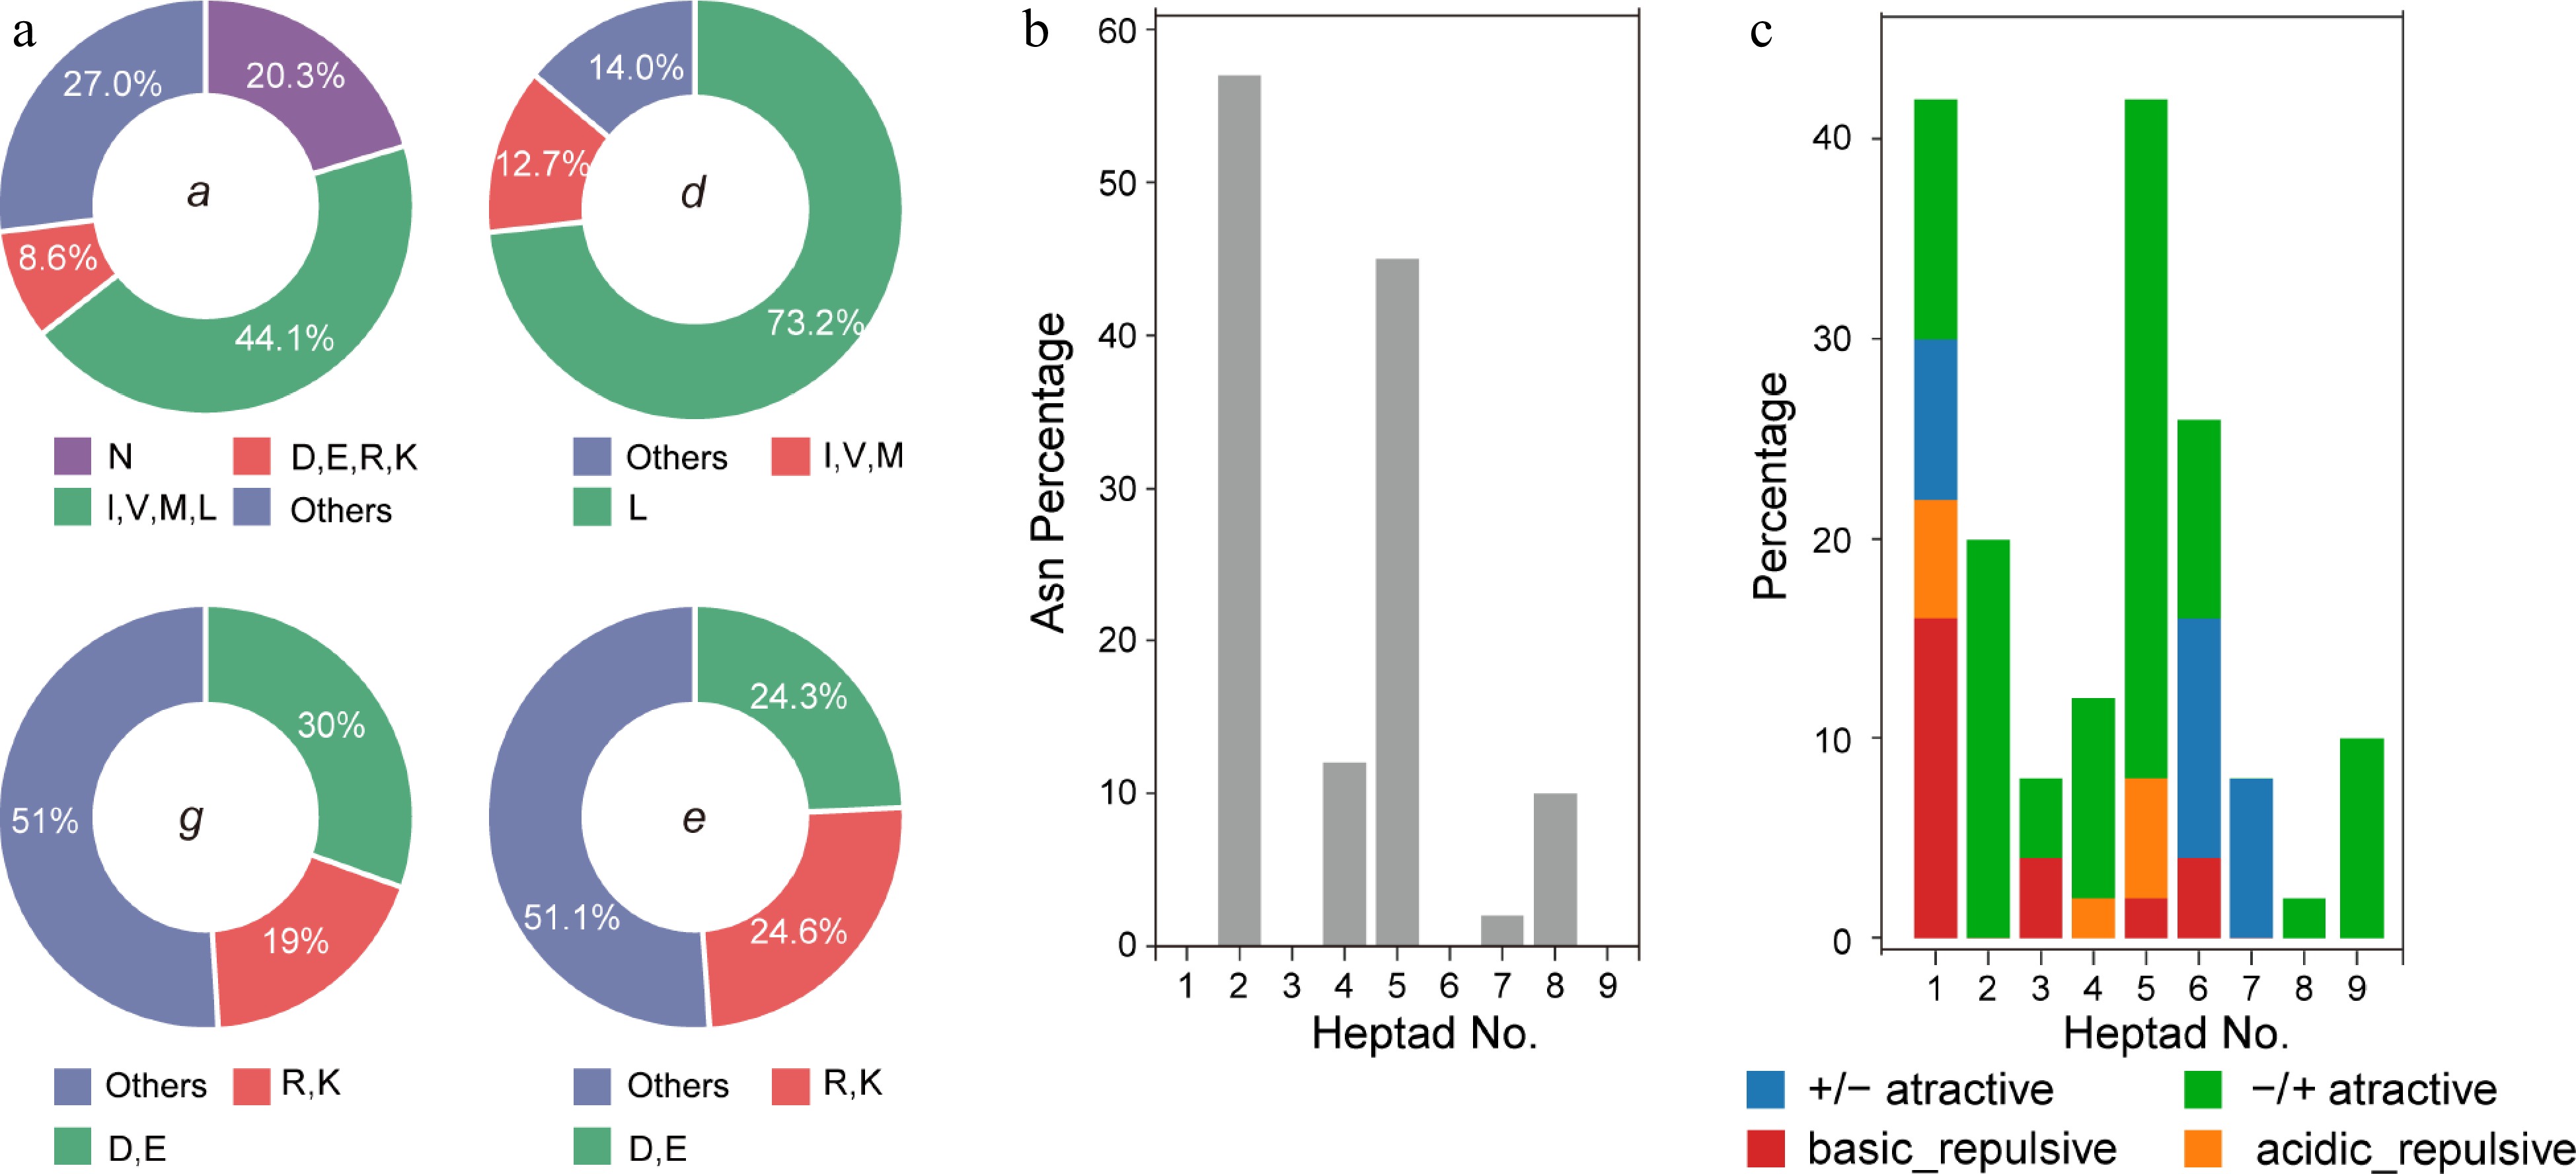
Figure 5.
(a) Pie chart presenting the frequency of amino acids in all the g, e, a and d positions in bZIPs, (b) histogram of the frequency of Asn residual at the a position, (c) attractive or repulsive g and e' pairs per heptad for R. occidentalis.
-
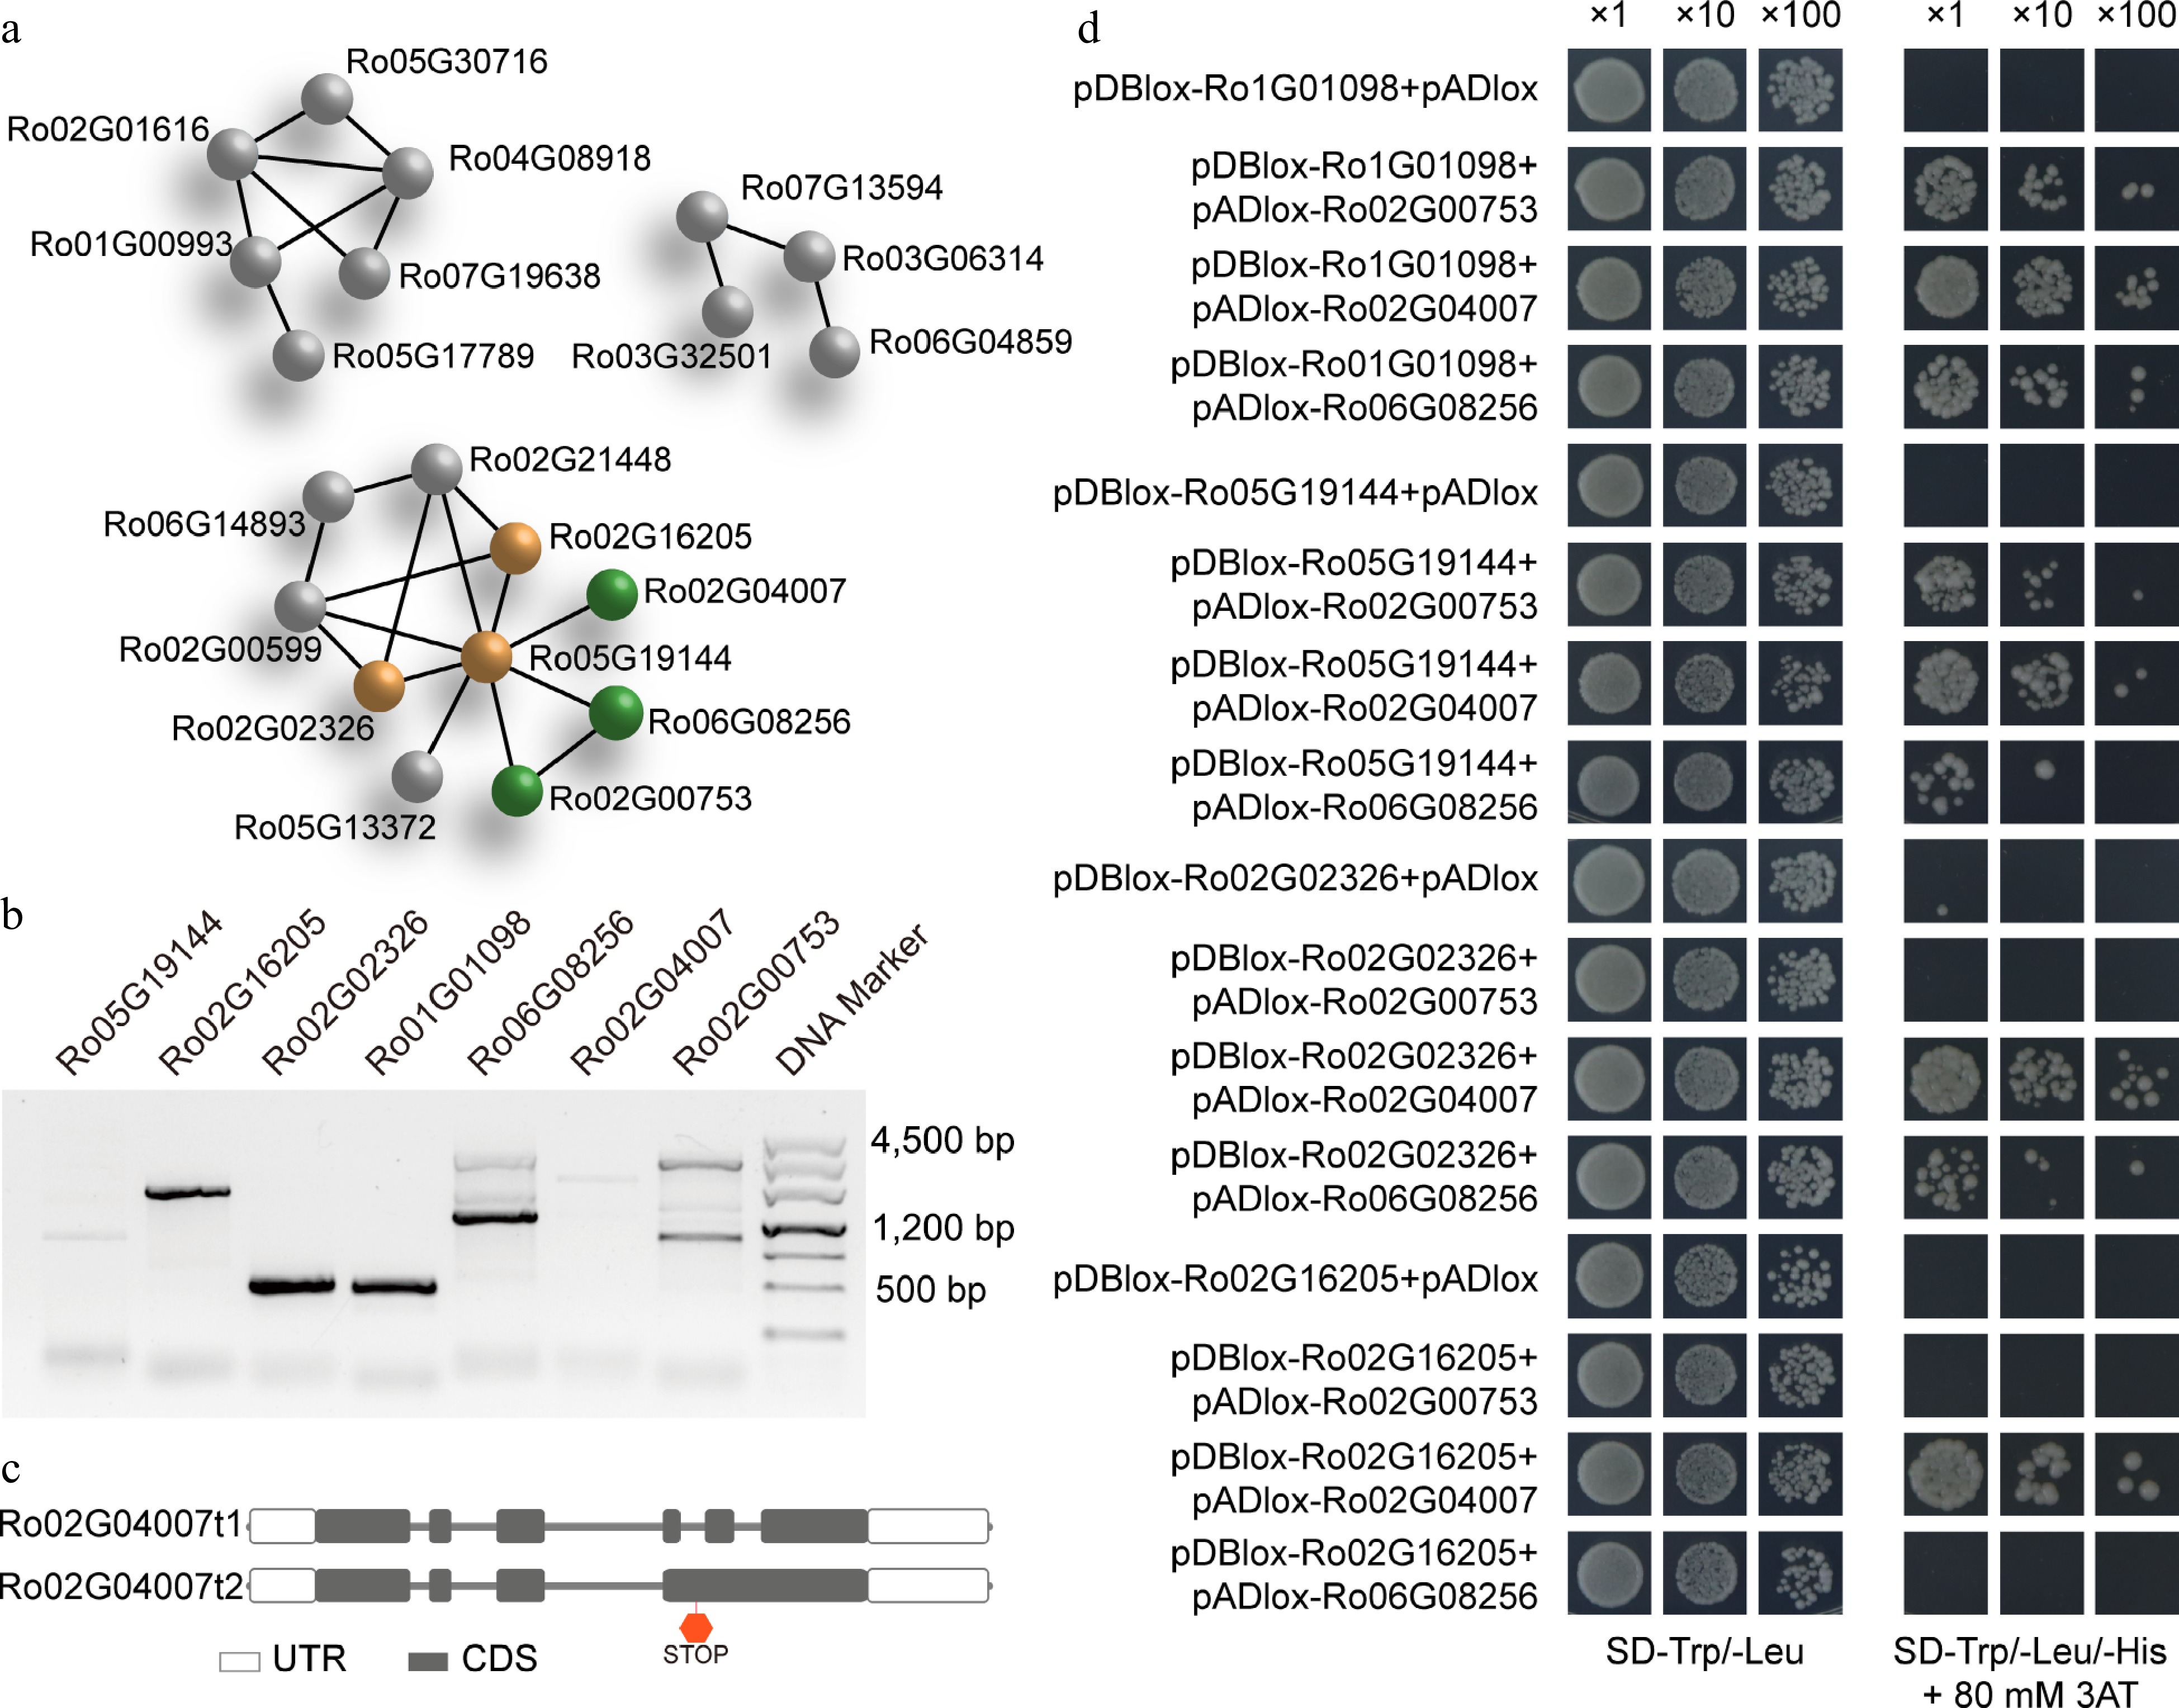
Figure 6.
Protein-protein network prediction, PCR amplification, and interaction validation for the C/S1 group R. occidentalis bZIP members using yeast two-hybrid analysis. PPI network prediction of all RobZIPs was conducted using the STRING PPI database. The S group members were colored in brown, and the C group members were colored in green. (a) Members of other groups are in gray. (b) PCR amplification of the four S1 and three C group RobZIP members and (c) two isoforms for the Ro02G04007 gene due to alternative splicing. Validation of the heterodimer interaction of the C/S1 RobZIPs using yeast two-hybrid system.
Figures
(6)
Tables
(0)