-
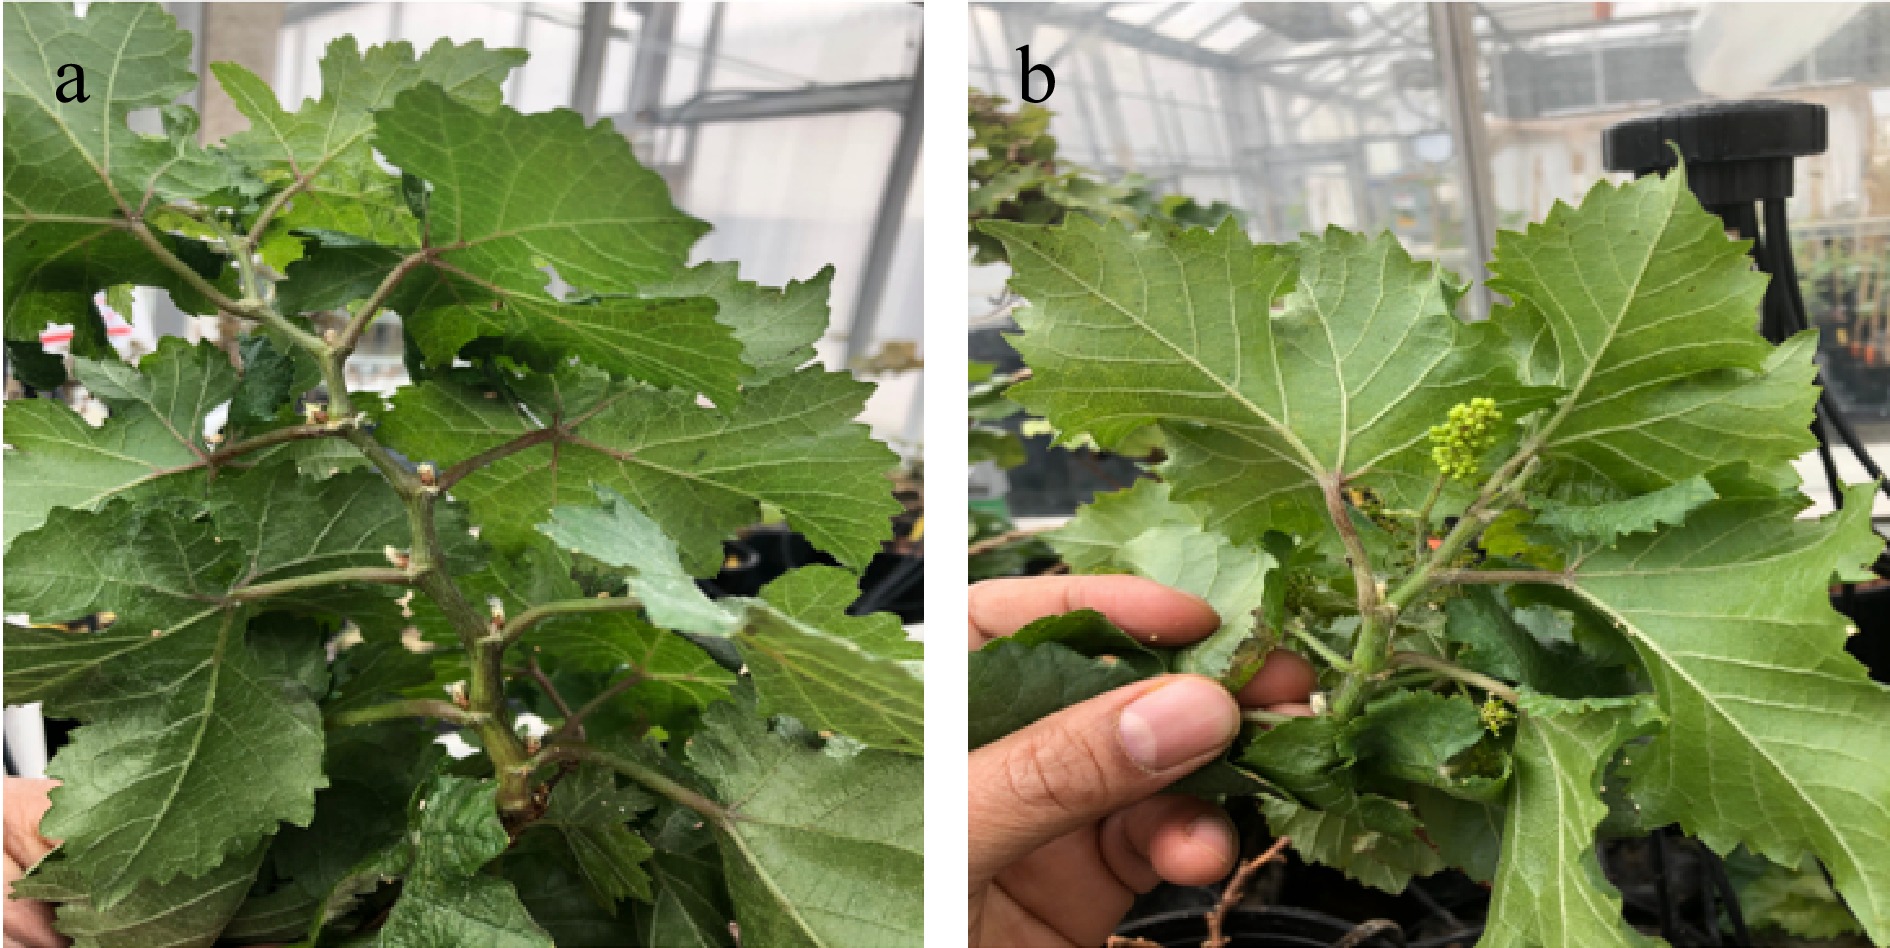
Figure 1.
Pixie shoot trait characteristics. (a) Pixie shows a monopodial growth, producing few, if any, lateral branches from the axillary buds. (b) Pixie has a precocious flowering habit, producing inflorescences and bunches starting in the first year of its growth, and even in the younger/upper portion of its main branch.
-
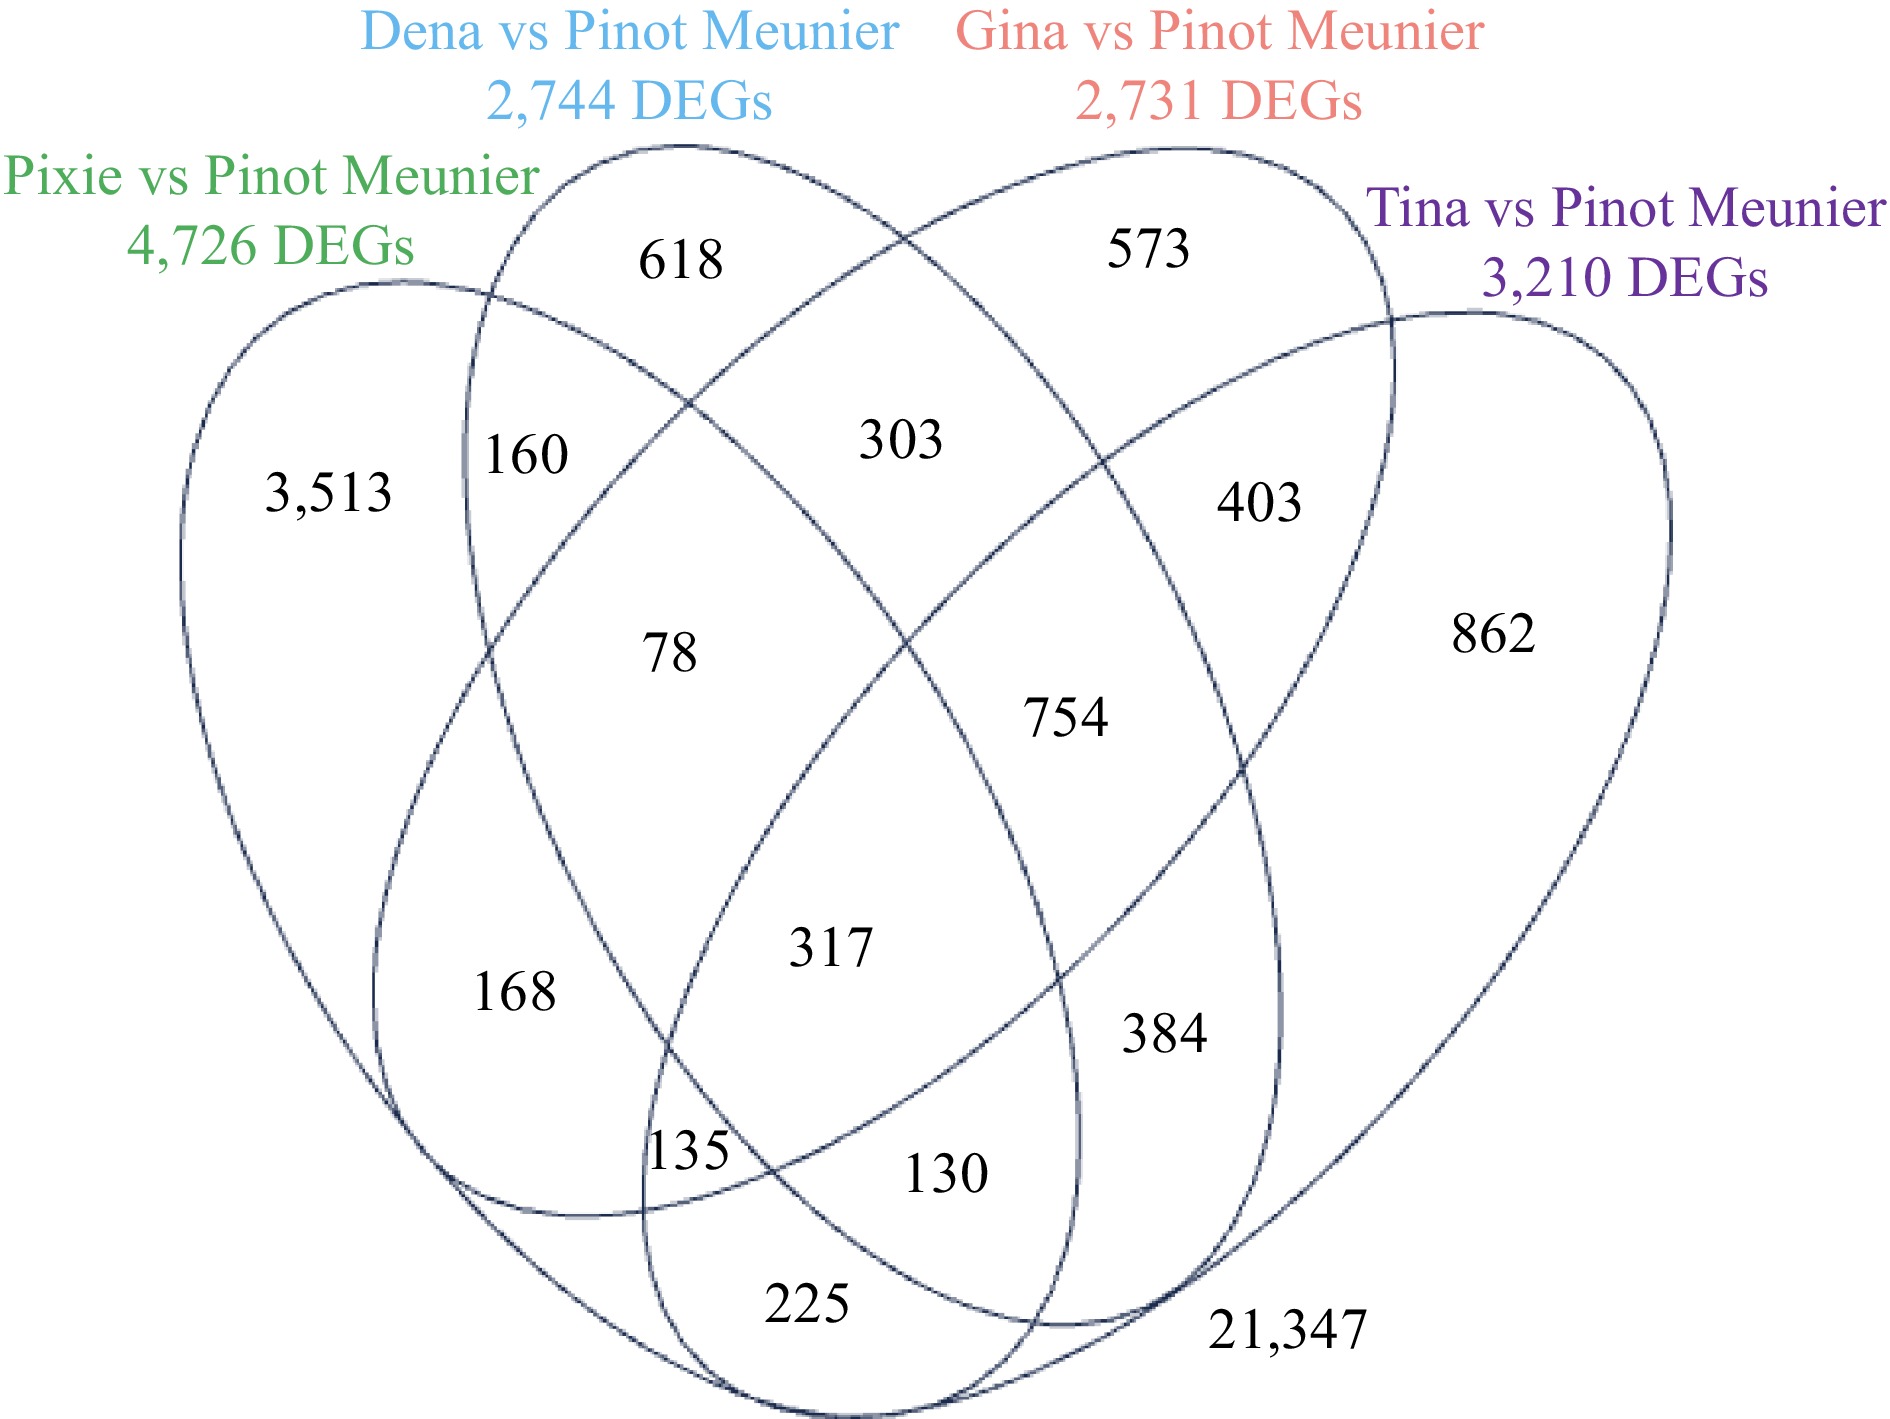
Figure 2.
A Venna diagram showing the overlaps of DEGs in 'Pixie', 'Dena', 'Gina' and 'Tia' each compared to the WT 'Pinot Meunier'. FDR ≤ 0.05.
-
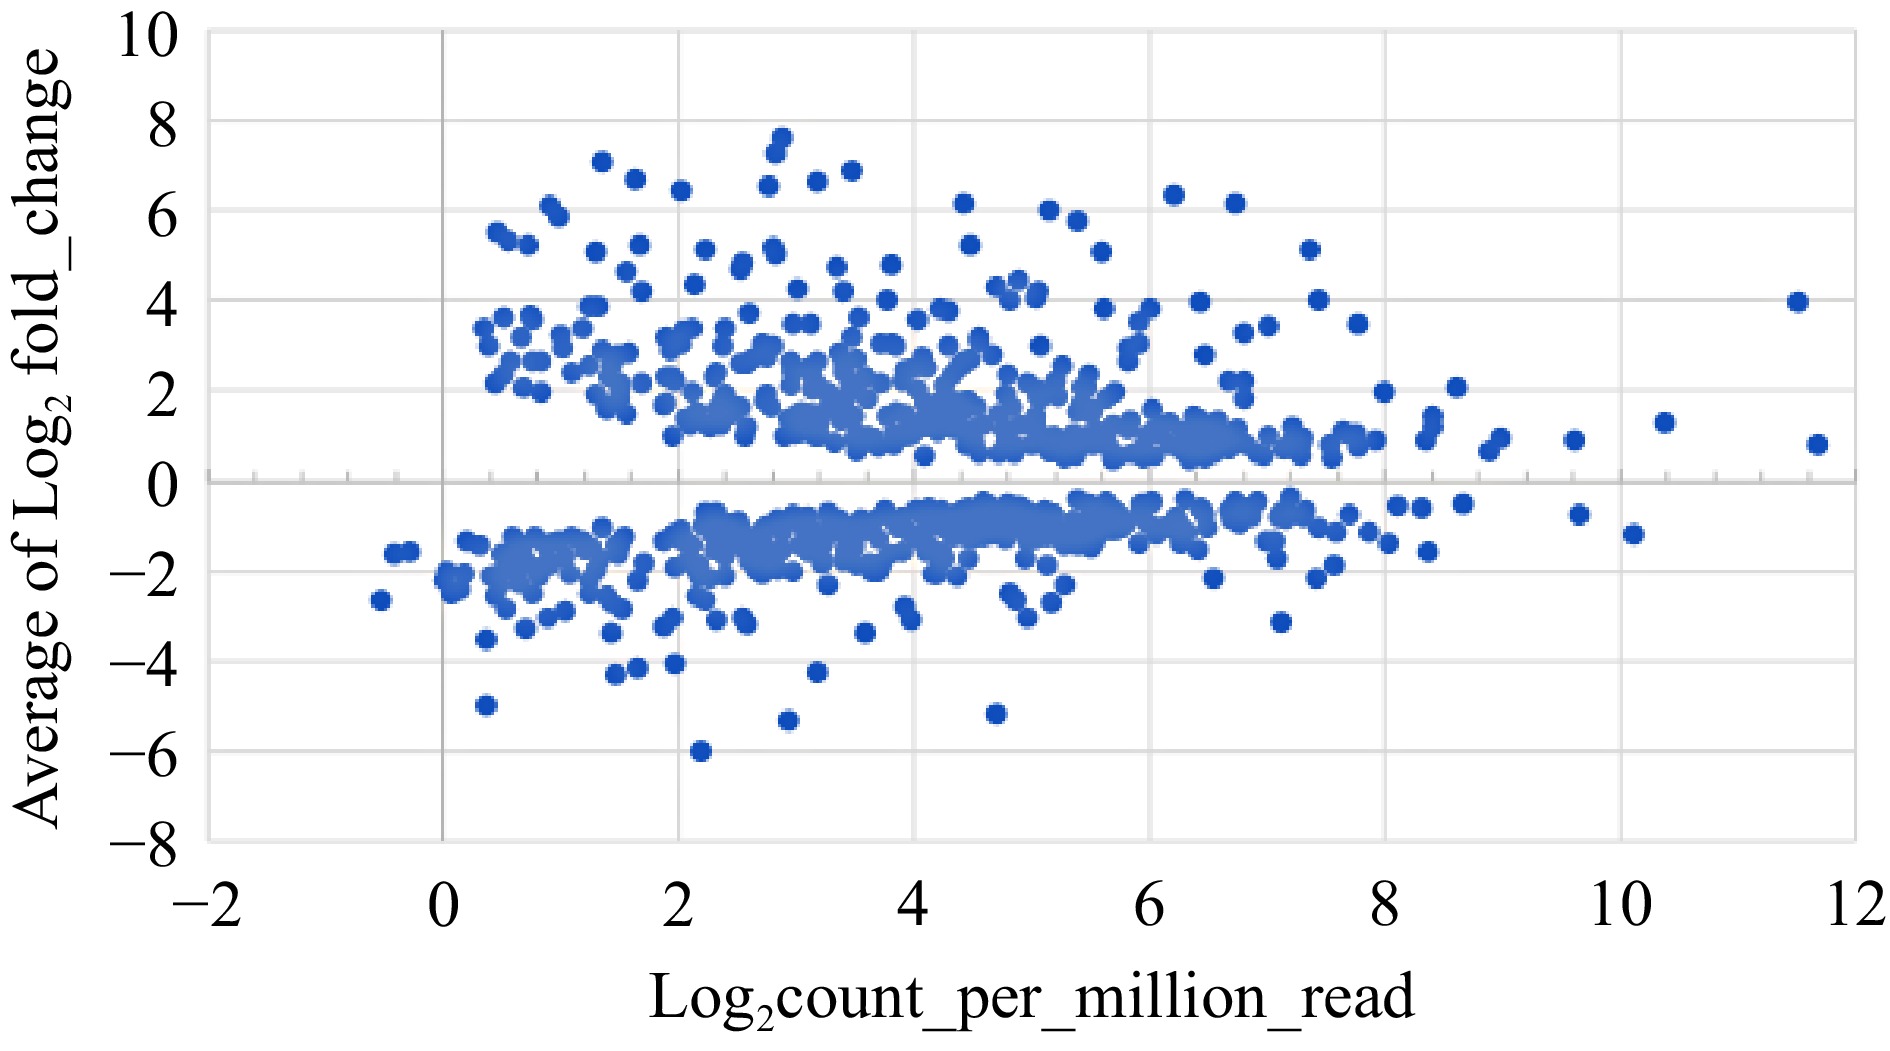
Figure 3.
Expression profiles of 723 DEGs that were consistently up-regulated or down-regulated in terms of average fold changes vs average expression levels.
-
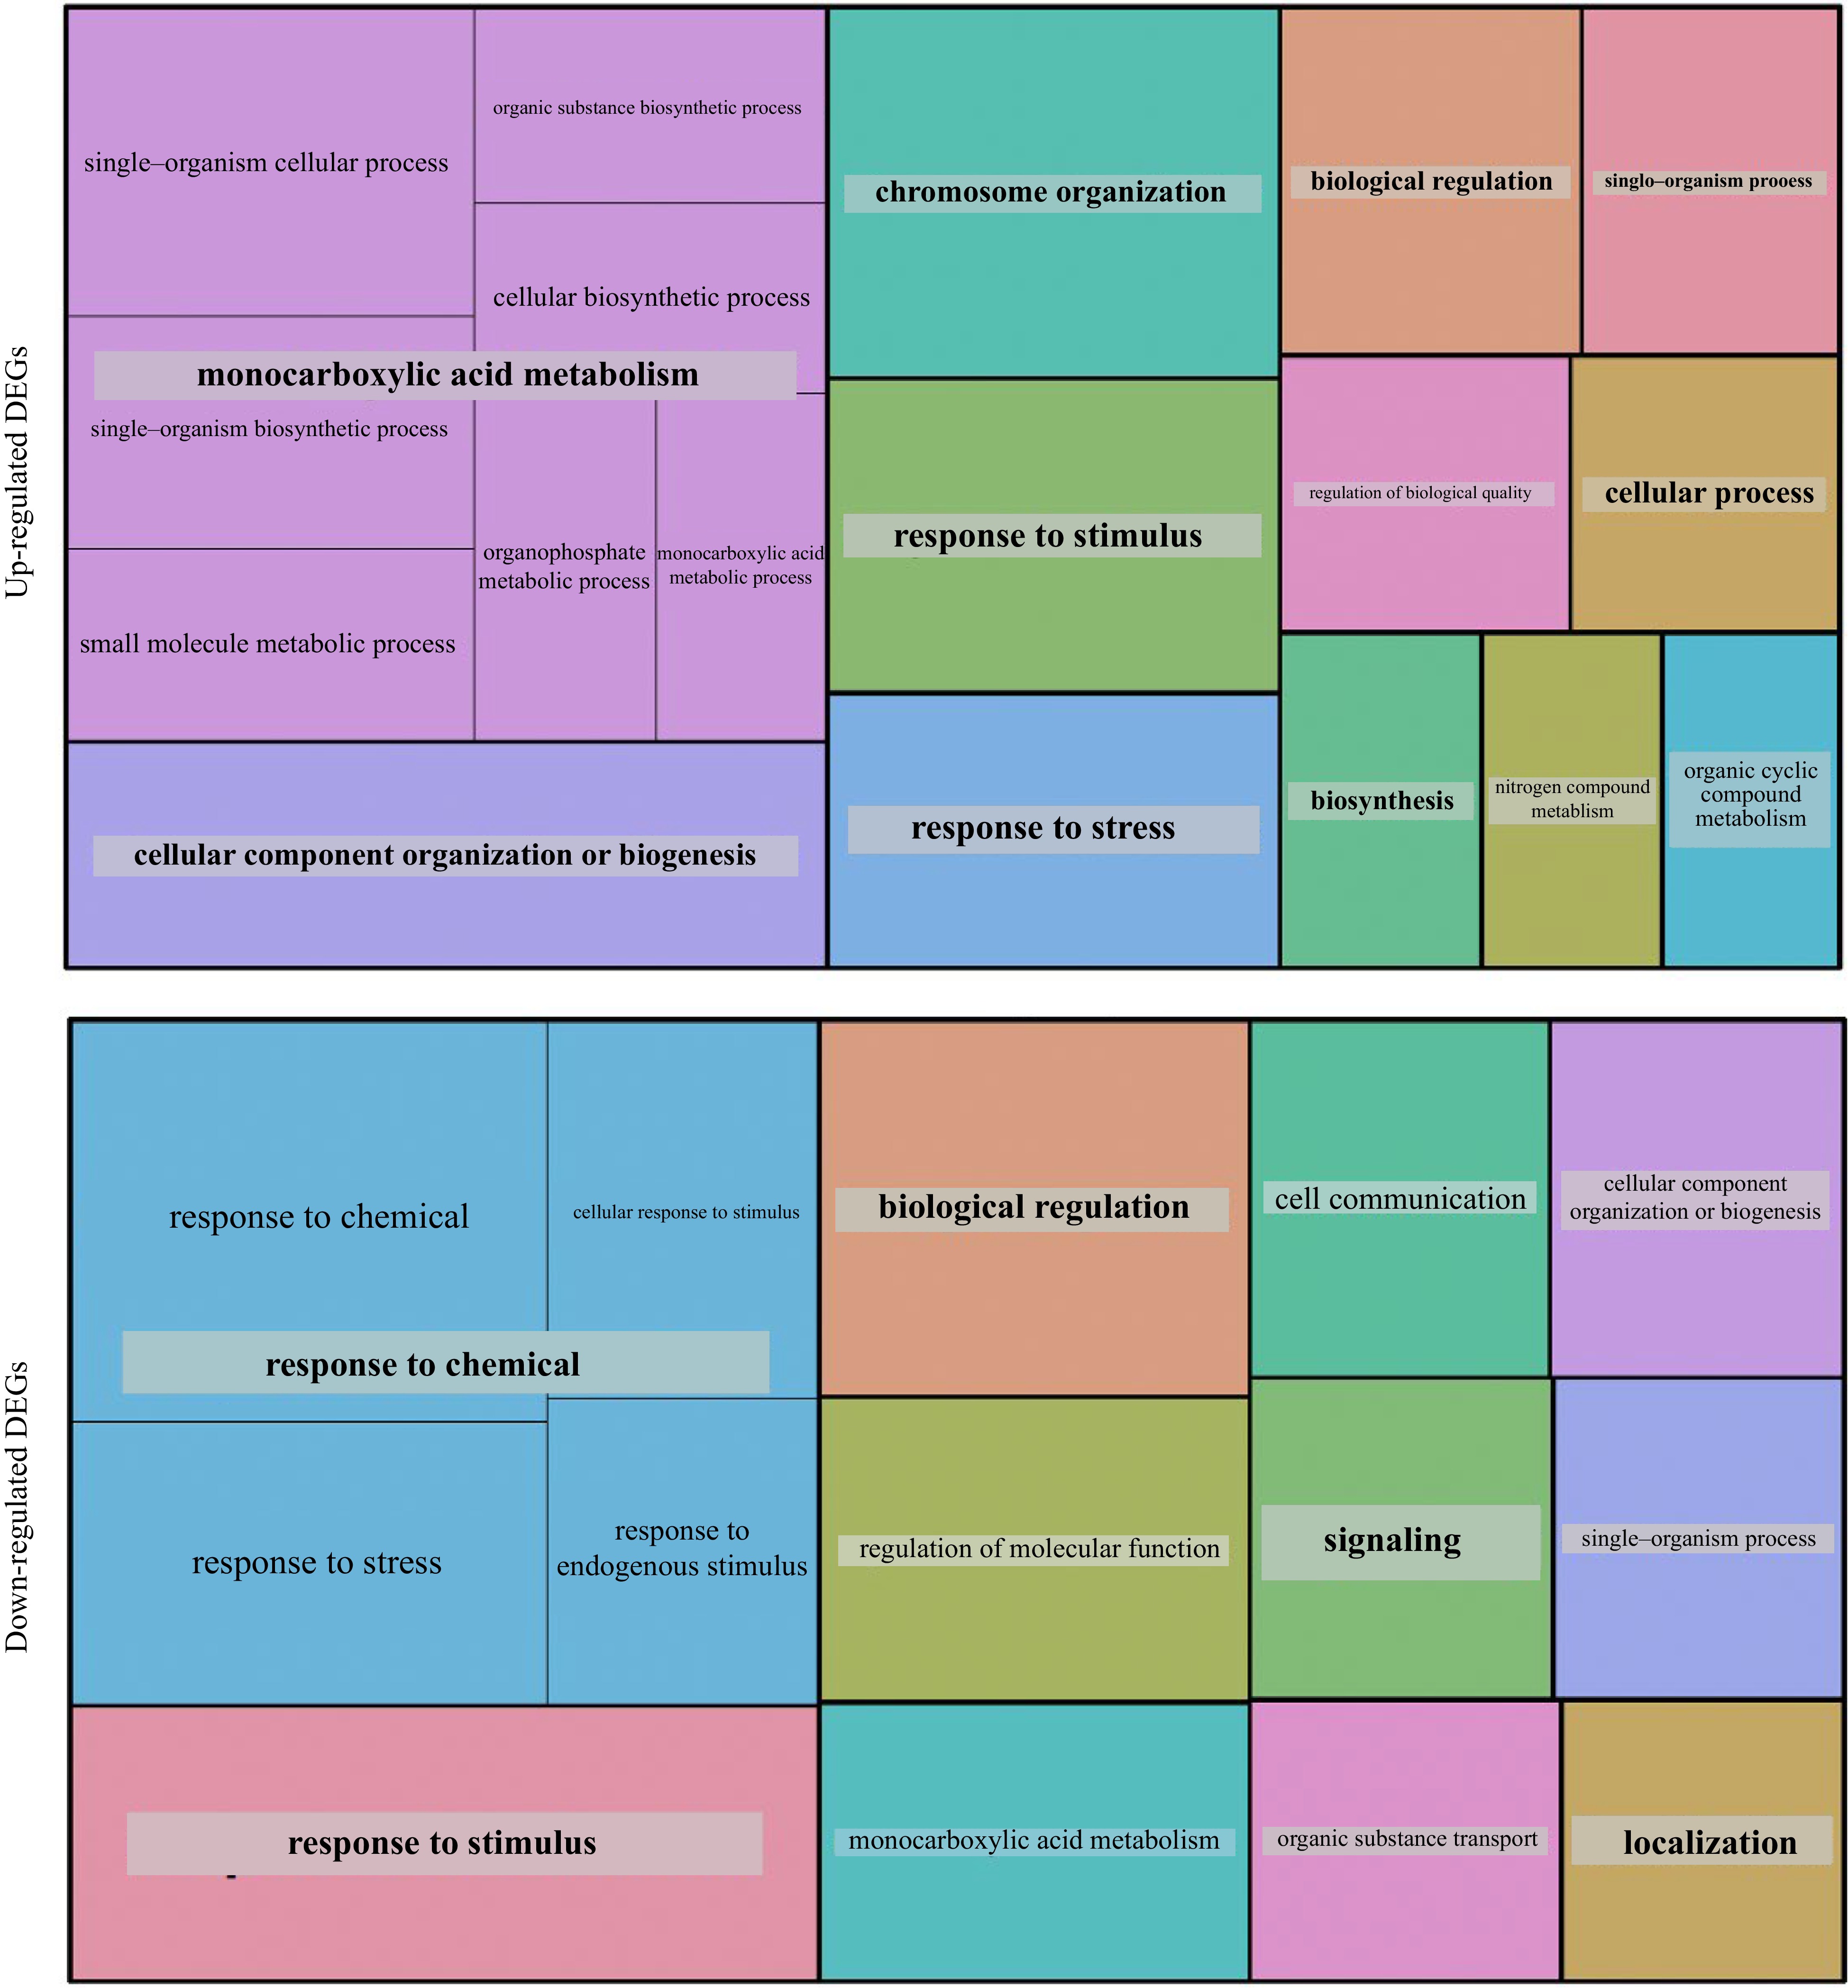
Figure 4.
GO analysis of the 373 up-regulated and 350 down-regulated DEGs observed in the mutants.
-

Figure 5.
Notable expression of GA pathway genes in the L1 dwarf mutants. (a) Normalized transcript levels (counts per million, CPM) derived from aligned reads from three biological replicates for WT and dwarf mutants of genes involved in GA biosynthesis, including GA5 (GA20ox) with eight members and GA4 (GA3ox) with three members, and GA signal transduction, featuring GID and DELLA homologs. (b) Relative expression changes of GA deactivation genes, log2 fold change scale as calculated using edgeR at significance threshold set at FDR ≤ 0.05. The graph shows the average log2 fold change for three biological replicates between WT and the dwarf mutants. *: statistical significance at p ≤ 0.05.
-
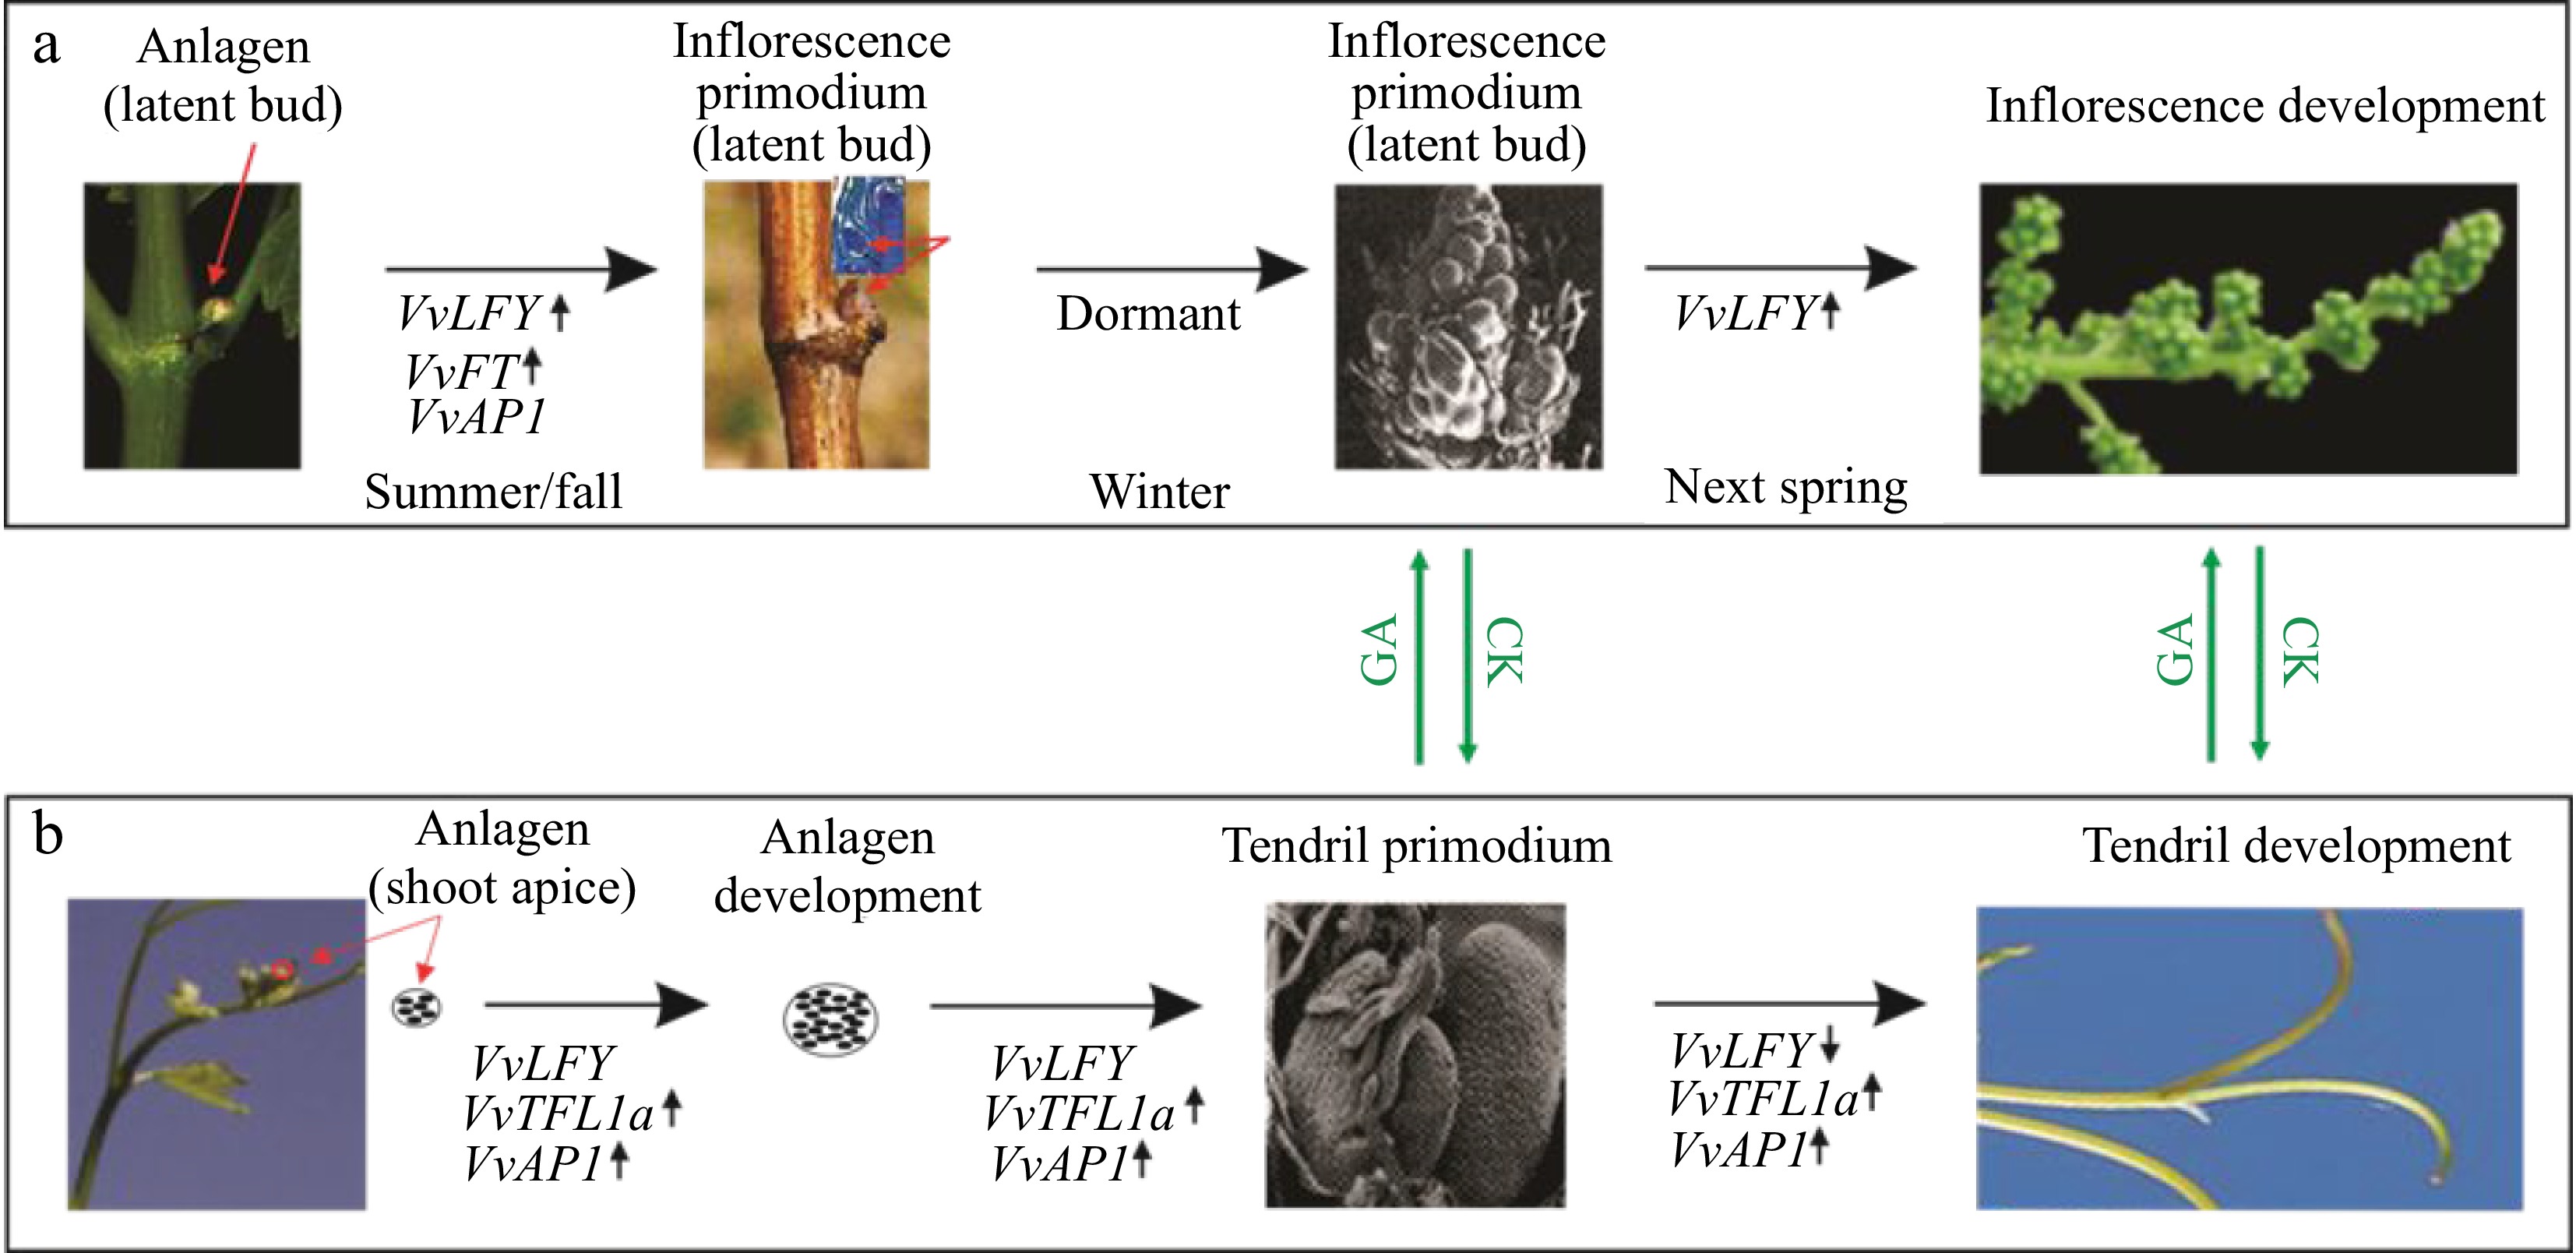
Figure 6.
A schematic illustration of the possible opposing roles of VvAP1 and VvLFY in regulating the developmental fate of anlagens in grapevine. (a) At the anlagen-to-inflorescence transition, the lateral primordial meristem gives rise to the latent bud in the leaf axil, which contains the shoot apical meristem (SAM), leaf primordium, and uncommitted anlagen. Expression or upregulation of VvFT, VvAP1, and VvLFY is observed in this stage. The anlagen is then differentiated into an inflorescence primordium in late seasons and eventually develops into a mature inflorescence in the following spring. (b) The anlagen-to- tendril developmental course is associated with increased expression of VvAP1 and VvTFL1a. The shoot apex produces lateral anlagens with the expression or activation of VvAP1, VvLFY, and VvTFL1a. These anlagens are then destined to become tendril primordia, followed by the development of tendrils in current growing shoots. The ratio between VvLFY and VvAP1 likely controls the developmental route of the anlagens to either inflorescences or tendrils. It is noted that anlagens at any stage or derived primordia are sensitive to hormone regulation, with cytokine (CK) promoting inflorescences and GA favoring tendrils. The red arrows indicate the anlagen in either shoot apex or latent bud, or inflorescence primordium in the latent bud. Up or down arrows indicate the upregulation and downregulation, respectively.
-
Expression change No. of DEGs1 Up-regulated 373 Down-regulated 350 Total 723 1 ≥ 1.5-fold change, FDR ≤ 0.05 in at least three of the four mutants. Table 1.
Numbers of DEGs that were of consistent responses in the shoots of four Pixie mutant background.
-
GO terms Number UP-regulated DEGs Response to abiotic stimulus 27 Regulation of cell size 3 Down-regulated DEGs Anatomical structure development 16 Reproduction 11 Response to stimulus 36 Biological regulation 46 Transport 44 Establishment of localization 44 Localization 44 Cellular metabolic process 112 Table 2.
Enriched GO terms among the 373 up-regulated and 350 down-regulated DEGs observed in the mutants.
-
Gene name Pathway Grapevine gene
ID ver 2Grapevine gene
ID ver 3Arabidopsis gene ID Average folds of changes between mutants and WT Average expression across all libraries VvFT Meristem identity VIT_00s0203g00080 − AT1G65480 2.71 0.26 ± 0.18 VvTFL1 VIT_06s0080g00290 − AT2G27550 (−2.81) * 1.38 ± 0.88 VvLFY VIT_08s0007g04200 − AT5G61850 2.22 18.18 ± 8.99 VvTFL1B FT gene family VIT_08s0007g03450 − AT5G03840 1.77 1.05 ± 0.54 VvTFL1C VIT_16s0100g00700 − 1.16 0.1 ± 0.18 VvMFT VIT_17s0000g02630 − AT1G18100 (−2.46) 0.08 ± 0.06 VvAP1 VIT_01s0011g00100 − AT1G69120 (−3.03) * 5.9 ± 4.45 VvCALa VIT_01s0010g03890 Vitvi01g01673 AT1G26310 (−1.47) 42.91 ± 18.08 VvCALb VIT_17s0000g04990 Vitvi17g00470 1.09 3.2 ± 1.23 VvFUL VIT_14s0083g01030 Vitvi14g01341 AT5G60910 (−1.56) 6.73 ± 3.53 VvLMI1 VIT_08s0007g04200 − AT5G03790 2.22 18.18 ± 8.99 VvWUS VIT_04s0023g03310 − AT2G17950 3.2 0.17 ± 0.19 VvFDa Vernalization VIT_00s0349g00050 − AT4G35900 2.45 2.89 ± 1.69 VvFDb VIT_18s0001g14890 Vitvi18g01165 (−1.13) 13.85 ± 1.95 VvFLC VIT_15s0048g01270 Vitvi15g00776 AT5G10140 1.14 3.16 ± 3.44 VvAGL24 Agamous / MADS MIKC gene family VIT_18s0001g07460 Vitvi18g00517 AT4G24540 1.34 38.16 ± 10.25 VvSVPa VIT_00s0313g00070 Vitvi07g01441 AT2G22540 (−1.01) 32.78 ± 8.94 VvSVPb VIT_03s0167g00070 − (−1.47) 28.24 ± 11 VvSVPc VIT_15s0107g00120 Vitvi15g00225 1.25 18.23 ± 4.9 VvSVPd VIT_18s0001g07460 Vitvi18g00517 1.34 38.16 ± 10.25 VvSOC1.1 VIT_15s0048g01250 − AT2G45660 (−1.38) 32.46 ± 9.71 VvSOC1.2 VIT_16s0022g02380 − AT2G45660 (−1.51) 8.7 ± 2.8 VvSOC1.3 VIT_15s0048g01240 − (−1.67) 74.18 ± 26.71 VvSPL3a SPL/ Ageing pathway VIT_04s0210g00170 Vitvi04g01556 AT2G33810 (−1.03) 60.11 ± 53.82 VvSPL3b VIT_10s0003g00050 Vitvi10g00481 (−1.14) 30.95 ± 7.85 VvSPL9 VIT_08s0007g06270 Vitvi08g01720 AT2G42200 1.01 136.75 ± 49.19 VvSPL4 VIT_12s0028g03350 Vitvi12g00280 (−1.11) 74.42 ± 31.95 VvSPL13 VIT_01s0010g03910 Vitvi01g01678 (−1.54) 48.51 ± 15.96 Vvlog5 Cytokinin VIT_06s0004g02680 − (−1.73) 22.17 ± 17.55 VvRR VIT_05s0077g01480 − 1.53 83.62 ± 20.74 VvARR12 VIT_11s0206g00060 − 1.26 21.69 ± 4.58 VvARR11 VIT_01s0010g02230 − 1.41 2.09 ± 1.71 VvARR2 VIT_02s0012g00570 − (−1.13) 152.22 ± 31.65 VvARR2b VIT_01s0011g05830 − 1.41 69.94 ± 13.7 VvARR12 VIT_04s0008g05900 − 1.37 23.28 ± 6.45 Vvyabby VIT_15s0048g00550 − 1.39 186.31 ± 79.49 * Significant at p ≤ 0.05. Table 3.
Differential regulation of key shoot and flower regulator genes with qRT-PCR rating for selected genes.
Figures
(6)
Tables
(3)