-
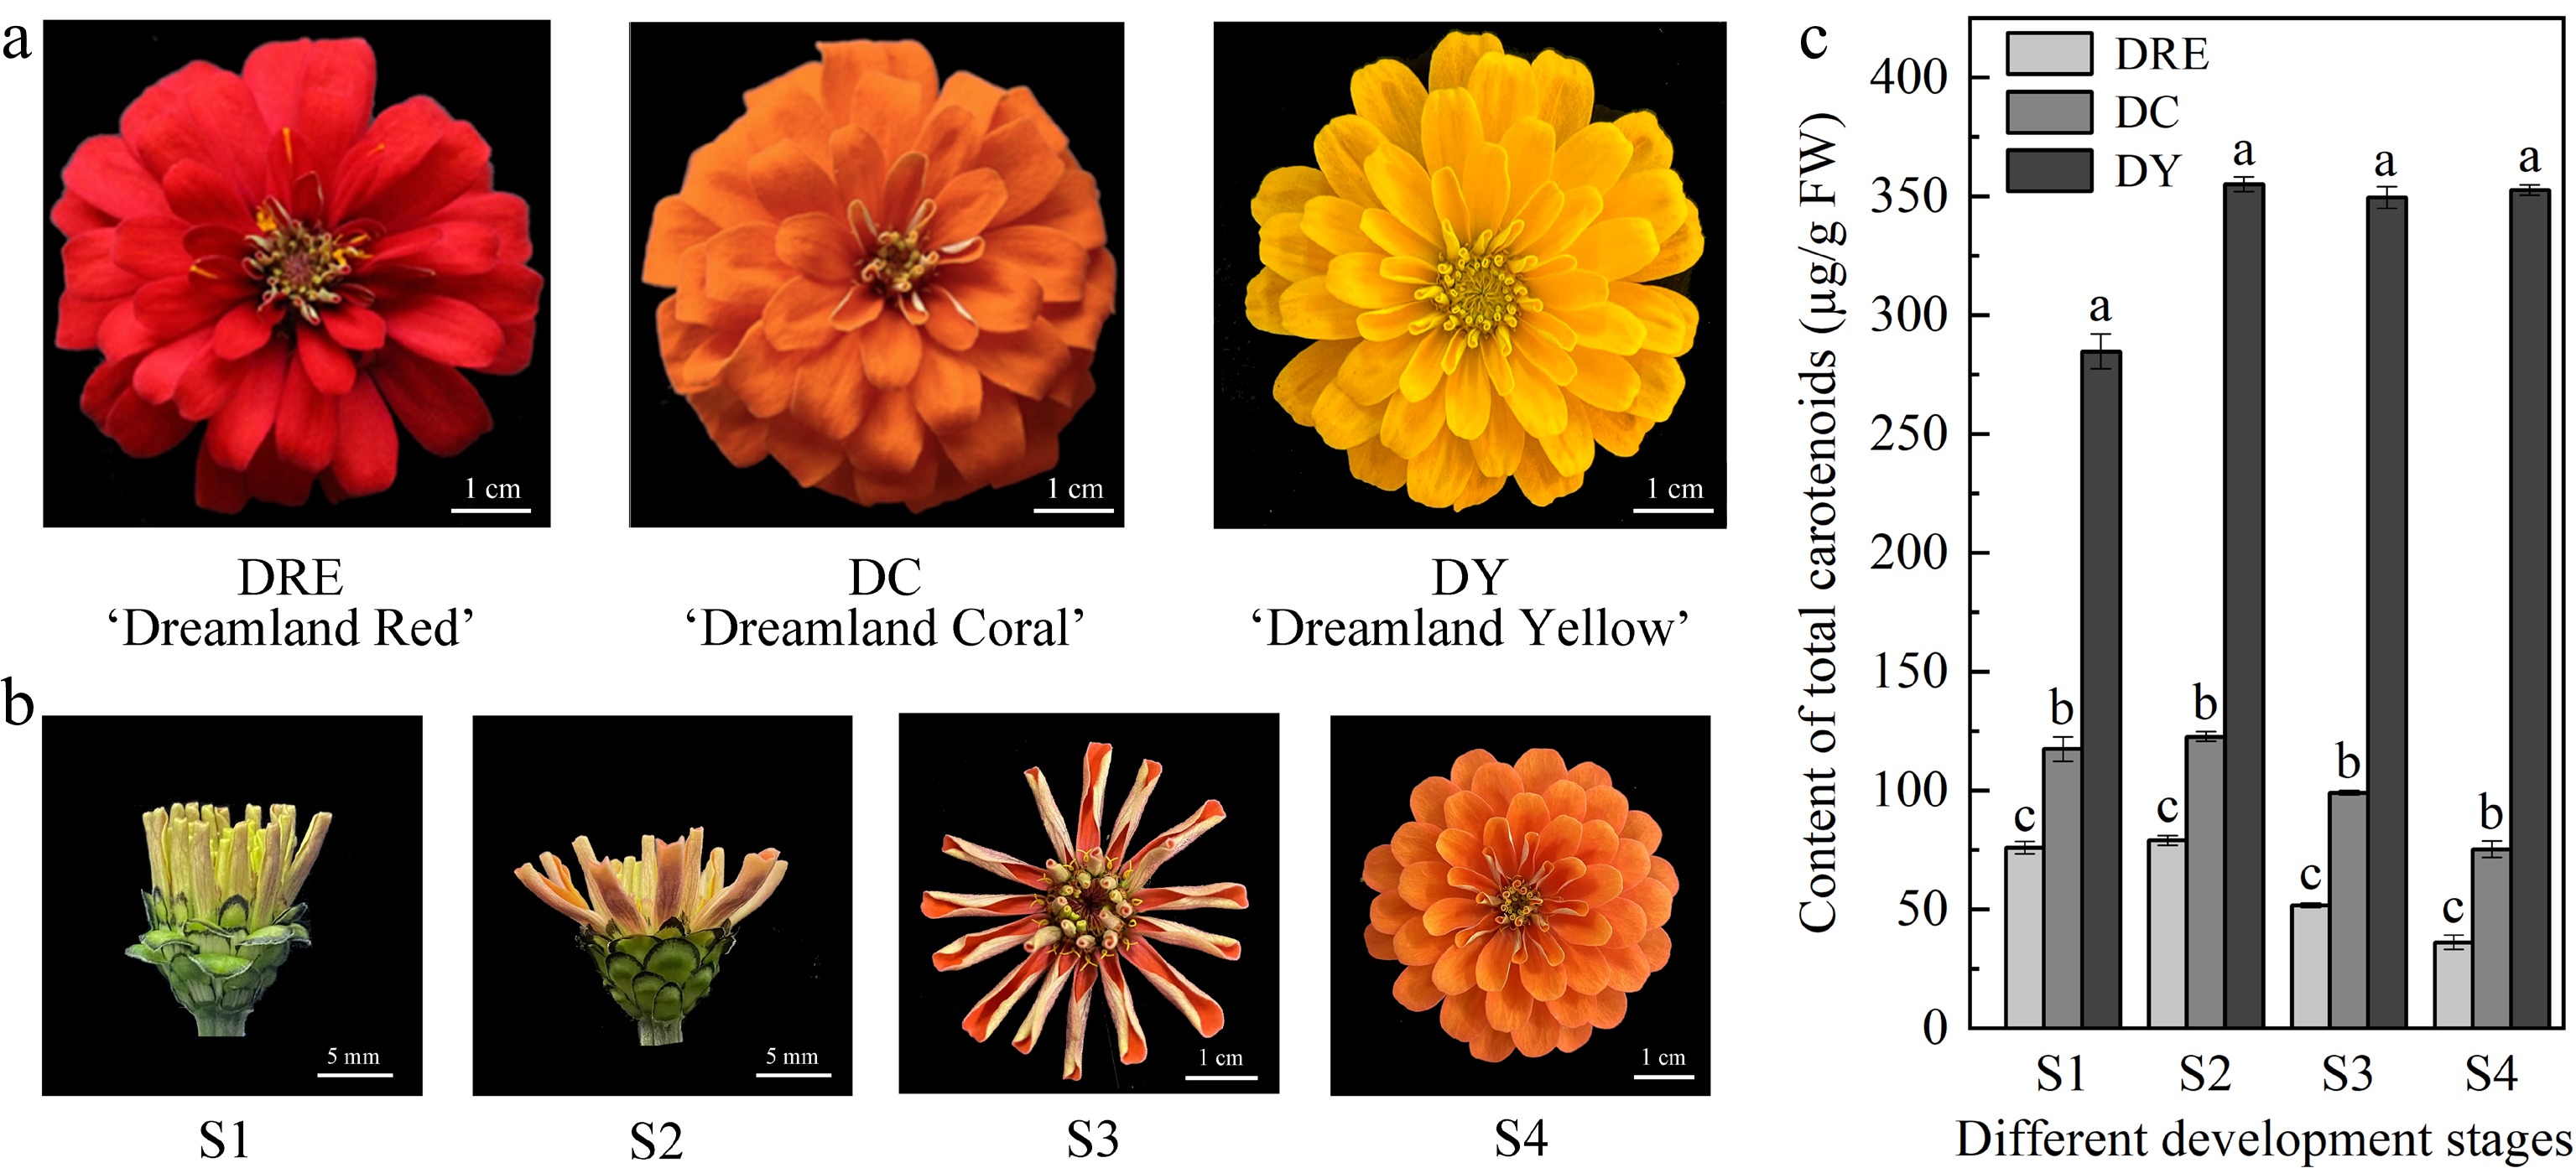
Figure 1.
The total carotenoid content in the petals of Zinnia elegans. (a) Picture of flowers from DRE, DC and DY, and at (b) different developmental stages. (c) Total carotenoid content in petals from three cultivars and different developmental stages. These are mean ± standard errors, three biological replicates. Different letters indicate significant differences in the one-way ANOVA Duncan test, p < 0.05.
-
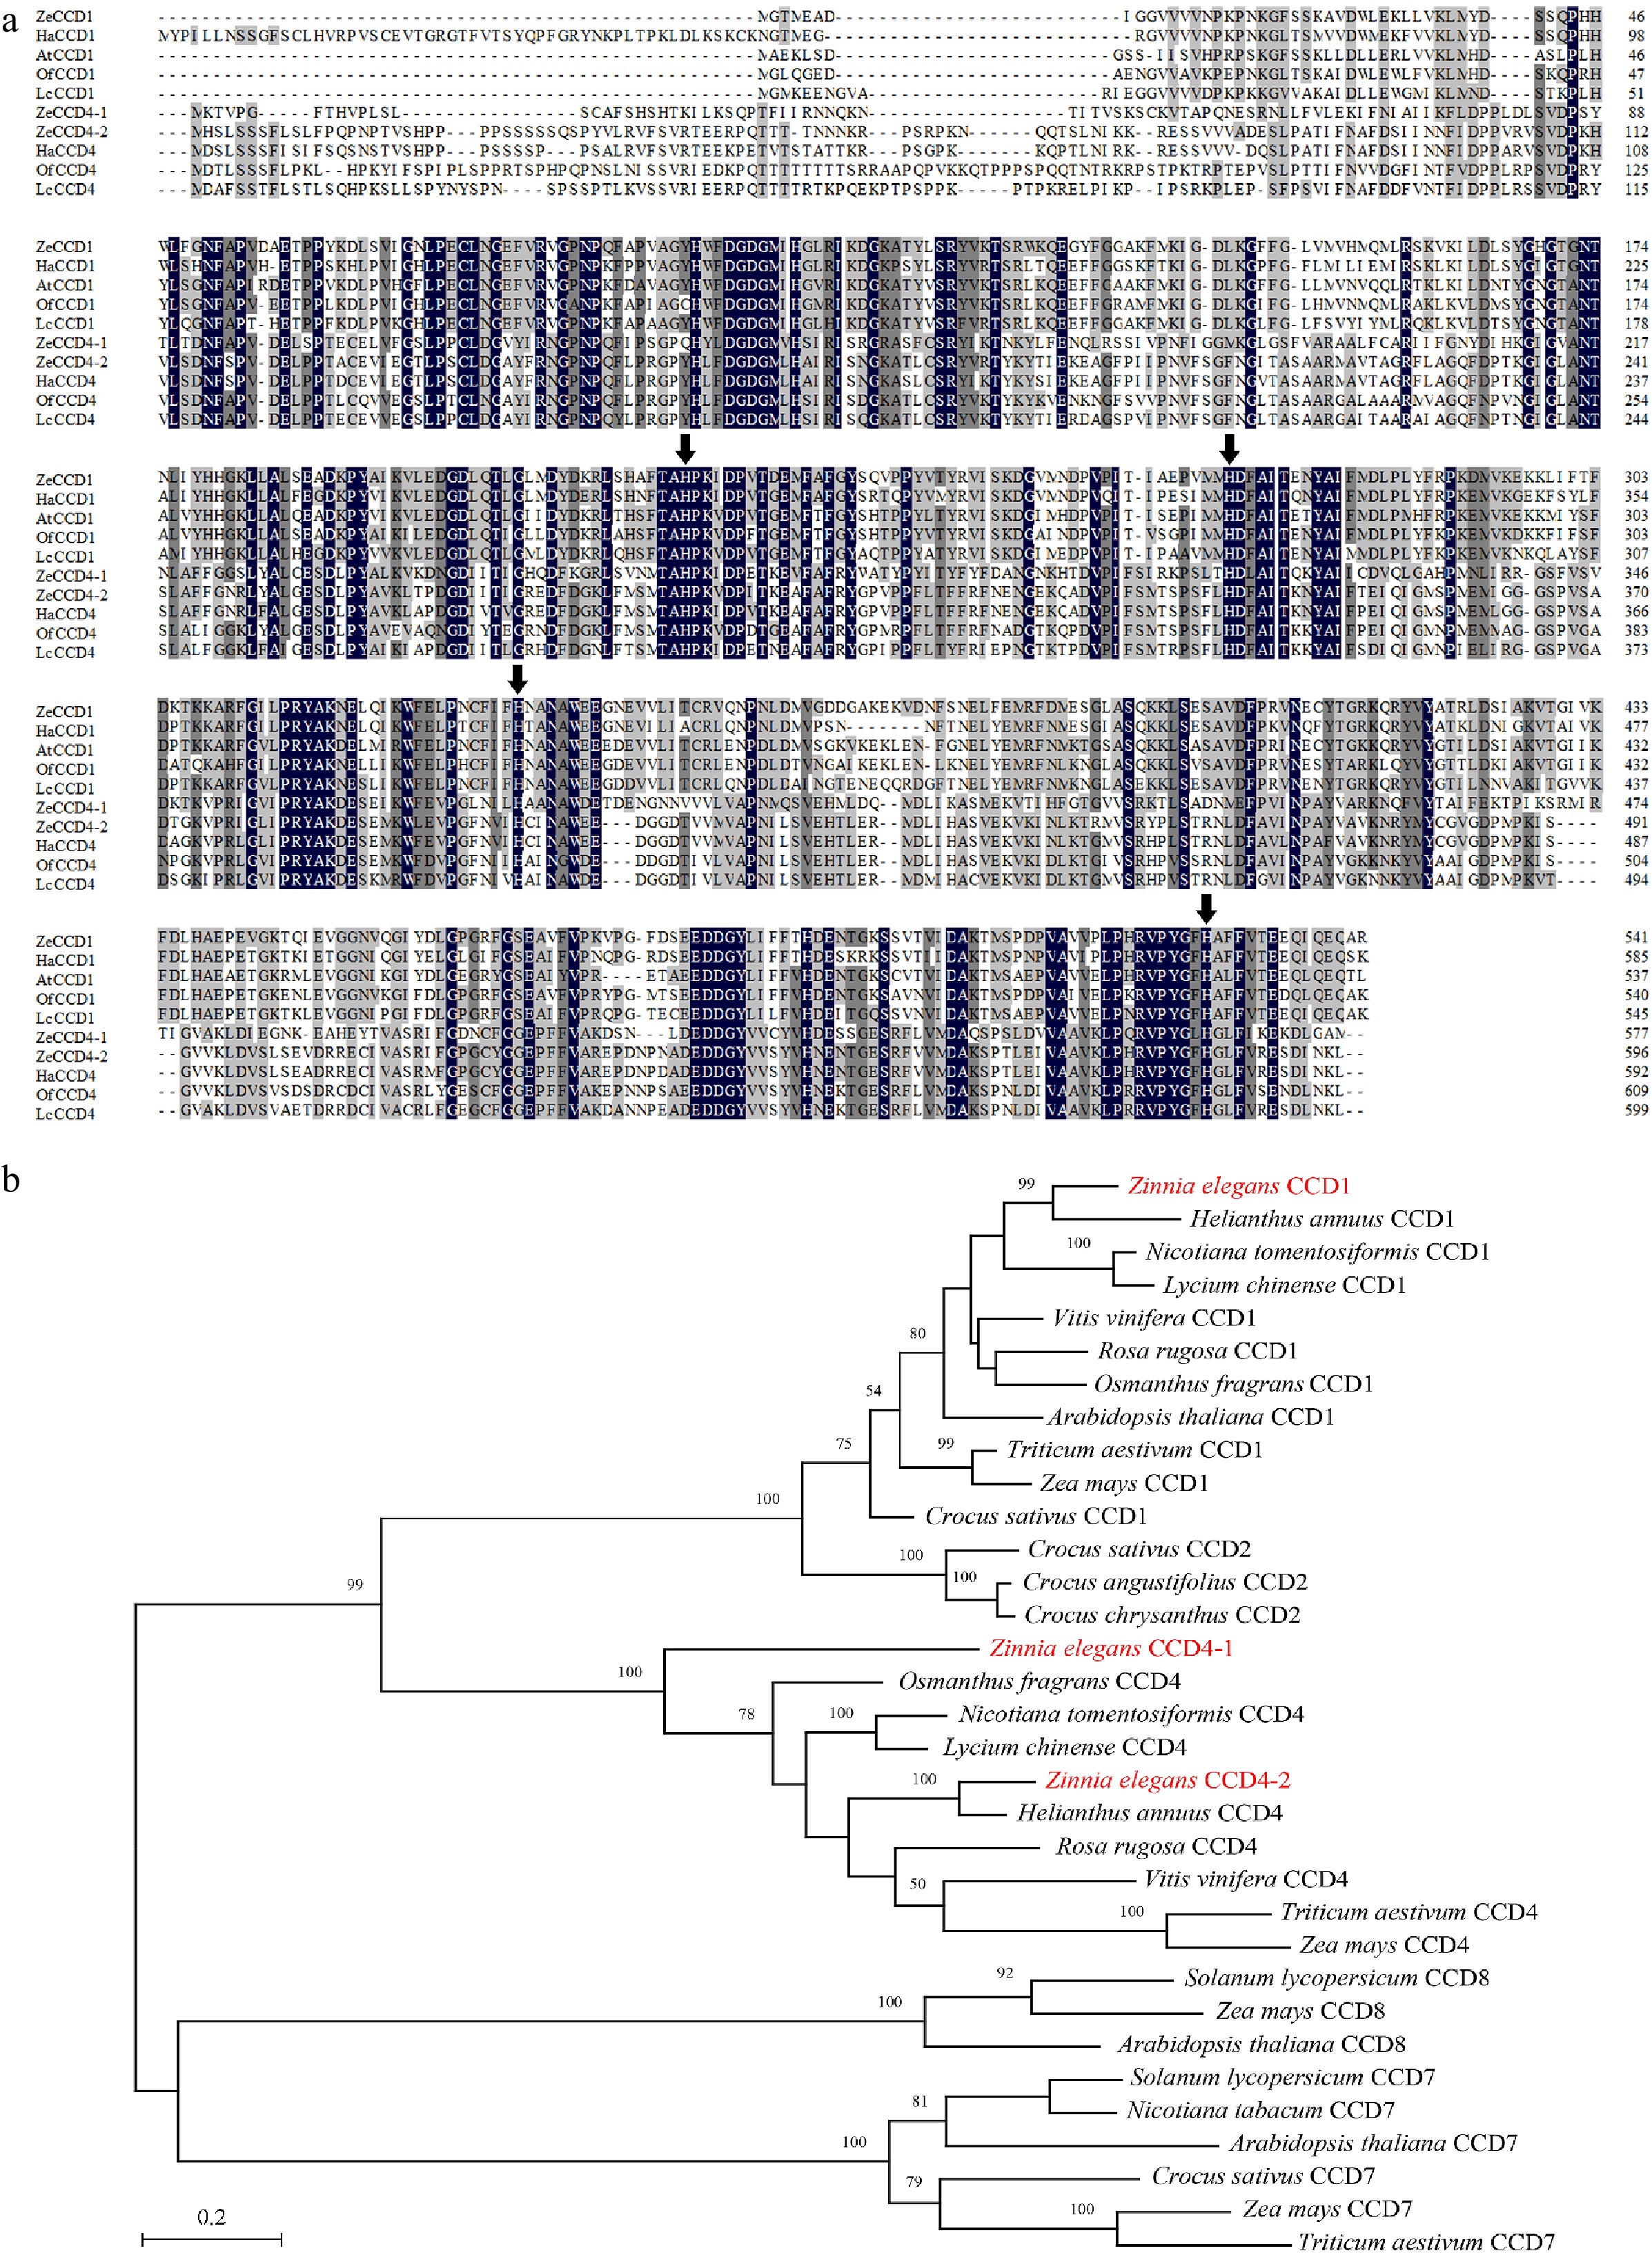
Figure 2.
Sequence alignment and phylogenetic analysis of CCDs proteins. (a) Alignment of the deduced amino acid sequences of CCDs homologs. Black represents the 100% homology level of the sequence, dark gray represents the ≥ 75% homology level, and light gray represents the ≥ 50% homology level. The black arrow refers to the histidine residue that binds to the Fe2+ cofactor. Sequences of functionally characterized HaCCD1 (XP_022018126.2) and HaCCD4 (CTP93722.1) from Helianthus annuus, OfCCD1 (AXQ60417.1) and OfCCD4 (ABY60887.1) from Osmanthus fragrans, LcCCD1 (AIY62758.1) and LcCCD4 (AIY62809.1) from Lycium chinense, AtCCD1 (NP_191911.1) from Arabidopsis thaliana. (b) Phylogenetic analysis of CCDs homologs from Zinnia elegans and other species (see Supplemental Table S2 for their GenBank accession numbers). The phylogenetic tree was built using MEGA X software with 500 bootstrap replicates based on the JTT matrix-based model (JTT). The scale bar represents the phylogenetic distance calculated based on the number of differences.
-
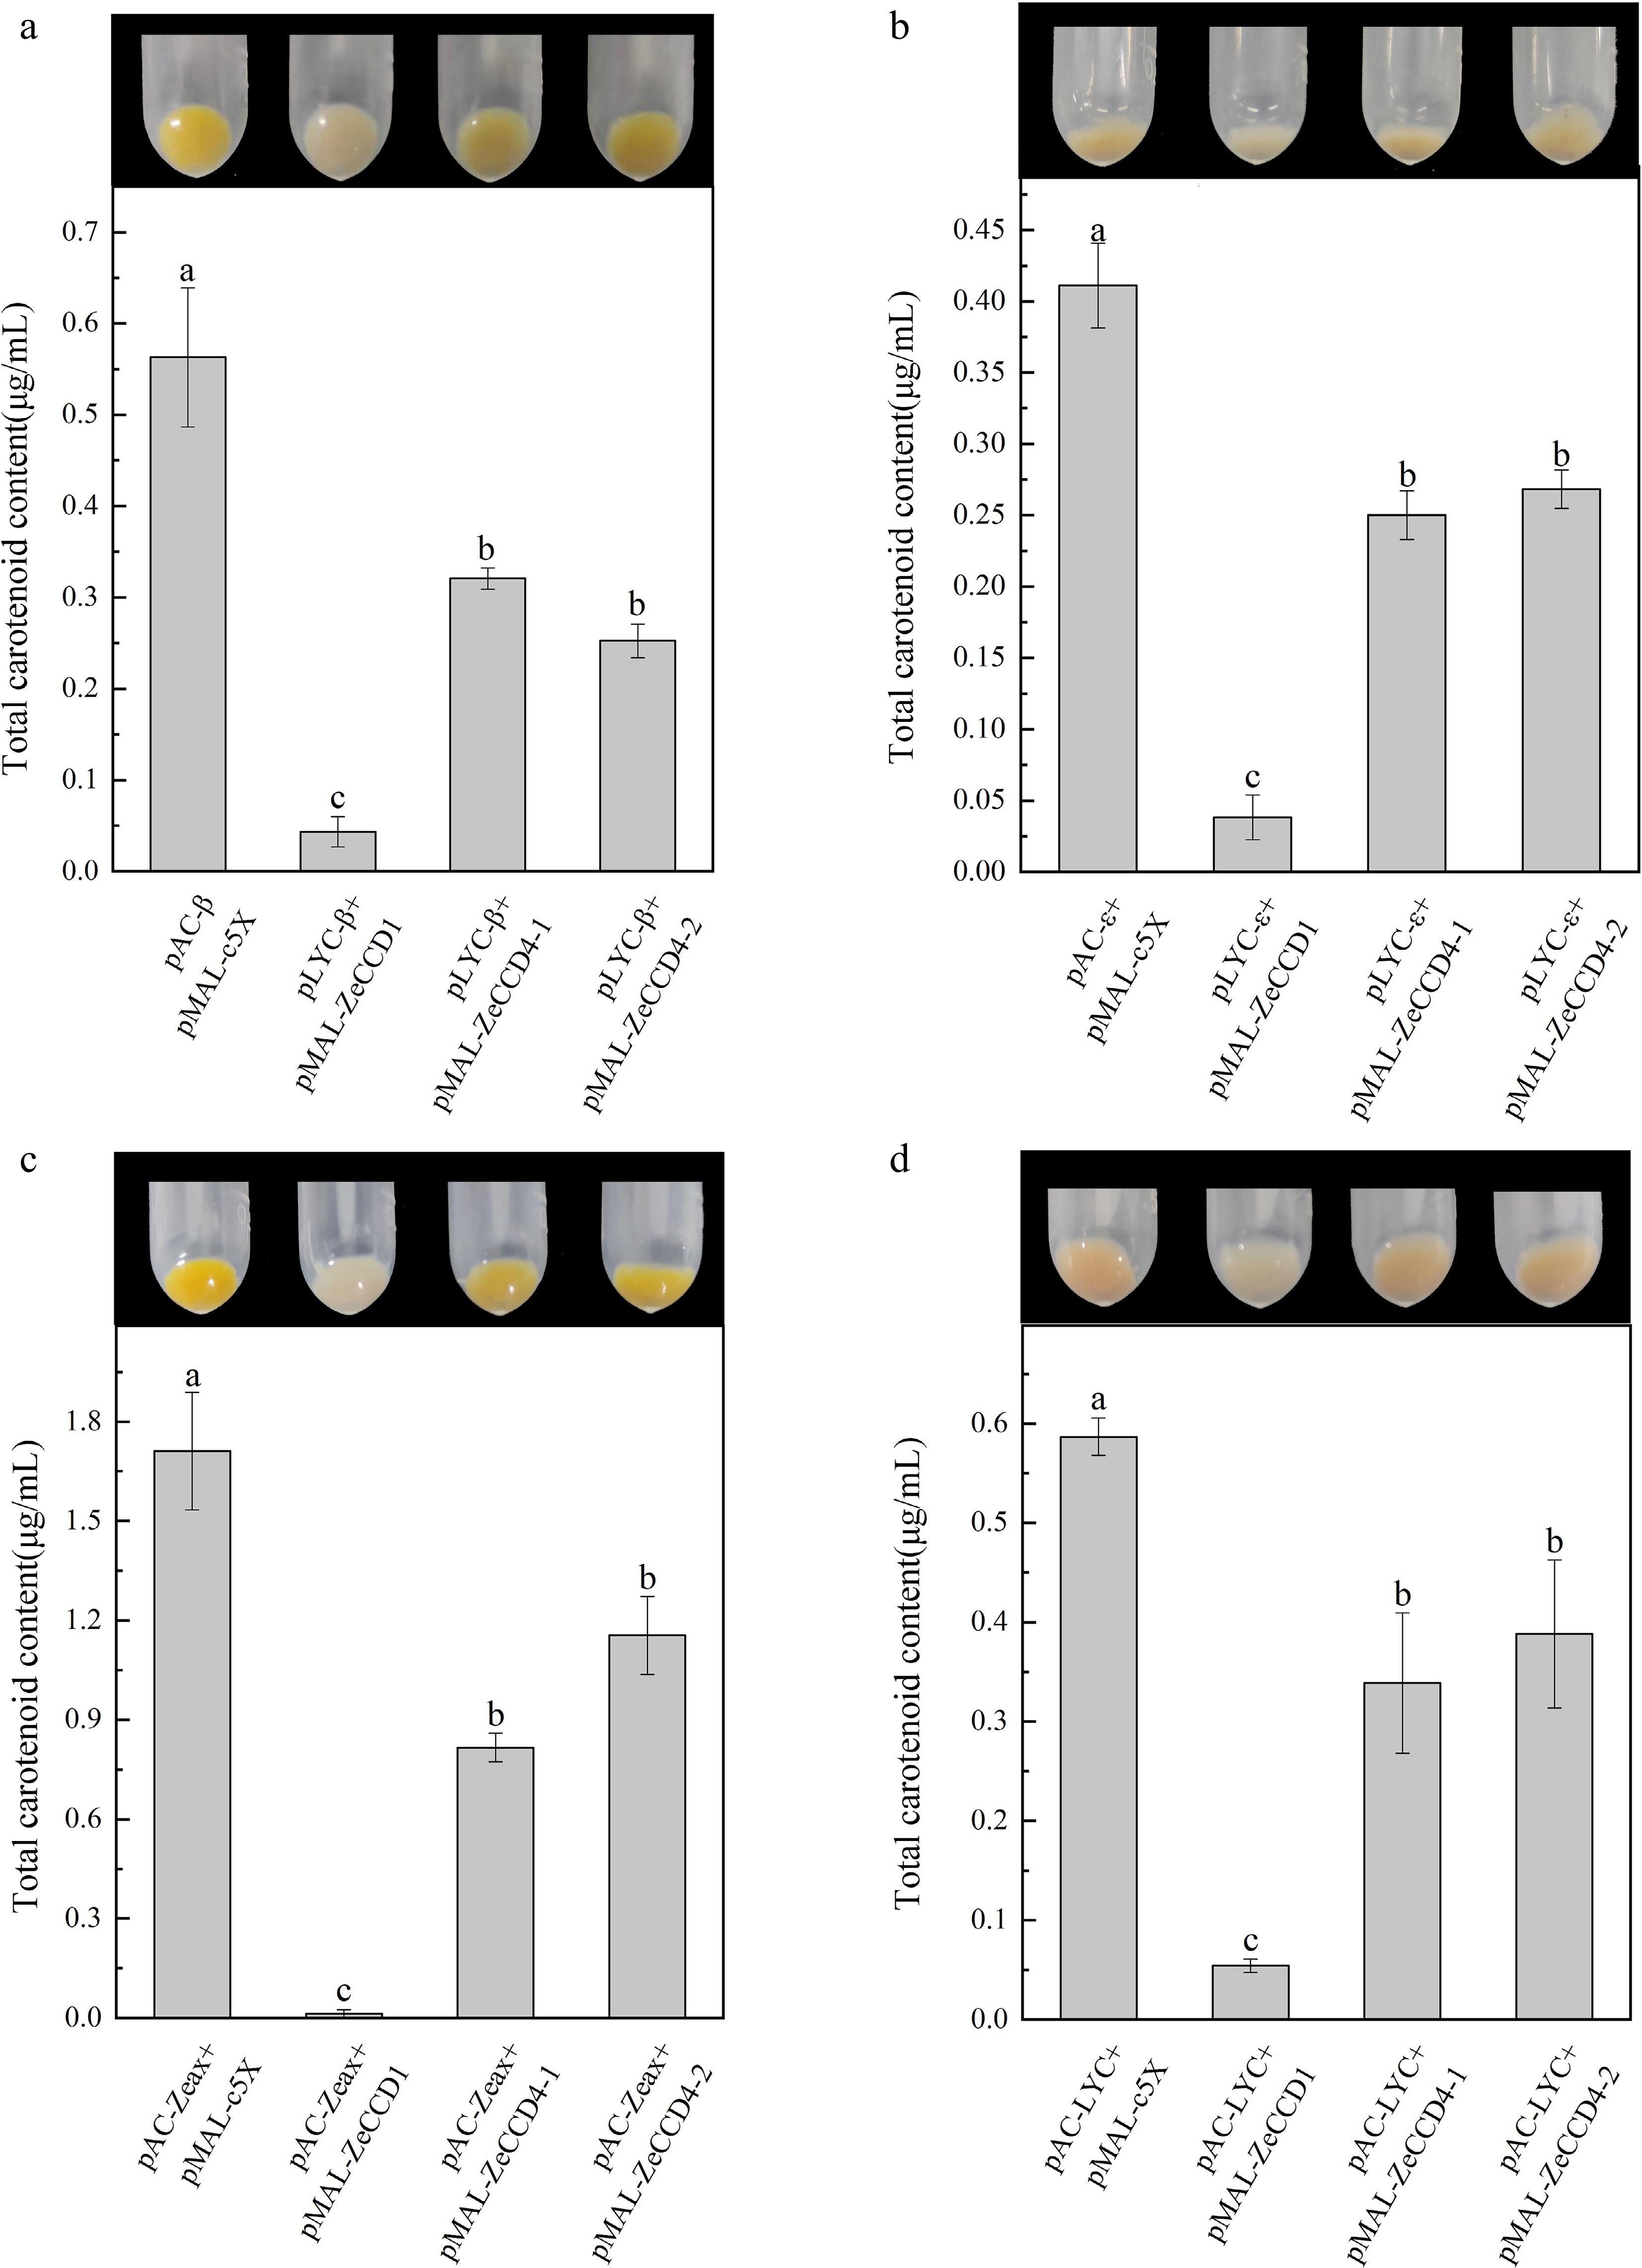
Figure 3.
Functional characterization of ZeCCDs proteins. The pMAL-ZeCCD1, pMAL-ZeCCD4-1, pMAL-ZeCCD4-2 and pMAL-c5X empty vectors were co-transformed into the engineered E. coli strains that were modified to accumulate (a) β-carotene, (b) ε-carotene, (c) zeaxanthin and (d) lycopene. These are mean ± standard errors, three biological replicates. Different letters indicate significant differences in the one-way ANOVA Duncan test, p < 0.05.
-
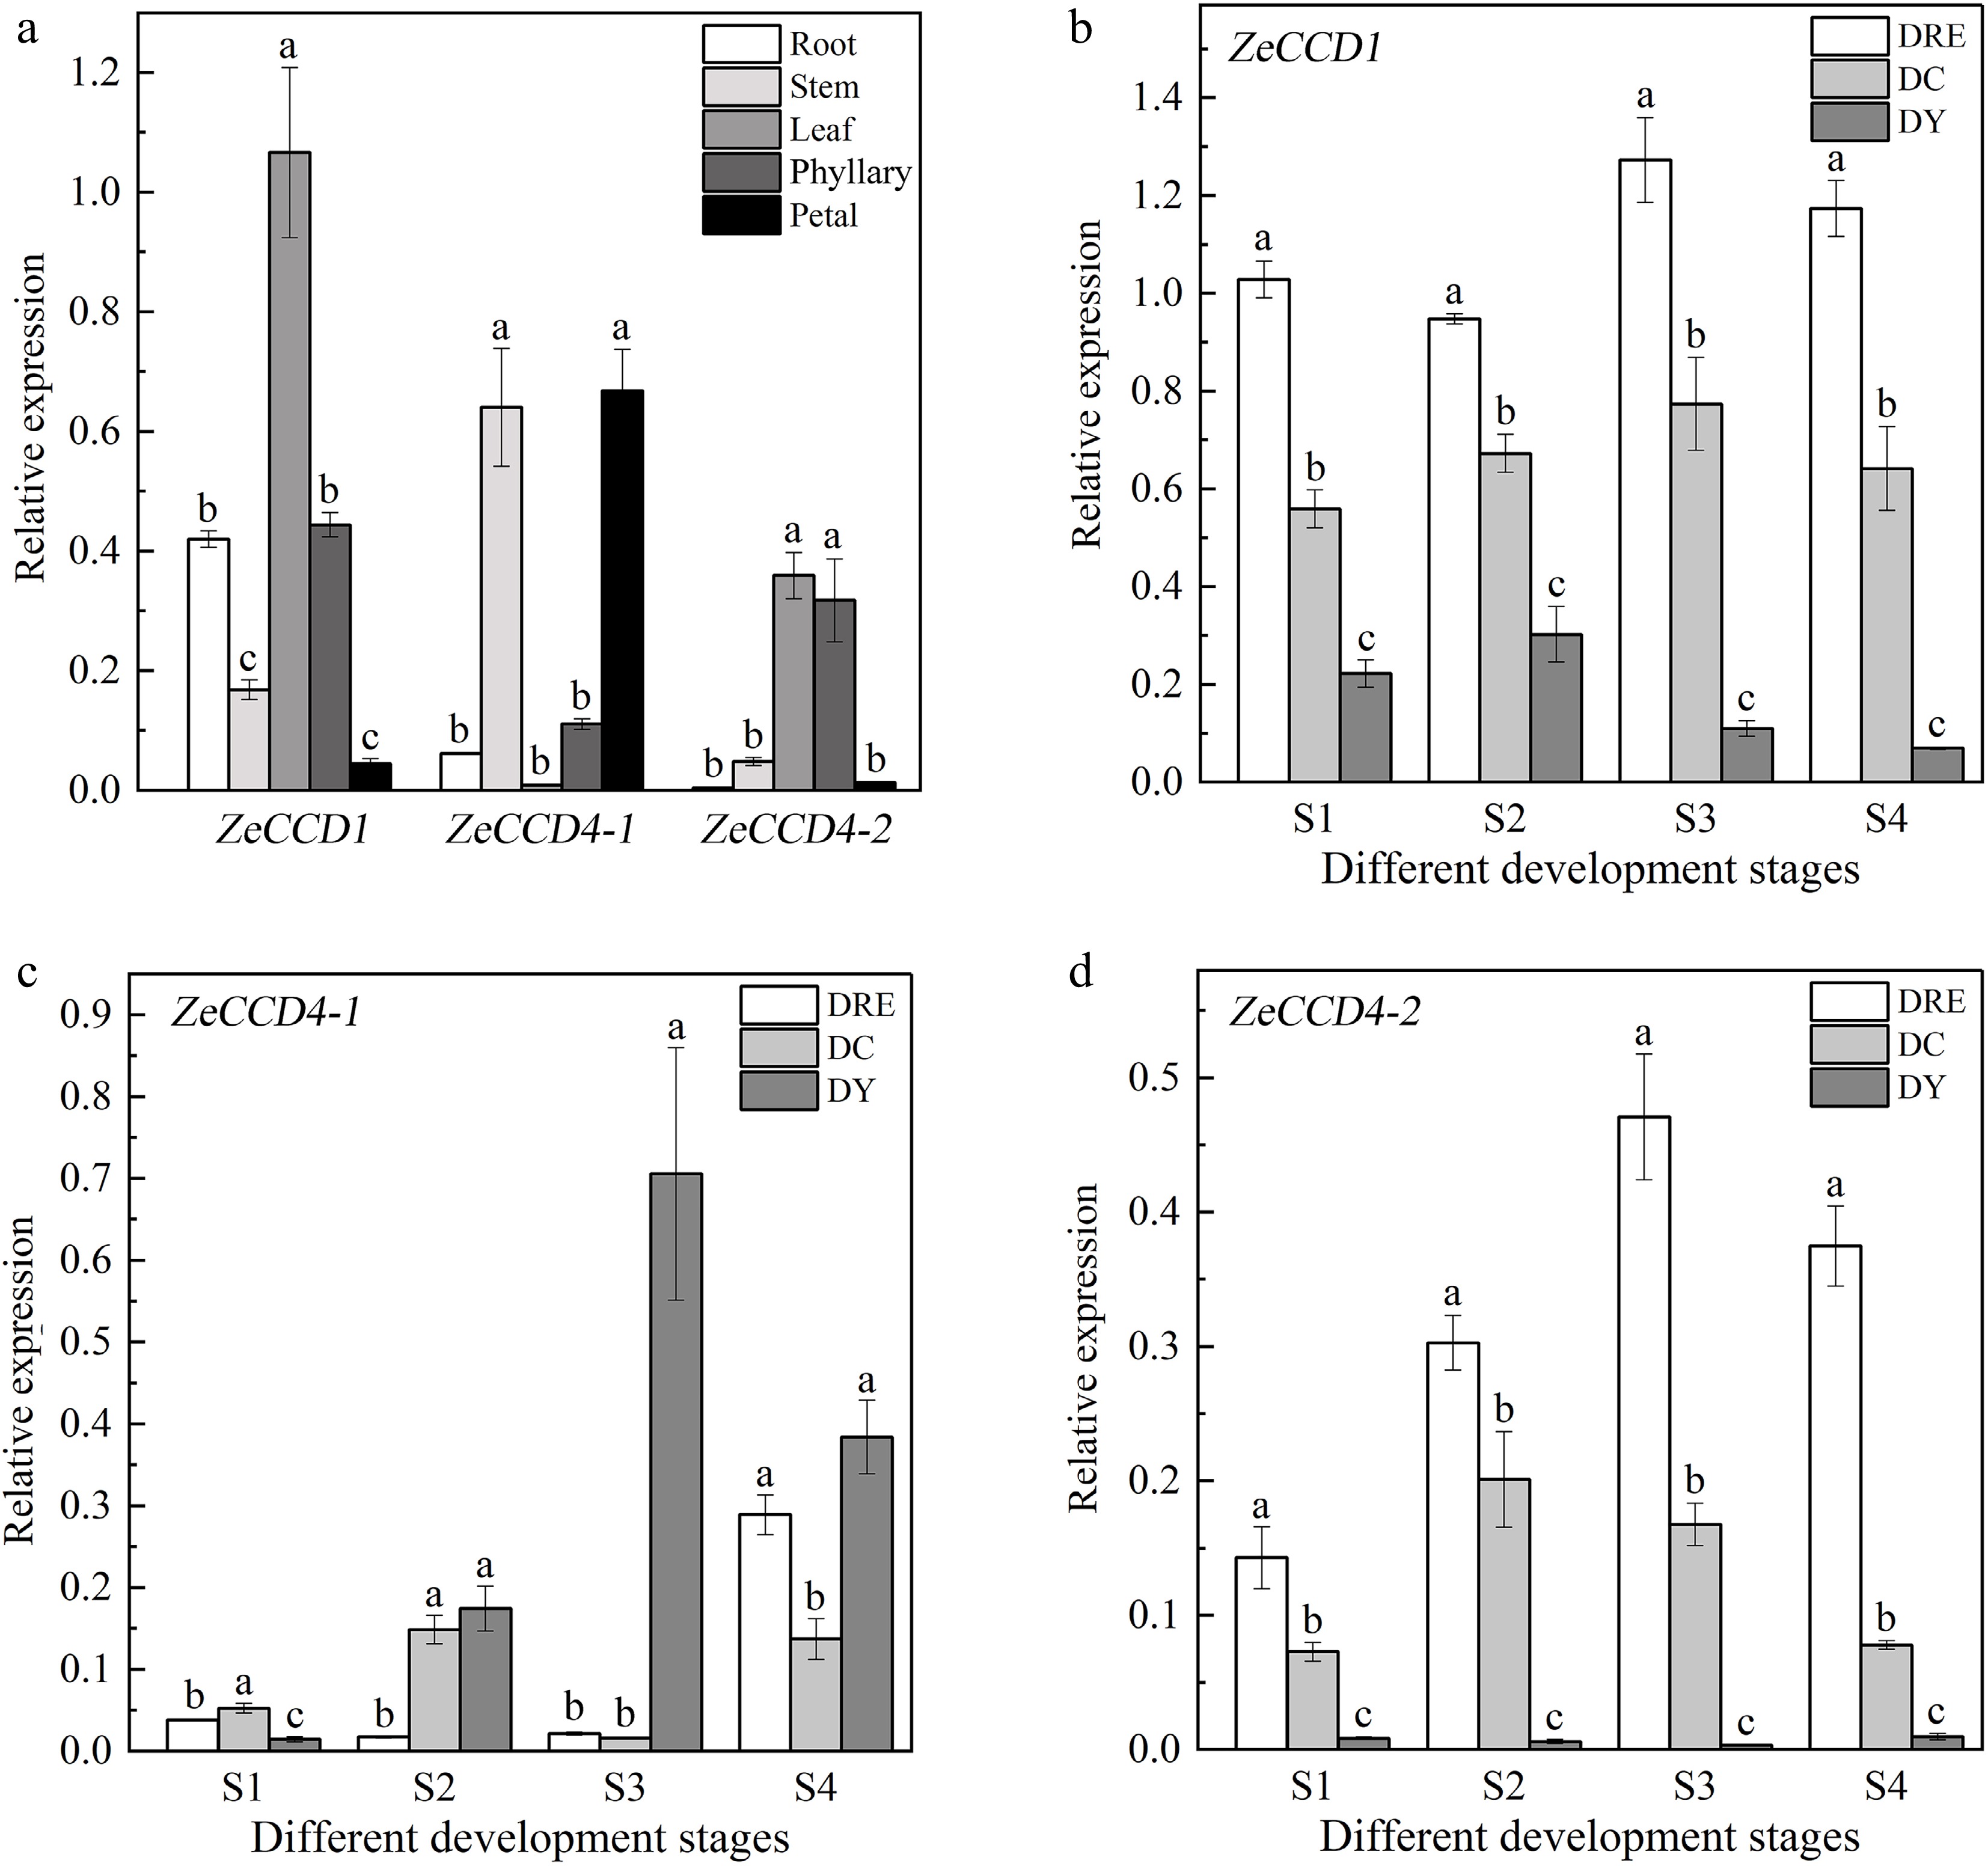
Figure 4.
The expression patterns of ZeCCDs. (a) Expression patterns of three genes in different tissues of DY. The expression patterns of (b) ZeCCD1, (c) ZeCCD4-1 and (d) ZeCCD4-2 in different cultivars and developmental stages. These are mean ± standard errors, three biological replicates. Different letters indicate significant differences between cultivars at the same developmental stage in the one-way ANOVA Duncan test, p < 0.05.
-

Figure 5.
The subcellular localization of ZeCCDs. The fusion constructs (Pro35S::ZeCCDs-eYFP) were transiently transformed into Nicotiana benthamiana leaf epidermal cells, and observed by confocal fluorescence microscope (ZEISS, Germany) with chloroplast autofluorescence as the maker. For each construct, yellow (eYFP), red (chloroplasts), gray (bright-field), and merged are shown. Bars = 50 μm.
-
Protein ORF length
(bp)Protein length
(aa)Molecular weight
(Da)Isoelectric
pointAliphatic
indexGrand average of
hydropathyInstability index ZeCCD1 1,629 542 61,102.98 5.85 78.54 −0.267 33.71 ZeCCD4-1 1,734 577 64,307.79 6.99 88.01 −0.109 31.13 ZeCCD4-2 1,791 596 65,784.95 6.05 79.13 −0.196 45.14 Table 1.
Biochemical properties of ZeCCDs.
-
ZeCCD1 ZeCCD4-1 ZeCCD4-2 Total carotenoid content −0.915** 0.543 −0.757* '*' and '**' indicates significant negative correlation at p < 0.05 and p < 0.01 level between ZeCCDs expression levels and total carotenoid content respectively. Table 2.
Correlation analysis of total carotenoid content and expression levels of ZeCCDs in petals from Zinnia elegans.
Figures
(5)
Tables
(2)