-
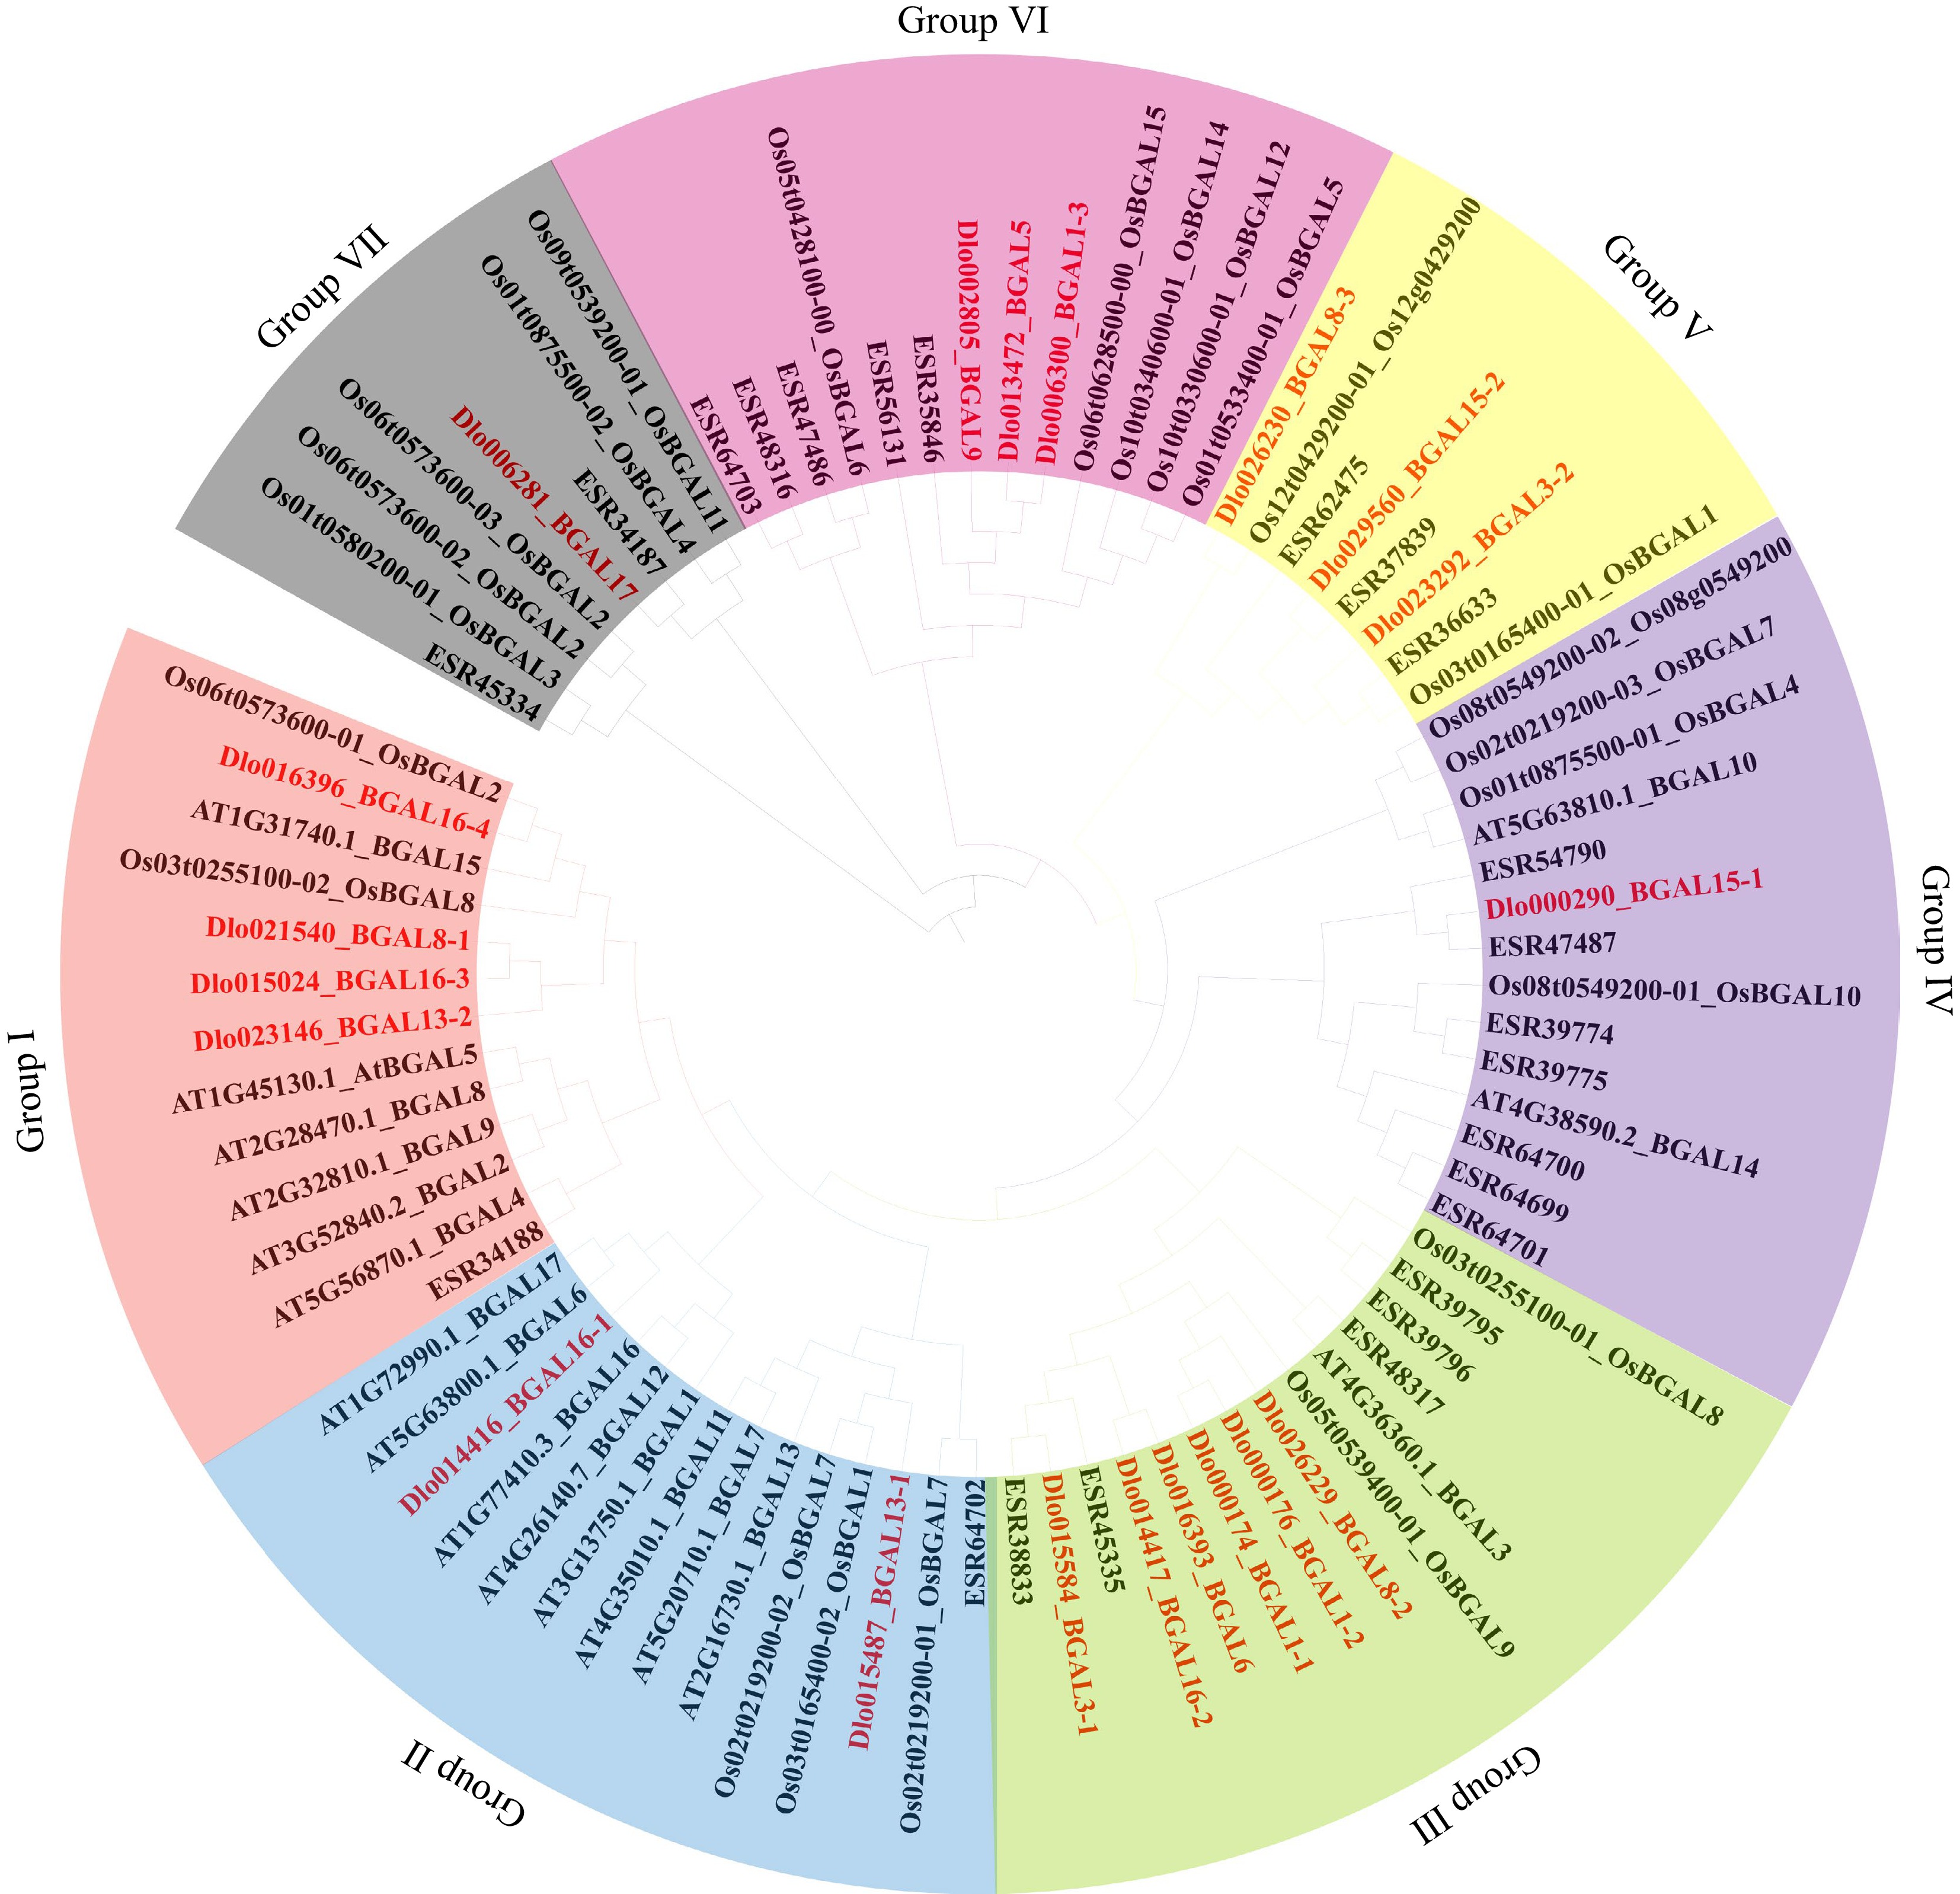
Figure 1.
Phylogenetic tree analysis of β-galactosidase (BGAL) proteins from longan, Citrus, Arabidopsis, and Oryza.
-
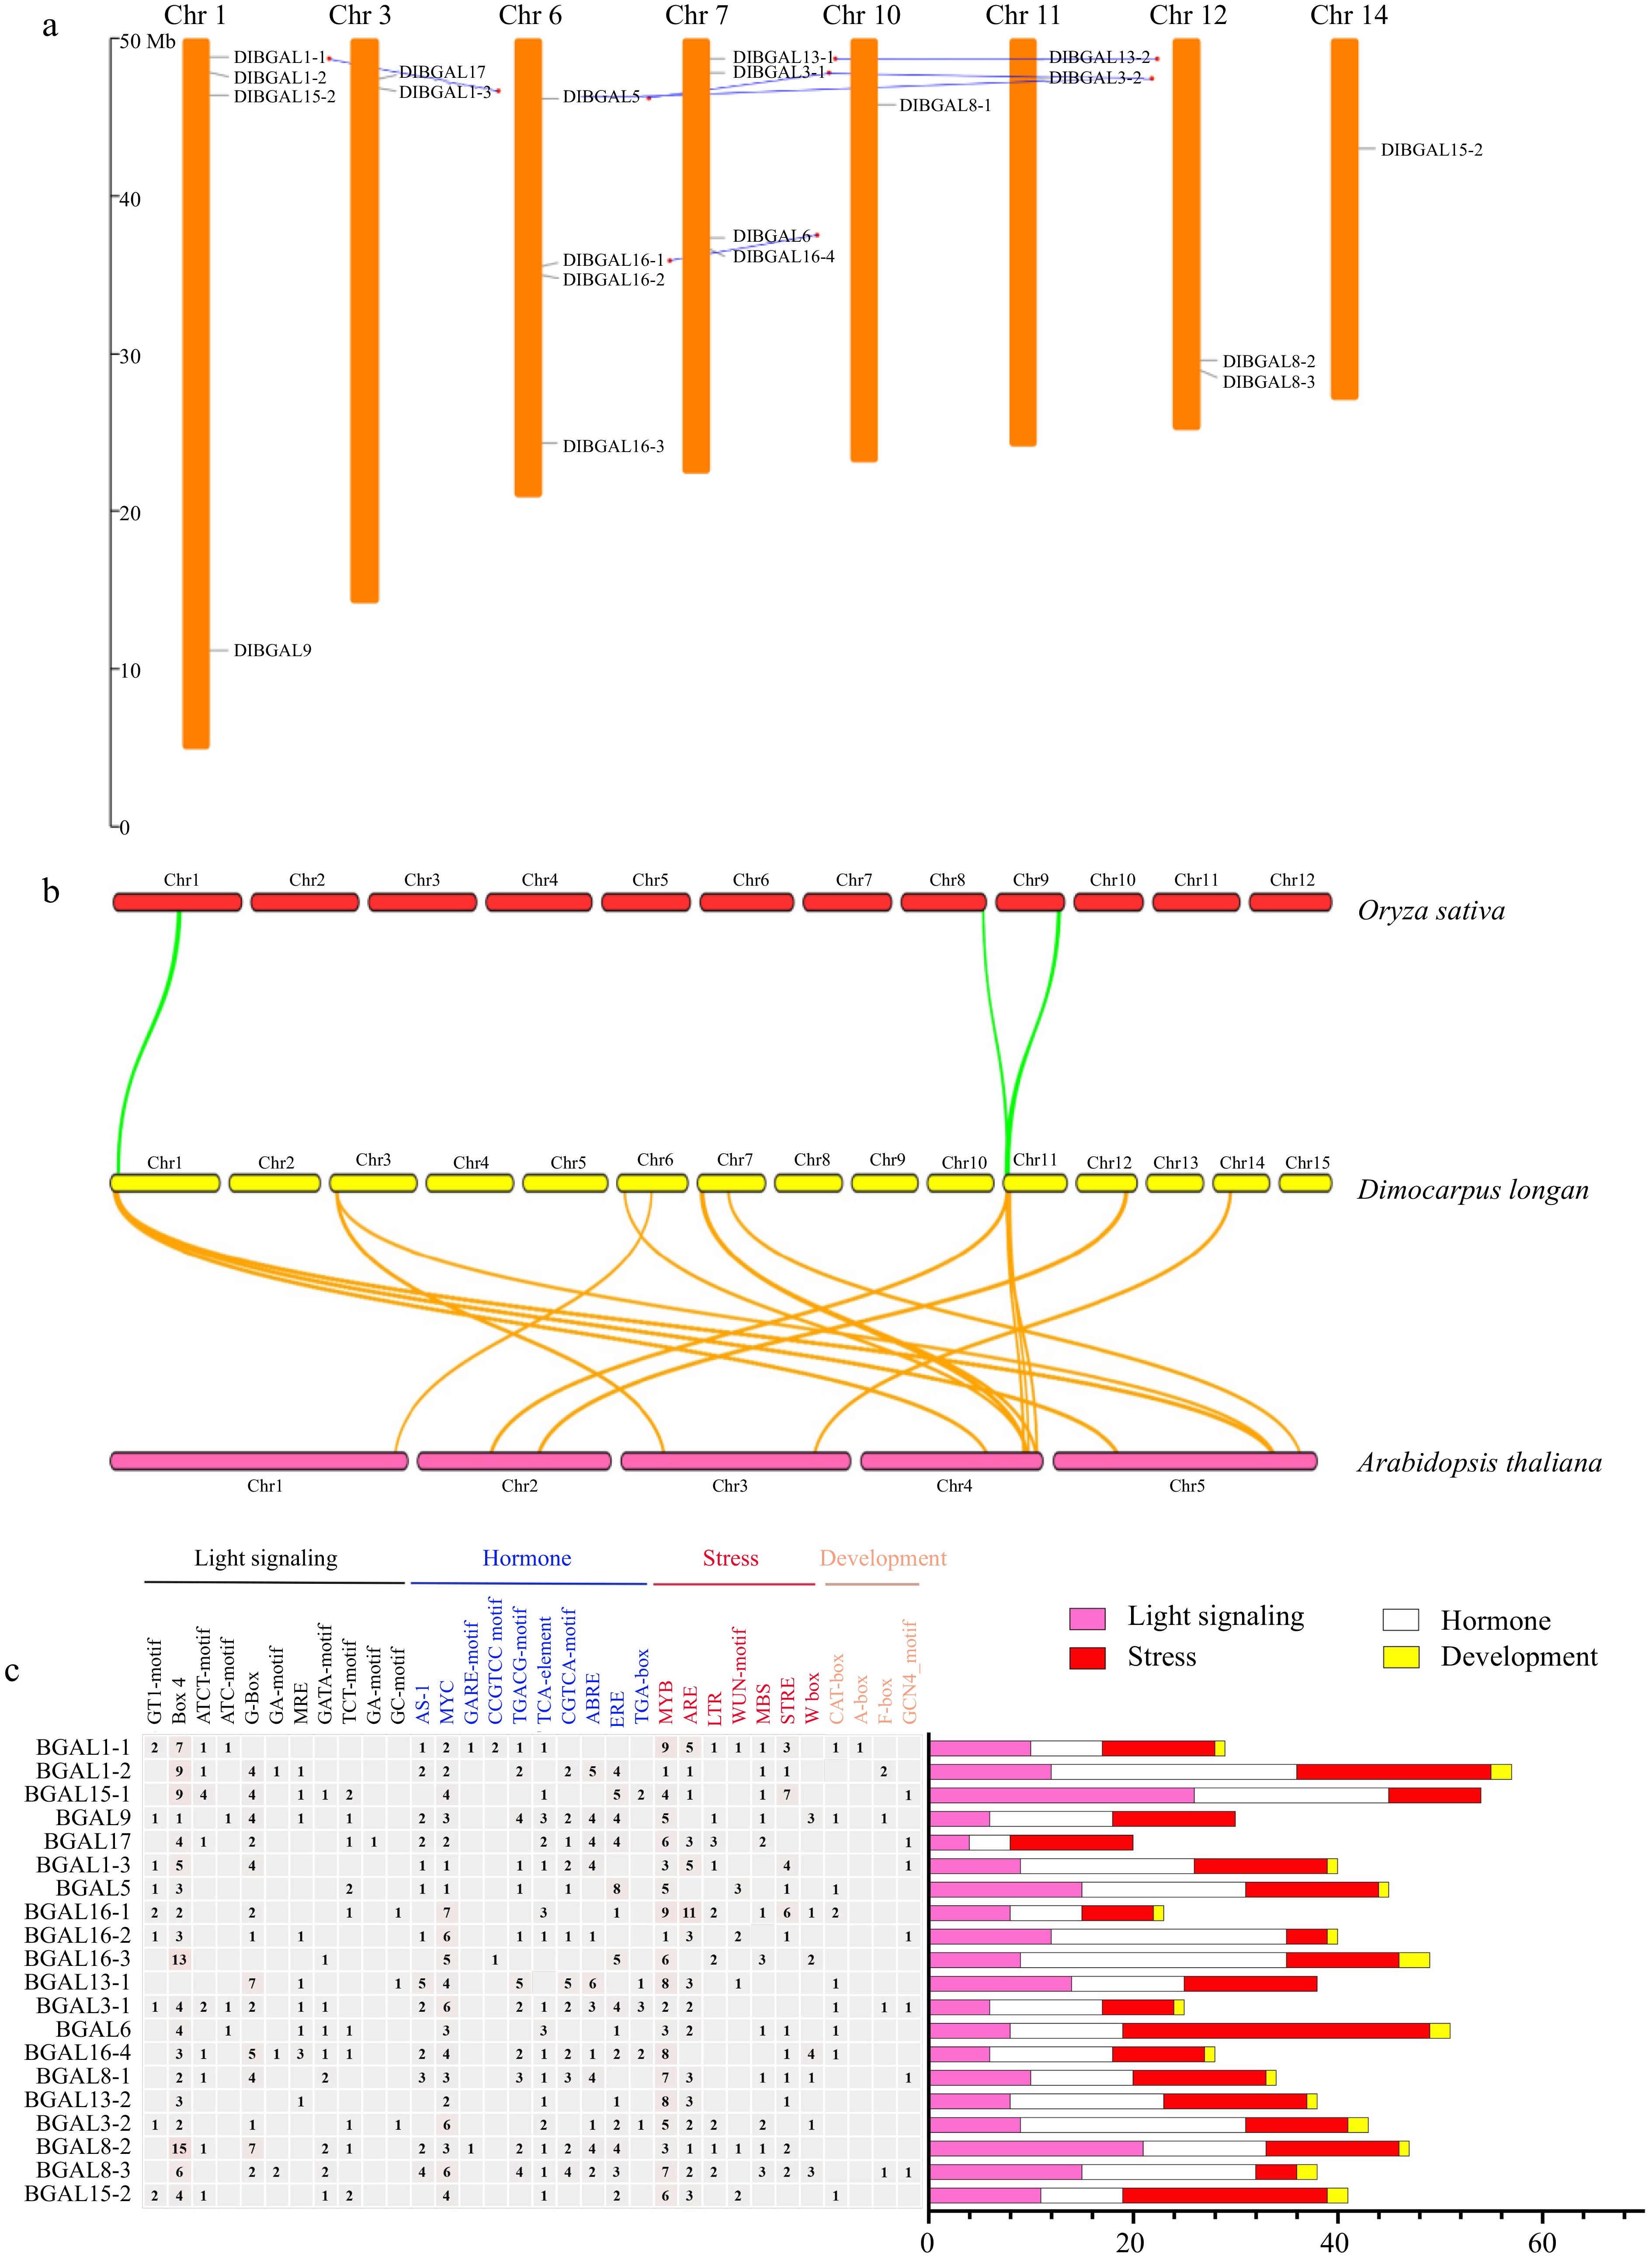
Figure 2.
Chromosomal distribution, synteny and cis-elements analysis of DlBGAL genes. (a) Distributions and duplications of DlBGAL genes along longan chromosomes. The gray and blue lines indicate chromosome locations of DlBGALs and segmentally duplicated genes, respectively. (b) The homologous relationships of BGAL genes in longan, Oryza and Arabidopsis. The green and orange lines indicate the homologous relationships of BGAL genes with Oryza and Arabidopsis, respectively. (c) Analysis of cis-elements in the promoter of DlBGAL genes. Heatmap of the numbers of cis-elements in the promoters of DlBGAL genes.
-

Figure 3.
Expression profile and multi-omics analysis of DlBGAL genes. (a), (b) Expression analyses of DlBGAL genes during early longan SE and different temperature treatments. (c) Alluvial diagram of DlBGAL genes was divided into eight types (types I–VII and other) based on ATAC-seq, ChIP-seq, and RNA-seq data. The width of different colored bars represents the number of genes, and the genes included in each type were listed in the right panel. EC vs GE, the differential expression of EC vs GE; EC vs GE & ICpEC vs GE, the differential expression of EC vs GE and ICpEC vs GE; EC vs ICpEC vs GE, the differential expression of EC vs ICpEC, ICpEC vs GE and EC vs GE; ICpEC/GE, ATAC-seq or ChIP-seq (H3K4me1) peaks were detected in ICpEC/GE; EC & ICpEC, ATAC-seq or ChIP-seq (H3K4me1) peaks were detected in EC and ICpEC; EC & ICpEC & GE, ATAC-seq or ChIP-seq (H3K4me1) peaks were detected in EC, ICpEC and GE; Na, undetectable peak of ATAC-seq or ChIP-seq (H3K4me1); Ns, no difference in transcripts among the samples.
-
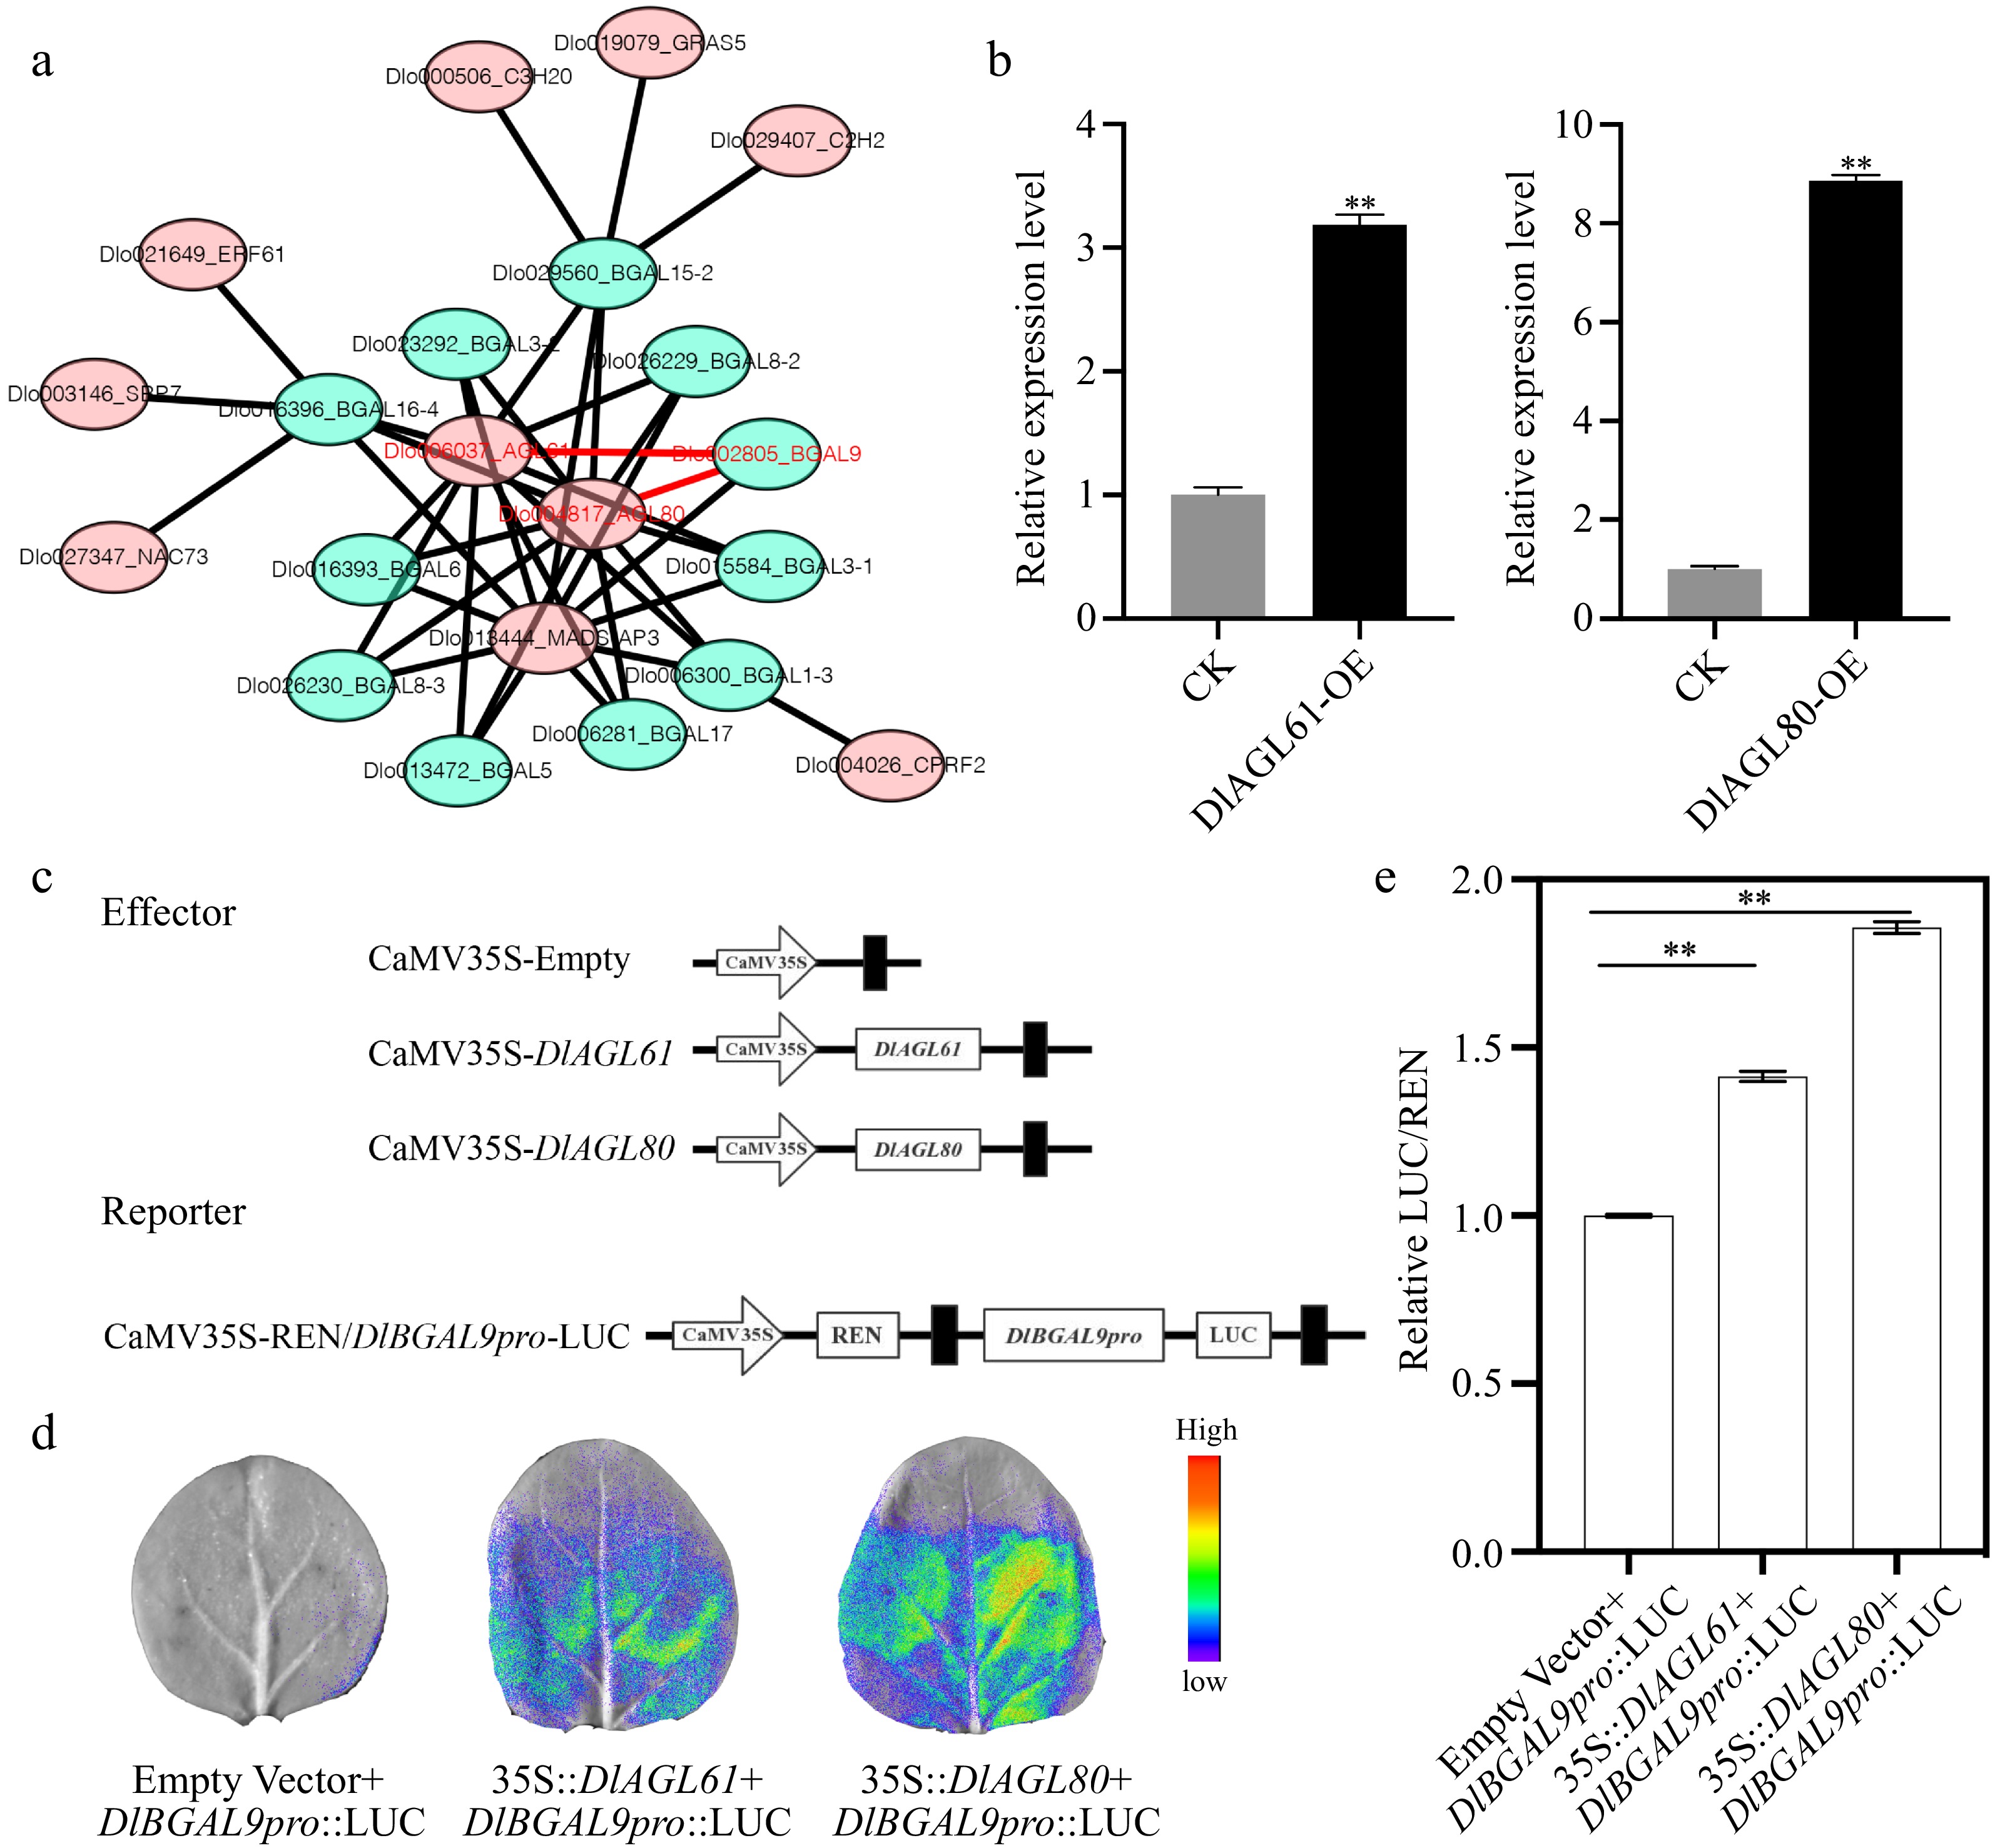
Figure 4.
Transcription factors (TFs) regulate the expression of DlBGAL9. (a) Network prediction of DlBGAL gene regulated by TFs. The red font represents the key genes. (b) The relative expression of DlBGAL9 in the TFs DlAGL61/80 transiently transformed. Beta-actin (ACTB) was used as a reference gene to normalize gene expression data. Each treatment was conducted in triplicate with three technical repeats. (c) Schematic diagrams of the effector vectors and reporter vectors in luciferase assays. (d) The interactions of DlAGL61 or DlAGL80 with the DlBGAL9 promoter that were detected in leaves of N. benthamiana through a dual luciferase reporter system. (e) Determination of the luciferase enzyme activity in N. benthamiana. Values were mean ± SD. **indicates a statistically significant difference, **p < 0.01.
-
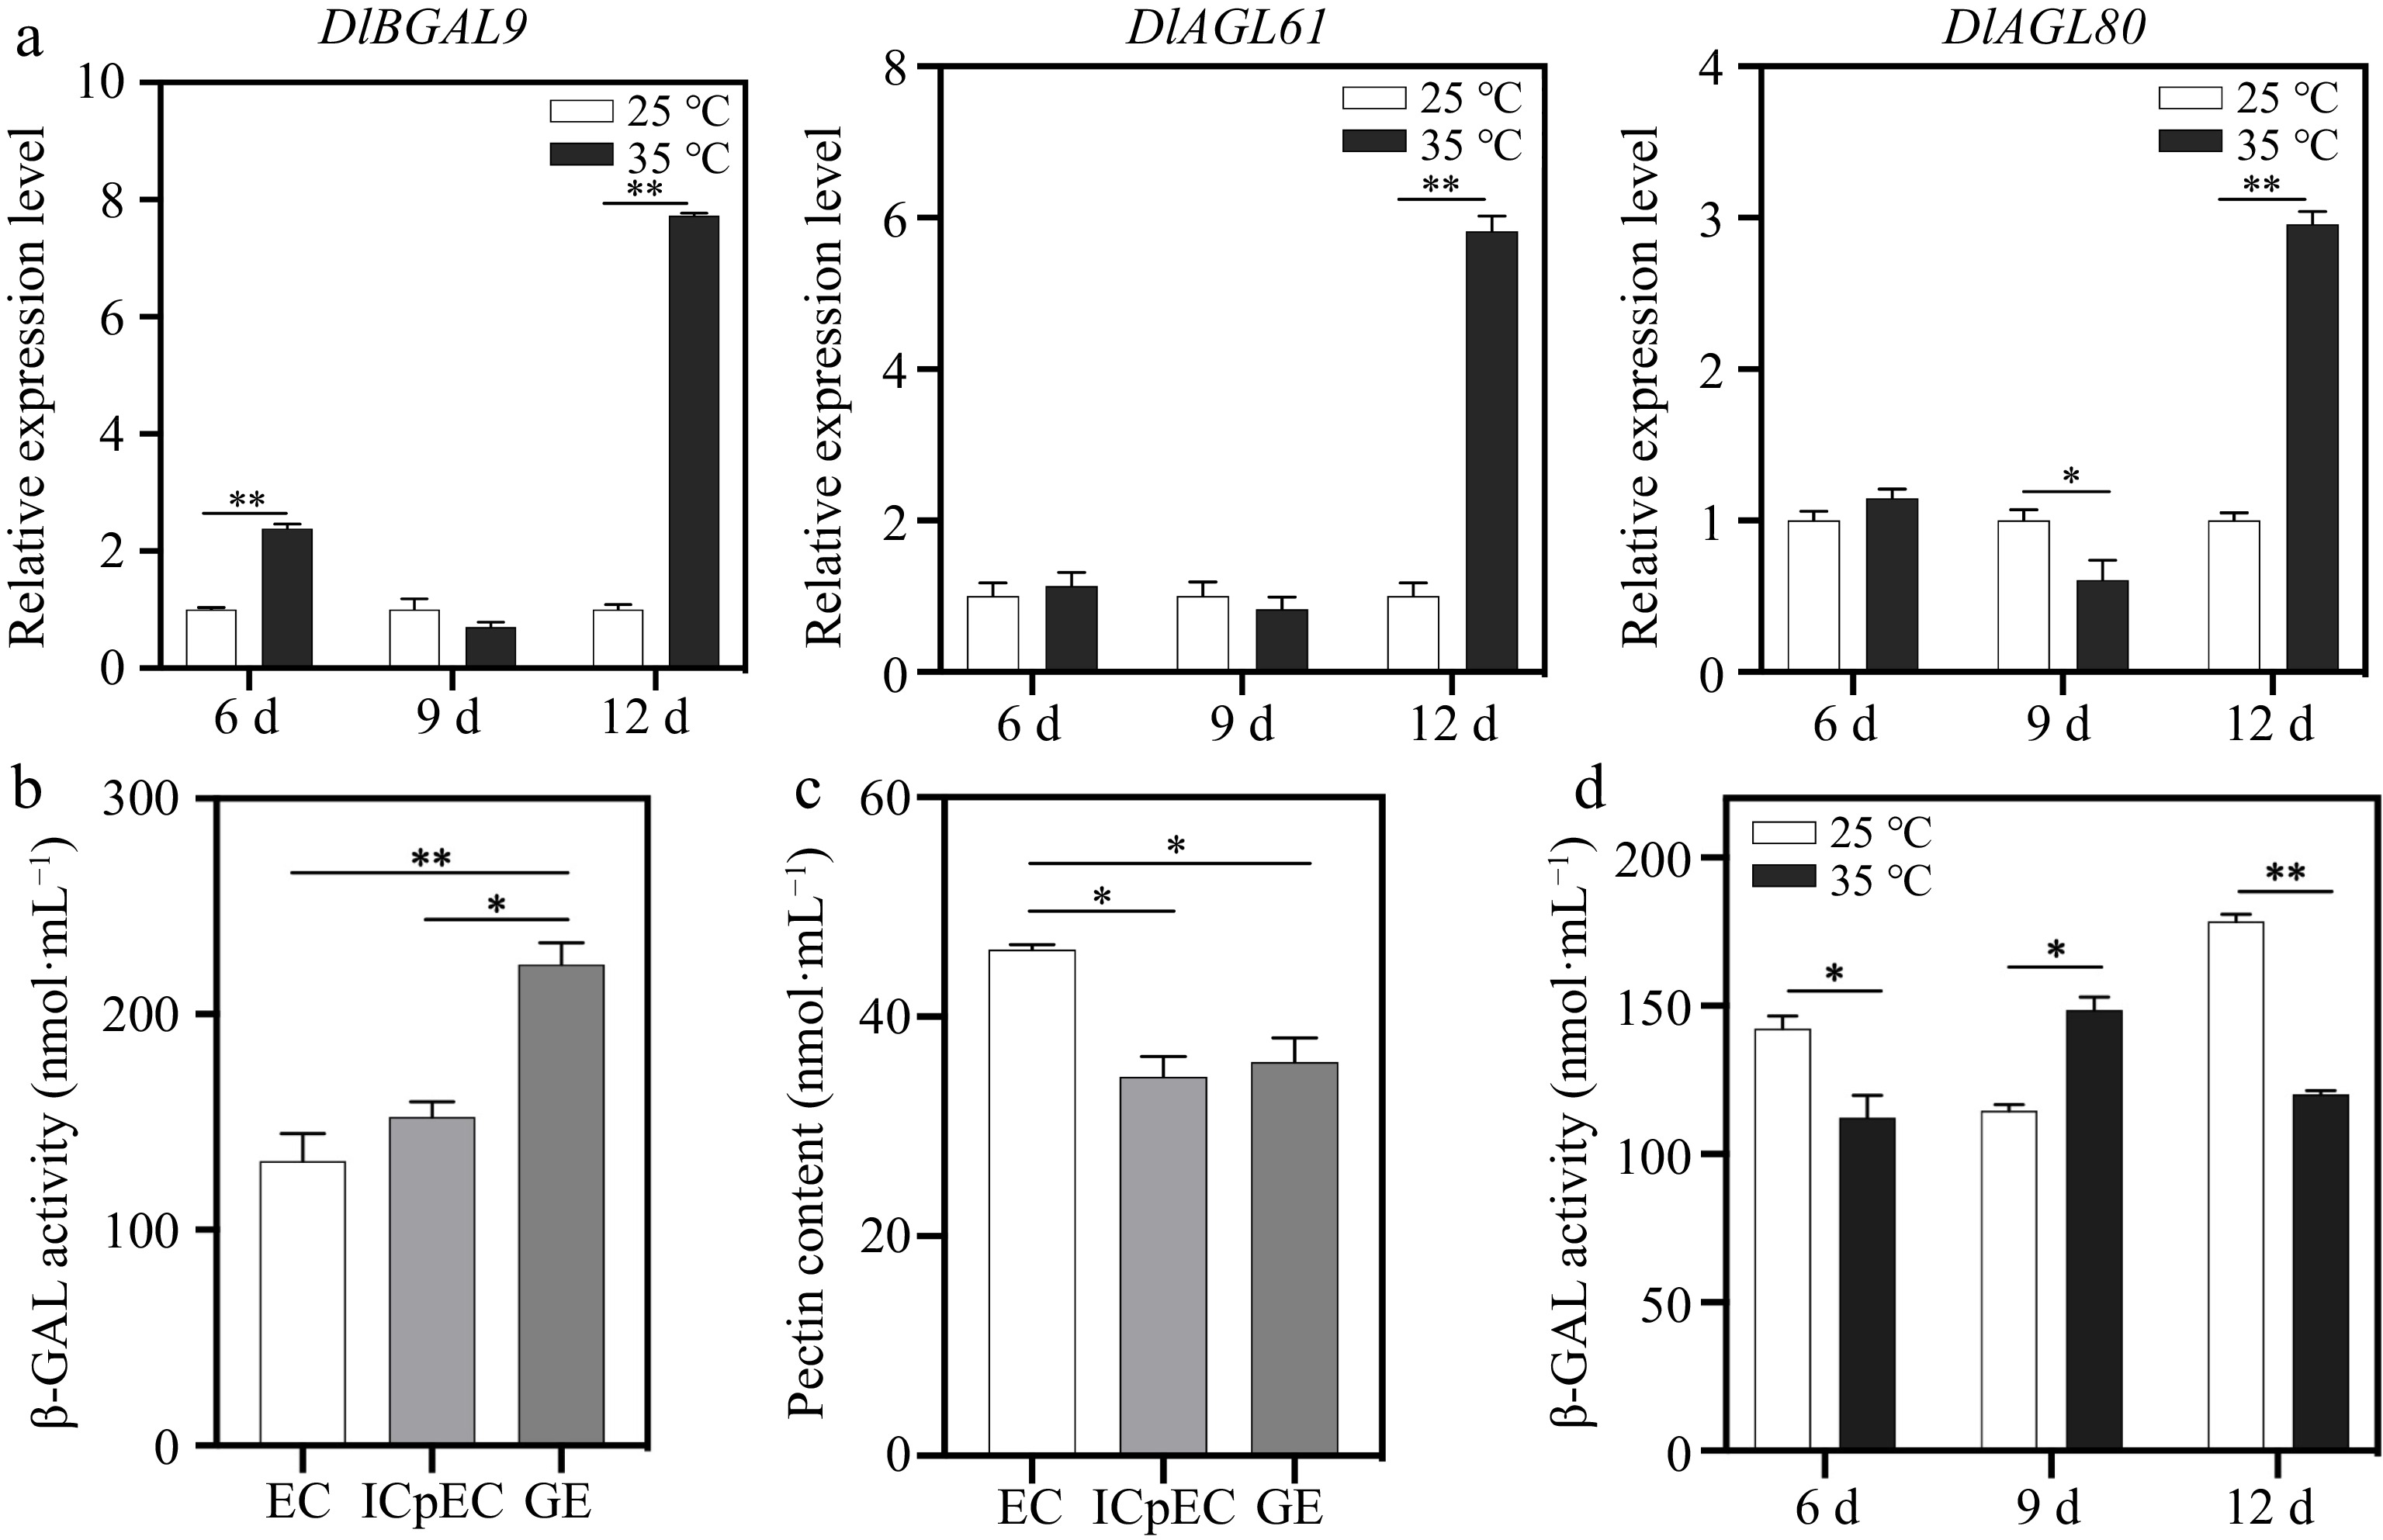
Figure 5.
Expression pattern analysis of DlBGAL9 and TFs DlAGL61/80 in longan EC under heat stress. (a) Expression of DlBGAL9 and TFs DlAGL61/80 in longan EC under different days of heat stress. Beta-actin (ACTB) was used as a reference gene to normalize gene expression data. (b) The β-GAL activity during early longan somatic embryogenesis (EC, ICpEC, and GE). (c) The pectin content during early longan somatic embryogenesis (EC, ICpEC, and GE). (d) The β-GAL activity in longan EC under different days of heat stress. Somatic embryos were cultured on MS medium and treated at 25 °C (normal) and 35 °C (heat stress). Samples were harvested after 6, 9, and 12 d to detect the gene expression patterns and β-GAL activity. MS, Murashige and Skoog medium. EC, embryogenic callus; ICpEC, incomplete compact pro-embryogenic culture; GE, globular embryo. Each treatment was conducted in triplicate with three technical repeats. Values are mean ± SD. * Indicates a statistically significant difference, *p < 0.05, **p < 0.01.
-
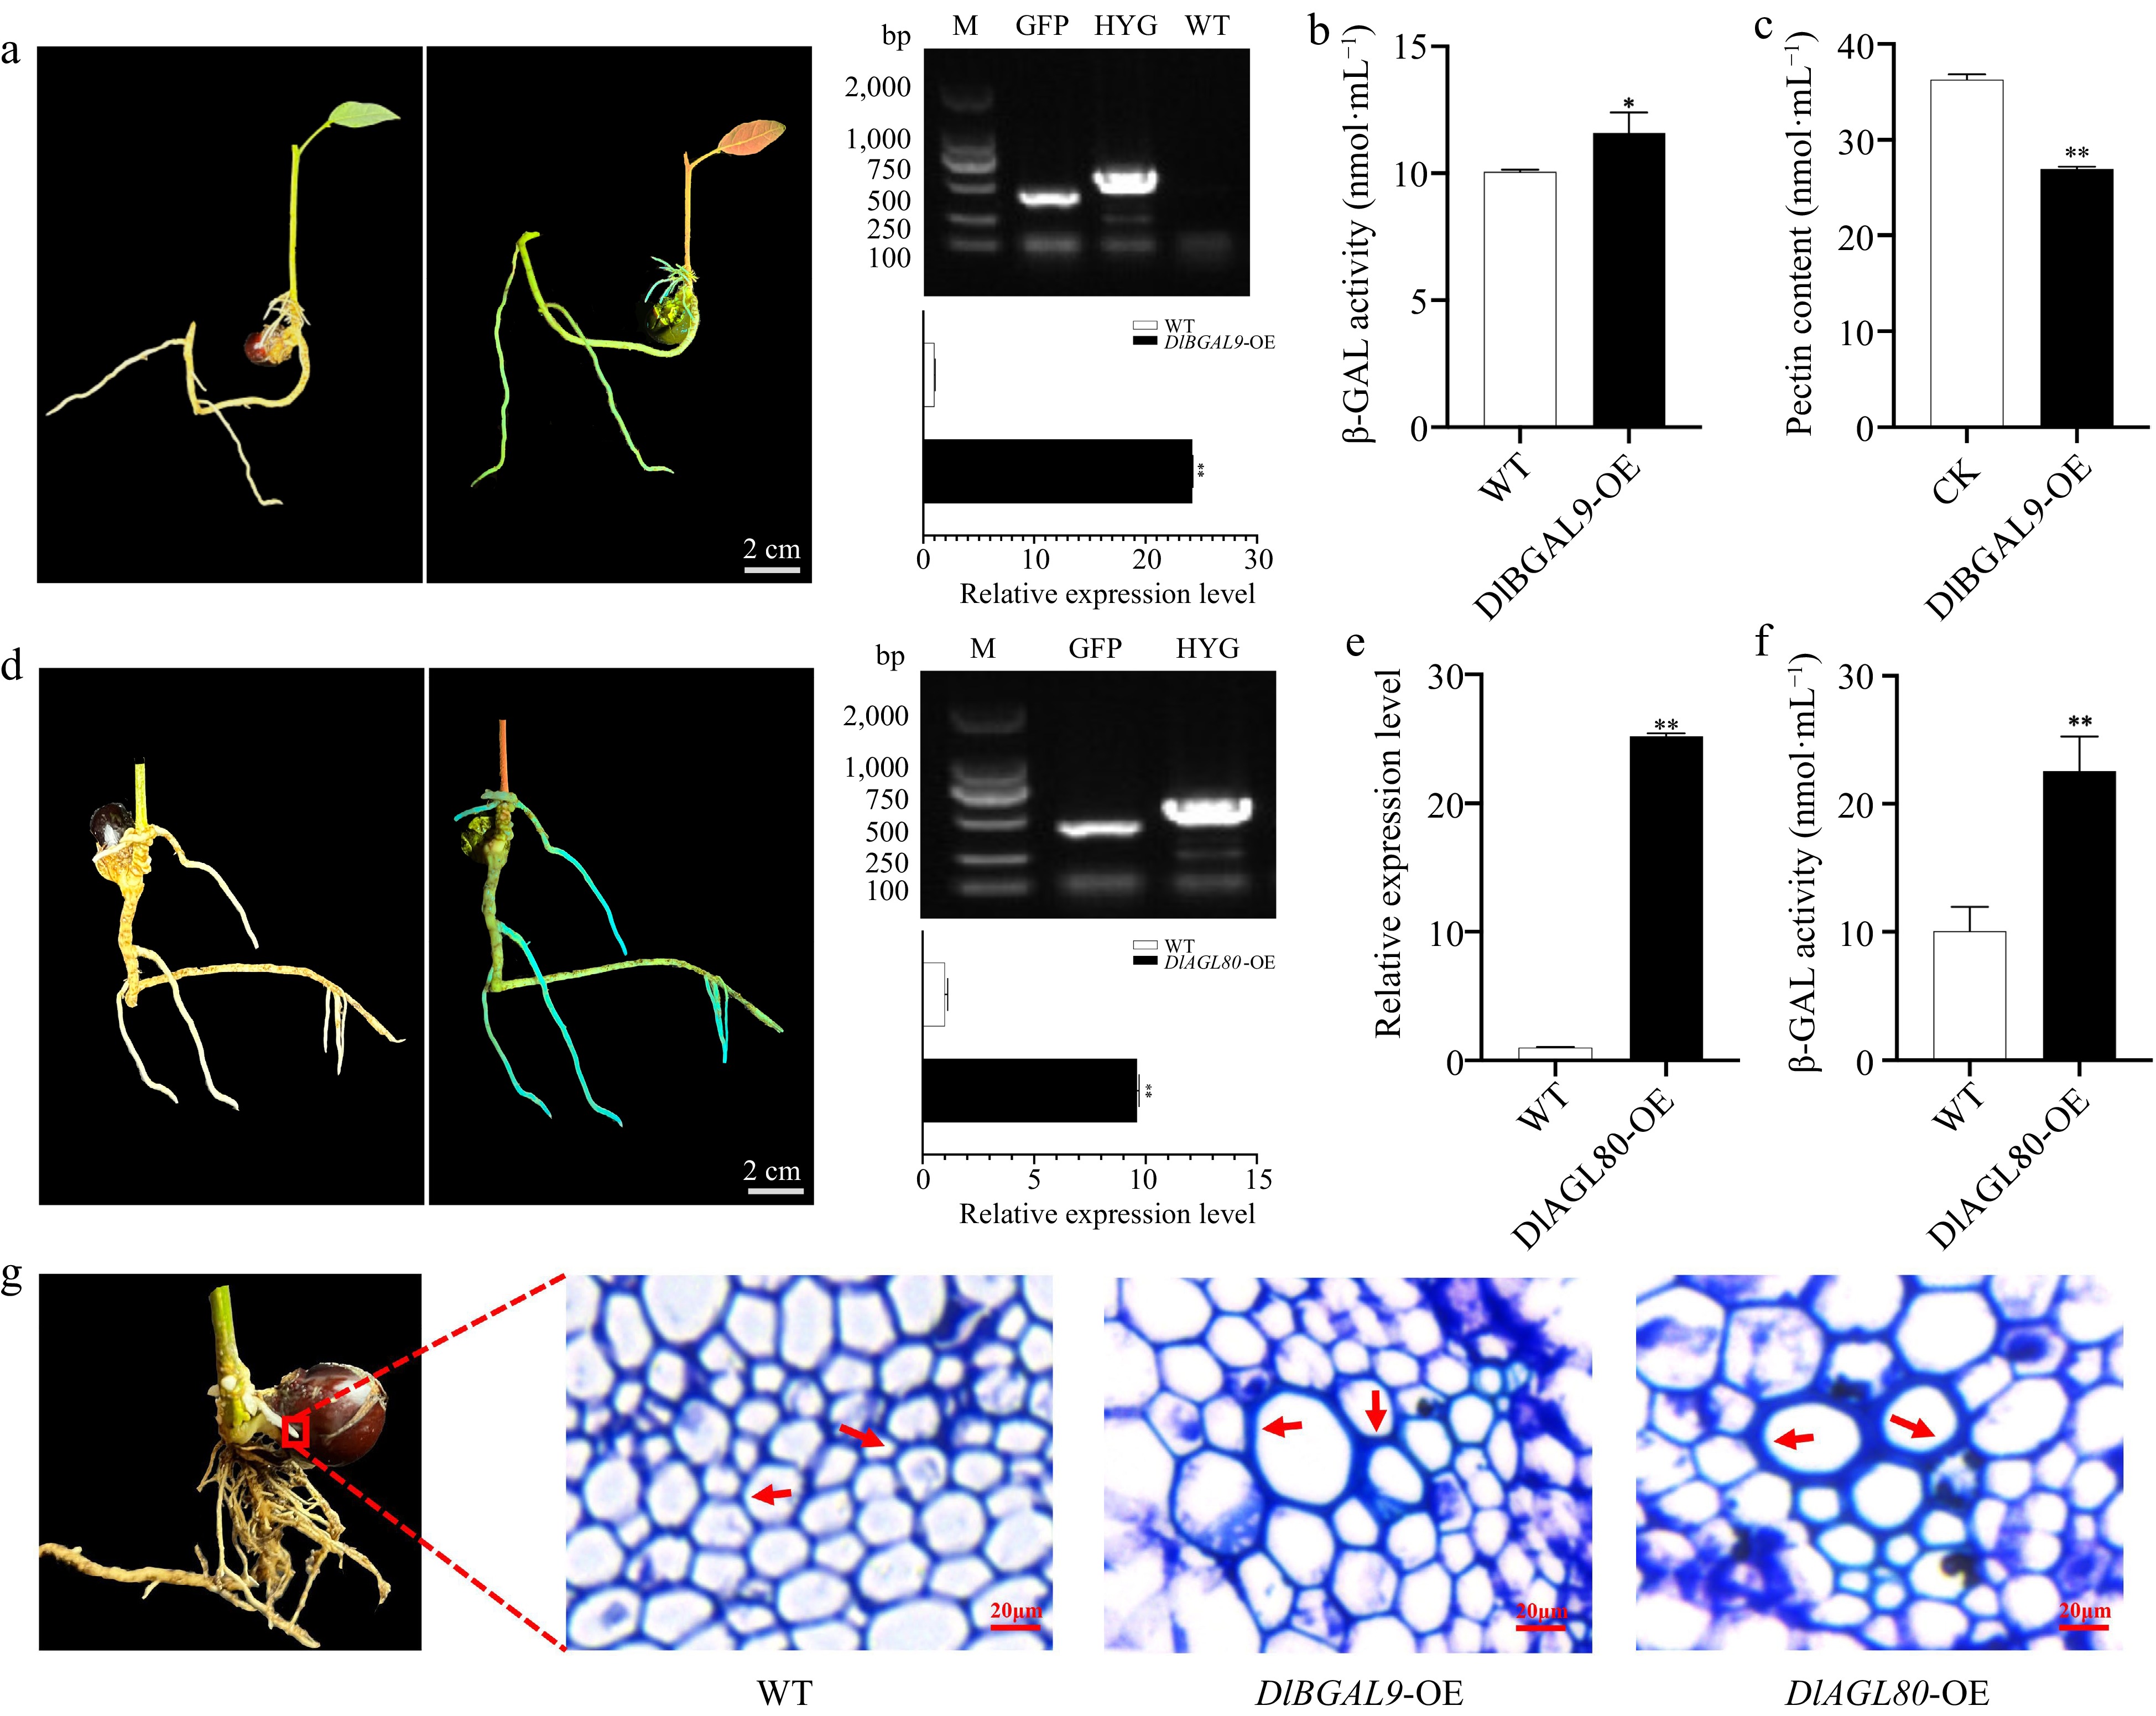
Figure 6.
Functional analysis of DlBGAL9 and TF DlAGL80 in longan hairy root. (a) Left: The bright field and GFP-fluorescent DlBGAL9-OE transgenic hairy roots. Right: Molecular identification DlBGAL9-OE transgenic hairy roots. Scale bar = 2 cm. (b) The β-GAL activity in longan hairy root of DlBGAL9-OE transgenic. (c) The pectin content in longan hairy root of DlBGAL9-OE transgenic. (d) Left: The bright field and GFP-fluorescent longan hairy root of the DlAGL80-OE transgenic. Right: Molecular identification longan hairy root of the DlAGL80-OE transgenic. Scale bar = 2 cm. (e) Expression of DlBGAL9 in longan hairy roots of DlAGL80-OE transgenic. (f) The β-GAL activity in longan hairy roots of DlAGL80-OE transgenic. (g) Anatomical and morphological observations of WT, DlBGAL9-OE and DlAGL80-OE longan hairy roots. Arrows indicate the position of cell wall thickening. Scale bar = 20 μm. (* p < 0.05, ** p < 0.01).
-
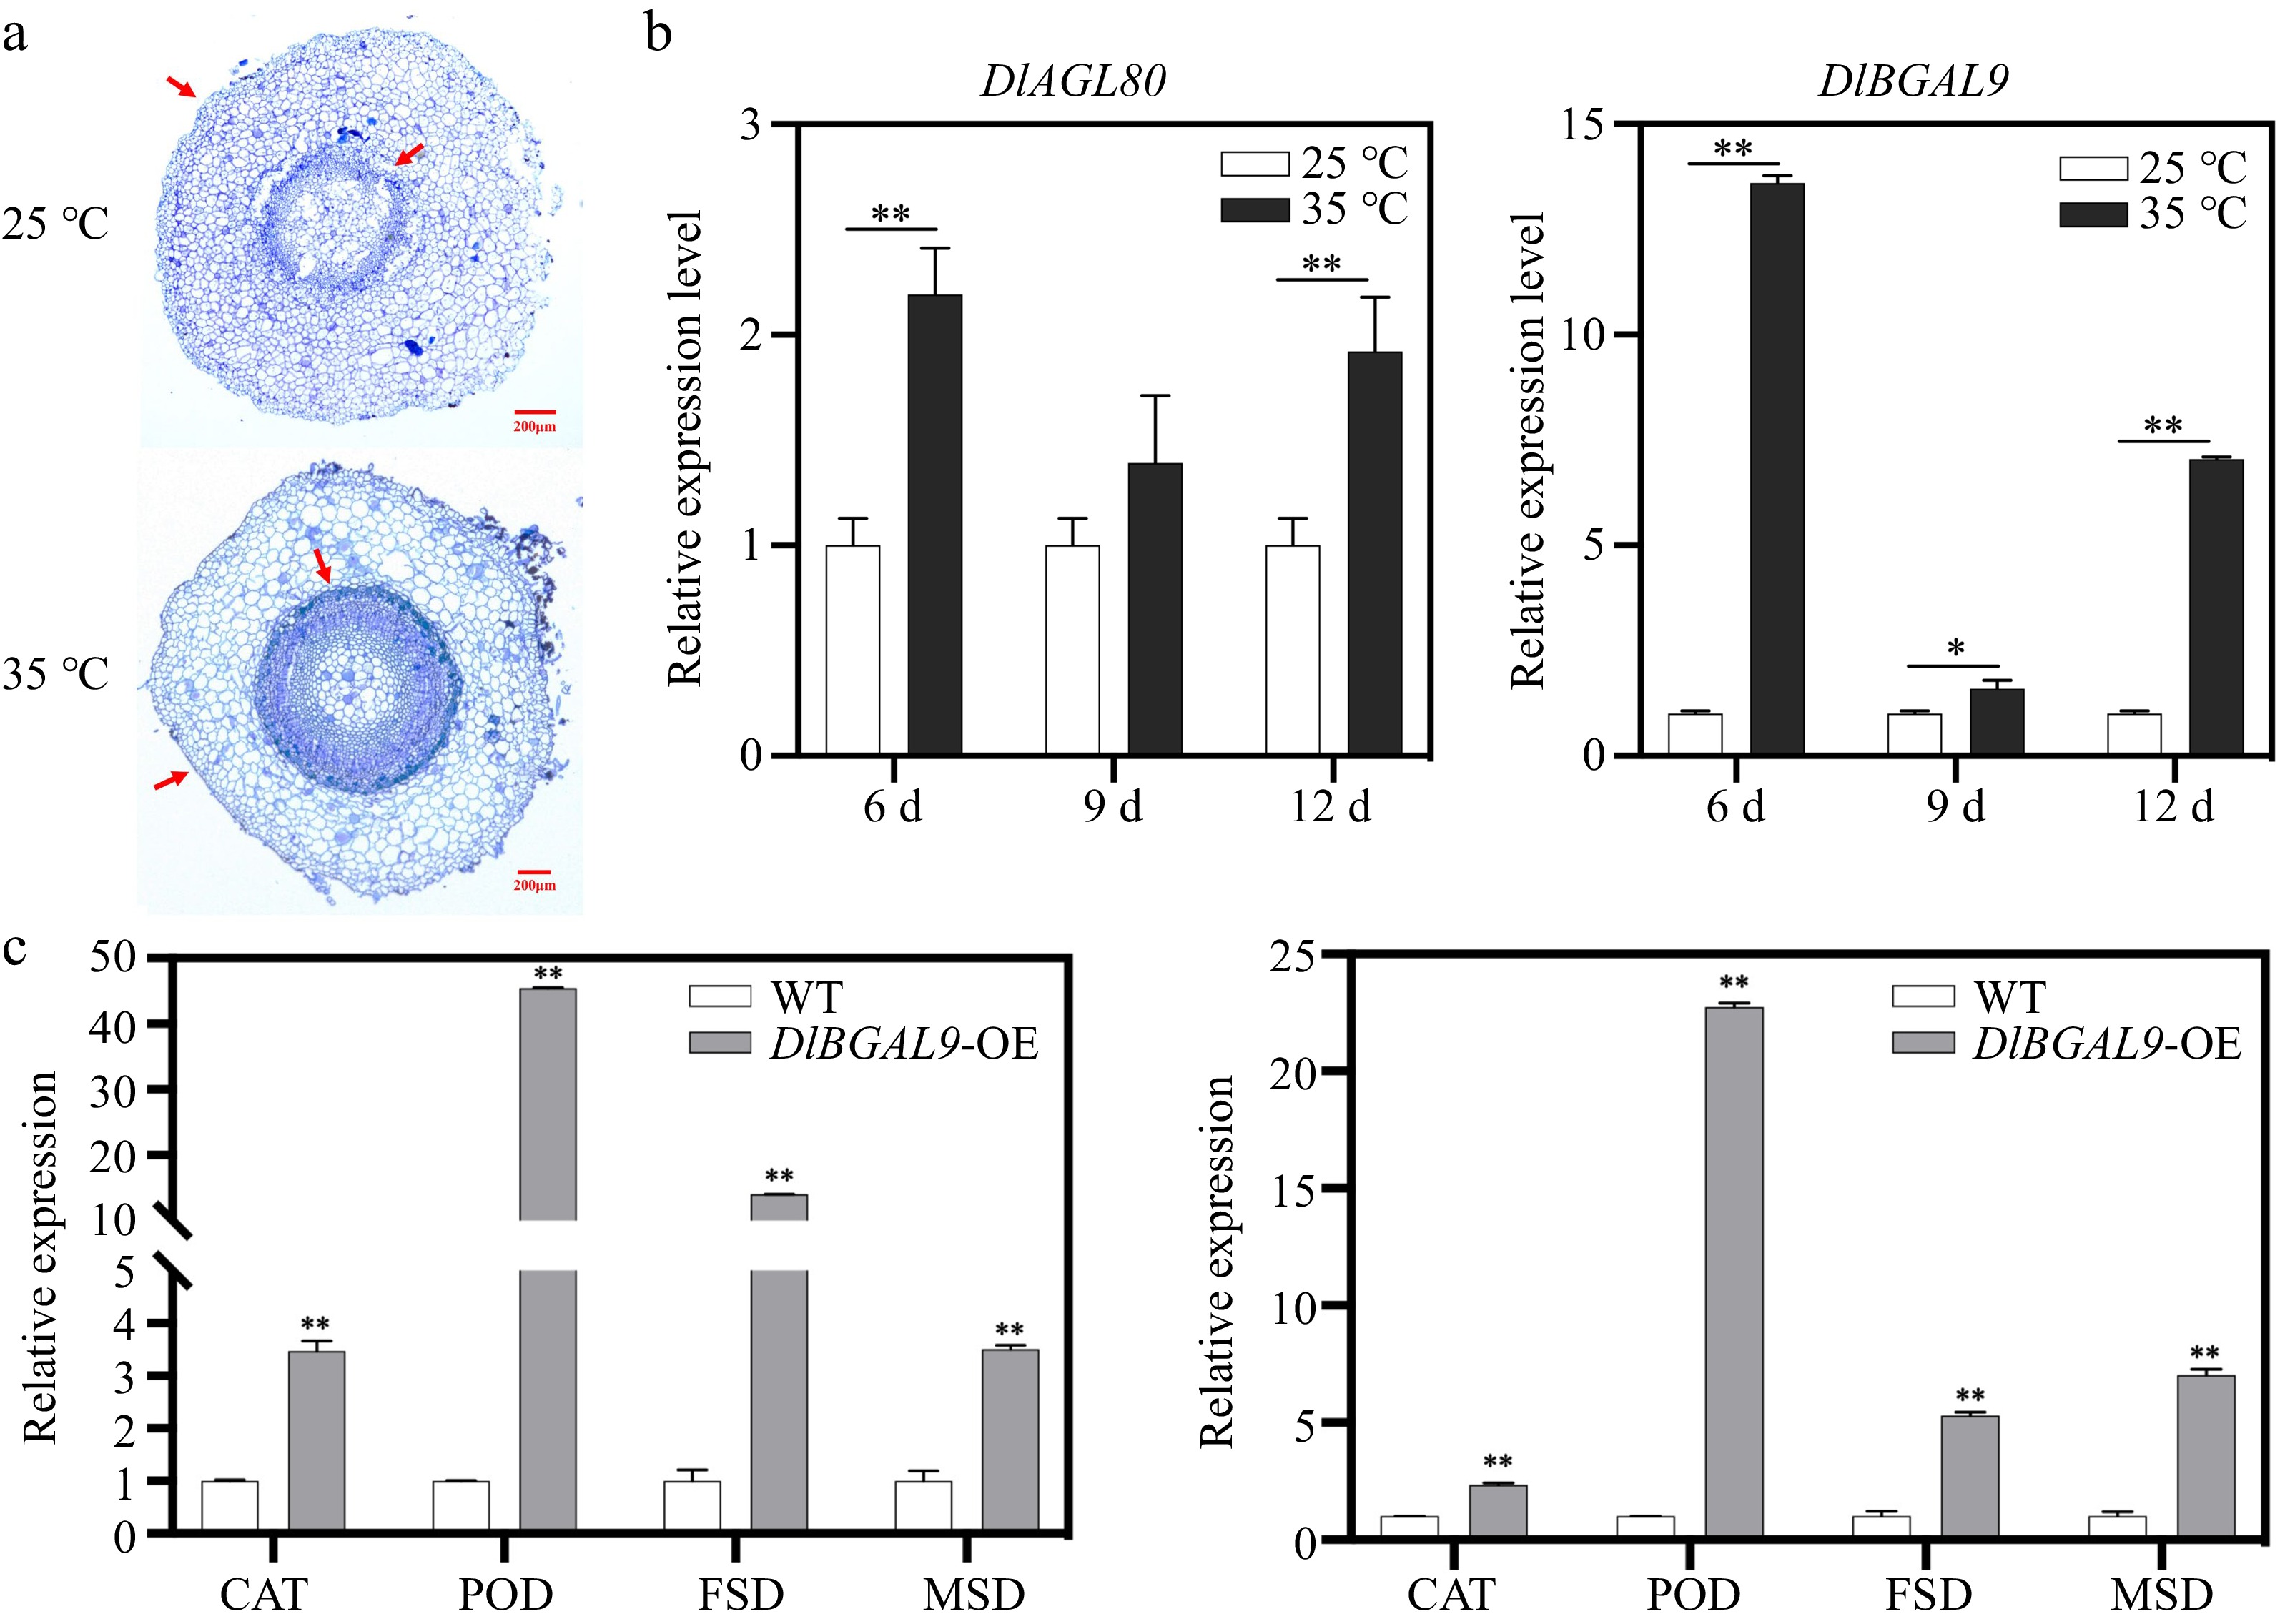
Figure 7.
Expression pattern analysis of DlBGAL9 and DlAGL80 under heat stress in longan hairy root. (a) Anatomical and morphological observations of longan hairy root under heat stress. Arrows indicate the position of cell wall discrepancy. (b) Expression pattern analysis of DlAGL80 and DlBGAL9 under different days of heat stress in longan hairy root. (c) Expression profiles of ROS pathway related genes in WT, DlBGAL9-OE and DlAGL80-OE longan hairy roots. (*p < 0.05, **p < 0.01).
-
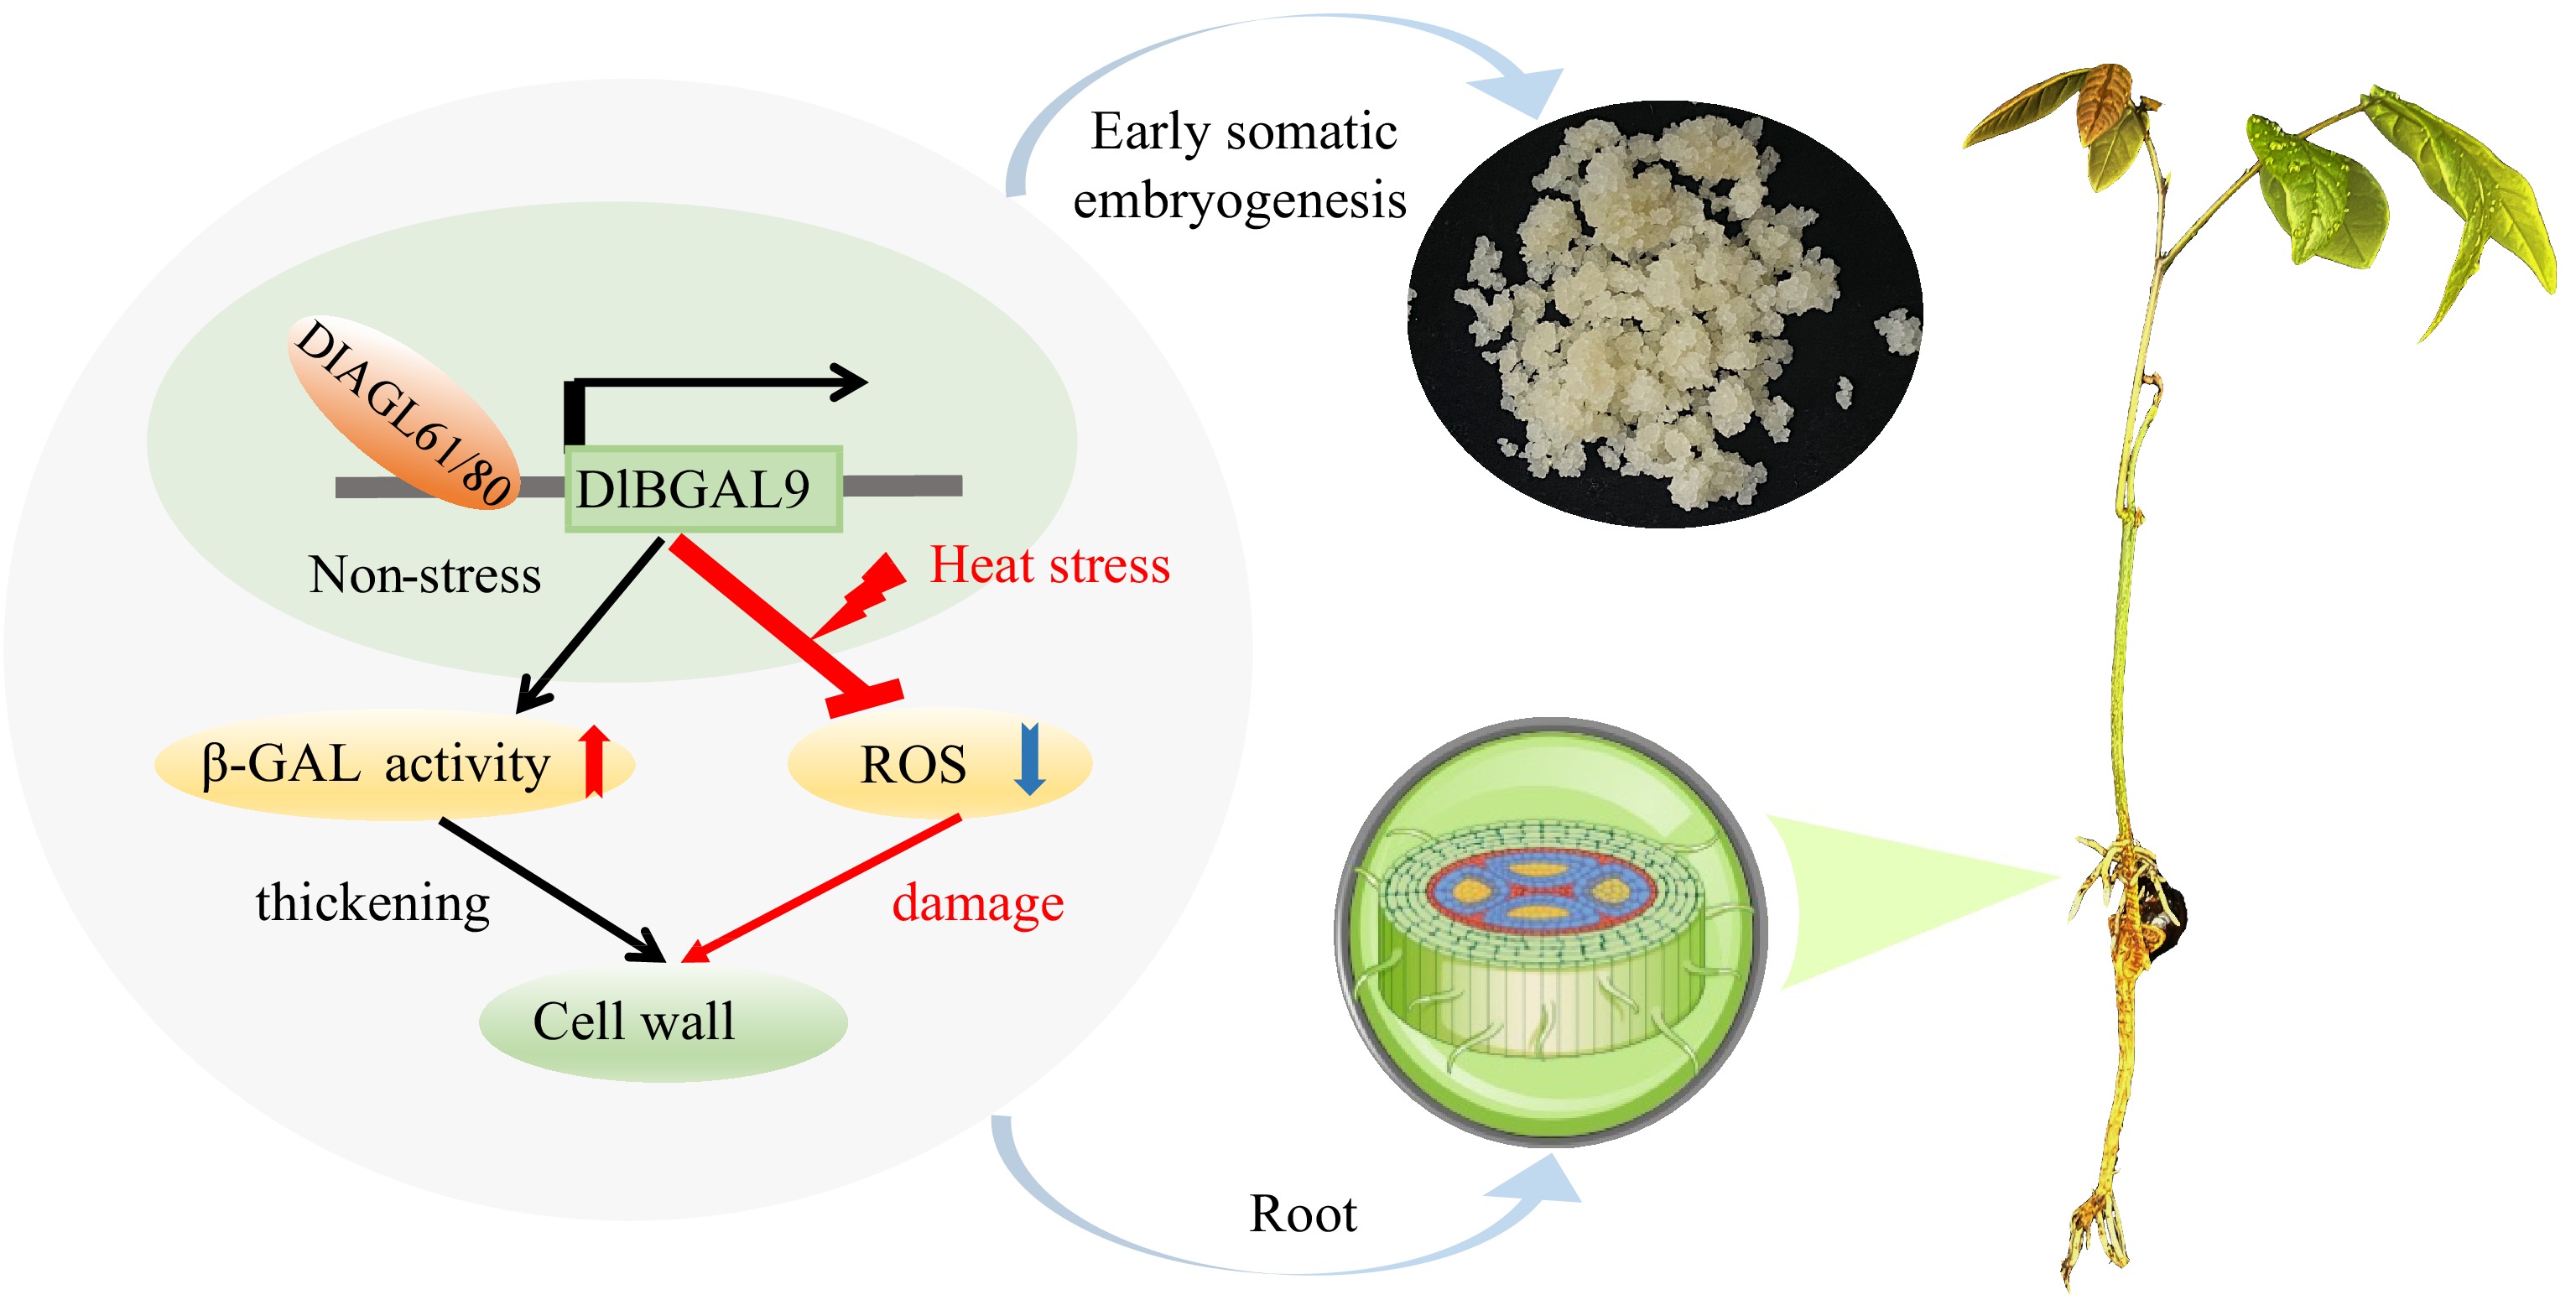
Figure 8.
Proposed model of the underlying mechanism via which TFs DlAGL61/80 and DlBGAL9 regulate early somatic embryogenesis and responding to heat stress in longan. DlAGL61/80 activate the expression of DlBGAL9, leading to upregulation of β-GAL activity and thickening of cell walls. Reduce the content of ROS and reduce damage under heat stress. Arrow for promotion and blunt ends indicate inhibition, respectively. Red arrow represents upregulation of β-GAL activity and blue arrow represents downregulation of ROS content.
-
Gene ID Gene name Size (aa) Molecular weight/kD PI Instability coefficient Hydrophilicity Dlo000174 BGAL1-1 844 93,311.98 8.25 37.76 −0.287 Dlo000176 BGAL1-2 839 92,852.64 7.96 39.56 −0.267 Dlo000290 BGAL15-1 825 92,233.81 5.56 35.42 −0.444 Dlo002805 BGAL9 889 99,793.27 6.35 35.27 −0.271 Dlo006281 BGAL17 710 79,011.06 6.25 35.45 −0.211 Dlo006300 BGAL1-3 844 93,575.84 8.4 38.83 −0.196 Dlo013472 BGAL5 734 82,104.46 8.8 36.87 −0.276 Dlo014416 BGAL16-1 716 80,274.25 9.34 41.46 −0.262 Dlo014417 BGAL16-2 832 93,191.23 8.62 36.02 −0.416 Dlo015024 BGAL16-3 838 93,942.65 6.32 39.86 −0.208 Dlo015487 BGAL13-1 444 50,149.01 9.4 38.7 −0.233 Dlo015584 BGAL3-1 843 93,502.26 7.25 38.92 −0.221 Dlo016393 BGAL6 718 81,101.64 5.46 36.14 −0.226 Dlo016396 BGAL16-4 846 94,734.74 6.92 40.98 −0.33 Dlo021540 BGAL8-1 842 93,433.6 5.4 39.83 −0.16 Dlo023146 BGAL13-2 864 96,671.78 8.37 36.43 −0.214 Dlo023292 BGAL3-2 660 73,921.74 7.3 34.86 −0.29 Dlo026229 BGAL8-2 853 92,871.32 8.07 39.94 −0.192 Dlo026230 BGAL8-3 612 67,240.37 7.56 36.87 −0.325 Dlo029560 BGAL15-2 828 93,079.31 6.56 34.06 −0.305 Table 1.
Basic parameter analysis of DlBGAL family.
Figures
(8)
Tables
(1)