-
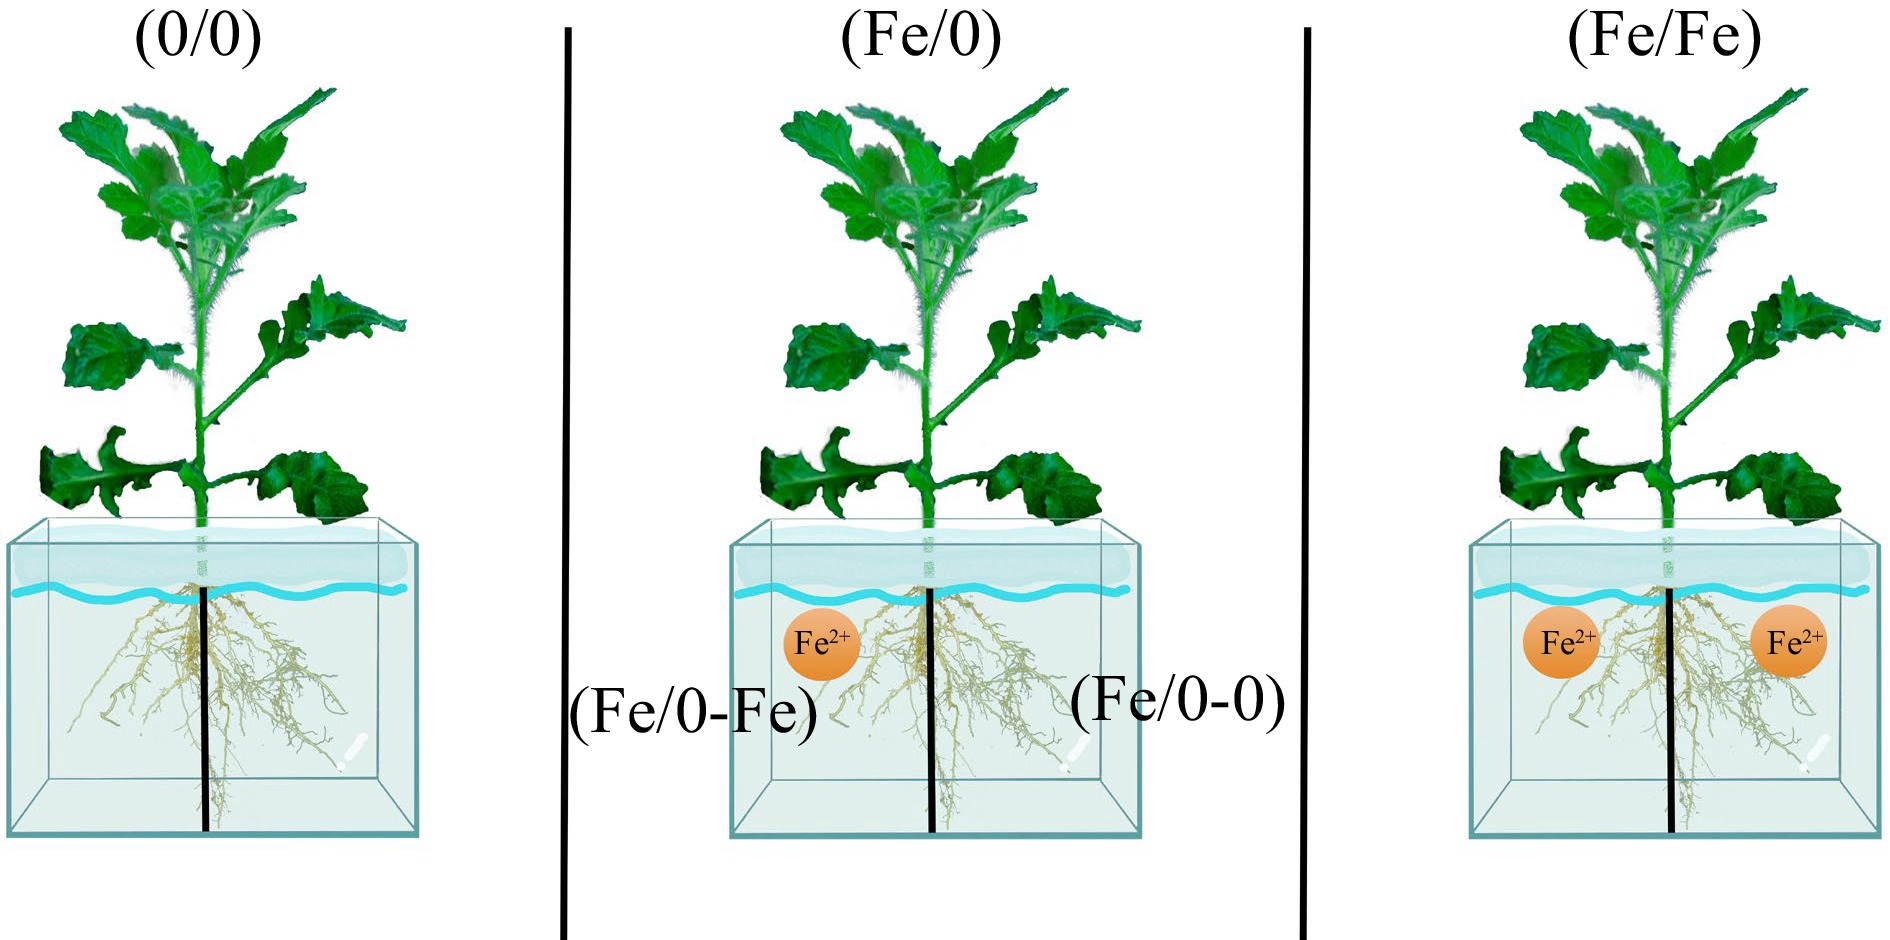
Figure 1.
Demonstration of root split-root experiments.
-
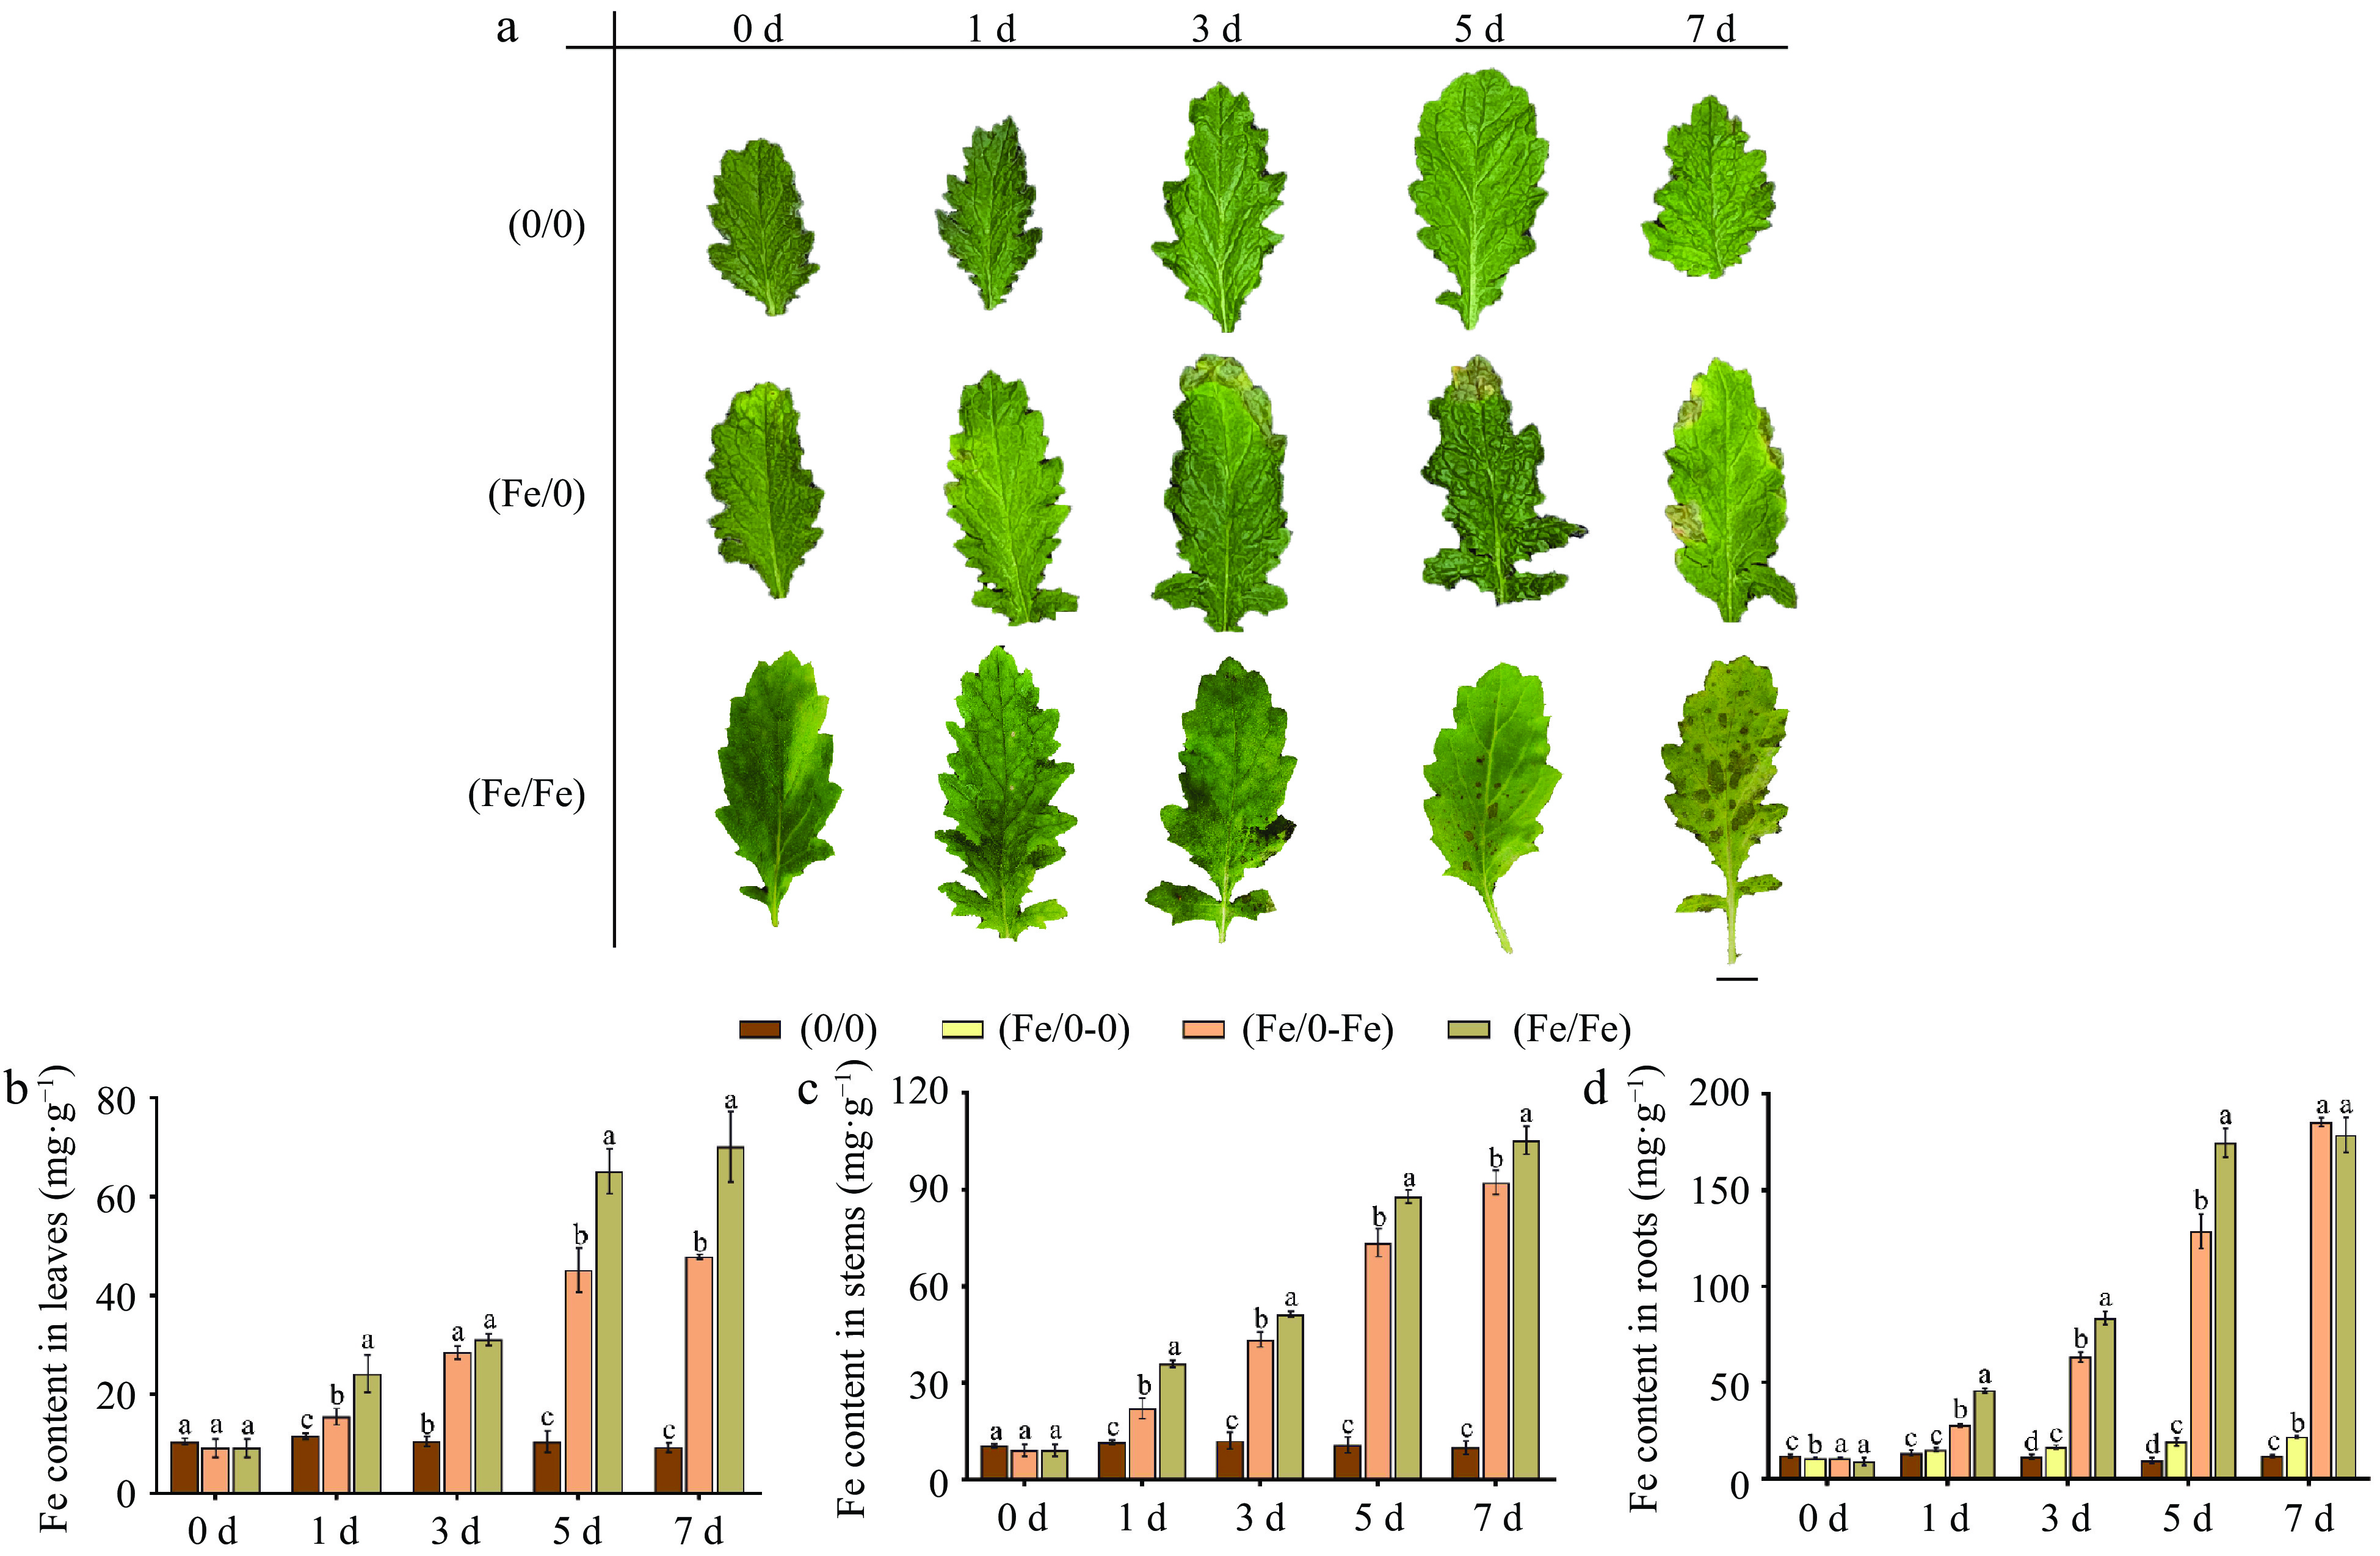
Figure 2.
(a) Leaf phenotypes in split-root system under Fe2+ treatment of C. blinii. Bar = 1 cm. Fe content in (b) leaves, (c) stems and (d) roots in split-root system under Fe2+ treatment. The concentration of Fe2+ treatment was 200 μM. All experiments were performed using at least three biological replicates and error bars indicate standard deviations (± SD). Different letters indicate significant differences at the p < 0.05 level when comparing different experimental groups.
-
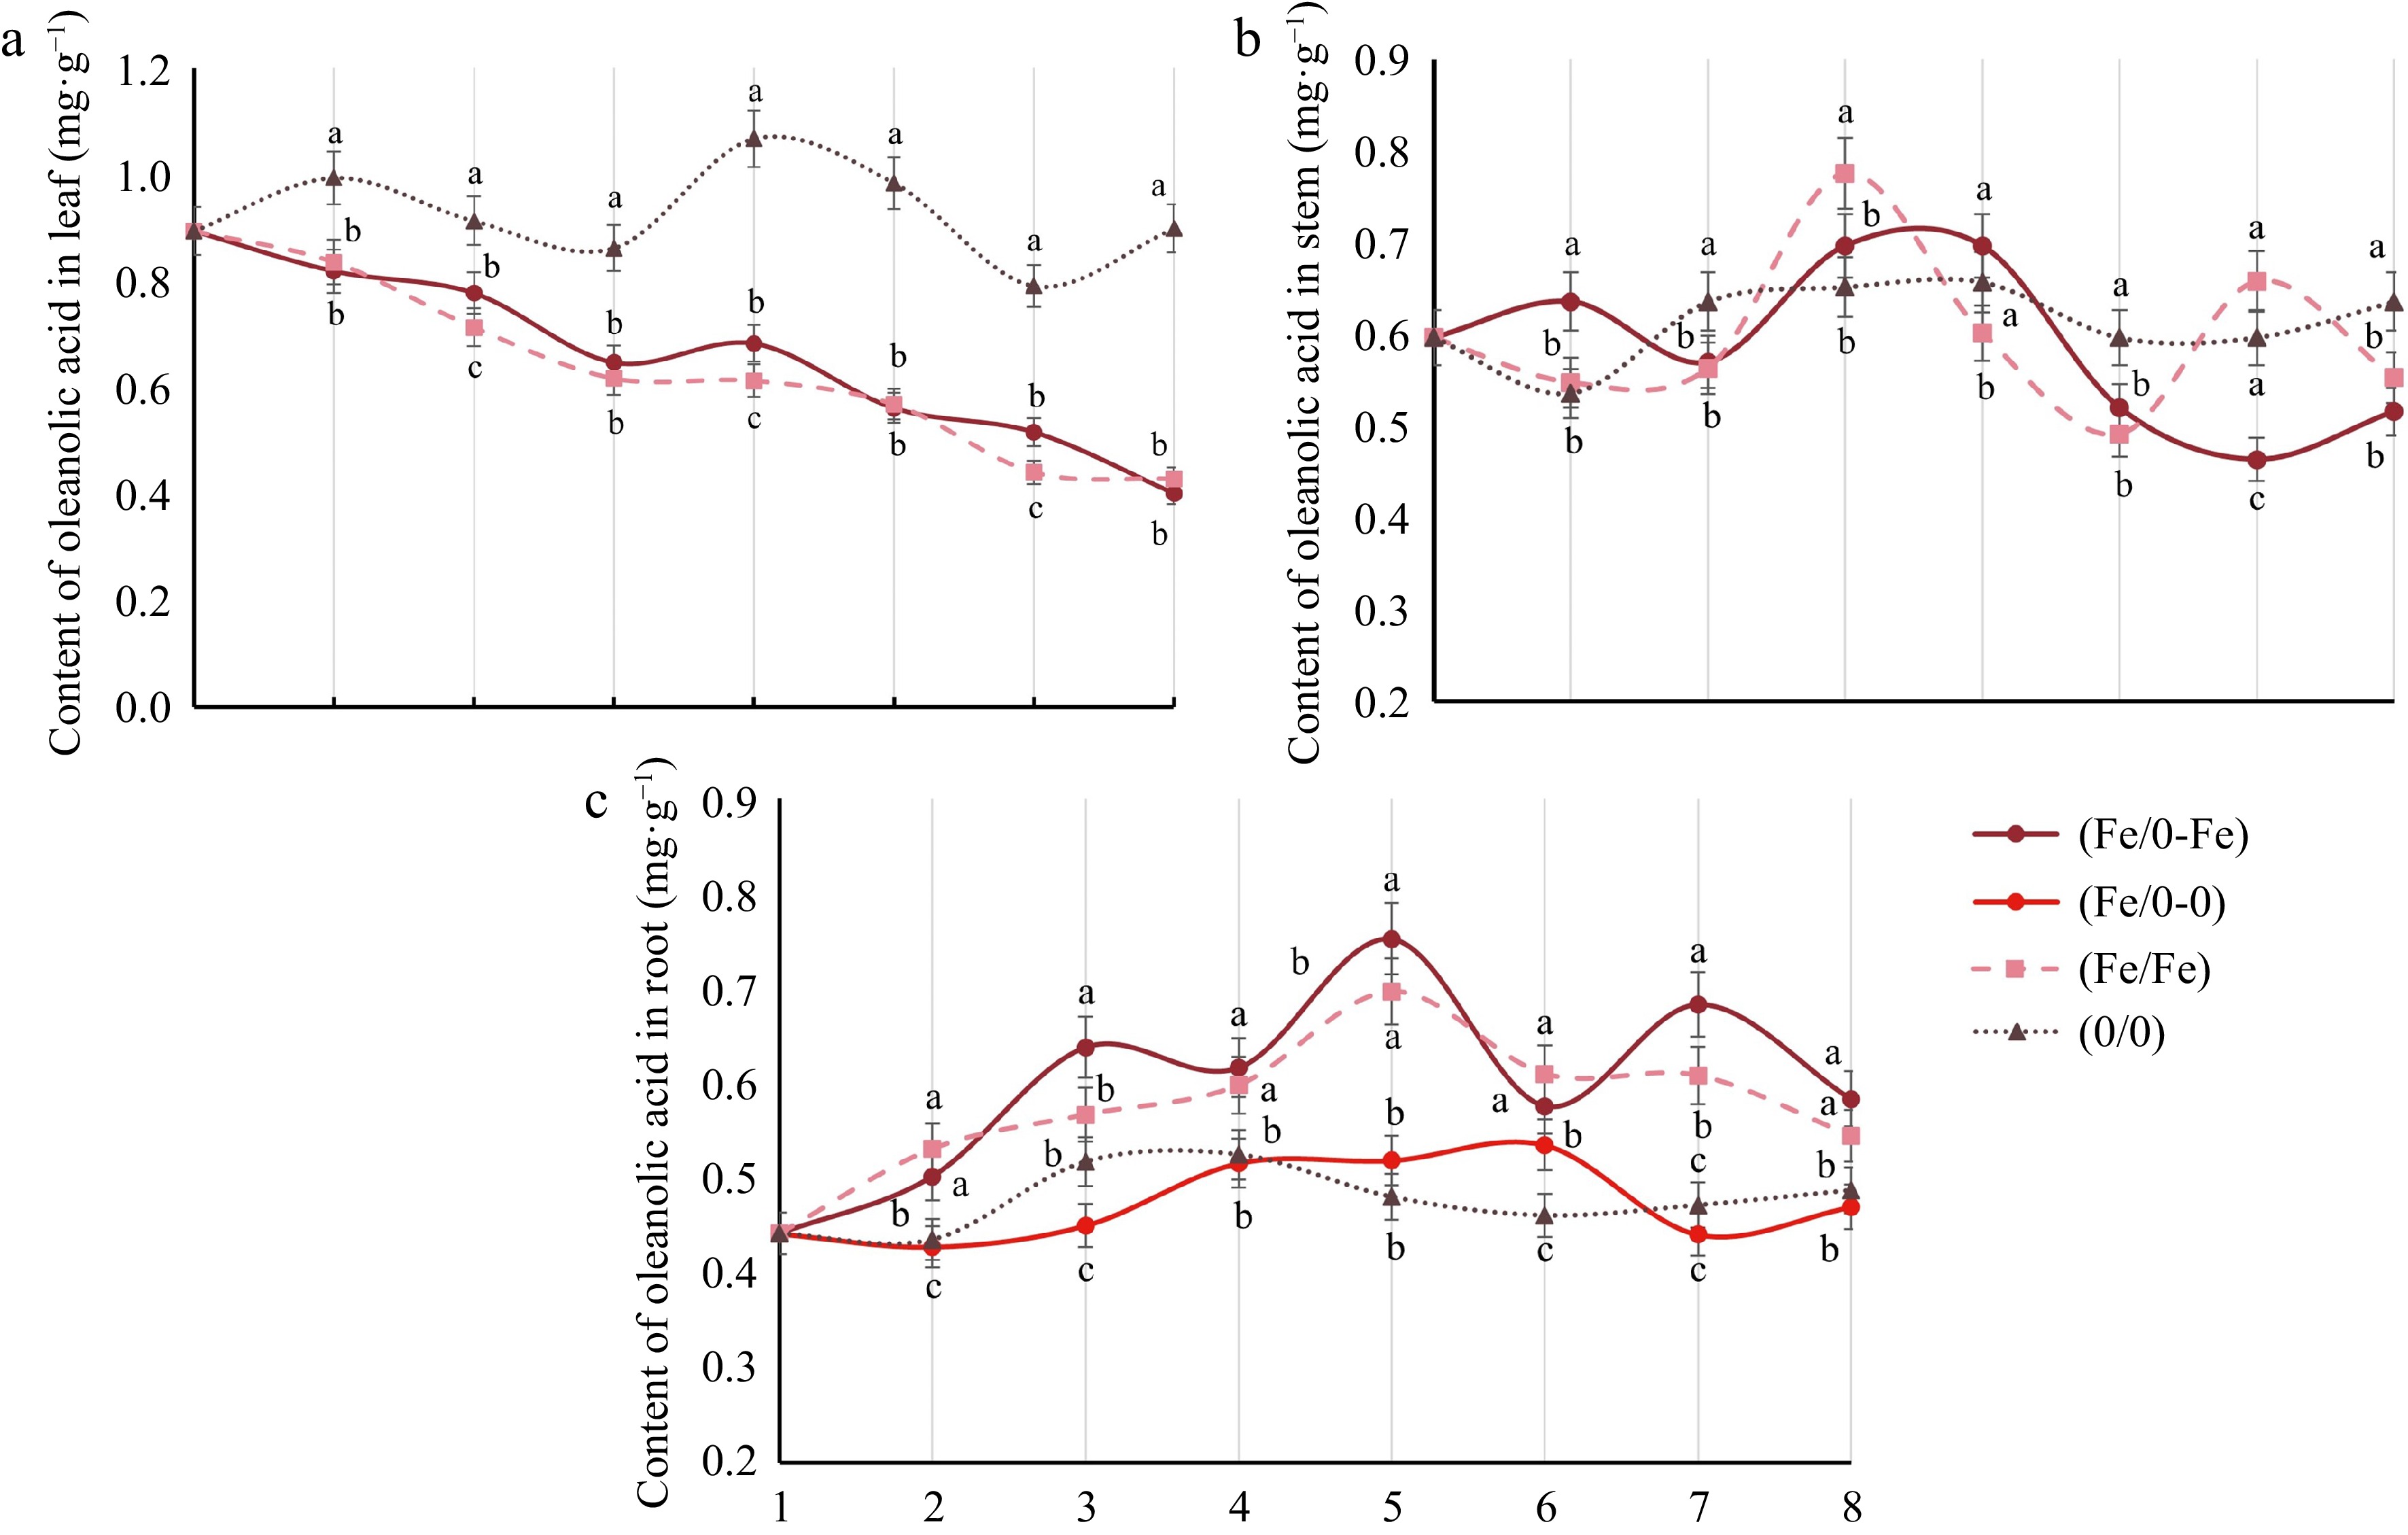
Figure 3.
Analysis of oleanolic acid in various tissues of C. blinii. Oleanolic acid in (a) leaves, (b) stems and (c) roots under Fe2+ treatment with split-root system. All experiments were performed using at least three biological replicates and error bars indicate standard deviations (± SD). Different letters indicate significant differences at the p < 0.05 level when comparing different experimental groups.
-
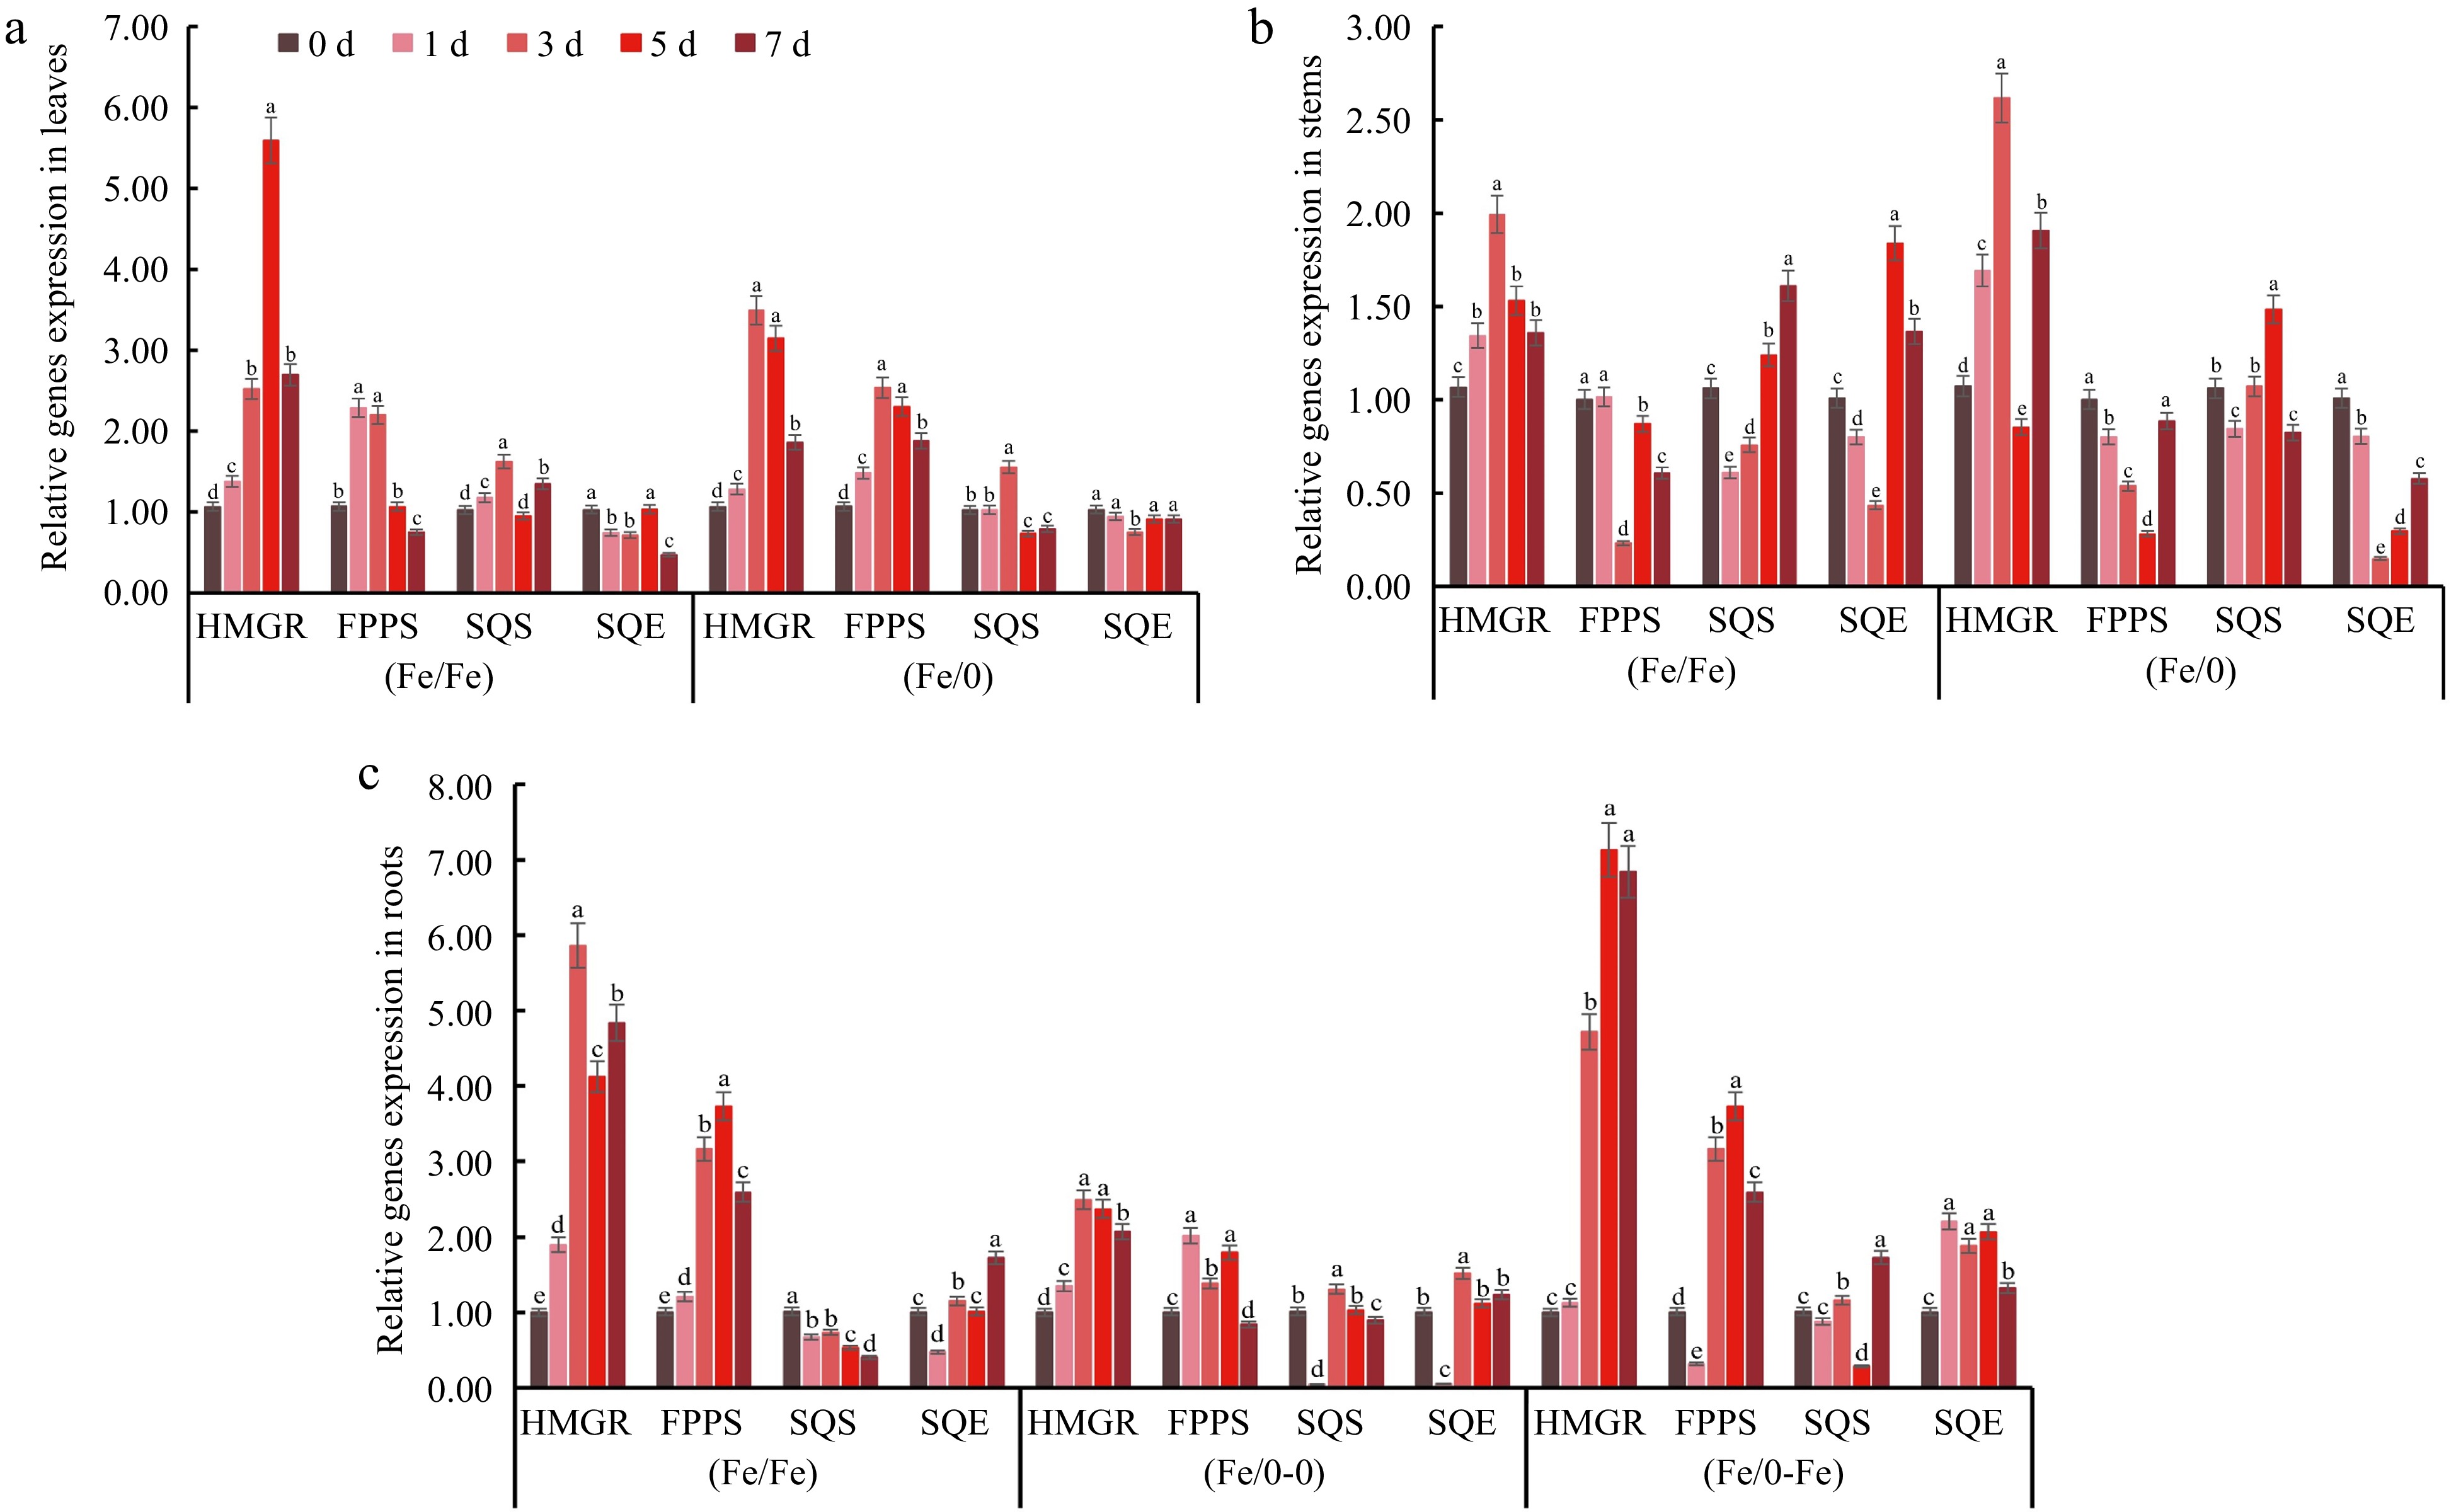
Figure 4.
Relative expression of key MVA pathway genes in various tissues. The genes relative expression in (a) leaves, (b) stems and (c) roots under Fe2+ treatment with split-root system. All experiments were performed using at least three biological replicates and error bars indicate standard deviations (± SD). Different letters indicate significant differences at the p < 0.05 level when comparing different experimental groups. The 2−ΔΔCᴛ method was used to determine the relative expression and the genes relative expression of (0/0) group were set to '1'.
-
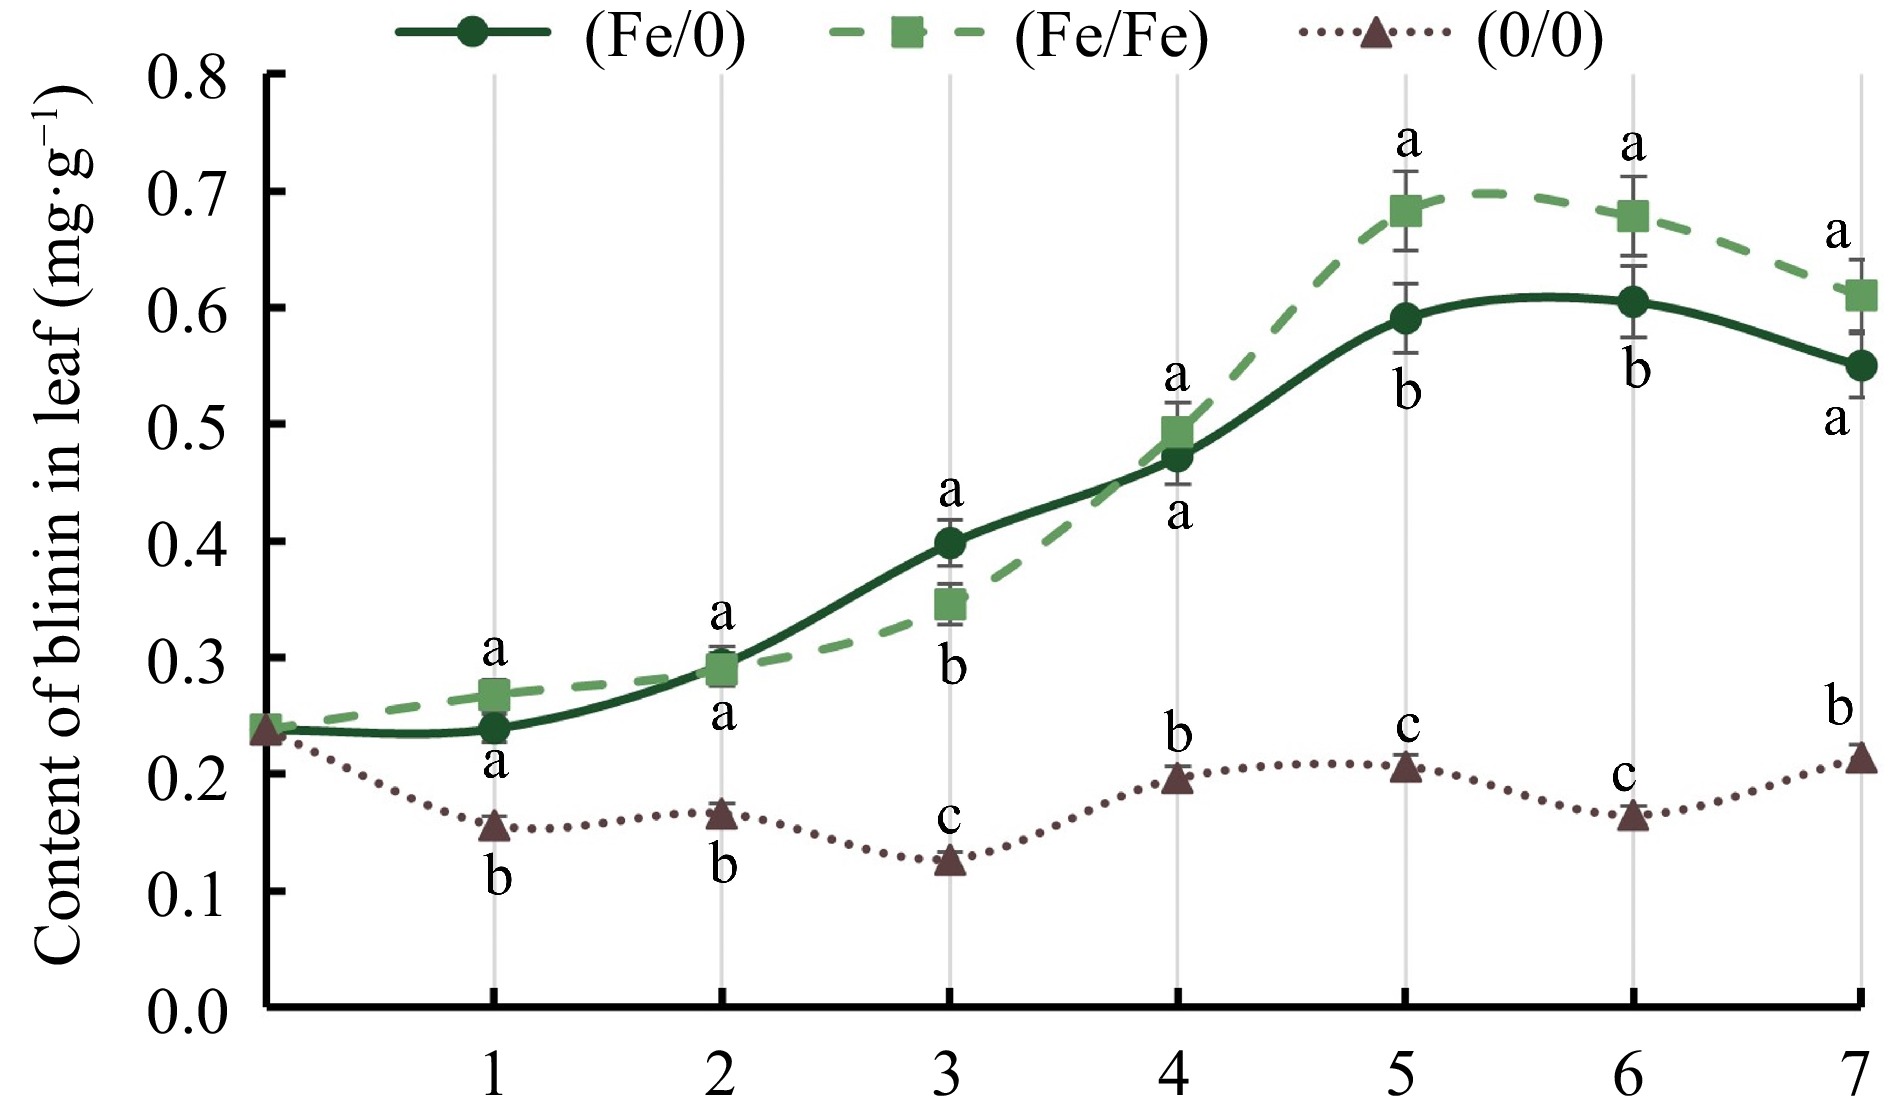
Figure 5.
Analysis of blinin in leaves of C. blinii. All experiments were performed using at least three biological replicates and error bars indicate standard deviations (± SD). Different letters indicate significant differences at the p < 0.05 level when comparing different experimental groups.
-
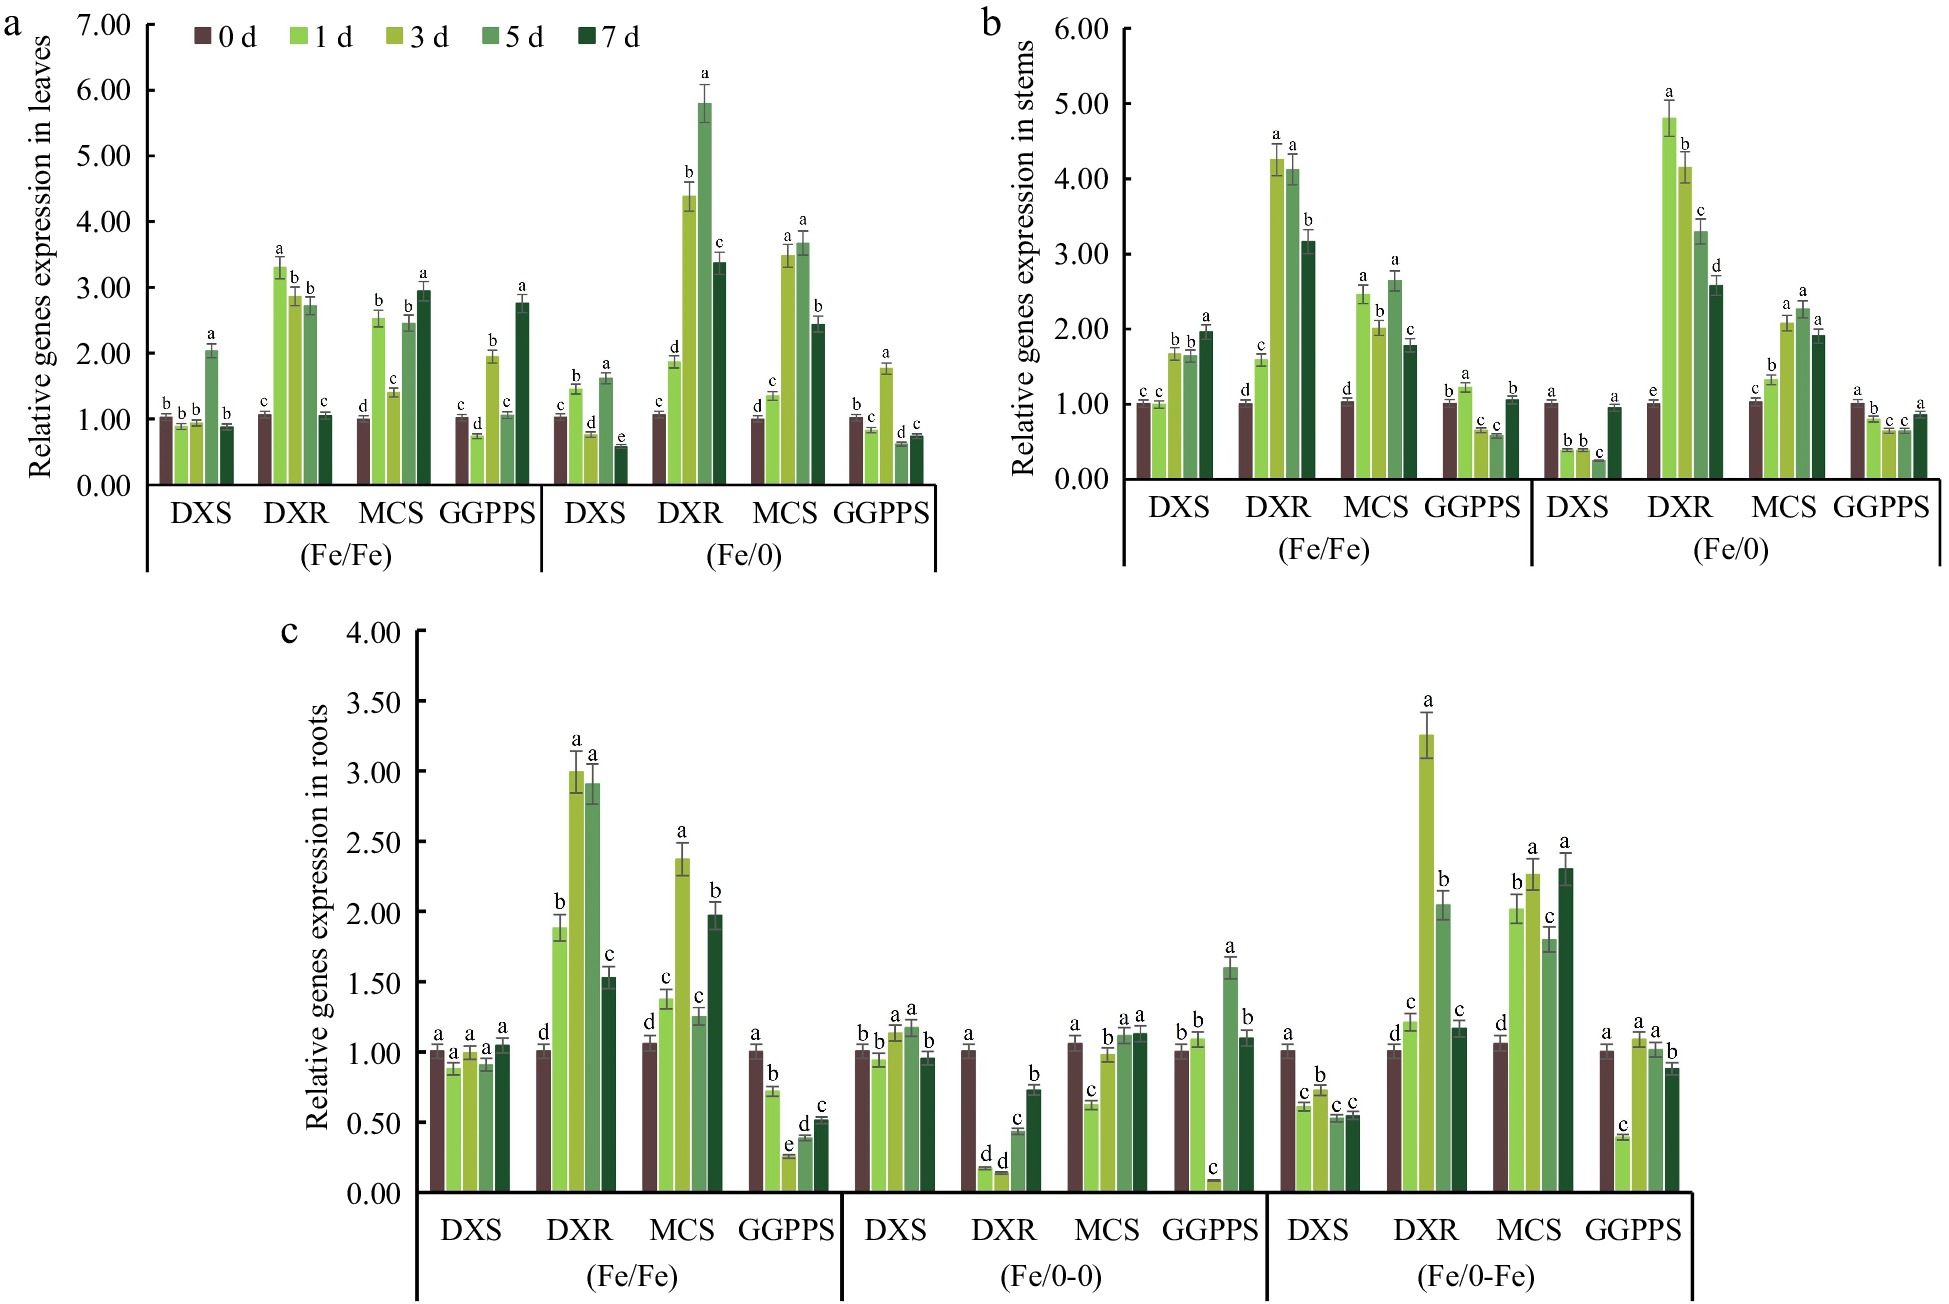
Figure 6.
Relative expression of key MEP pathway genes in various tissues. The gene relative expression in (a) leaves, (b) stems and (c) roots under Fe2+ treatment with split-root system. All experiments were performed using at least three biological replicates and error bars indicated standard deviations (± SD). Different letters indicate significant differences at the p < 0.05 level when comparing different experimental groups. The 2−ΔΔCᴛ method was used to determine the relative expression and the genes relative expression of (0/0) group were set to '1'.
-
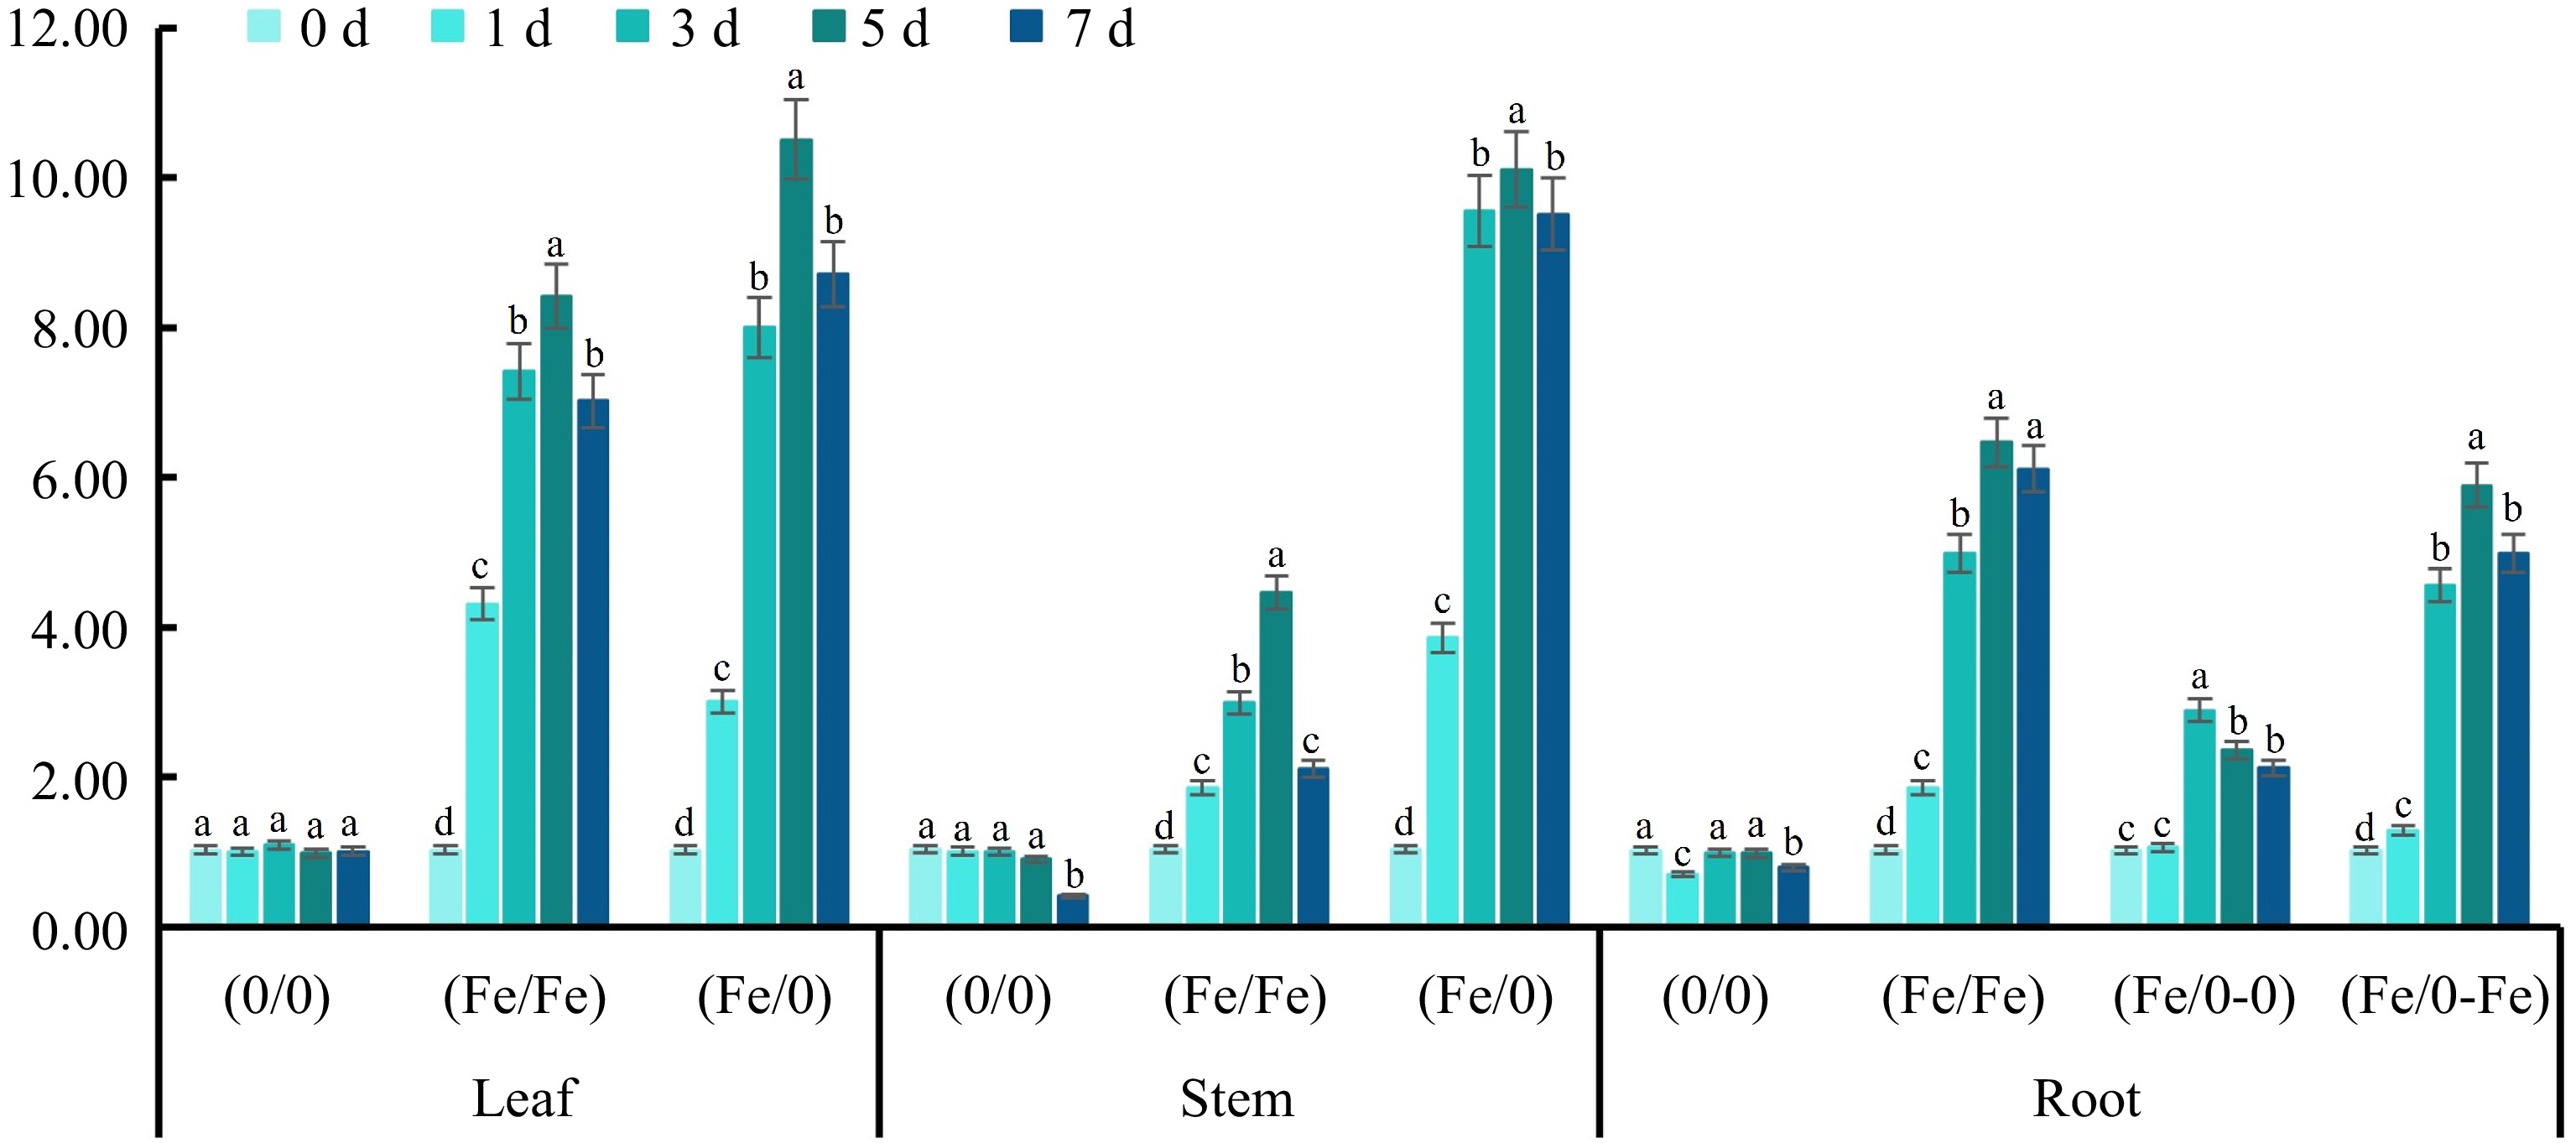
Figure 7.
Relative expression of CbPDR in various tissues. The relative expression of CbPDR in (a) leaves, (b) stems and (c) roots under Fe2+ treatment with split-root system. All experiments were performed using at least three biological replicates and error bars indicated standard deviations (± SD). Different letters indicate significant differences at the p < 0.05 level when comparing different experimental groups. The 2−ΔΔCᴛ method was used to determine the relative expression and the genes relative expression of (0/0) group were set to '1'.
-
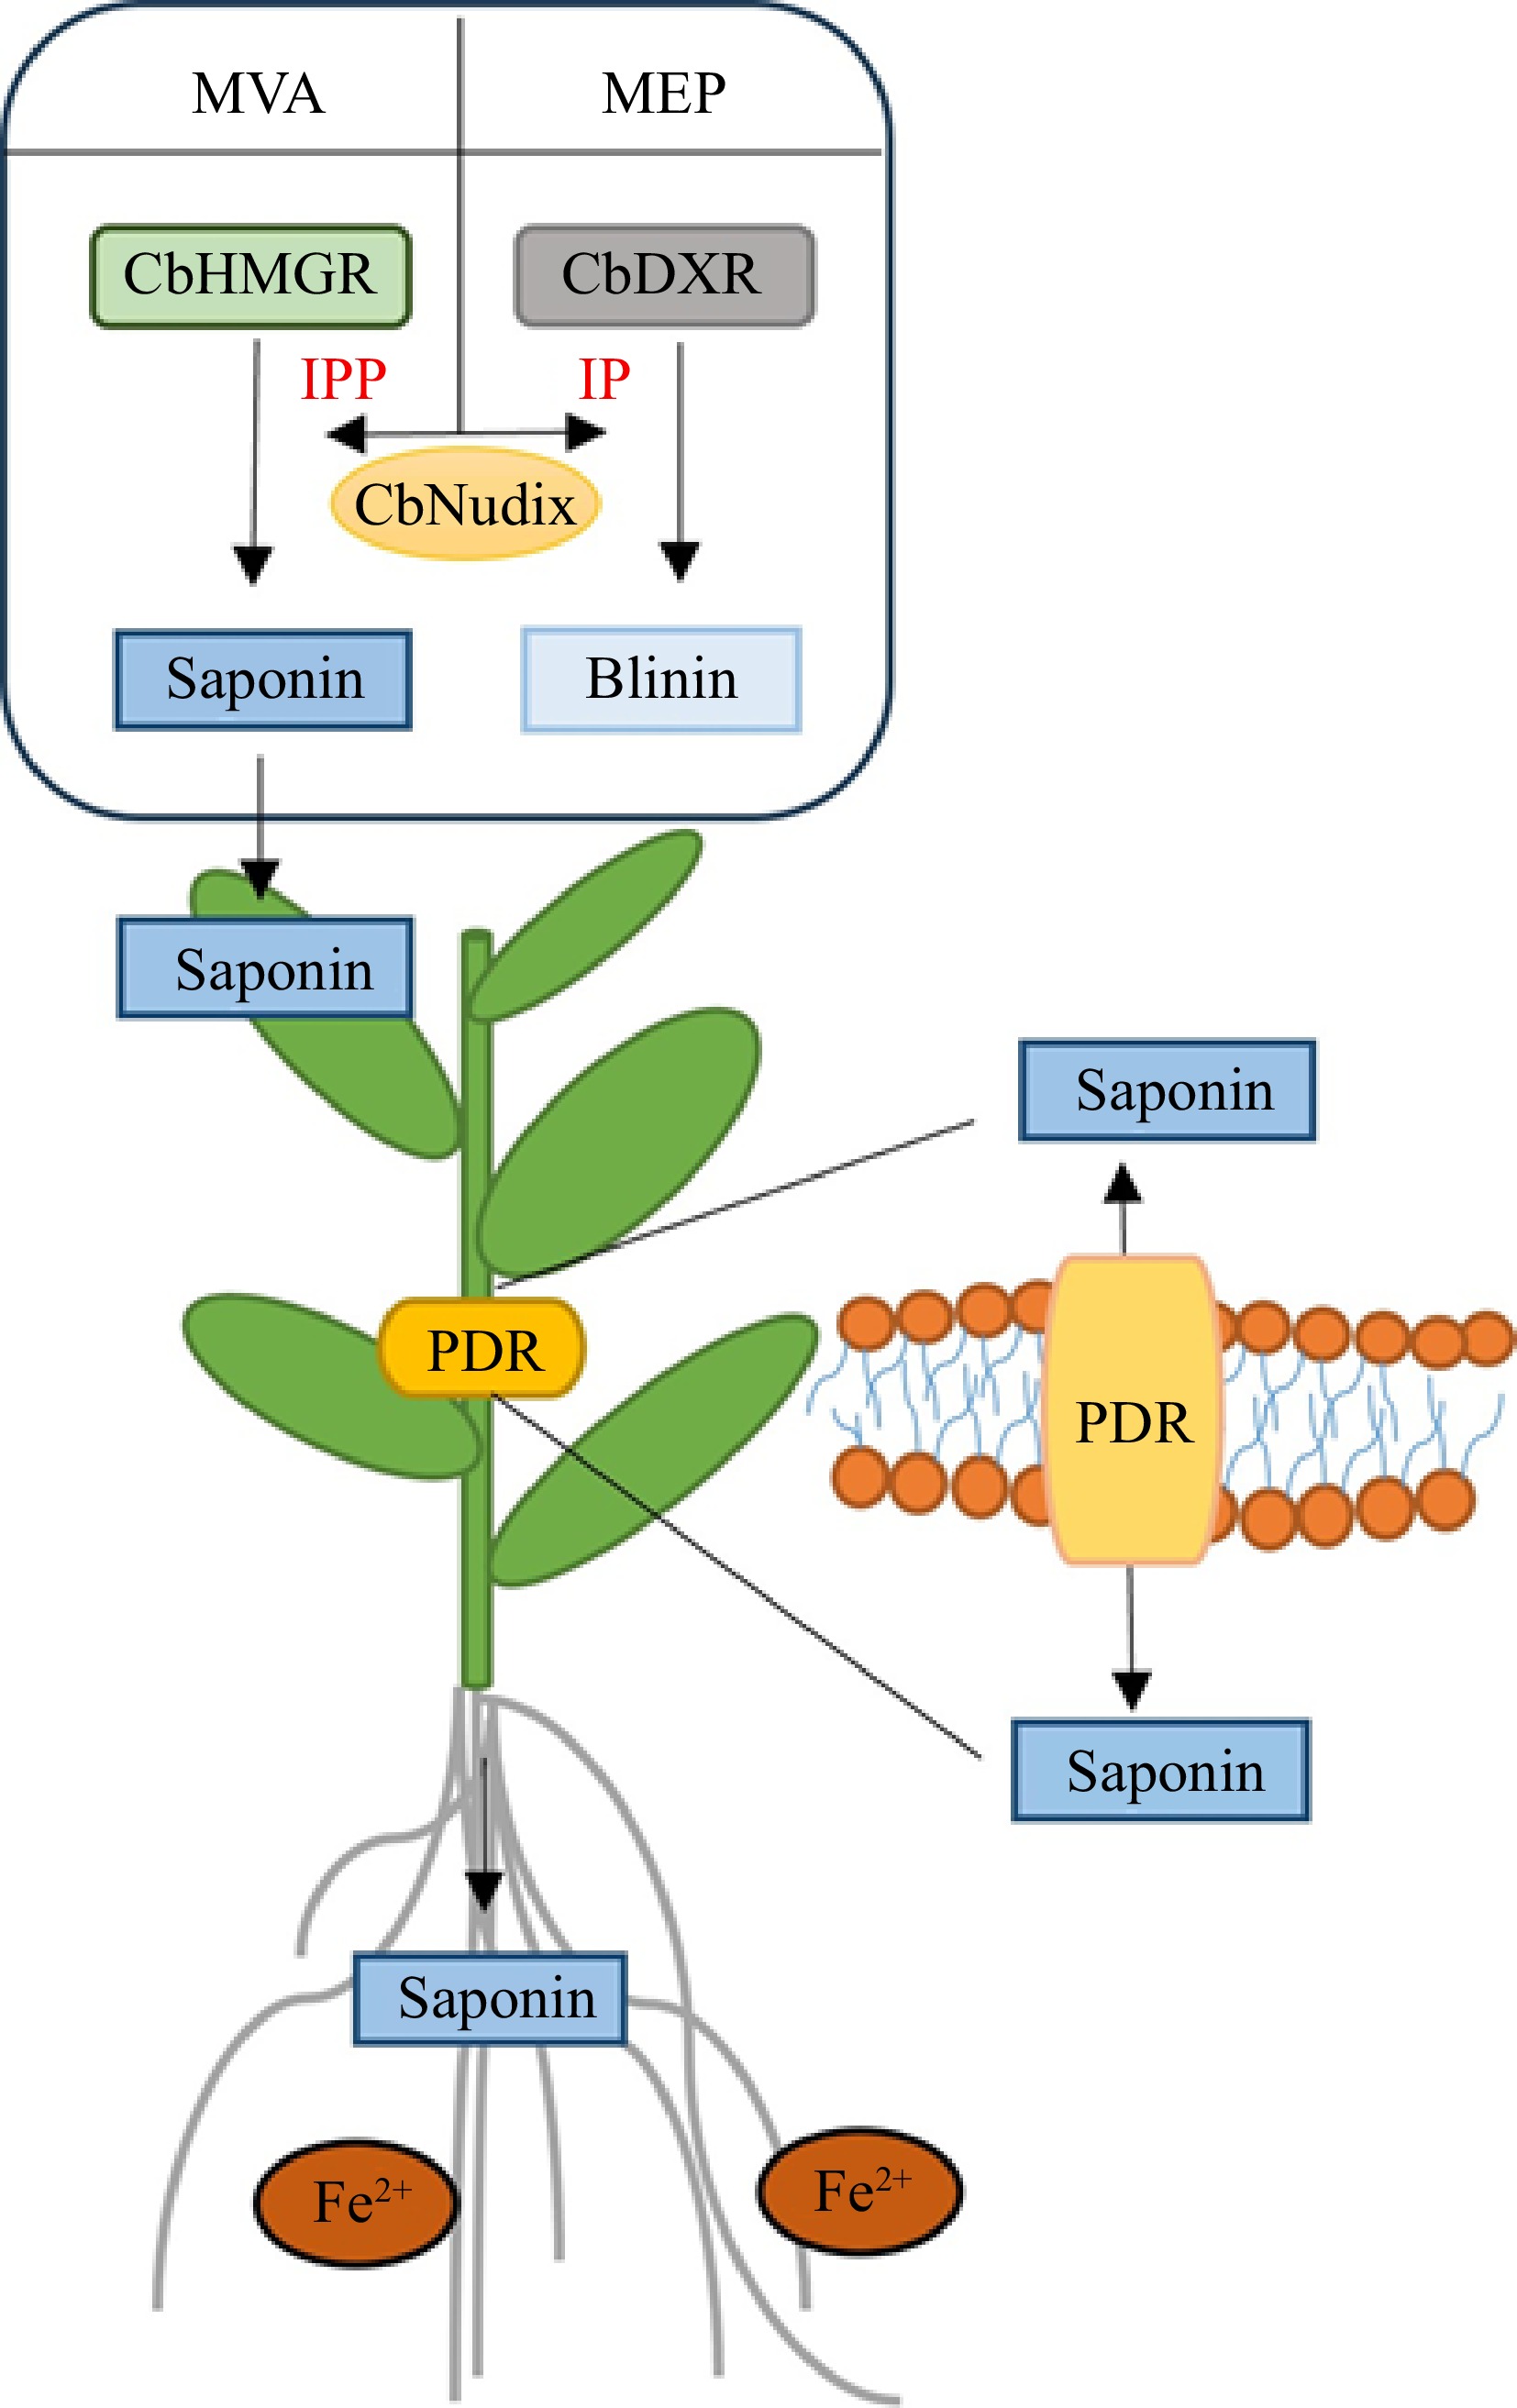
Figure 8.
A model for the transportation of triterpenoid saponins by PRD under Fe2+. Under Fe2+, the activity of the MEP metabolism pathway was enhanced within C. blinii. The solid line represents signal transduction.
-
Sample 0 d 1 d 2 d 3 d 4 d 5 d 6 d 7 d Stems (0/0) 0.013872 0.011378 n.d. 0.02471 n.d. n.d. 0.012124 0.013872 Stems (Fe/Fe) 0.013872 n.d. n.d. 0.021454 n.d. 0.01274 n.d. 0.013872 Stems (Fe/0) 0.013872 0.010663 n.d. n.d. n.d. n.d. n.d. 0.013872 Roots (0/0) n.d. 0.011252 n.d. n.d. n.d. 0.01274 n.d. n.d. Roots (Fe/Fe) n.d. 0.009729 n.d. n.d. 0.0124 n.d. n.d. n.d. Roots (Fe/0-Fe) n.d. n.d. n.d. n.d. n.d. n.d. n.d. n.d. Roots (Fe/0-0) n.d. n.d. n.d. 0.010065 n.d. n.d. n.d. n.d. 'n.d.' represents that the blinin content in tissue samples didn't reach the minimum detection limit of HLPC. Unit: (mg·g−1). Table 1.
Blinin content in stems and roots.
Figures
(8)
Tables
(1)