ARTICLE   Open Access    

Effect of rhizospheric Fe2+ on terpenoid biosynthesis and accumulation within Conyza blinii H. Lév.

  • # Authors contributed equally: Maojia Wang, Ming Yang

More Information
  • Received: 25 August 2023
    Revised: 27 December 2023
    Accepted: 08 January 2024
    Published online: 26 January 2024
    Tropical Plants  3 Article number: e003 (2024)  |  Cite this article
  • The activities of MEP/MVA pathway were stimulated in all tissues by the additional rhizospheric Fe2+.

    Olas was transported from leaves to roots in response to Fe2+, which was demonstrated by the split-root system.

    The cross-tissue transportation of Olas may be mediated by the PDR transporters.

  • Conyza blinii (C. blinii) is a herbaceous plant that is distributed in dry-hot valleys in southwest China. Metabolites of medicinal plants are commonly associated with environmental factors. Dissipation of soil water caused by heat increases soil metal levels. Oleanane-type triterpenoid saponins (Olas) are the main active medicinal ingredients in C. blinii. Here, we explore the effect of Fe2+ on terpenoid metabolism, especially the mevalonic acid (MVA) pathway. The results indicate that the activity of the MVA and methylerythritol phosphate (MEP) metabolic pathways are increased by Fe2+ and that the expression of key enzyme-encoding genes of metabolic pathways3-hydroxy-3-methylglutaryl coenzyme A reductase (CbHMGR), Farnesyl pyrophosphate synthase (CbFPPS) and 1-deoxy-D-xylulose-5-phosphate synthase (CbDXS) are also significantly upregulated. Moreover, the triterpenoid saponin content in the leaves gradually decreased, but in the roots, it increased. Furthermore, Olas were confirmed to be transported from leaves to the roots by the root-split system, which was accompanied by high-level expression of pleiotropic drug resistance (CbPDR). Above all, our experiments revealed that Olas of C. blinii were actively synthesized in the leaves and transported to the roots via the CbPDR in response to the stimulation of Fe2+.
    Graphical Abstract
  • Aquaporin’s (AQPs) are small (21–34 kD) channel-forming, water-transporting trans-membrane proteins which are known as membrane intrinsic proteins (MIPs) conspicuously present across all kingdoms of life. In addition to transporting water, plant AQPs act to transport other small molecules including ammonia, carbon dioxide, glycerol, formamide, hydrogen peroxide, nitric acid, and some metalloids such as boron and silicon from the soil to different parts of the plant[1]. AQPs are typically composed of six or fewer transmembrane helices (TMHs) coupled by five loops (A to E) and cytosolic N- and C-termini, which are highly conserved across taxa[2]. Asparagine-Proline-Alanine (NPA) boxes and makeup helices found in loops B (cytosolic) and E (non-cytosolic) fold back into the protein's core to form one of the pore's two primary constrictions, the NPA region[1]. A second filter zone exists at the pore's non-cytosolic end, where it is called the aromatic/arginine (ar/R) constriction. The substrate selectivity of AQPs is controlled by the amino acid residues of the NPA and ar/R filters as well as other elements of the channel[1].

    To date, the AQP gene families have been extensively explored in the model as well as crop plants[39]. In seed plants, AQP distributed into five subfamilies based on subcellular localization and sequence similarities: the plasma membrane intrinsic proteins (PIPs; subgroups PIP1 and PIP2), the tonoplast intrinsic proteins (TIPs; TIP1-TIP5), the nodulin26-like intrinsic proteins (NIPs; NIP1-NIP5), the small basic intrinsic proteins (SIPs; SIP1-SIP2) and the uncategorized intrinsic proteins (XIPs; XIP1-XIP3)[2,10]. Among them, TIPs and PIPs are the most abundant and play a central role in facilitating water transport. SIPs are mostly found in the endoplasmic reticulum (ER)[11], whereas NIPs homologous to GmNod26 are localized in the peribacteroid membrane[12].

    Several studies reported that the activity of AQPs is regulated by various developmental and environmental factors, through which water fluxes are controlled[13]. AQPs are found in all organs such as leaves, roots, stems, flowers, fruits, and seeds[14,15]. According to earlier studies, increased AQP expression in transgenic plants can improve the plants' tolerance to stresses[16,17]. Increased root water flow caused by upregulation of root aquaporin expression may prevent transpiration[18,19]. Overexpression of Tamarix hispida ThPIP2:5 improved osmotic stress tolerance in Arabidopsis and Tamarix plants[20]. Transgenic tomatoes having apple MdPIP1;3 ectopically expressed produced larger fruit and improved drought tolerance[21]. Plants over-expressing heterologous AQPs, on the other hand, showed negative effects on stress tolerance in many cases. Overexpression of GsTIP2;1 from G. soja in Arabidopsis plants exhibited lower resistance against salt and drought stress[22].

    A few recent studies have started to establish a link between AQPs and nanobiology, a research field that has been accelerating in the past decade due to the recognition that many nano-substances including carbon-based materials are valuable in a wide range of agricultural, industrial, and biomedical activities[23]. Carbon nanotubes (CNTs) were found to improve water absorption and retention and thus enhance seed germination in tomatoes[24,25]. Ali et al.[26] reported that Carbon nanoparticles (CTNs) and osmotic stress utilize separate processes for AQP gating. Despite lacking solid evidence, it is assumed that CNTs regulate the aquaporin (AQPs) in the seed coats[26]. Another highly noticed carbon-nano-molecule, the fullerenes, is a group of allotropic forms of carbon consisting of pure carbon atoms[27]. Fullerenes and their derivatives, in particular the water-soluble fullerols [C60(OH)20], are known to be powerful antioxidants, whose biological activity has been reduced to the accumulation of superoxide and hydroxyl[28,29]. Fullerene/fullerols at low concentrations were reported to enhance seed germination, photosynthesis, root growth, fruit yield, and salt tolerance in various plants such as bitter melon and barley[3032]. In contrast, some studies also reported the phytotoxic effect of fullerene/fullerols[33,34]. It remains unknown if exogenous fullerene/fullerol has any impact on the expression or activity of AQPs in the cell.

    Garden pea (P. sativum) is a cool-season crop grown worldwide; depending on the location, planting may occur from winter until early summer. Drought stress in garden pea mainly affects the flowering and pod filling which harm their yield. In the current study, we performed a genome-wide identification and characterization of the AQP genes in garden pea (P. sativum), the fourth largest legume crop worldwide with a large complex genome (~4.5 Gb) that was recently decoded[35]. In particular, we disclose, for the first time to our best knowledge, that the transcriptional regulations of AQPs by osmotic stress in imbibing pea seeds were altered by fullerol supplement, which provides novel insight into the interaction between plant AQPs, osmotic stress, and the carbon nano-substances.

    The whole-genome sequence of garden pea ('Caméor') was retrieved from the URGI Database (https://urgi.versailles.inra.fr/Species/Pisum). Protein sequences of AQPs from two model crops (Rice and Arabidopsis) and five other legumes (Soybean, Chickpea, Common bean, Medicago, and Peanut) were used to identify homologous AQPs from the garden pea genome (Supplemental Table S1). These protein sequences, built as a local database, were then BLASTp searched against the pea genome with an E-value cutoff of 10−5 and hit a score cutoff of 100 to identify AQP orthologs. The putative AQP sequences of pea were additionally validated to confirm the nature of MIP (Supplemental Table S2) and transmembrane helical domains through TMHMM (www.cbs.dtu.dk/services/TMHMM/).

    Further phylogenetic analysis was performed to categorize the AQPs into subfamilies. The pea AQP amino acid sequences, along with those from Medicago, a cool-season model legume phylogenetically close to pea, were aligned through ClustalW2 software (www.ebi.ac.uk/Tools/msa/clustalw2) to assign protein names. The unaligned AQP sequences to Medicago counterparts were once again aligned with the AQP sequences of Arabidopsis, rice, and soybean. Based on the LG model, unrooted phylogenetic trees were generated via MEGA7 and the neighbor-joining method[36], and the specific name of each AQP gene was assigned based on its position in the phylogenetic tree.

    By using the conserved domain database (CDD, www.ncbi.nlm.nih.gov/Structure/cdd/cdd.shtml), the NPA motifs were identified from the pea AQP protein sequences[37]. The software TMHMM (www.cbs. dtu.dk/services/TMHMM/)[38] was used to identify the protein transmembrane domains. To determine whether there were any alterations or total deletion, the transmembrane domains were carefully examined.

    Basic molecular properties including amino acid composition, relative molecular weight (MW), and instability index were investigated through the online tool ProtParam (https://web.expasy.org/protparam/). The isoelectric points (pI) were estimated by sequence Manipulation Suite version 2 (www.bioinformatics.org/sms2)[39]. The subcellular localization of AQP proteins was predicted using Plant-mPLoc[40] and WoLF PSORT (www.genscript.com/wolf-psort.html)[ 41] algorithms.

    The gene structure (intron-exon organization) of AQPs was examined through GSDS ver 2.0[42]. The chromosomal distribution of the AQP genes was illustrated by the software MapInspect (http://mapinspect.software.informer.com) in the form of a physical map.

    To explore the tissue expression patterns of pea AQP genes, existing NGS data from 18 different libraries covering a wide range of tissue, developmental stage, and growth condition of the variety ‘Caméor’ were downloaded from GenBank (www.ncbi.nlm.nih.gov/bioproject/267198). The expression levels of the AQP genes in each tissue and growth stage/condition were represented by the FPKM (Fragments Per Kilobase of transcript per Million fragments mapped) values. Heatmaps of AQPs gene were generated through Morpheus software (https://software.broadinstitute.org/morpheus/#).

    Different solutions, which were water (W), 0.3 M mannitol (M), and fullerol of different concentrations dissolved in 0.3 M mannitol (MF), were used in this study. MF solutions with the fullerol concentration of 10, 50, 100, and 500 mg/L were denoted as MF1, MF2, MF3, and MF4, respectively. Seeds of 'SQ-1', a Chinese landrace accession of a pea, were germinated in two layers of filter paper with 30 mL of each solution in Petri dishes (12 cm in diameter) each solution, and the visual phenotype and radicle lengths of 150 seeds for each treatment were analyzed 72 h after soaking. The radicle lengths were measured using a ruler. Multiple comparisons for each treatment were performed using the SSR-Test method with the software SPSS 20.0 (IBM SPSS Statistics, Armonk, NY, USA).

    Total RNA was extracted from imbibing embryos after 12 h of seed soaking in the W, M, and MF3 solution, respectively, by using Trizol reagent (Invitrogen, Carlsbad, CA, USA). The quality and quantity of the total RNA were measured through electrophoresis on 1% agarose gel and an Agilent 2100 Bioanalyzer respectively (Agilent Technologies, Santa Rosa, USA). The TruSeq RNA Sample Preparation Kit was utilized to construct an RNA-Seq library from 5 µg of total RNA from each sample according to the manufacturer's instruction (Illumina, San Diego, CA, USA). Next-generation sequencing of nine libraries were performed through Novaseq 6000 platform (Illumina, San Diego, CA, USA).

    First of all, by using SeqPrep (https://github.com/jstjohn/SeqPrep) and Sickle (https://github.com/najoshi/sickle) the raw RNA-Seq reads were filtered and trimmed with default parameters. After filtering, high-quality reads were mapped onto the pea reference genome (https://urgi.versailles.inra.fr/Species/Pisum) by using TopHat (V2.1.0)[43]. Using Cufflinks, the number of mapped reads from each sample was determined and normalised to FPKM for each predicted transcript (v2.2.1). Pairwise comparisons were made between W vs M and W vs M+F treatments. The DEGs with a fold change ≥ 1.5 and false discovery rate (FDR) adjusted p-values ≤ 0.05 were identified by using Cuffdiff[44].

    qPCR was performed by using TOROGGreen® qPCR Master Mix (Toroivd, Shanghai, China) on a qTOWER®3 Real-Time PCR detection system (Analytik Jena, Germany). The reactions were performed at 95 °C for 60 s, followed by 42 cycles of 95 °C for 10 s and 60 °C for 30 s. Quantification of relative expression level was achieved by normalization against the transcripts of the housekeeping genes β-tubulin according to Kreplak et al.[35]. The primer sequences for reference and target genes used are listed in Supplemental Table S3.

    The homology-based analysis identifies 41 putative AQPs in the garden pea genome. Among them, all but two genes (Psat0s3550g0040.1, Psat0s2987g0040.1) encode full-length aquaporin-like sequences (Table 1). The conserved protein domain analysis later validated all of the expected AQPs (Supplemental Table S2). To systematically classify these genes and elucidate their relationship with the AQPs from other plants' a phylogenetic tree was created. It clearly showed that the AQPs from pea and its close relative M. truncatula formed four distinct clusters, which represented the different subfamilies of AQPs i.e. TIPs, PIPs, NIPs, and SIPs (Fig. 1a). However, out of the 41 identified pea AQPs, 4 AQPs couldn't be tightly aligned with the Medicago AQPs and thus were put to a new phylogenetic tree constructed with AQPs from rice, Arabidopsis, and soybean. This additional analysis assigned one of the 4 AQPs to the XIP subfamily and the rest three to the TIP or NIP subfamilies (Fig. 1b). Therefore, it is concluded that the 41 PsAQPs comprise 11 PsTIPs, 15 PsNIPs, 9 PsPIPs, 5 PsSIPs, and 1 PsXIP (Table 2). The PsPIPs formed two major subgroups namely PIP1s and PIP2s, which comprise three and six members, respectively (Table 1). The PsTIPs formed two major subgroups TIPs 1 (PsTIP1-1, PsTIP1-3, PsTIP1-4, PsTIP1-7) and TIPs 2 (PsTIP2-1, PsTIP2-2, PsTIP2-3, PsTIP2-6) each having four members (Table 2). Detailed information such as gene/protein names, accession numbers, the length of deduced polypeptides, and protein structural features are presented in Tables 1 & 2

    Table 1.  Description and distribution of aquaporin genes identified in the garden pea genome.
    Chromosome
    S. NoGene NameGene IDGene length
    (bp)
    LocationStartEndTranscription length (bp)CDS length
    (bp)
    Protein length
    (aa)
    1PsPIP1-1Psat5g128840.32507chr5LG3231,127,859231,130,365675675225
    2PsPIP1-2Psat2g034560.11963chr2LG149,355,95849,357,920870870290
    3PsPIP1-4Psat2g182480.11211chr2LG1421,647,518421,648,728864864288
    4PsPIP2-1Psat6g183960.13314chr6LG2369,699,084369,702,397864864288
    5PsPIP2-2-1Psat4g051960.11223chr4LG486,037,44686,038,668585585195
    6PsPIP2-2-2Psat5g279360.22556chr5LG3543,477,849543,480,4042555789263
    7PsPIP2-3Psat7g228600.22331chr7LG7458,647,213458,649,5432330672224
    8PsPIP2-4Psat3g045080.11786chr3LG5100,017,377100,019,162864864288
    9PsPIP2-5Psat0s3550g0040.11709scaffold0355020,92922,63711911191397
    10PsTIP1-1Psat3g040640.12021chr3LG589,426,47389,428,493753753251
    11PsTIP1-3Psat3g184440.12003chr3LG5393,920,756393,922,758759759253
    12PsTIP1-4Psat7g219600.12083chr7LG7441,691,937441,694,019759759253
    13PsTIP1-7Psat6g236600.11880chr6LG2471,659,417471,661,296762762254
    14PsTIP2-1Psat1g005320.11598chr1LG67,864,8107,866,407750750250
    15PsTIP2-2Psat4g198360.11868chr4LG4407,970,525407,972,392750750250
    16PsTIP2-3Psat1g118120.12665chr1LG6230,725,833230,728,497768768256
    17PsTIP2-6Psat2g177040.11658chr2LG1416,640,482416,642,139750750250
    18PsTIP3-2Psat6g054400.11332chr6LG254,878,00354,879,334780780260
    19PsTIP4-1Psat6g037720.21689chr6LG230,753,62430,755,3121688624208
    20PsTIP5-1Psat7g157600.11695chr7LG7299,716,873299,718,567762762254
    21PsNIP1-1Psat1g195040.21864chr1LG6346,593,853346,595,7161863645215
    22PsNIP1-3Psat1g195800.11200chr1LG6347,120,121347,121,335819819273
    23PsNIP1-5Psat7g067480.12365chr7LG7109,420,633109,422,997828828276
    24PsNIP1-6Psat7g067360.12250chr7LG7109,270,462109,272,711813813271
    25PsNIP1-7Psat1g193240.11452chr1LG6344,622,606344,624,057831831277
    26PsNIP2-1-2Psat3g197520.1669chr3LG5420,092,382420,093,050345345115
    27PsNIP2-2-2Psat3g197560.1716chr3LG5420,103,168420,103,883486486162
    28PsNIP3-1Psat2g072000.11414chr2LG1133,902,470133,903,883798798266
    29PsNIP4-1Psat7g126440.11849chr7LG7209,087,362209,089,210828828276
    30PsNIP4-2Psat5g230920.11436chr5LG3463,340,575463,342,010825825275
    31PsNIP5-1Psat6g190560.11563chr6LG2383,057,323383,058,885867867289
    32PsNIP6-1Psat5g304760.45093chr5LG3573,714,868573,719,9605092486162
    33PsNIP6-2Psat7g036680.12186chr7LG761,445,34161,447,134762762254
    34PsNIP6-3Psat7g259640.12339chr7LG7488,047,315488,049,653918918306
    35PsNIP7-1Psat6g134160.24050chr6LG2260,615,019260,619,06840491509503
    36PsSIP1-1Psat3g091120.13513chr3LG5187,012,329187,015,841738738246
    37PsSIP1-2Psat1g096840.13609chr1LG6167,126,599167,130,207744744248
    38PsSIP1-3Psat7g203280.12069chr7LG7401,302,247401,304,315720720240
    39PsSIP2-1-1Psat0s2987g0040.1706scaffold02987177,538178,243621621207
    40PsSIP2-1-2Psat3g082760.13135chr3LG5173,720,100173,723,234720720240
    41PsXIP2-1Psat7g178080.12077chr7LG7335,167,251335,169,327942942314
    bp: base pair, aa: amino acid.
     | Show Table
    DownLoad: CSV
    Figure 1.  Phylogenetic analysis of the identified AQPs from pea genome. (a) The pea AQPs proteins aligned with those from the cool-season legume Medicago truncatual. (b) The four un-assigned pea AQPs in (a) (denoted as NA) were further aligned with the AQPs of rice, soybean, and Arabidopsis by using the Clustal W program implemented in MEGA 7 software. The nomenclature of PsAQPs was based on homology with the identified aquaporins that were clustered together.
    Table 2.  Protein information, conserved amino acid residues, trans-membrane domains, selectivity filter, and predicted subcellular localization of the 39 full-length pea aquaporins.
    S. NoAQPsGeneLengthTMHNPANPAar/R selectivity filterpIWoLF PSORTPlant-mPLoc
    LBLEH2H5LE1LE2
    Plasma membrane intrinsic proteins (PIPs)
    1PsPIP1-1Psat5g128840.32254NPA0F0008.11PlasPlas
    2PsPIP1-2Psat2g034560.12902NPANPAFHTR9.31PlasPlas
    3PsPIP1-4Psat2g182480.12886NPANPAFHTR9.29PlasPlas
    4PsPIP2-1Psat6g183960.12886NPANPAFHT08.74PlasPlas
    5PsPIP2-2-1Psat4g051960.1195300FHTR8.88PlasPlas
    6PsPIP2-2-2Psat5g279360.22635NPANPAFHTR5.71PlasPlas
    7PsPIP2-3Psat7g228600.22244NPA0FF006.92PlasPlas
    8PsPIP2-4Psat3g045080.12886NPANPAFHTR8.29PlasPlas
    Tonoplast intrinsic proteins (TIPs)
    1PsTIP1-1Psat3g040640.12517NPANPAHIAV6.34PlasVacu
    2PsTIP1-3Psat3g184440.12536NPANPAHIAV5.02Plas/VacuVacu
    3PsTIP1-4Psat7g219600.12537NPANPAHIAV4.72VacuVacu
    4PsTIP1-7Psat6g236600.12546NPANPAHIAV5.48Plas/VacuVacu
    5PsTIP2-1Psat1g005320.12506NPANPAHIGR8.08VacuVacu
    6PsTIP2-2Psat4g198360.12506NPANPAHIGR5.94Plas/VacuVacu
    7PsTIP2-3Psat1g118120.12566NPANPAHIAL6.86Plas/VacuVacu
    8PsTIP2-6Psat2g177040.12506NPANPAHIGR4.93VacuVacu
    9PsTIP3-2Psat6g054400.12606NPANPAHIAR7.27Plas/VacuVacu
    10PsTIP4-1Psat6g037720.22086NPANPAHIAR6.29Vac/ plasVacu
    11PsTIP5-1Psat7g157600.12547NPANPANVGC8.2Vacu /plasVacu/Plas
    Nodulin-26 like intrisic proteins (NIPs)
    1PsNIP1-1Psat1g195040.22155NPA0WVF06.71PlasPlas
    2PsNIP1-3Psat1g195800.12735NPANPVWVAR6.77PlasPlas
    3PsNIP1-5Psat7g067480.12766NPANPVWVAN8.98PlasPlas
    4PsNIP1-6Psat7g067360.12716NPANPAWVAR8.65Plas/VacuPlas
    5PsNIP1-7Psat1g193240.12776NPANPAWIAR6.5Plas/VacuPlas
    6PsNIP2-1-2Psat3g197520.11152NPAOG0009.64PlasPlas
    7PsNIP2-2-2Psat3g197560.116230NPA0SGR6.51PlasPlas
    8PsNIP3-1Psat2g072000.12665NPANPASIAR8.59Plas/VacuPlas
    9PsNIP4-1Psat7g126440.12766NPANPAWVAR6.67PlasPlas
    10PsNIP4-2Psat5g230920.12756NPANPAWLAR7.01PlasPlas
    11PsNIP5-1Psat6g190560.12895NPSNPVAIGR7.1PlasPlas
    12PsNIP6-1Psat5g304760.41622NPA0I0009.03PlasPlas
    13PsNIP6-2Psat7g036680.1254000G0005.27ChloPlas/Nucl
    14PsNIP6-3Psat7g259640.13066NPANPVTIGR8.32PlasPlas
    15PsNIP7-1Psat6g134160.25030NLK0WGQR8.5VacuChlo/Nucl
    Small basic intrinsic proteins (SIPs)
    1PsSIP1-1Psat3g091120.12466NPTNPAVLPN9.54PlasPlas/Vacu
    2PsSIP1-2Psat1g096840.12485NTPNPAIVPL9.24VacuPlas/Vacu
    3PsSIP1-3Psat7g203280.12406NPSNPANLPN10.32ChloPlas
    4PsSIP2-1-2Psat3g082760.12404NPLNPAYLGS10.28PlasPlas
    Uncharacterized X intrinsic proteins (XIPs)
    1PsXIP2-1Psat7g178080.13146SPVNPAVVRM7.89PlasPlas
    Length: protein length (aa); pI: Isoelectric point; Trans-membrane helicase (TMH) represents for the numbers of Trans-membrane helices predicted by TMHMM Server v.2.0 tool; WoLF PSORT and Plant-mPLoc: best possible cellualr localization predicted by the WoLF PSORT and Plant-mPLoc tool, respectively (Chlo Chloroplast, Plas Plasma membrane, Vacu Vacuolar membrane, Nucl Nucleus); LB: Loop B, L: Loop E; NPA: Asparagine-Proline-Alanine; H2 represents for Helix 2, H5 represents for Helix 5, LE1 represents for Loop E1, LE2 represents for Loop E2, Ar/R represents for Aromatic/Arginine.
     | Show Table
    DownLoad: CSV

    To understand the genome distribution of the 41 PsAQPs, we mapped these genes onto the seven chromosomes of a pea to retrieve their physical locations (Fig. 2). The greatest number (10) of AQPs were found on chromosome 7, whereas the least (2) on chromosome 4 (Fig. 2 and Table 1). Chromosomes 1 and 6 each contain six aquaporin genes, whereas chromosomes 2, 3, and 5 carry four, seven, and four aquaporin genes, respectively (Fig. 2). The trend of clustered distribution of AQPs was seen on specific chromosomes, particularly near the end of chromosome 7.

    Figure 2.  Chromosomal localization of the 41 PsAQPs on the seven chromosomes of pea. Chr1-7 represents the chromosomes 1 to 7. The numbers on the right of each chromosome show the physical map positions of the AQP genes (Mbp). Blue, green, orange, brown, and black colors represent TIPs, NIPs, PIPs, SIPs, and XIP, respectively.

    The 39 full-length PsAQP proteins have a length of amino acid ranging from 115 to 503 (Table 1) and Isoelectric point (pI) values ranging from 4.72 to 10.35 (Table 2). As a structural signature, transmembrane domains were predicted to exist in all PsAQPs, with the number in individual AQPs varying from 2 to 6. By subfamilies, TIPs harbor the greatest number of TM domains in total, followed by PIPs, NIPs, SIPs, and XIP (Table 2). Exon-intron structure analysis showed that most PsAQPs (16/39) having two introns, while ten members had three, seven members had four, and five members had only one intron (Fig. 3). Overall, PsAQPs exhibited a complex structure with varying intron numbers, positions, and lengths.

    Figure 3.  The exon-intron structures of the AQP genes in pea. Upstream/downstream region, exon, and intron are represented by a blue box, yellow box, and grey line, respectively.

    As aforementioned, generally highly conserved two NPA motifs generate an electrostatic repulsion of protons in AQPs to form the water channel, which is essential for the transport of substrate molecules[15]. In order to comprehend the potential physiological function and substrate specificity of pea aquaporins, NPA motifs (LB, LE) and residues at the ar/R selectivity filter (H2, H5, LE1, and LE2) were examined. (Table 2). We found that all PsTIPs and most PsPIPs had two conserved NPA motifs except for PsPIP1-1, PsPIP2-2-1, and PsPIP2-3, each having a single NPA motif. Among PsNIPs, PsNIP1-6, PsNIP1-6, PsNIP1-7, PsNIP3-1, PsNIP4-1 and PSNIP4-2 had two NPA domains, while PsNIP1-1, PsNIP2-1-2, PsNIP2-2-2 and PsNIP6-1 each had a single NPA motif. In the PsNIP sub-family, the first NPA motif showed an Alanine (A) to Valine (V) substitution in three PsNIPs (PsNIP1-3, PsNIP1-5, and PsNIP6-3) (Table 2). Furthermore, the NPA domains of all members of the XIP and SIP subfamilies were different. The second NPA motif was conserved in PsSIP aquaporins, however, all of the first NPA motifs had Alanine (A) replaced by Leucine (L) (PsSIP2-1-1, PsSIP2-1-2) or Threonine (T) (PsSIP1-1). In comparison to other subfamilies, this motif variation distinguishes water and solute-transporting aquaporins[45].

    Compared to NPA motifs, the ar/R positions were more variable and the amino acid composition appeared to be subfamily-dependent. The majority of PsPIPs had phenylalanine at H2, histidine at H5, threonine at LE1, and arginine at LE2 selective filter (Table 2). All of the PsTIP1 members had a Histidine-Isoleucine-Alanine-Valine structure at this position, while all PsTIP2 members but PsTIP2-3 harbored Histidine-Isoleucine-Glycine-Arginine. Similarly, PsNIPs, PsSIPs and PsXIP also showed subgroup-specific variation in ar/R selectivity filter (Table 2). Each of these substitutions partly determines the function of transporting water[46].

    Sequence-based subcellular localization analysis using WoLF PSORT predicted that all PsPIPs localized in the plasma membrane, which is consistent with their subfamily classification (Table 2). Around half (5/11) of the PsTIPs (PsTIP1-4, PsTIP2-1, PsTIP2-6, PsTIP4-1, and PsTIP5-1) were predicted to localize within vacuoles. However, several TIP members (PsTIP1-1, PsTIP1-3, PsTIP1-7, PsTIP2-2, PsTIP2-3 and PsTIP3-2) were predicted to localize in plasma membranes. We then further investigated their localizations by using another software (Plant-mPLoc, Table 2), which predicted that all the PsTIPs localize within vacuoles, thus supporting that they are tonoplast related. An overwhelming majority of PsNIPs (14/15) and PsXIP were predicted to be found only in plasma membranes., which was also expected (Table 2). Collectively, the versatility in subcellular localization of the pea AQPs is implicative of their distinct roles in controlling water and/or solute transport in the context of plant cell compartmentation.

    Tissue expression patterns of genes are indicative of their functions. Since there were rich resources of RNA-Seq data from various types of pea tissues in the public database, they were used for the extraction of expression information of PsAQP genes as represented by FPKM values. A heat map was generated to show the expression patterns of PsAQP genes in 18 different tissues/stages and their responses to nitrate levels (Fig. 4). According to the heat map, PsPIP1-2, PsPIP2-3 were highly expressed in root and nodule G (Low-nitrate), whereas PsTIP1-4, PsTIP2-6, and PsNIP1-7 were only expressed in roots in comparison to other tissues. The result also demonstrated that PsPIP1-1 and PsNIP3-1 expressed more abundantly in leaf, tendril, and peduncle, whereas PsPIP2-2-2 and PsTIP1-1 showed high to moderate expressions in all the samples except for a few. Interestingly, PsTIP1-1 expression in many green tissues seemed to be oppressed by low-nitrate. In contrast, some AQPs such as PsTIP1-3, PsTIP1-7, PsTIP5-1, PsNIP1-5, PsNIP4-1, PsNIP5-1, and PsSIP2-1-1 showed higher expression only in the flower tissue. There were interesting developmental stage-dependent regulations of some AQPs in seeds (Fig. 4). For example, PsPIP2-1, PsPIP2-2-1, PsNIP1-6, PsSIP1-1, and PsSIP1-2 were more abundantly expressed in the Seed_12 dap (days after pollination;) tissue than in the Seed_5 dai (days after imbibition) tissue; reversely, PsPIP2-2-2, PsPIP2-4, PsTIP2-3, and PsTIP3-2 showed higher expression in seed_5 dai in compare to seed_12 dap tissues (Fig. 4). The AQP genes may have particular functional roles in the growth and development of the pea based on their tissue-specific expression.

    Figure 4.  Heatmap analysis of the expression of pea AQP gene expressions in different tissues using RNA-seq data (PRJNA267198). Normalized expression of aquaporins in terms of reads per kilobase of transcript per million mapped reads (RPKM) showing higher levels of PIPs, NIPs, TIPs SIPs, and XIP expression across the different tissues analyzed. (Stage A represents 7-8 nodes; stage B represents the start of flowering; stage D represents germination, 5 d after imbibition; stage E represents 12 d after pollination; stage F represents 8 d after sowing; stage G represents 18 d after sowing, LN: Low-nitrate; HN: High-nitrate.

    Expressions of plant AQPs in vegetative tissues under normal and stressed conditions have been extensively studied[15]; however, little is known about the transcriptional regulation of AQP genes in seeds/embryos. To provide insights into this specific area, wet-bench RNA-Seq was performed on the germinating embryo samples isolated from water (W)-imbibed seeds and those treated with mannitol (M, an osmotic reagent), mannitol, and mannitol plus fullerol (F, a nano-antioxidant). The phenotypic evaluation showed that M treatment had a substantial inhibitory effect on radicle growth, whereas the supplement of F significantly mitigated this inhibition at all concentrations, in particular, 100 mg/mL in MF3, which increased the radicle length by ~33% as compared to that under solely M treatment (Fig. 5). The expression values of PsAQP genes were removed from the RNA-Seq data, and pairwise comparisons were made within the Group 1: W vs M, and Group 2: W vs MF3, where a total of ten and nince AQPs were identified as differentially expressed genes (DEGs), respectively (Fig. 6). In Group 1, six DEGs were up-regulated and four DEGs down-regulated, whereas in Group 2, six DEGs were up-regulated and three DEGs down-regulated. Four genes viz. PsPIPs2-5, PsNIP6-3, PsTIP2-3, and PsTIP3-2 were found to be similarly regulated by M or MF3 treatment (Fig. 6), indicating that their regulation by osmotic stress couldn't be mitigated by fullerol. Three genes, all being PsNIPs (1-1, 2-1-2, and 4-2), were up-regulated only under mannitol treatment without fullerol, suggesting that their perturbations by osmotic stress were migrated by the antioxidant activities. In contrast, four other genes namely PsTIP2-2, PsTIP4-1, PsNIP1-5, and PsSIP1-3 were only regulated under mannitol treatment when fullerol was present.

    Figure 5.  The visual phenotype and radicle length of pea seeds treated with water (W), 0.3 M mannitol (M), and fullerol of different concentrations dissolved in 0.3 M mannitol (MF). MF1, MF2, MF3, and MF4 indicated fullerol dissolved in 0.3 M mannitol at the concentration of 10, 50, 100, and 500 mg/L, respectively. (a) One hundred and fifty grains of pea seeds each were used for phenotype analysis at 72 h after treatment. Radicle lengths were measured using a ruler in three replicates R1, R2, and R3 in all the treatments. (b) Multiple comparison results determined using the SSR-Test method were shown with lowercase letters to indicate statistical significance (P < 0.05).
    Figure 6.  Venn diagram showing the shared and unique differentially expressed PsAQP genes in imbibing seeds under control (W), Mannitol (M) and Mannitol + Fullerol (MF3) treatments. Up-regulation (UG): PsPIP2-5, PsNIP1-1, PsNIP2-1-2, PsNIP4-2, PsNIP6-3, PsNIP1-5, PsTIP2-2, PsTIP4-1, PsSIP1-3, PsXIP2-1; Down-regulation (DG): PsTIP2-3, PsTIP3-2, PsNIP1-7, PsNIP5-1, PsXIP2-1.

    As a validation of the RNA-Seq data, eight genes showing differential expressions in imbibing seeds under M or M + F treatments were selected for qRT-PCR analysis, which was PsTIP4-1, PsTIP2-2, PsTIP2-3, PsTIP3-2, PsPIP2-5, PsXIP2-1, PsNIP6-3 and PsNIP1-5 shown in Fig 6, the expression modes of all the selected genes but PsXIP2-1 were well consistent between the RNA-Seq and the qRT-PCR data. PsXIP2-1, exhibiting slightly decreased expression under M treatment according to RNA-Seq, was found to be up-regulated under the same treatment by qRT-PCR (Fig. 7). This gene was therefore removed from further discussions.

    Figure 7.  The expression patterns of seven PsAQPs in imbibing seeds as revealed by RNA-Seq and qRT-PCR. The seeds were sampled after 12 h soaking in three different solutions, namely water (W), 0.3 M mannitol (M), and 100 mg/L fullerol dissolved in 0.3 M mannitol (MF3) solution. Error bars are standard errors calculated from three replicates.

    This study used the recently available garden pea genome to perform genome-wide identification of AQPs[35] to help understand their functions in plant growth and development. A total of 39 putative full-length AQPs were found in the garden pea genome, which is very similar to the number of AQPs identified in many other diploid legume crops such as 40 AQPs genes in pigeon pea, chickpea, common bean[7,47,48], and 44 AQPs in Medicago[49]. On the other hand, the number of AQP genes in pea is greater compared to diploid species like rice (34)[4], Arabidopsis thaliana (35)[3], and 32 and 36 in peanut A and B genomes, respectively[8]. Phylogenetic analysis assigned the pea AQPs into all five subfamilies known in plants, whereas the presence of only one XIP in this species seems less than the number in other diploid legumes which have two each in common bean and Medicago[5,48,49]. The functions of the XIP-type AQP will be of particular interest to explore in the future.

    The observed exon-intron structures in pea AQPs were found to be conserved and their phylogenetic distribution often correlated with these structures. Similar exon-intron patterns were seen in PIPs and TIPs subfamily of Arabidopsis, soybean, and tomato[3,6,50]. The two conserved NPA motifs and the four amino acids forming the ar/R SF mostly regulate solute specificity and transport of the substrate across AQPs[47,51]. According to our analysis, all the members of each AQP subfamilies in garden pea showed mostly conserved NPA motifs and a similar ar/R selective filter. Interestingly, most PsPIPs carry double NPA in LB and LE and a hydrophilic ar/R SF (F/H/T/R) as observed in three legumes i.e., common bean[48], soybean[5] chickpea[7], showing their affinity for water transport. All the TIPs of garden pea have double NPA in LB and LE and wide variation at selectivity filters. Most PsTIP1s (1-1, 1-3, 1-4, and 1-7) were found with H-I-A-V ar/R selectivity filter similar to other species such as Medicago, Arachis, and common bean, that are reported to transport water and other small molecules like boron, hydrogen peroxide, urea, and ammonia[52]. Compared with related species, the TIPs residues in the ar/R selectivity filter were very similar to those in common bean[48], Medicago[49], and Arachis[8]. In the present study, the NIPs, NIP1s (1-3, 1-5, 1-6, and1-7), and NIP2-2-2 genes have G-S-G-R selectivity. Interestingly, NIP2s with a G-S-G-R selectivity filter plays an important role in silicon influx (Si) in many plant species such as Soybean and Arachis[6,8]. It was reported that Si accumulation protects plants against various types of biotic and abiotic stresses[53].

    The subcellular localization investigation suggested that most of the PsAQPs were localized to the plasma membrane or vacuolar membrane. The members of the PsPIPs, PsNIPs, and PsXIP subfamilies were mostly located in the plasma membrane, whereas members of the PsTIPs subfamily were often predicted to localize in the vacuolar membrane. Similar situations were reported in many other legumes such as common bean, soybean, and chickpea[5,7,48]. Apart from that, PsSIPs subfamily were predicted to localize to the plasma membrane or vacuolar membrane, and some AQPs were likely to localize in broader subcellular positions such as the nucleus, cytosol, and chloroplast, which indicates that AQPs may be involved in various molecular transport functions.

    AQPs have versatile physiological functions in various plant organs. Analysis of RNA-Seq data showed a moderate to high expression of the PsPIPs in either root or green tissues except for PsPIP2-4, indicating their affinity to water transport. In several other species such as Arachis[8], common bean[48], and Medicago[49], PIPs also were reported to show high expressions and were considered to play an important role to maintain root and leaf hydraulics. Also interestingly, PsTIP2-3 and PsTIP3-2 showed high expressions exclusively in seeds at 5 d after imbibition, indicating their specific roles in seed germination. Earlier, a similar expression pattern for TIP3s was reported in Arabidopsis during the initial phase of seed germination and seed maturation[54], soybean[6], canola[55], and Medicago[49], suggesting that the main role of TIP3s in regulating seed development is conserved across species.

    Carbon nanoparticles such as fullerol have a wide range of potential applications as well as safety concerns in agriculture. Fullerol has been linked to plant protection from oxidative stress by influencing ROS accumulation and activating the antioxidant system in response to drought[56]. The current study revealed that fullerol at an adequate concentration (100 mg/L), had favorable effects on osmotic stress alleviation. In this study, the radical growth of germinating seeds was repressed by the mannitol treatment, and many similar observations have been found in previous studies[57]. Furthermore, mannitol induces ROS accumulation in plants, causing oxidative stress[58]. Our work further validated that the radical growth of germinating seeds were increased during fullerol treatment. Fullerol increased the length of roots and barley seeds, according to Panova et al.[32]. Fullerol resulted in ROS detoxification in seedlings subjected to water stress[32].

    Through transcriptomic profiling and qRT-PCR, several PsAQPs that responded to osmotic stress by mannitol and a combination of mannitol and fullerol were identified. Most of these differentially expressed AQPs belonged to the TIP and NIP subfamilies. (PsTIP2-2, PsTIP2-3, and PsTIP 3-2) showed higher expression by mannitol treatment, which is consistent with the fact that many TIPs in other species such as GmTIP2;3 and Eucalyptus grandis TIP2 (EgTIP2) also showed elevated expressions under osmotic stress[54,59]. The maturation of the vacuolar apparatus is known to be aided by the TIPs, which also enable the best possible water absorption throughout the growth of embryos and the germination of seeds[60]. Here, the higher expression of PsTIP (2-2, 2-3, and 3-2) might help combat water deficiency in imbibing seeds due to osmotic stress. The cellular signals triggering such transcriptional regulation seem to be independent of the antioxidant system because the addition of fullerol didn’t remove such regulation. On the other hand, the mannitol-induced regulation of most PsNIPs were eliminated when fullerol was added, suggesting either a response of these NIPs to the antioxidant signals or being due to the mitigated cellular stress. Based on our experimental data and previous knowledge, we propose that the fullerol-induced up- or down-regulation of specific AQPs belonging to different subfamilies and locating in different subcellular compartments, work coordinatedly with each other, to maintain the water balance and strengthen the tolerance to osmotic stress in germinating pea seeds through reduction of ROS accumulation and enhancement of antioxidant enzyme levels. Uncategorized X intrinsic proteins (XIPs) Aquaporins are multifunctional channels that are accessible to water, metalloids, and ROS.[32,56]. Due likely to PCR bias, the expression data of PsXIP2-1 from qRT-PCR and RNA-Seq analyses didn’t match well, hampering the drawing of a solid conclusion about this gene. Further studies are required to verify and more deeply dissect the functions of each of these PsAQPs in osmotic stress tolerance.

    A total of 39 full-length AQP genes belonging to five sub-families were identified from the pea genome and characterized for their sequences, phylogenetic relationships, gene structures, subcellular localization, and expression profiles. The number of AQP genes in pea is similar to that in related diploid legume species. The RNA-seq data revealed that PsTIP (2-3, 3-2) showed high expression in seeds for 5 d after imbibition, indicating their possible role during the initial phase of seed germination. Furthermore, gene expression profiles displayed that higher expression of PsTIP (2-3, 3-2) in germinating seeds might help maintain water balance under osmotic stress to confer tolerance. Our results suggests that the biological functions of fullerol in plant cells are exerted partly through the interaction with AQPs.

    Under Bio project ID PRJNA793376 at the National Center for Biotechnology Information, raw data of sequencing read has been submitted. The accession numbers for the RNA-seq raw data are stored in GenBank and are mentioned in Supplemental Table S4.

    This study is supported by the National Key Research & Development Program of China (2022YFE0198000) and the Key Research Program of Zhejiang Province (2021C02041).

  • Pei Xu is the Editorial Board member of journal Vegetable Research. He was blinded from reviewing or making decisions on the manuscript. The article was subject to the journal's standard procedures, with peer-review handled independently of this Editorial Board member and his research group.

  • [1]

    Zhang H, Zhu J, Gong Z, Zhu JK. 2022. Abiotic stress responses in plants. Nature Reviews Genetics 23:104−19

    doi: 10.1038/s41576-021-00413-0

    CrossRef   Google Scholar

    [2]

    Gong Z, Xiong L, Shi H, Yang S, Herrera-Estrella LR, et al. 2020. Plant abiotic stress response and nutrient use efficiency. Science China Life Sciences 63:635−74

    doi: 10.1007/s11427-020-1683-x

    CrossRef   Google Scholar

    [3]

    Waadt R, Seller CA, Hsu PK, Takahashi Y, Munemasa S, et a;. 2022. Plant hormone regulation of abiotic stress responses. Nature Reviews Molecular Cell Biology 23:680−94

    doi: 10.1038/s41580-022-00479-6

    CrossRef   Google Scholar

    [4]

    Horvath DP, Anderson JV, Chao WS, Foley ME. 2003. Erratum: Knowing when to grow: Signals regulating bud dormancy. Trends in Plant Science 8:534−40

    doi: 10.1016/j.tplants.2003.09.013

    CrossRef   Google Scholar

    [5]

    Horvath D. 2009. Common mechanisms regulate flowering and dormancy. Plant Science 177:523−31

    doi: 10.1016/j.plantsci.2009.09.002

    CrossRef   Google Scholar

    [6]

    Picotte JJ, Rhode JM, Cruzan MB. 2008. Leaf morphological responses to variation in water availability for plants in the Piriqueta caroliniana complex. Plant Ecology 200:267−75

    doi: 10.1007/s11258-008-9451-9

    CrossRef   Google Scholar

    [7]

    Picotte JJ, Rosenthal DM, Rhode JM, Cruzan MB. 2007. Plastic responses to temporal variation in moisture availability: Consequences for water use efficiency and plant performance. Oecologia 153:821−32

    doi: 10.1007/s00442-007-0794-z

    CrossRef   Google Scholar

    [8]

    Sedej TT, ErznoŽnik T, Rovtar J. 2020. Effect of UV radiation and altitude characteristics on the functional traits and leaf optical properties in Saxifraga hostii at the alpine and montane sites in the Slovenian Alps. Photochemical & Photobiological Sciences 19:180−92

    doi: 10.1039/c9pp00032a

    CrossRef   Google Scholar

    [9]

    Munné-Bosch S, Cotado A, Morales M, Fleta-Soriano E, Villellas J, et al. 2016. Adaptation of the long-lived monocarpic perennial Saxifraga longifolia to high altitude. Plant Physiology 172:765−75

    doi: 10.1104/pp.16.00877

    CrossRef   Google Scholar

    [10]

    Zheng H, Fu X, Shao J, Tang Y, Yu M, et al. 2023. Transcriptional regulatory network of high-value active ingredients in medicinal plants. Trends in Plant Science 28:429−46

    doi: 10.1016/j.tplants.2022.12.007

    CrossRef   Google Scholar

    [11]

    Yang L, Wen KS, Ruan X, Zhao YX, Wei F, et al. 2018. Response of Plant Secondary Metabolites to Environmental Factors. Molecules 23:762

    doi: 10.3390/molecules23040762

    CrossRef   Google Scholar

    [12]

    Pant P, Pandey S, Dall'Acqua S. 2021. The influence of environmental conditions on secondary metabolites in medicinal plants: A literature review. Chemistry & Biodiversity 18:e2100345

    doi: 10.1002/cbdv.202100345

    CrossRef   Google Scholar

    [13]

    Isah T. 2019. Stress and defense responses in plant secondary metabolites production. Biological Research 52:39

    doi: 10.1186/s40659-019-0246-3

    CrossRef   Google Scholar

    [14]

    Dalcorso G, Manara A, Piasentin S, Furini A. 2014. Nutrient metal elements in plants. Metallomics 6:1770−88

    doi: 10.1039/C4MT00173G

    CrossRef   Google Scholar

    [15]

    Liang G. 2022. Iron uptake, signaling, and sensing in plants. Plant Communications 3:100349

    doi: 10.1016/j.xplc.2022.100349

    CrossRef   Google Scholar

    [16]

    Brumbarova T, Bauer P, Ivanov R. 2015. Molecular mechanisms governing Arabidopsis iron uptake. Trends in Plant Science 20:124−33

    doi: 10.1016/j.tplants.2014.11.004

    CrossRef   Google Scholar

    [17]

    Darbani B, Briat JF, Holm PB, Husted S, Noeparvar S, et al. 2013. Dissecting plant iron homeostasis under short and long-term iron fluctuations. Biotechnology Advances 31:1292−307

    doi: 10.1016/j.biotechadv.2013.05.003

    CrossRef   Google Scholar

    [18]

    Halliwell B, Gutteridge JMC. 1992. Biologically relevant metal ion-dependent hydroxyl radical generation. FEBS Letters 307:108−12

    doi: 10.1016/0014-5793(92)80911-y

    CrossRef   Google Scholar

    [19]

    Ma HC, McConchie JA. 2001. The dry-hot valleys and forestation in southwest China. Journal of Forestry Research 12:35−39

    doi: 10.1007/BF02856797

    CrossRef   Google Scholar

    [20]

    Zheng T, Wang M, Zhan J, Sun W, Yang Q, et al. 2020. Ferrous iron-induced increases in capitate glandular trichome density and upregulation of CbHO-1 contributes to increases in blinin content in Conyza blinii. Planta 252:81

    doi: 10.1007/s00425-020-03492-1

    CrossRef   Google Scholar

    [21]

    Yang M, Zheng T, Zhan J, Wang M, Sun W, et al. 2022. Conyza blinii responds to the changes of exogenous iron through auxin-terpenoids metabolism pathway. Journal of Plant Interactions 17:485−95

    doi: 10.1080/17429145.2022.2053596

    CrossRef   Google Scholar

    [22]

    Zheng T, Zhan J, Wang M, Sun W, Yan J, et al. 2021. Fe induces a dynamic and biased allocation of material flux within terpenoid metabolism is controlled by CbNudix in Conyza blinii. Plant and Soil 467:421−36

    doi: 10.1007/s11104-021-05110-9

    CrossRef   Google Scholar

    [23]

    Sun WJ, Zhan JY, Zheng TR, Sun R, Wang T, et al. 2018. The jasmonate-responsive transcription factor CbWRKY24 regulates terpenoid biosynthetic genes to promote saponin biosynthesis in Conyza blinii H. Lév. Journal of Genetics 97:1379−88

    doi: 10.1007/s12041-018-1026-5

    CrossRef   Google Scholar

    [24]

    van den Brûle S, Smart CC. 2002. The plant PDR family of ABC transporters. Planta 216:95−106

    doi: 10.1007/s00425-002-0889-z

    CrossRef   Google Scholar

    [25]

    Thilakarathna MS, Cope KR. 2021. Split-root assays for studying legume-rhizobia symbioses, rhizodeposition, and belowground nitrogen transfer in legumes. Journal of Experimental Botany 72:5285−99

    doi: 10.1093/jxb/erab198

    CrossRef   Google Scholar

    [26]

    Hidalgo Á, Ruiz-Sainz JE, Vinardell JM. 2018. A new, nondestructive, split-root system for local and systemic plant responses studies with soybean. In Host-Pathogen Interactions, eds. Medina C, López-Baena F. vol. 1734. New York: Humana Press. pp. 297−306.

    [27]

    Shabnam R, Iqbal MT. 2018. Understanding phosphorus status and P translocation within wheat plant in a split-root system. Eurasian Journal of Soil Science 7:30−42

    doi: 10.18393/ejss.334868

    CrossRef   Google Scholar

    [28]

    Luo Z, Kong X, Zhang Y, Li W, Zhang D, et al. 2019. Leaf-derived jasmonate mediates water uptake from hydrated cotton roots under partial root-zone irrigation. Plant Physiology 180:1660−76

    doi: 10.1104/pp.19.00315

    CrossRef   Google Scholar

    [29]

    Shen Q, Zhang L, Liao Z, Wang S, Yan T, et al. 2018. The genome of Artemisia annua provides insight into the evolution of asteraceae family and artemisinin biosynthesis. Molecular Plant 11:776−88

    doi: 10.1016/j.molp.2018.03.015

    CrossRef   Google Scholar

    [30]

    Liao B, Shen X, Xiang l, Guo S, Chen S, et al. 2022. Allele-aware chromosome-level genome assembly of Artemisia annua reveals the correlation between ADS expansion and artemisinin yield. Molecular Plant 15:1310−28

    doi: 10.1016/j.molp.2022.05.013

    CrossRef   Google Scholar

    [31]

    Rai M, Rai A, Kawano N, Yoshimatsu K, Takahashi H, et al. 2017. De novo RNA sequencing and expression analysis of Aconitum carmichaelii to analyze key genes involved in the biosynthesis of diterpene alkaloids. Molecules 22:2155

    doi: 10.3390/molecules22122155

    CrossRef   Google Scholar

    [32]

    Acamovic T, Brooker J. 2005. Biochemistry of plant secondary metabolites and their effects in animals. The Proceedings of the Nutrition Society 64:403−12

    doi: 10.1079/PNS2005449

    CrossRef   Google Scholar

    [33]

    Wink M. 1987. Physiology of the accumulation of secondary metabolites with special reference to alkaloids. In Cell Culture in Phytochemistry, eds. Constabel F, Vasil IK. Academic Press. pp. 17-42. https://doi.org/10.1016/B978-0-12-715004-8.50008-9

    [34]

    Vranová E, Coman Schmid D, Gruissem W. 2013. Network analysis of the MVA and MEP pathways for isoprenoid synthesis. Annual Review of Plant Biology 64:665−700

    doi: 10.1146/annurev-arplant-050312-120116

    CrossRef   Google Scholar

    [35]

    Tholl D. 2015. Biosynthesis and Biological Functions of Terpenoids in Plants. In Biotechnology of Isoprenoids. Advances in biochemical engineering/biotechnology, eds. Schrader J, Bohlmann J. Vol. 148. Switzerland: Springer, Cham. pp. 63−106. https://doi.org/10.1007/ 10_2014_295

    [36]

    Boncan DAT, Tsang SSK, Li C, Lee IHT, Lam HM, et al. 2020. Terpenes and Terpenoids in Plants: Interactions with Environment and Insects. International Journal of Molecular Sciences 21:7382

    doi: 10.3390/ijms21197382

    CrossRef   Google Scholar

    [37]

    Nagegowda DA, Gupta P. 2020. Advances in the biosynthesis, regulation, and metabolic engineering of plant specialized terpenoids. Plant Science 294:110457

    doi: 10.1016/j.plantsci.2020.110457

    CrossRef   Google Scholar

    [38]

    Crouzet J, Roland J, Peeters E, Trombik T, Ducos E, et al. 2013. NtPDR1, a plasma membrane ABC transporter from Nicotiana tabacum, is involved in diterpene transport. Plant Molecular Biology 82:181−92

    doi: 10.1007/s11103-013-0053-0

    CrossRef   Google Scholar

    [39]

    Fu X, Shi P, He Q, Shen Q, Tang Y, et al. 2017. AaPDR3, a PDR transporter 3, is involved in sesquiterpene β-caryophyllene transport in Artemisia annua. Frontiers in Plant Science 8:723

    doi: 10.3389/fpls.2017.00723

    CrossRef   Google Scholar

  • Cite this article

    Wang M, Yang M, Zhou M, Zhan J, Liu M, et al. 2024. Effect of rhizospheric Fe2+ on terpenoid biosynthesis and accumulation within Conyza blinii H. Lév. Tropical Plants 3: e003 doi: 10.48130/tp-0024-0003
    Wang M, Yang M, Zhou M, Zhan J, Liu M, et al. 2024. Effect of rhizospheric Fe2+ on terpenoid biosynthesis and accumulation within Conyza blinii H. Lév. Tropical Plants 3: e003 doi: 10.48130/tp-0024-0003

Figures(8)  /  Tables(1)

Article Metrics

Article views(2531) PDF downloads(279)

ARTICLE   Open Access    

Effect of rhizospheric Fe2+ on terpenoid biosynthesis and accumulation within Conyza blinii H. Lév.

Tropical Plants  3 Article number: e003  (2024)  |  Cite this article

Abstract: Conyza blinii (C. blinii) is a herbaceous plant that is distributed in dry-hot valleys in southwest China. Metabolites of medicinal plants are commonly associated with environmental factors. Dissipation of soil water caused by heat increases soil metal levels. Oleanane-type triterpenoid saponins (Olas) are the main active medicinal ingredients in C. blinii. Here, we explore the effect of Fe2+ on terpenoid metabolism, especially the mevalonic acid (MVA) pathway. The results indicate that the activity of the MVA and methylerythritol phosphate (MEP) metabolic pathways are increased by Fe2+ and that the expression of key enzyme-encoding genes of metabolic pathways3-hydroxy-3-methylglutaryl coenzyme A reductase (CbHMGR), Farnesyl pyrophosphate synthase (CbFPPS) and 1-deoxy-D-xylulose-5-phosphate synthase (CbDXS) are also significantly upregulated. Moreover, the triterpenoid saponin content in the leaves gradually decreased, but in the roots, it increased. Furthermore, Olas were confirmed to be transported from leaves to the roots by the root-split system, which was accompanied by high-level expression of pleiotropic drug resistance (CbPDR). Above all, our experiments revealed that Olas of C. blinii were actively synthesized in the leaves and transported to the roots via the CbPDR in response to the stimulation of Fe2+.

    • As sequestered organisms, plants can enhance their environmental adaptation only when subjected to abiotic stresses through relevant physiological responses[1,2]. Environmental stresses to which plants are susceptible include temperature, light, UV, and soil pollution, etc[3]. Many fantastic phenotypes appeared when plants and environmental factors were associated. When winter arrives, plants resist the cold weather by slowing or stopping their growth[4,5]. Plants that are widespread in arid areas, such as Cactaceae, exhibit spiny leaves that reduce water evaporation, and roots are widely distributed underground, which increases water absorption[6,7]. Plants distributed at high altitudes sometimes exhibit developed glandular hairs, narrow leaf surfaces, and bright colors with higher anthocyanin content[8,9]. It is noteworthy that, on a more subtle level, the relationship between plant secondary metabolites and environmental factors has received increasing attention in recent years.

      The model of 'environmental factors - phytohormones - transcription factors - secondary metabolites' as a regulatory network in medicinal plants has been established[10]. Plant secondary metabolites are not only valuable sustainable resources for human beings, but also play a key role in plants and the external environment[11]. Plant secondary metabolites, such as flavonoids, terpenoids, alkaloids and other natural products, have been reported to closely correlate with environmental factors[12]. Unfavorable environmental stresses and climatic factors, including drought, temperature extremes (freezing and high temperatures), light levels, nutrient deficiencies, and soil contamination with high concentrations of ions (metals and salts) are the main stressors affecting plant physiology during plant growth[13]. Metal elements are essential components in the soil environment and are necessary for the growth and development of plants. Zn, Cu, Fe and other elements are essential nutrients for plants, while the presence of Cd, Pb, and Hg in the soil will not only have a toxic effect on plants, but also endanger the food safety for humans[14]. Studies related to plant physiological effects of Fe date back to the mid-19th century, and Fe is involved in several significant physiological reactions[15,16]. Iron (Fe) is a mineral nutrient essential for plant growth and development and for various biochemical processes such as photosynthesis, respiration, and chlorophyll biosynthesis[17]. When deficient in iron, plant leaves usually develop interveinal chlorosis. However, iron is redox-active and therefore prone to the production of reactive oxygen species when it is present in excess in its free state[18]. Consequently, to maintain stable growth and development, plants are needed to ensure the distribution and efficient utilization of Fe in their tissues and organs[16].

      Conyza blinii (C. blinii) is a traditional medicinal herb plant distributed in southwest China. The primary biological environmental conditions are dry-hot valleys, which suffer from drought and water loss, leading to high metal content in the soil[19]. Triterpenoids, mainly including blinin and Olas, are considered to be medicinal ingredients within C. blinii. In our previous study, we found that exogenous Fe2+ could increase the medical quality of C. blinii, as evidenced by enhanced photosynthetic efficiency, increased glandular trichome density, and improved blinin and total triterpenoid saponin contents[20,21]. In this experiment, on the basis of studying the correlation between Olas and Fe2+ in C. blinii, we further explored whether there is intratissue-targeted transport produced by Fe2+ stimulation after root splitting.

    • C. blinii were collected in 1/2-strength Hoagland's solution for further cultivation when they grew to 2 months old. The temperature was 26 ± 2 °C, and the photoperiod was 16 h light/8 h dark. The relative humidity was 50%−70%. The real leaves, tender stems and main roots were selected for testing.

    • Referring to a previous research method, the concentration of Fe2+ was 200 μM[21]. The root system of C. blinii was equally divided into two parts, half of which was placed in 200 μM Fe2+ solution and the other in Hoagland nutrient solution, with no exchange of substances between the two parts. Group (0/0) which indicated no Fe2+ contact with either side of the root system. Group (Fe/Fe) which indicated Fe2+ contact with either side of the root system. In the split-root group (Fe/0), (Fe/0-Fe) indicates roots in direct contact with Fe2+ and (Fe/0-0) indicates roots not in contact with Fe2+. The split-root system is shown in Fig. 1. The experimental treatments lasted for 7 d, of which 3 d were replaced with new culture solution.
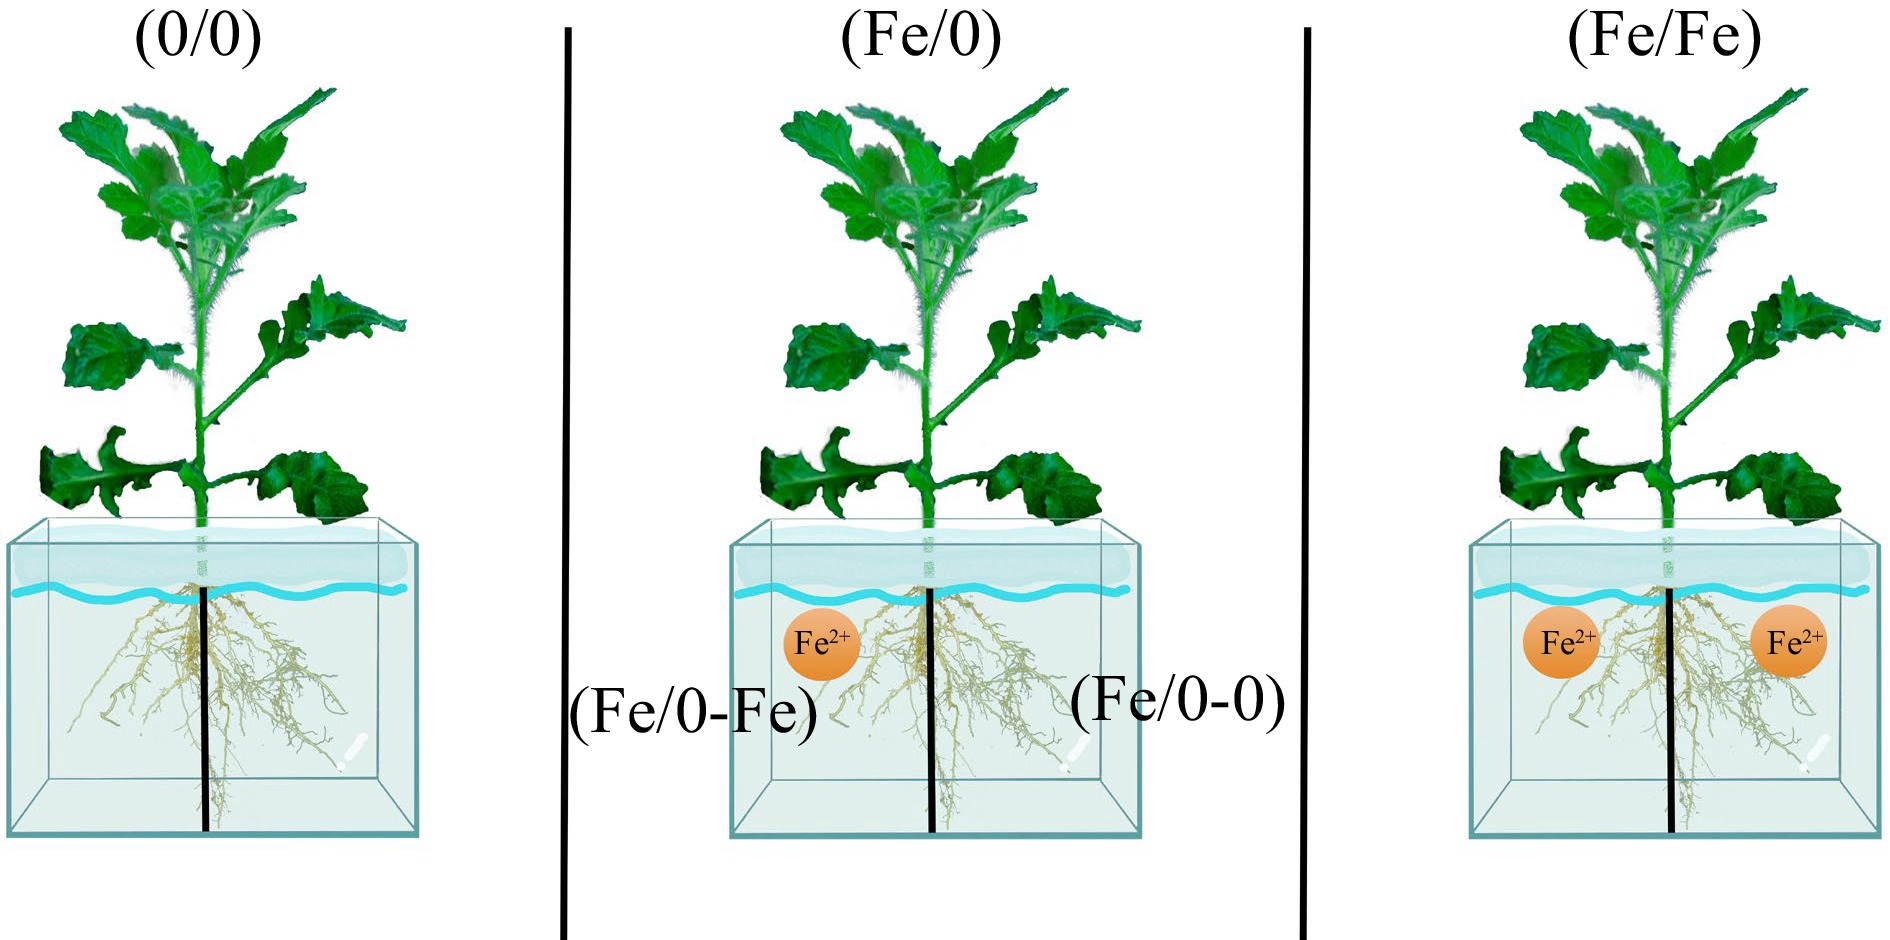
      Figure 1. 

      Demonstration of root split-root experiments.

    • Leaves (0.05 g) were ground into powder using liquid nitrogen, and 500 μL of methanol was added for overnight maceration at 37 °C. Referring to previous research, HPLC was used to determine the blinin content at a detection wavelength of 210 nm[20]. Leaves (0.1 g) were rapidly ground in liquid nitrogen until powdered. The detection method of Olas was as described in our previous study[22]. Vanillin-perchloric acid method is used to detect the content of Olas. Determine the absorbance of the solution at 544 nm.

    • Refer to Nanjing Jiancheng Tissue Iron Assay Kit (A039-2-1) for determination of plant iron content. The detection method of Fe content in plant tissues was as described in our previous studies[20,21].

    • Plant RNA was obtained using the EASYspin Plant RNA Rapid Extraction Kit (Beijing Adler Biotechnology Co., Ltd., RN2802, China) and reverse transcription was established by the FastKing One-Step RT-PCR Kit (Beijing Tiangen Co., KR123, China). A ChamQ Universal SYBR qPCR Master Mix kit (Nanjing Vazyme Q711-02, China) was used for the RT-qPCR experiments. Reaction systems, processes and data analysis methods were carried out as mentioned in our previous study[23].

    • We carried out analysis of variance (ANOVA) for all data, differences among treatments were analyzed by one-way ANOVA and differences were considered significant when p < 0.05, indicated by different letters. The experimental data were plotted with GraphPad Prism 9.0 software (www.graphpad.com/features).

    • To initially investigate the effect of Fe on the metabolism of Olas, observations on samples 0−7 d after Fe treatment indicated that split-root leads to a decrease in iron absorption efficiency. Split-root reduced the 'poison' phenotype of leaves caused by iron absorption (Fig. 2a), effectively reducing the iron content in leaves by 30%–32% at the end of the treatment (Fig. 2b). There was a significant difference in Fe content in the roots of the (Fe/0) group. The Fe content in the (Fe/0-Fe) group reached 185 mg·g−1 at 7 d, while it was only 22 mg·g−1 in the (Fe/0-0) group.
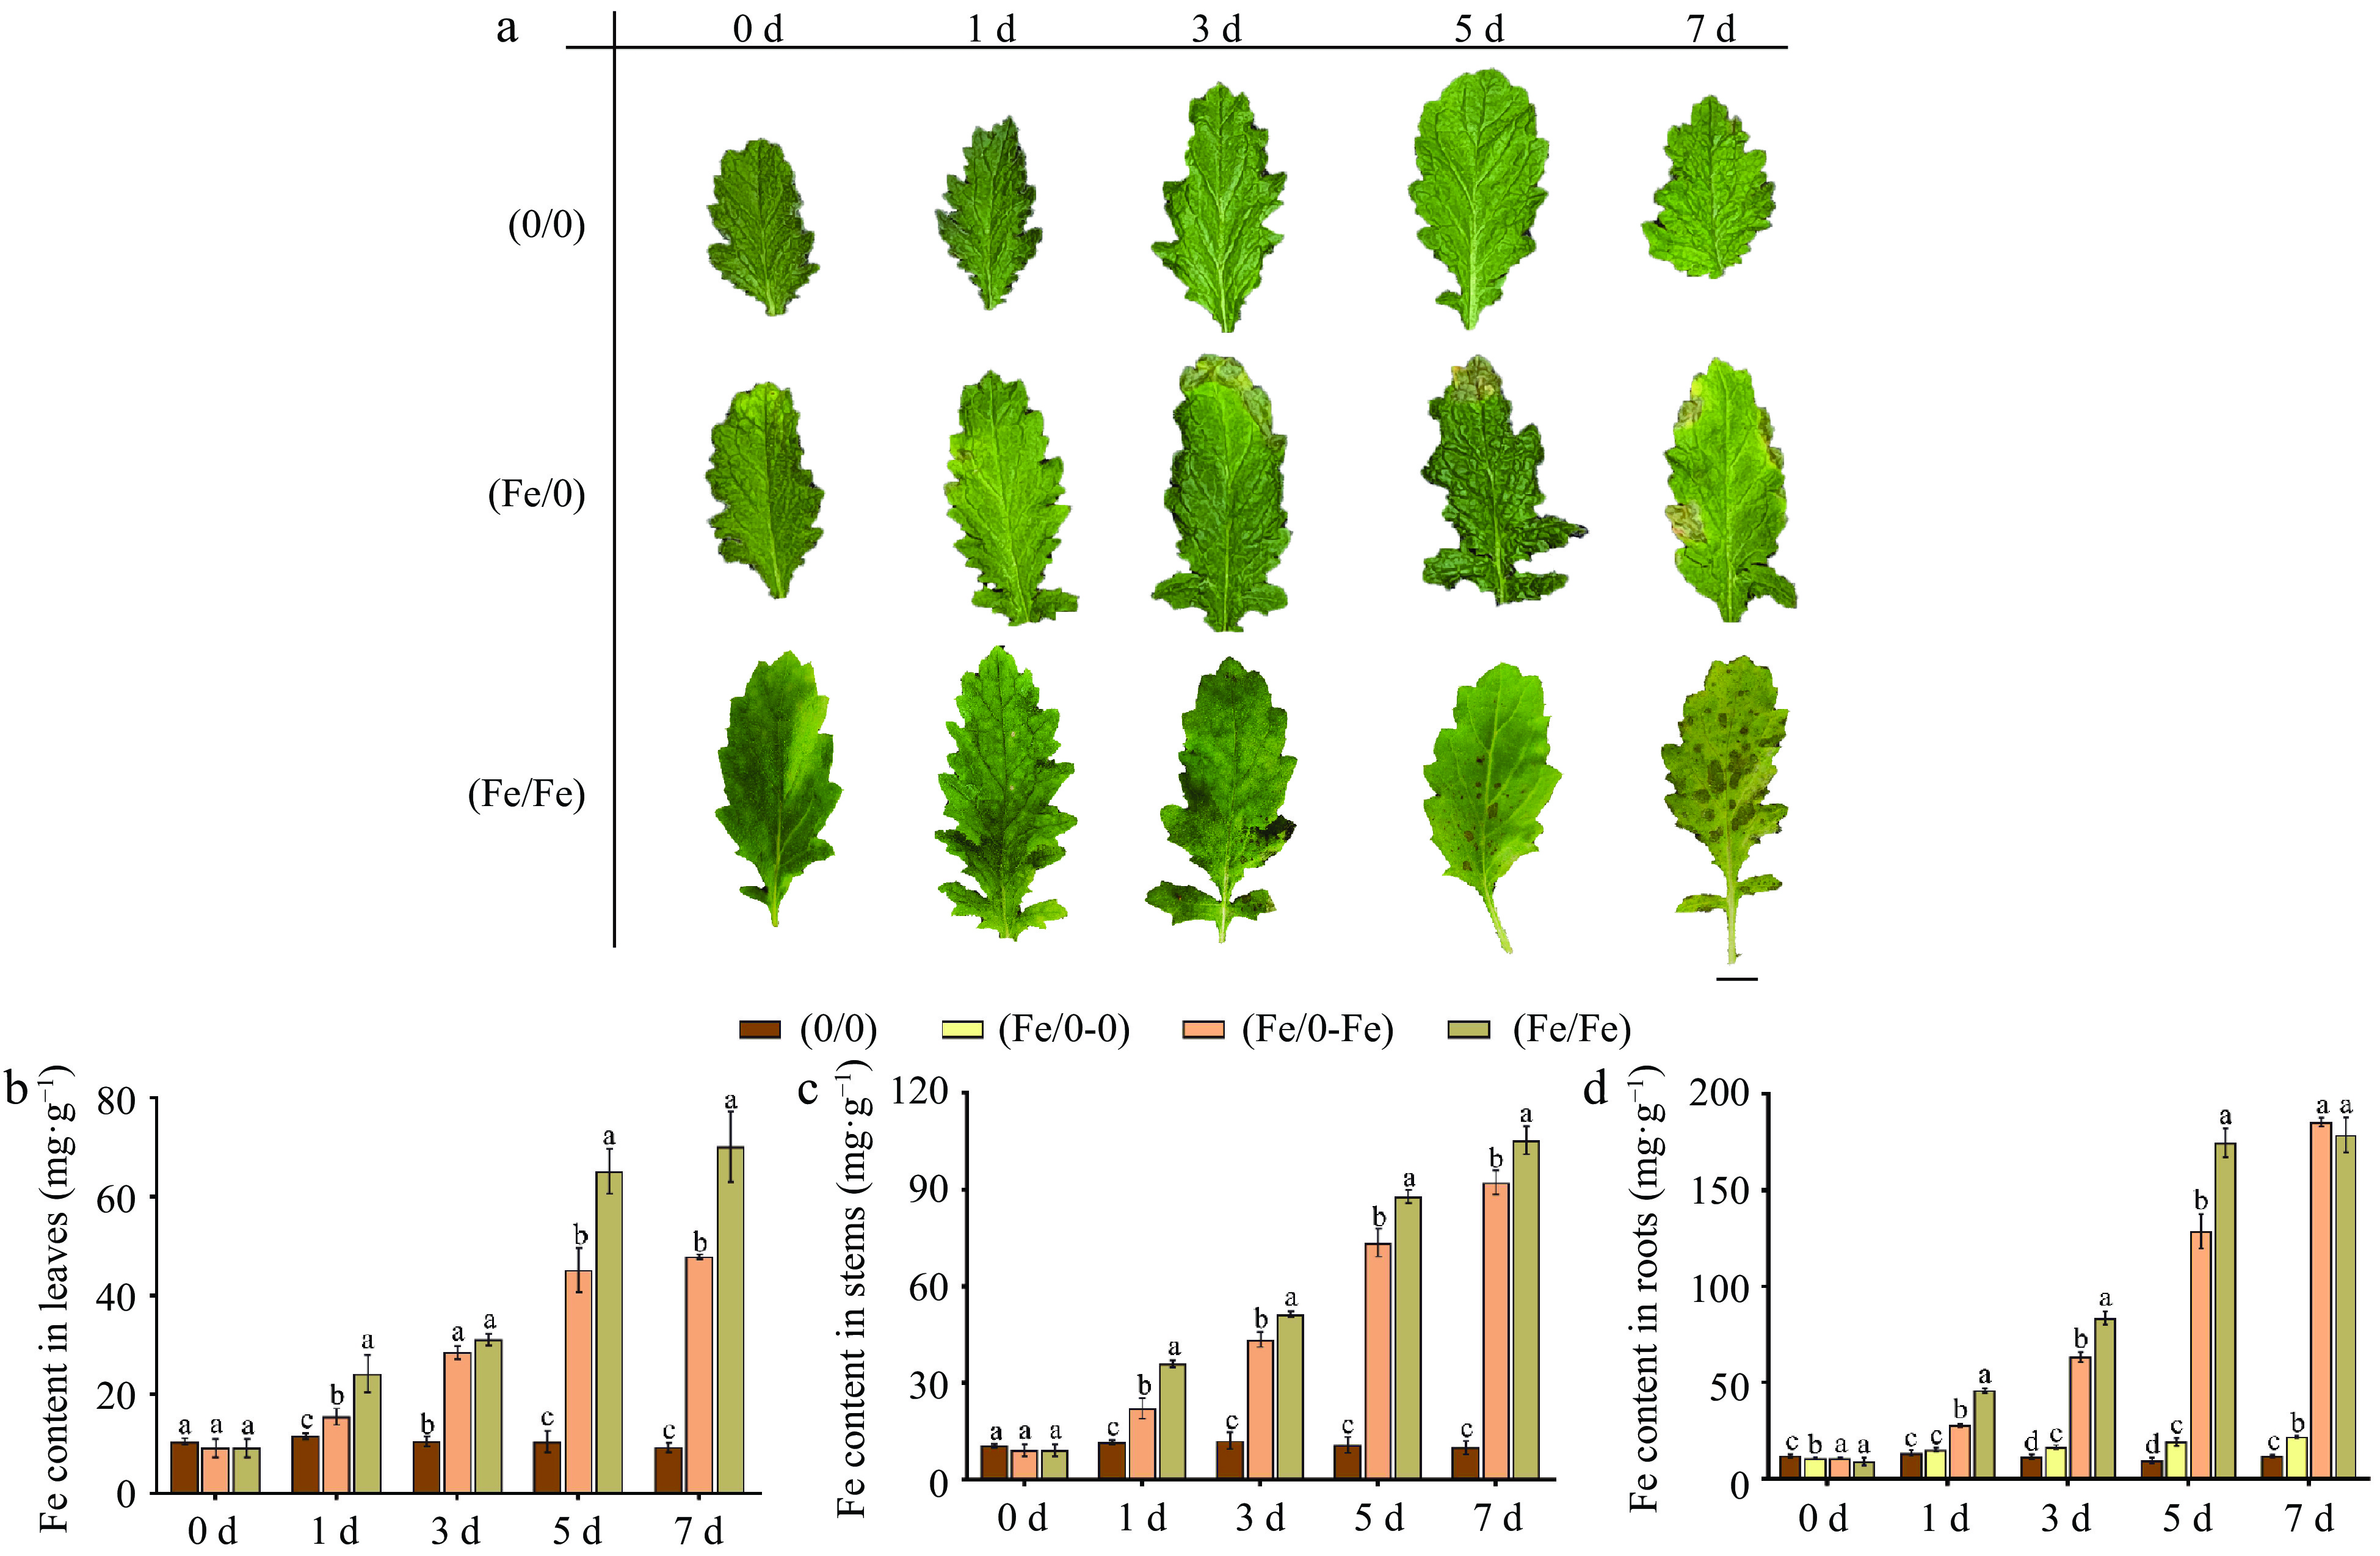
      Figure 2. 

      (a) Leaf phenotypes in split-root system under Fe2+ treatment of C. blinii. Bar = 1 cm. Fe content in (b) leaves, (c) stems and (d) roots in split-root system under Fe2+ treatment. The concentration of Fe2+ treatment was 200 μM. All experiments were performed using at least three biological replicates and error bars indicate standard deviations (± SD). Different letters indicate significant differences at the p < 0.05 level when comparing different experimental groups.

    • For further investigation, oleanolic acid content in different tissues with split-root was examined, which was used to indicate the interaction between Fe2+ and the MVA pathway. The oleanolic acid content in leaves showed a significant decrease when roots were exposed to Fe2+, decreasing from 0.89 mg·g−1 to approximately 0.40 mg·g−1 (Fig. 3a). In contrast, oleanolic acid content in roots presented a fluctuating increase, reaching a maximum value of 0.78 mg·g−1 at 4 d (Fig. 3c). It is notable that in roots, the variation in oleanolic acid content of the (Fe/0) group appeared to be dichotomous, while the (Fe/0-0) group varied similarly to the (0/0) group, as well as the (Fe/0-Fe) and (Fe/Fe) groups.
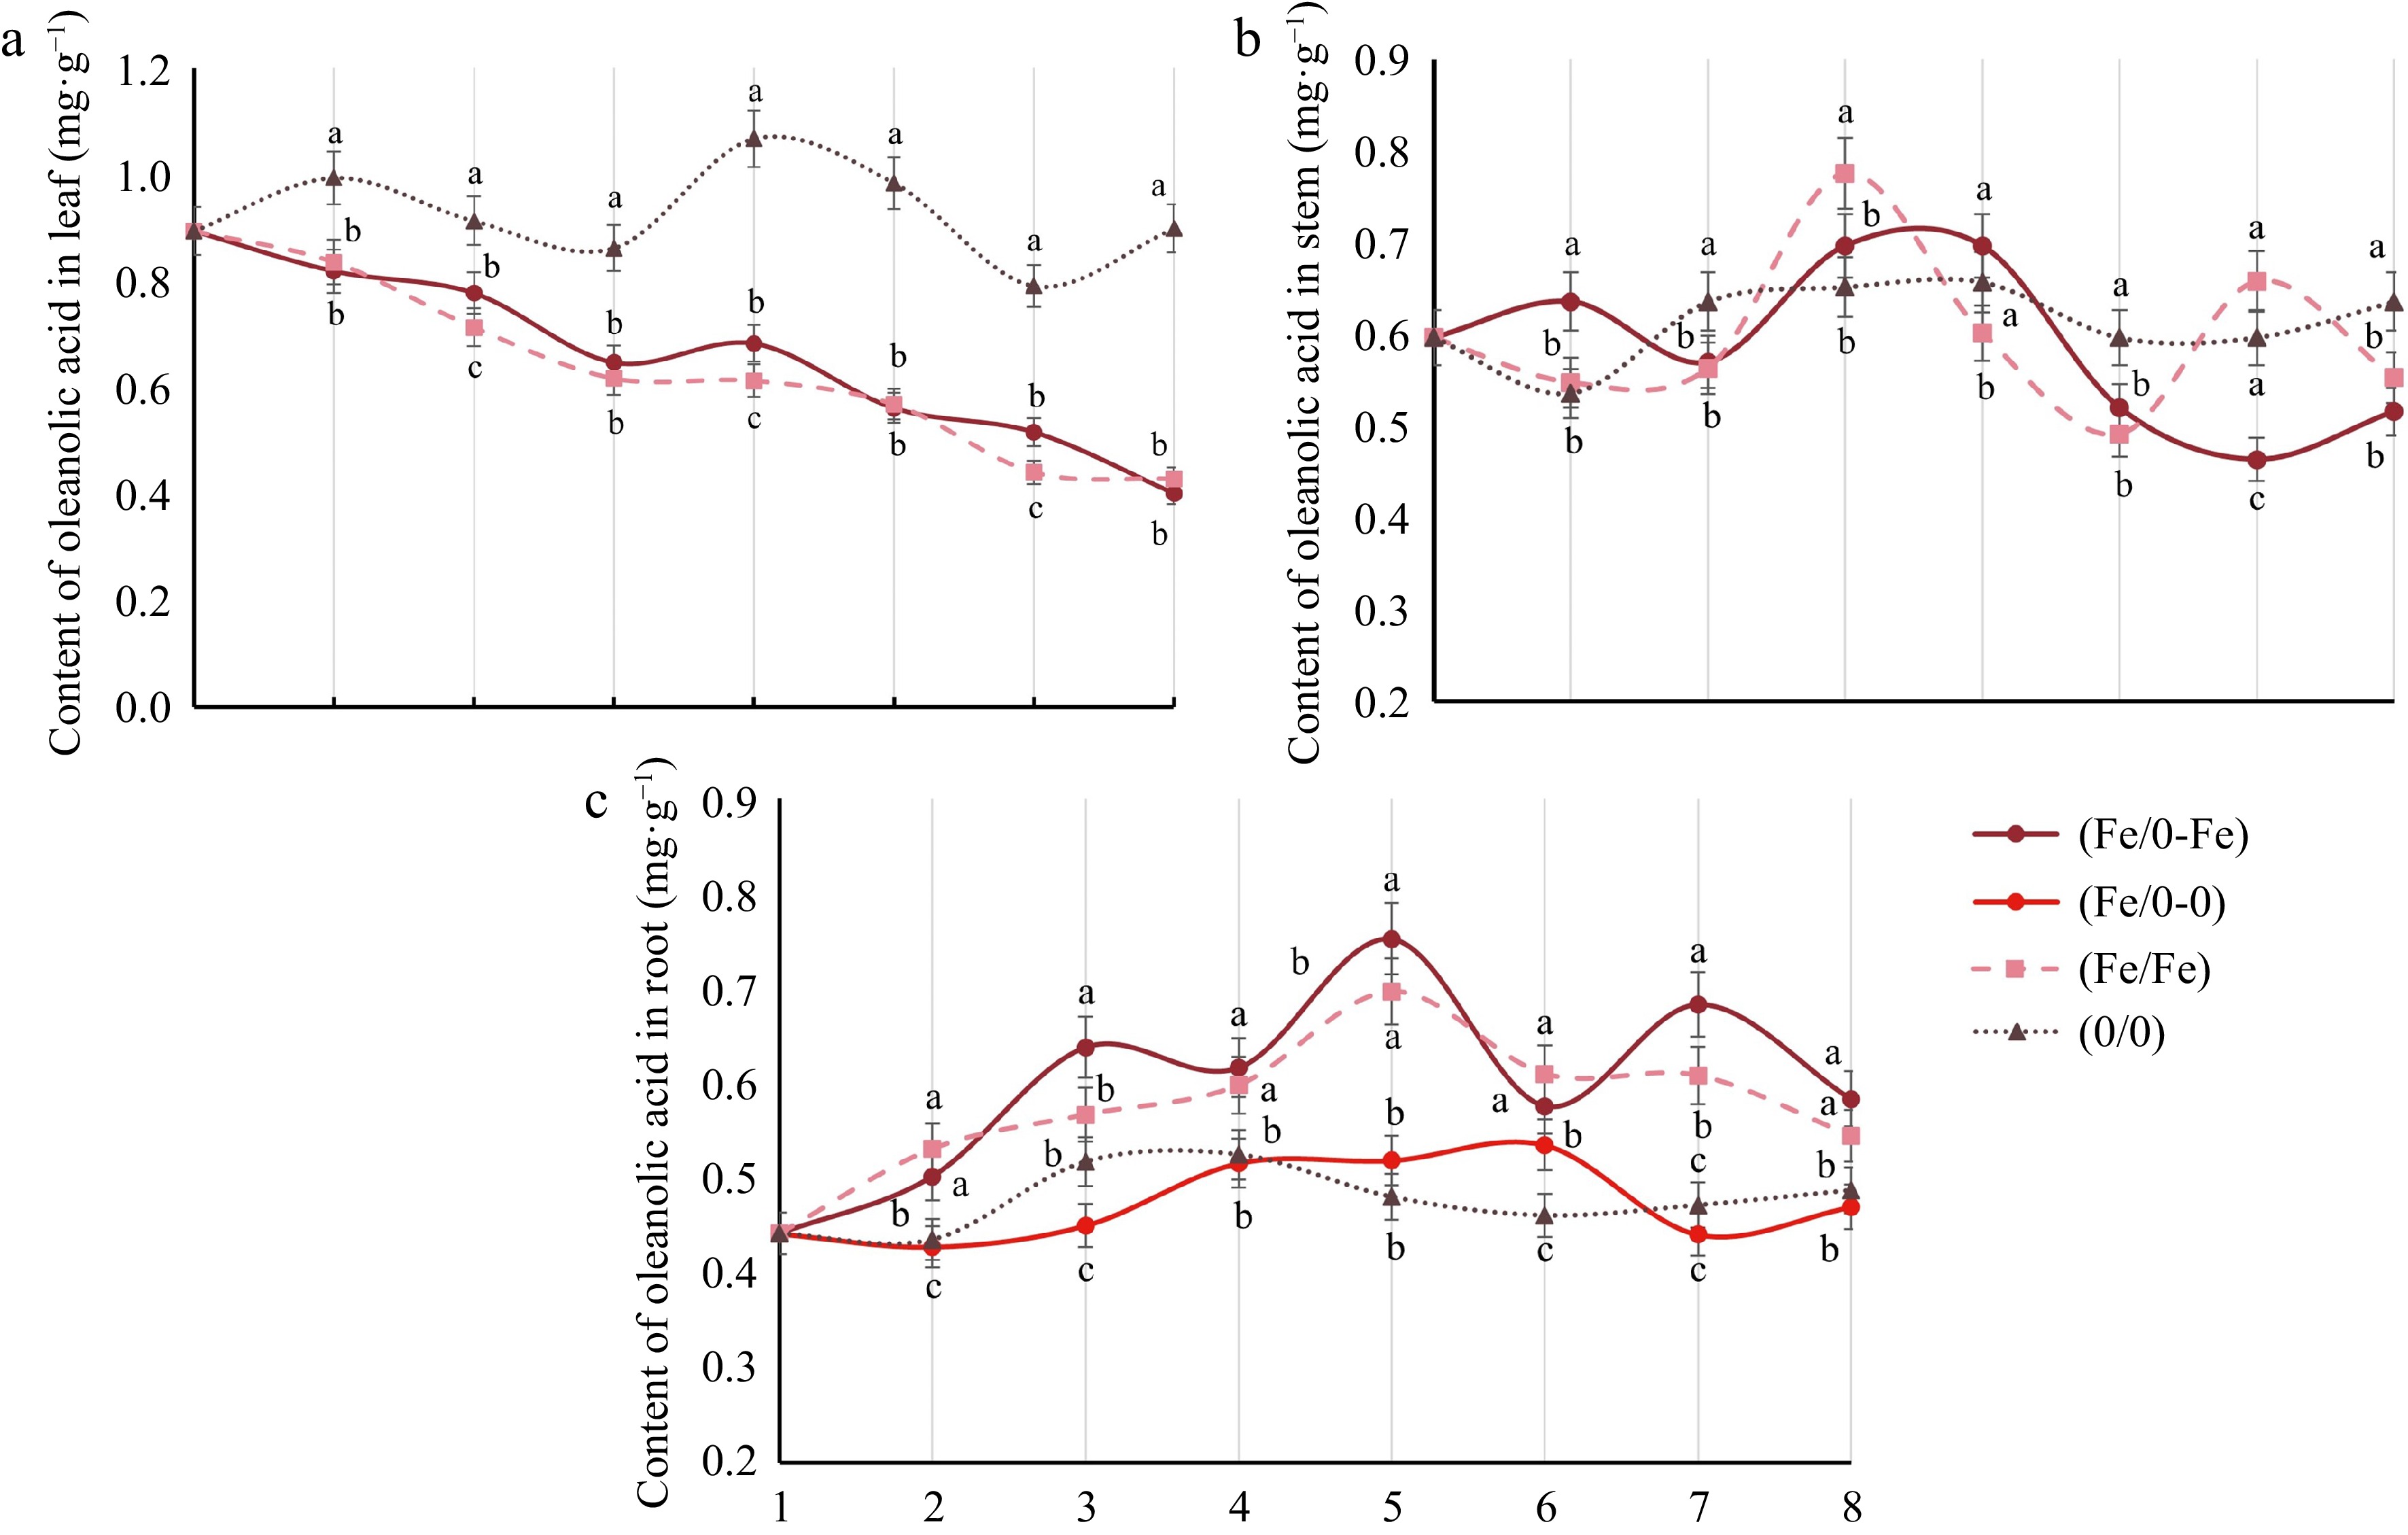
      Figure 3. 

      Analysis of oleanolic acid in various tissues of C. blinii. Oleanolic acid in (a) leaves, (b) stems and (c) roots under Fe2+ treatment with split-root system. All experiments were performed using at least three biological replicates and error bars indicate standard deviations (± SD). Different letters indicate significant differences at the p < 0.05 level when comparing different experimental groups.

    • The stimulation of Fe2+ to the leaf MVA pathway was not affected by split-root, either in the (Fe/Fe) or (Fe/0) groups (Fig. 4a). The most significantly stimulated was CbHMGR, which showed a 5.59-fold increase in relative expression at 5 d in (Fe/Fe). There was a 3.49-fold increase in the relative expression of CbHMGR at 3 d in (Fe/0). The stimulation of MVA metabolism was stronger for (Fe/Fe) than (Fe/0) in leaves. However, in root tissues, the difference in the distribution of Fe2+ has brought a variation in the relative expression of MVA genes. The maximum relative expression values of CbHMGR were 7.13 and 2.49 in the (Fe/0-Fe) and (Fe/0-0) groups, respectively, while the maximum relative expression of the (Fe/Fe) group was 5.86 (Fig. 4c). The activity of MVA metabolism in stems also fluctuated due to the existence of Fe2+ (Fig. 4b). These results suggested that Fe2+ is a direct stimulating signal for the MVA metabolic pathway.
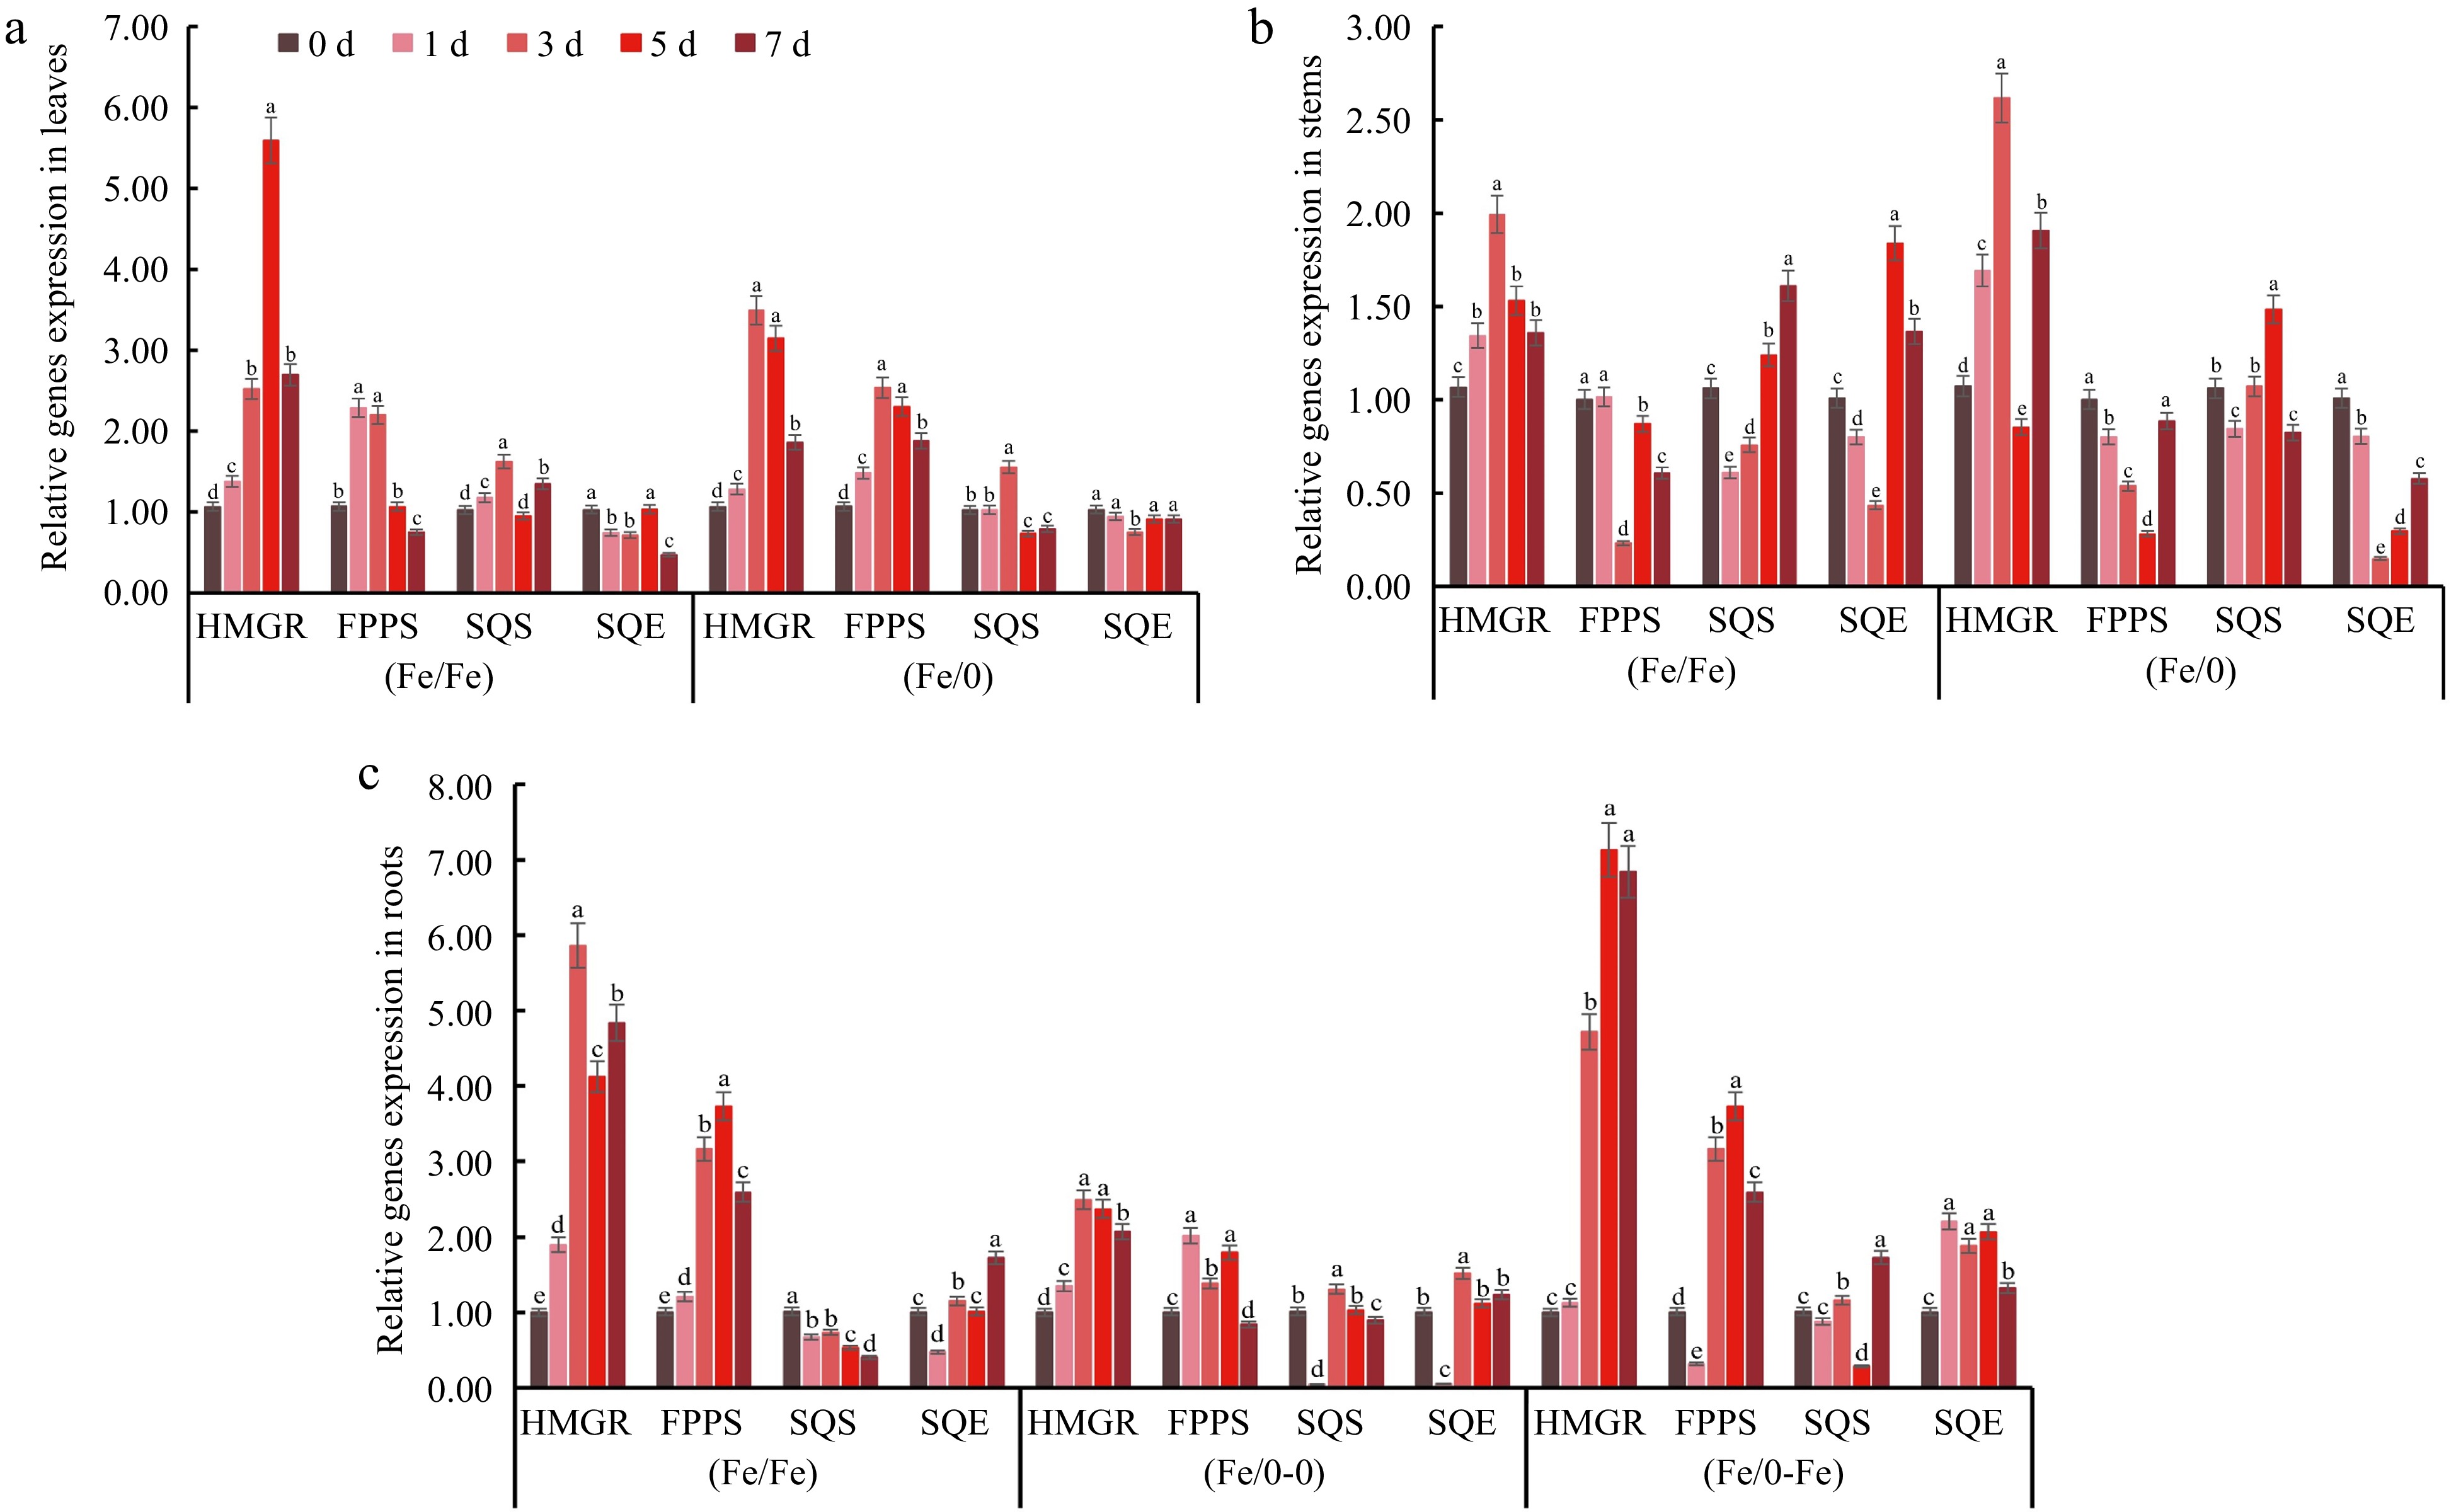
      Figure 4. 

      Relative expression of key MVA pathway genes in various tissues. The genes relative expression in (a) leaves, (b) stems and (c) roots under Fe2+ treatment with split-root system. All experiments were performed using at least three biological replicates and error bars indicate standard deviations (± SD). Different letters indicate significant differences at the p < 0.05 level when comparing different experimental groups. The 2ΔΔCᴛ method was used to determine the relative expression and the genes relative expression of (0/0) group were set to '1'.

    • In comparison to oleanolic acid, the blinin content among tissues showed significant differences under Fe2+ treatment with split-root system. The blinin content increased from 0.24 to 0.55 mg·g−1 and 0.61 mg·g−1 in the (Fe/0) and (Fe/Fe) groups, respectively, whereas the blinin content in (0/0) group was maintained at approximately 0.18 mg·g−1 (Fig. 5). Nevertheless, blinin was almost undetectable in stems and roots (Table 1). From this, it can be hypothesized that in comparison to the global distribution of oleanolic acid, blinin specifically accumulates in the leaves of C. blinii.
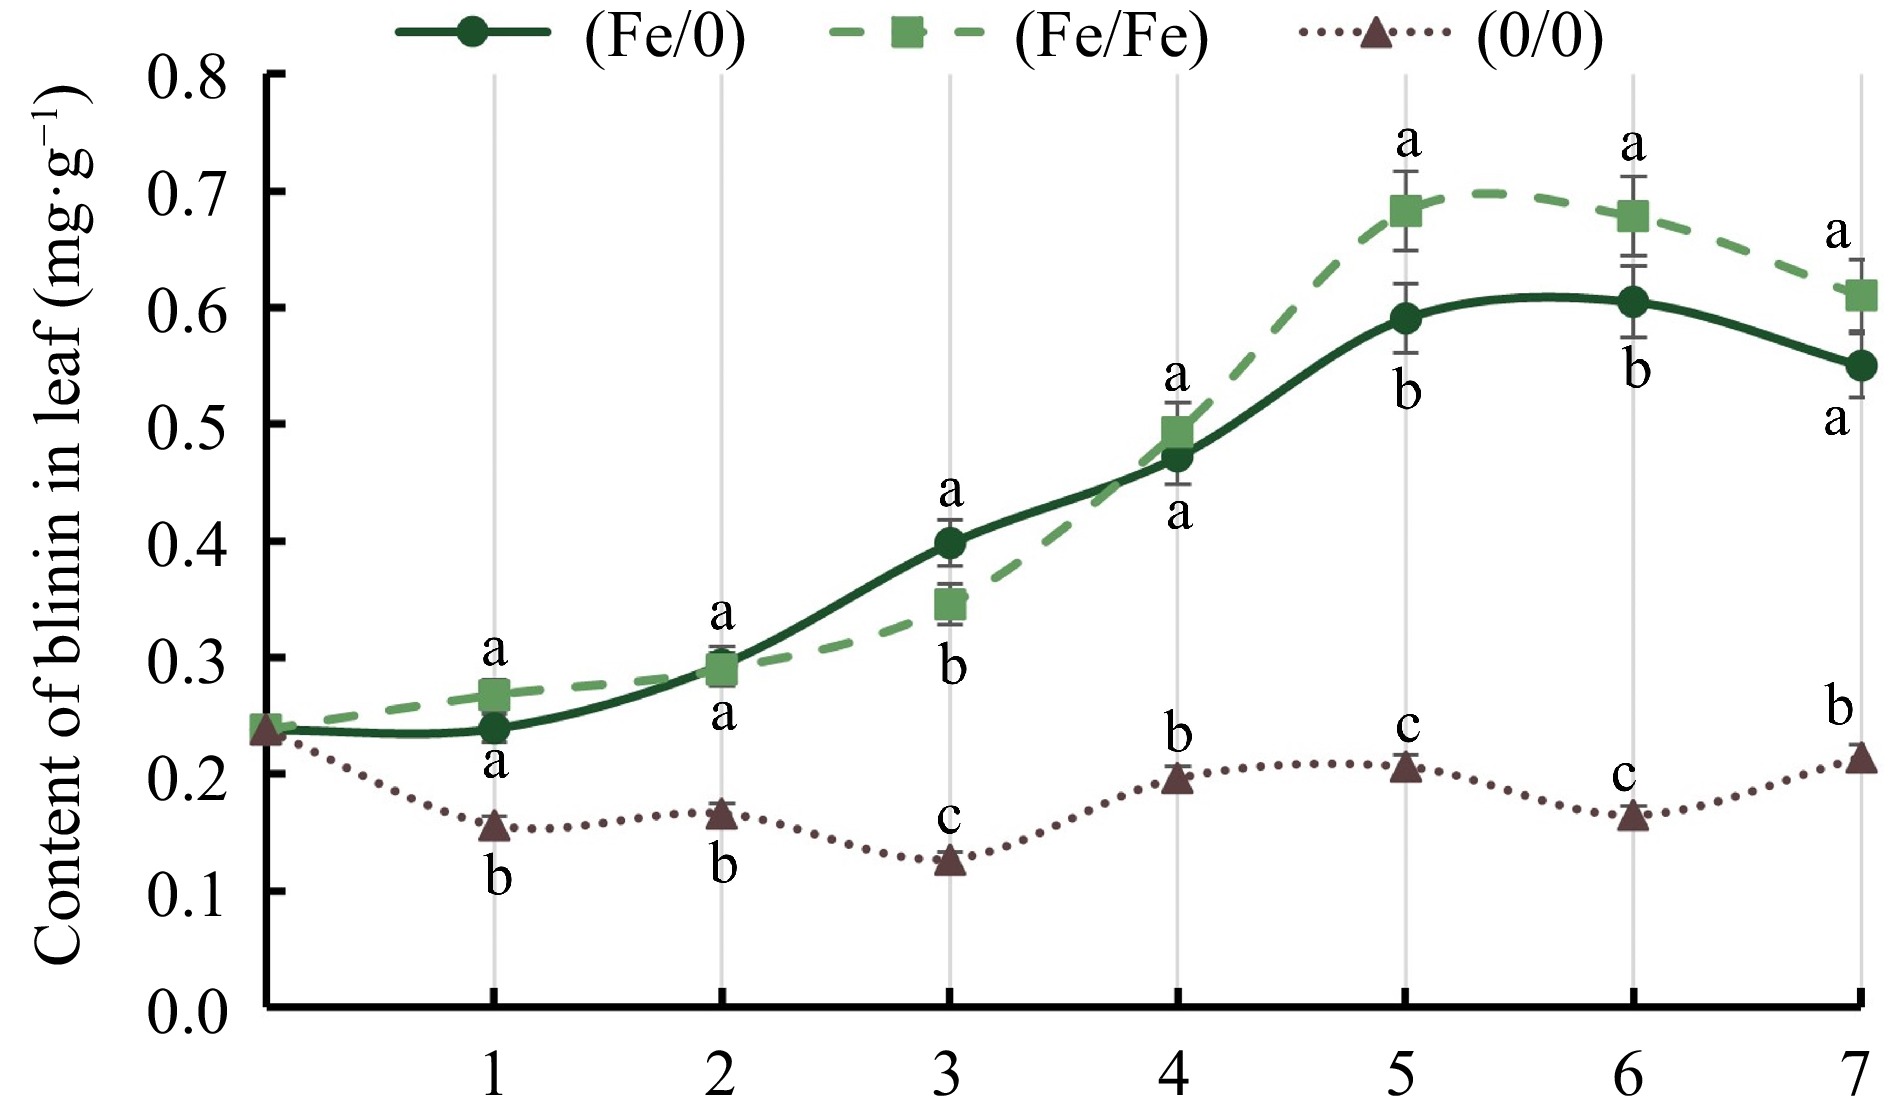
      Figure 5. 

      Analysis of blinin in leaves of C. blinii. All experiments were performed using at least three biological replicates and error bars indicate standard deviations (± SD). Different letters indicate significant differences at the p < 0.05 level when comparing different experimental groups.

      Table 1.  Blinin content in stems and roots.

      Sample0 d1 d2 d3 d4 d5 d6 d7 d
      Stems (0/0)0.0138720.011378n.d.0.02471n.d.n.d.0.0121240.013872
      Stems (Fe/Fe)0.013872n.d.n.d.0.021454n.d.0.01274n.d.0.013872
      Stems (Fe/0)0.0138720.010663n.d.n.d.n.d.n.d.n.d.0.013872
      Roots (0/0)n.d.0.011252n.d.n.d.n.d.0.01274n.d.n.d.
      Roots (Fe/Fe)n.d.0.009729n.d.n.d.0.0124n.d.n.d.n.d.
      Roots (Fe/0-Fe)n.d.n.d.n.d.n.d.n.d.n.d.n.d.n.d.
      Roots (Fe/0-0)n.d.n.d.n.d.0.010065n.d.n.d.n.d.n.d.
      'n.d.' represents that the blinin content in tissue samples didn't reach the minimum detection limit of HLPC. Unit: (mg·g−1).
    • The promotion of Fe2+ on the MEP pathway has similarities to the MVA pathway. The stimulating effect on CbDXR was more obvious than CbDXS (Fig. 6a). The relative expression of CbDXR reached maximum values of 3.4 and 5.8 in (Fe/Fe) and (Fe/0) groups, respectively, in leaves. The highest relative expression of CbDXS was only 2 and 1.65. In addition, the relative expression of CbDXR reached maximum values of 3.25 and 3.34 in the (Fe/Fe) and (Fe/0-Fe) groups, respectively, in roots (Fig. 6c). The stimulating effect of Fe2+ on the expression of CbMCS and CbGGPPS remained essentially similar among the other groups. However, in the (Fe/0-Fe) group, the expression of CbDXS was downregulated by Fe2+ in split-root system. The activity of MEP metabolism pathway in stems also fluctuated due to the existence of Fe2+ (Fig. 6b). These results suggested that Fe2+ regulates the activity of the MEP pathway as well as MVA in the split-root system, which is consistent with our previous results[22]. The presence of Fe2+ encourages the activity of the MEP pathway enzyme-encoding, which is responsible for the increase in blinin content in leaves.
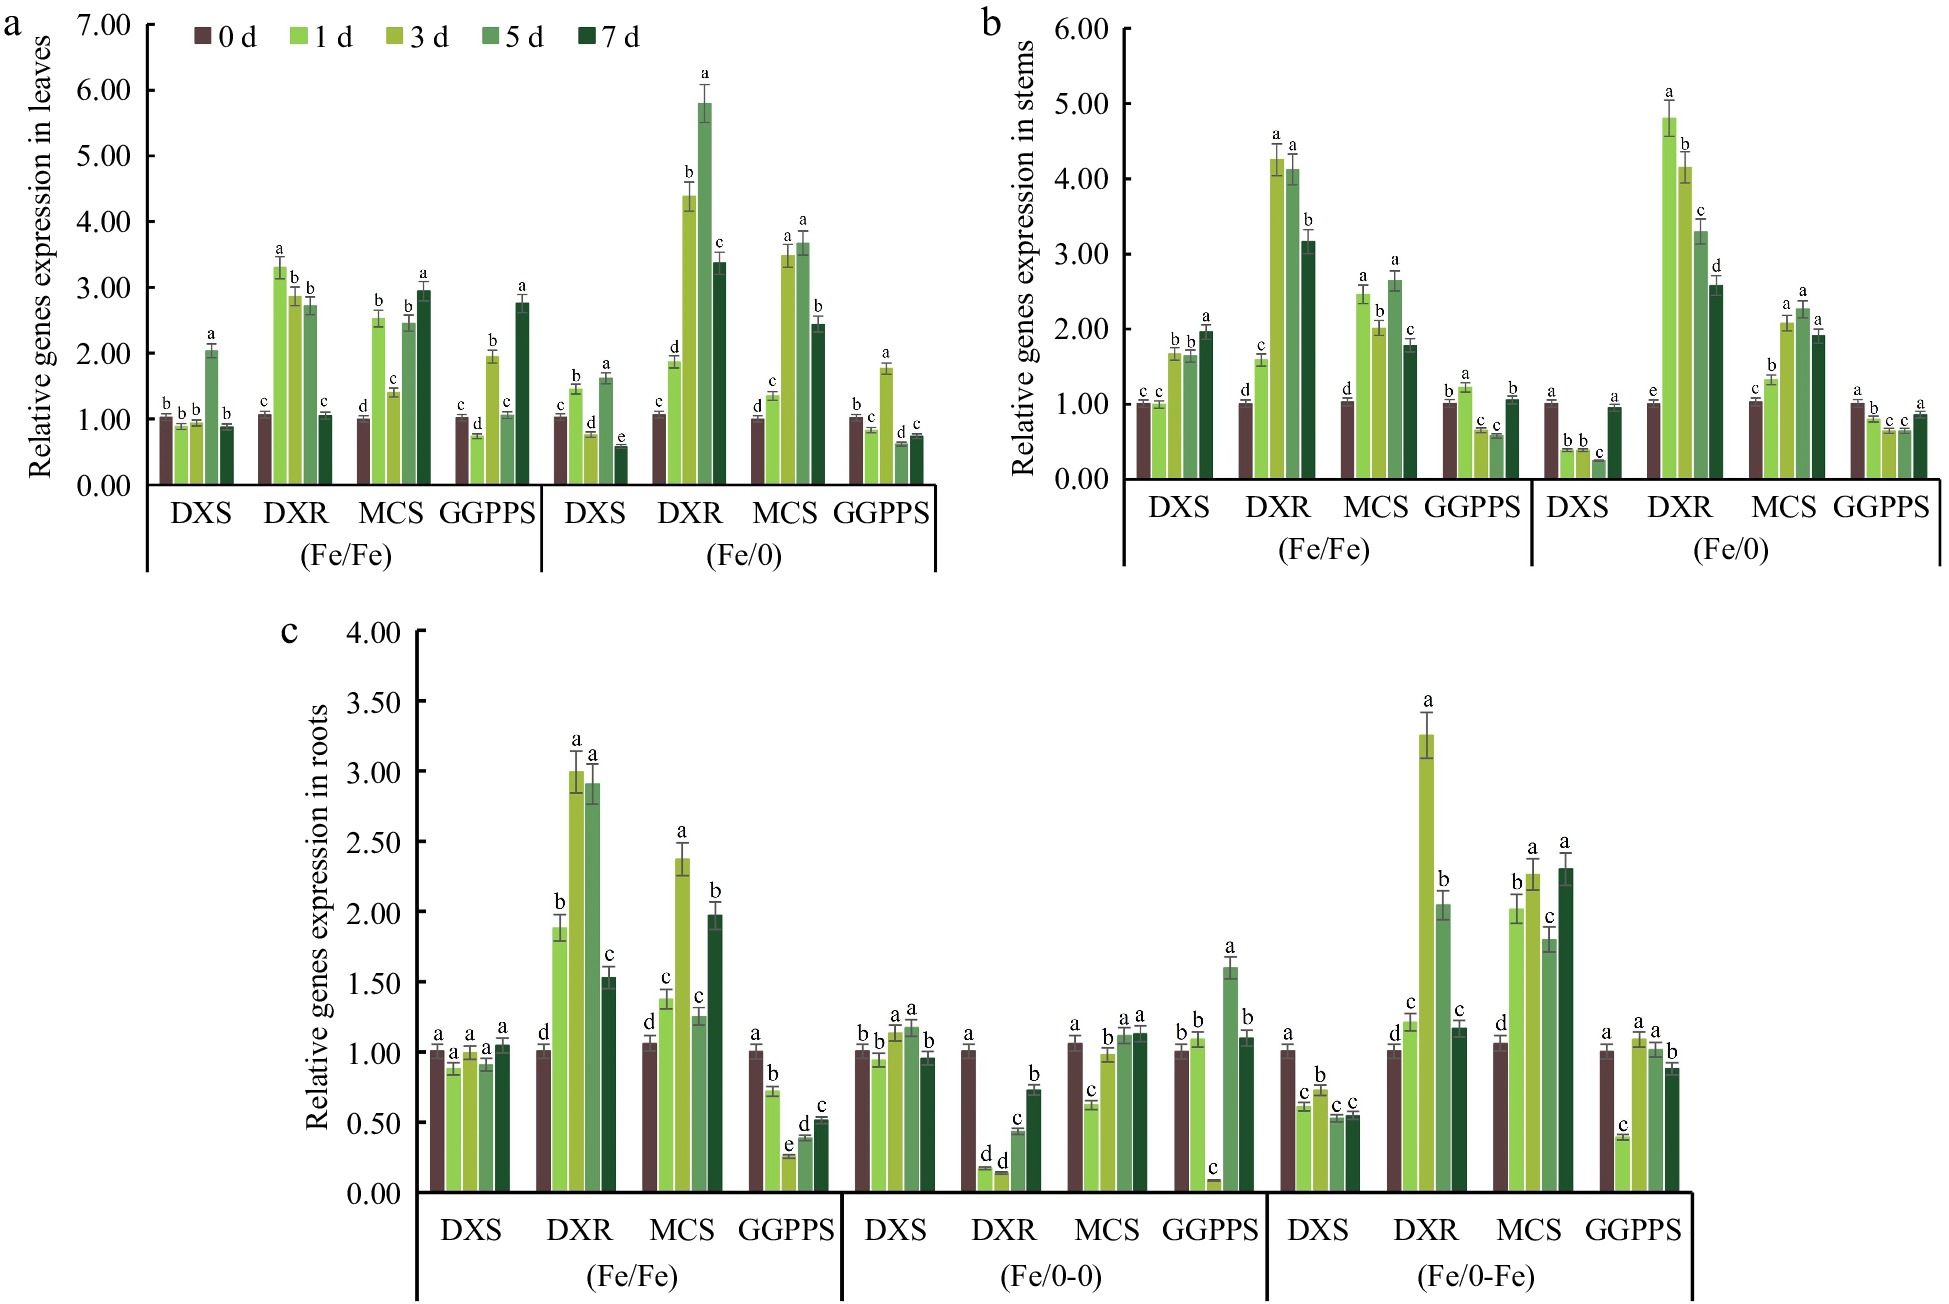
      Figure 6. 

      Relative expression of key MEP pathway genes in various tissues. The gene relative expression in (a) leaves, (b) stems and (c) roots under Fe2+ treatment with split-root system. All experiments were performed using at least three biological replicates and error bars indicated standard deviations (± SD). Different letters indicate significant differences at the p < 0.05 level when comparing different experimental groups. The 2ΔΔCᴛ method was used to determine the relative expression and the genes relative expression of (0/0) group were set to '1'.

    • The presence of Fe2+ reduced the Olas content in leaves but increased it in roots, suggesting the possibility that Olas was transferred to roots. PDR genes have been reported to have the ability to transport terpenoids[24]. There was no significant fluctuation in the relative expression of CbPDR in the (0/0) group, but the peak values of CbPDR were 8.42 and 10.51 in the (Fe/Fe) and (Fe/0) groups in leaves. The maximum CbPDRs were 4.47 and 10.10 in the (Fe/Fe) and (Fe/0) groups in stems, respectively. Notably, the relative expression of CbPDR in the (Fe/0-0) group was significantly increased by Fe2+ in the end. Above all, it can be assumed that Olas was transported by PDR through leaves to roots, responding to the stimulation of Fe2+.

    • In this study, the metabolism and accumulation of blinin and Olas were explored by a split-root system under Fe2+. Split-root experiments have been widely used in research focused on understanding the complex regulatory mechanisms of legume-rhizobium symbiosis, root nitrogen rhizobium deposition and belowground nitrogen translocation, as well as the effects of different biotic/abiotic factors on such symbiotic interactions[25,26]. The split-root method has been employed to study the transport of phosphorus by wheat[27]. Luo et al.[28] treated one side of the cotton root system with PEG and found that the JA content of cotton leaves increased and was transported through the phloem to increase ABA synthesis in the root system that was not treated with PEG, up-regulated the expression of GhPIP, and promoted water uptake in the other side of root. Similarly, after treating one side of the roots with Fe2+, there was some increase of saponin content in the other side of the roots that were not exposed to Fe2+ (Fig. 3). The response of saponins to Fe may be tissue-specific, but it is possible that some saponins may 'get lost'.

    • Fe2+ signaling modifies the original accumulation pattern of terpenoids in C. blinii. The accumulation of natural ingredients in medicinal plants is characterized by tissue variation. Artemisinin synthesis-related regulators are specifically expressed in glandular trichomes, while the accumulation of artemisinin in glandular trichomes is also higher than that in other tissues[29,30]. Plant secondary metabolites can be detected throughout the plant, but in some cases the site of biosynthesis is limited to a single organ and is transported to different storage sites via vascular tissues or symbiotic and non-symbiotic transport, depending on the polarity of the metabolites[31,32]. The yield and concentration of SMs produced by plants is determined by the balance between biosynthesis, storage and degradation, which depends on which secondary metabolites become the dominant phase[33]. The increased level of Olas in roots exposed to iron suggests that Olas seems more probable to be a defense against Fe2+ in C. blinii. Changes in Olas content precede those of blinin, and changes in the first step enzyme-encoding gene CbHMGR also precede that of CbDXS, revealing that the MVA pathway responds earlier than the MEP pathway to root Fe2+. MVA and MEP are two metabolic pathways located in the cytoplasm and chloroplast respectively[34]. MVA pathways may receive stimulatory effects from Fe2+ more quickly.

    • The transport of active ingredients is the basic protection for the maintenance of the vital activities of different tissues. In plants, terpenoids are usually transported from the cell in which they are synthesized to an adjacent cell or from the synthesized tissue to other tissues, which involves many transport proteins[3537]. PDR transporter proteins are involved in plant defense through active transport of terpenoids through vesicular segregation and exocytosis to achieve intracellular and intercellular transport, AaPDR3 and NtPDR1 have been reported to be involved in terpenoid transportation[38,39]. In this experiment, CbPDR was upregulated in all tissues, suggesting that basic Olas transportation occurred (Fig. 7). As PDR expression was more active in groups (Fe/0) and (Fe/Fe), it is presumed that Olas was transported from leaves to the roots via the stem to adapt to Fe2+ signaling.
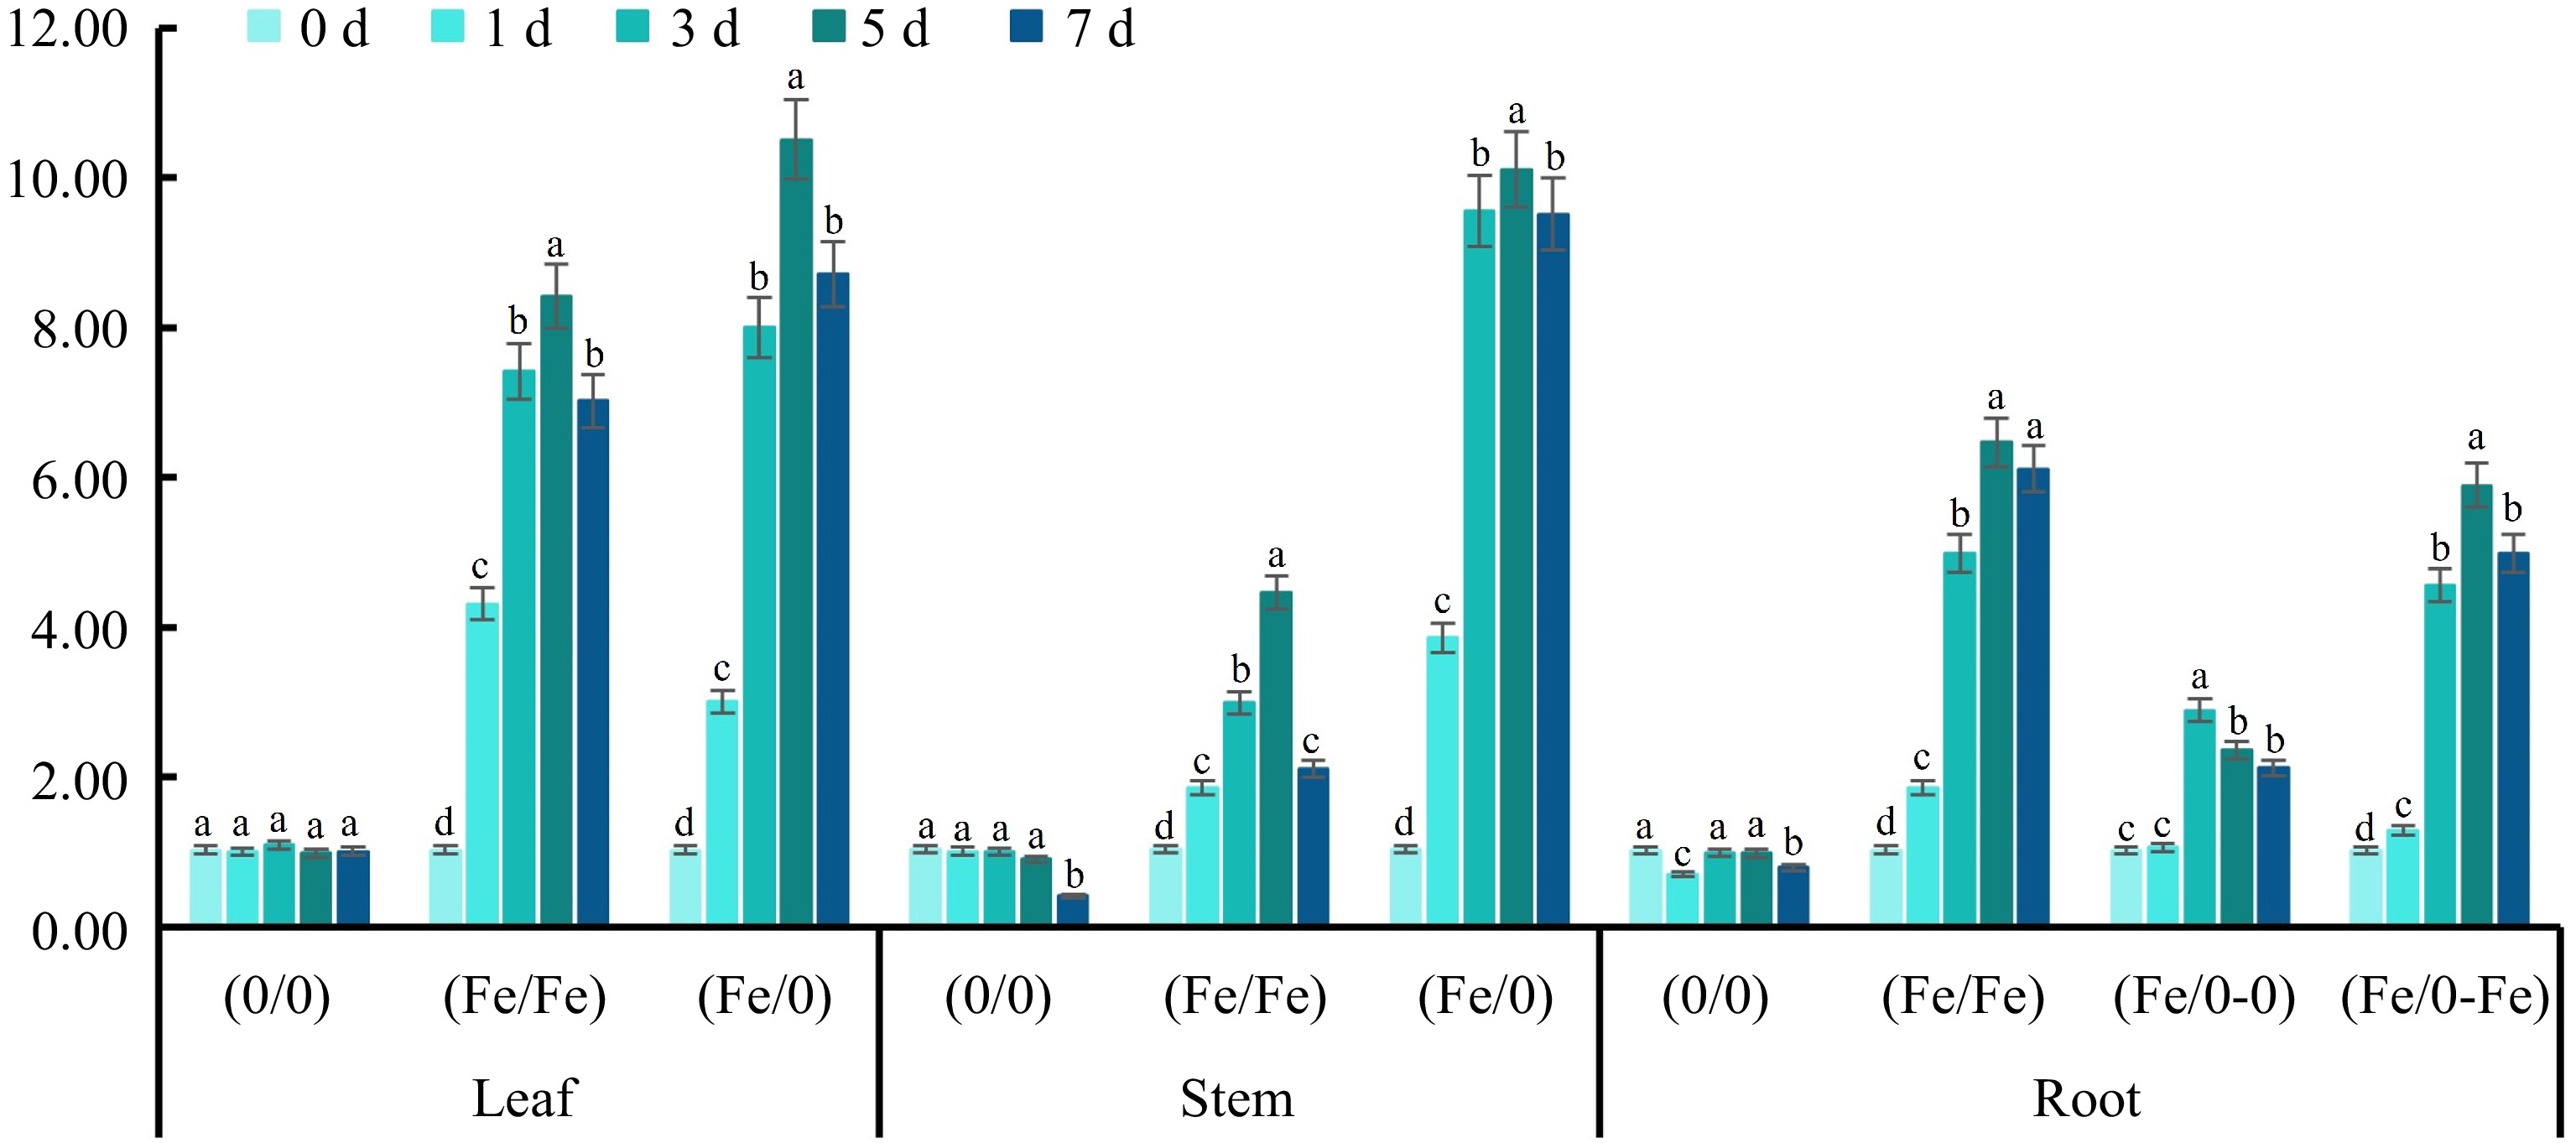
      Figure 7. 

      Relative expression of CbPDR in various tissues. The relative expression of CbPDR in (a) leaves, (b) stems and (c) roots under Fe2+ treatment with split-root system. All experiments were performed using at least three biological replicates and error bars indicated standard deviations (± SD). Different letters indicate significant differences at the p < 0.05 level when comparing different experimental groups. The 2ΔΔCᴛ method was used to determine the relative expression and the genes relative expression of (0/0) group were set to '1'.

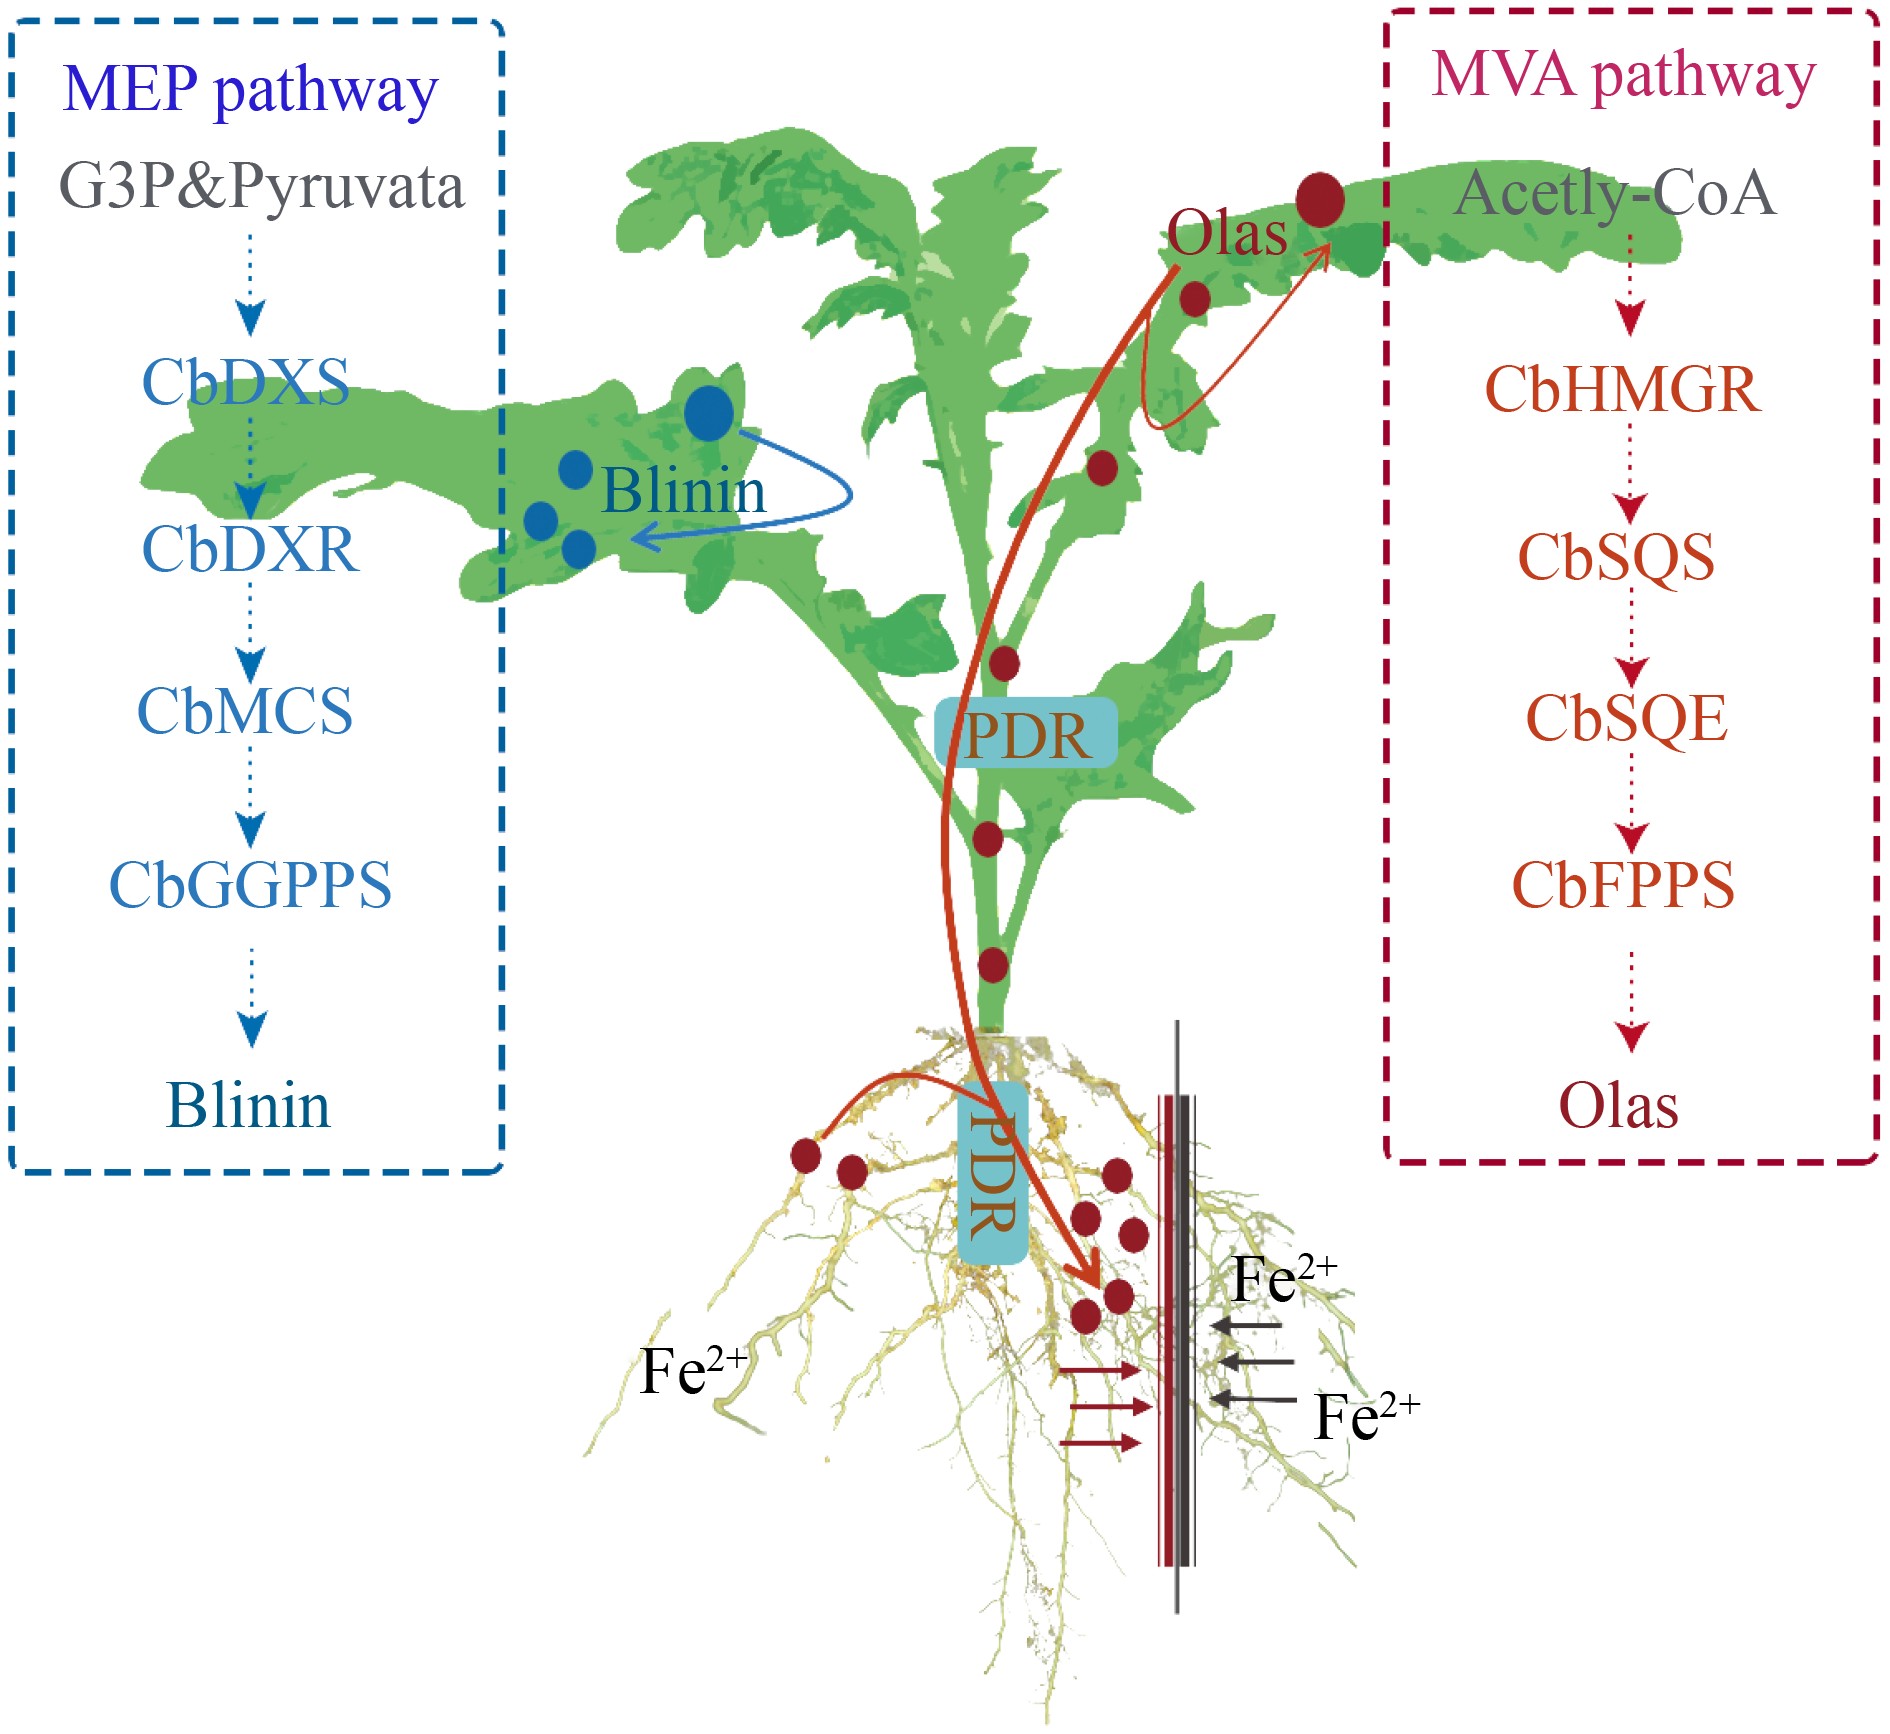
      Overall, our studies revealed that root Fe2+ could modify the original cumulative pattern of blinin and Olas in C. blinii. On the one hand, blinin was accumulated specifically in leaves, which depended on the time of root Fe2+ treatment. On the other hand, Fe2+ induced Olas targeted translocation and accumulation in roots of C. blinii (Fig. 8).
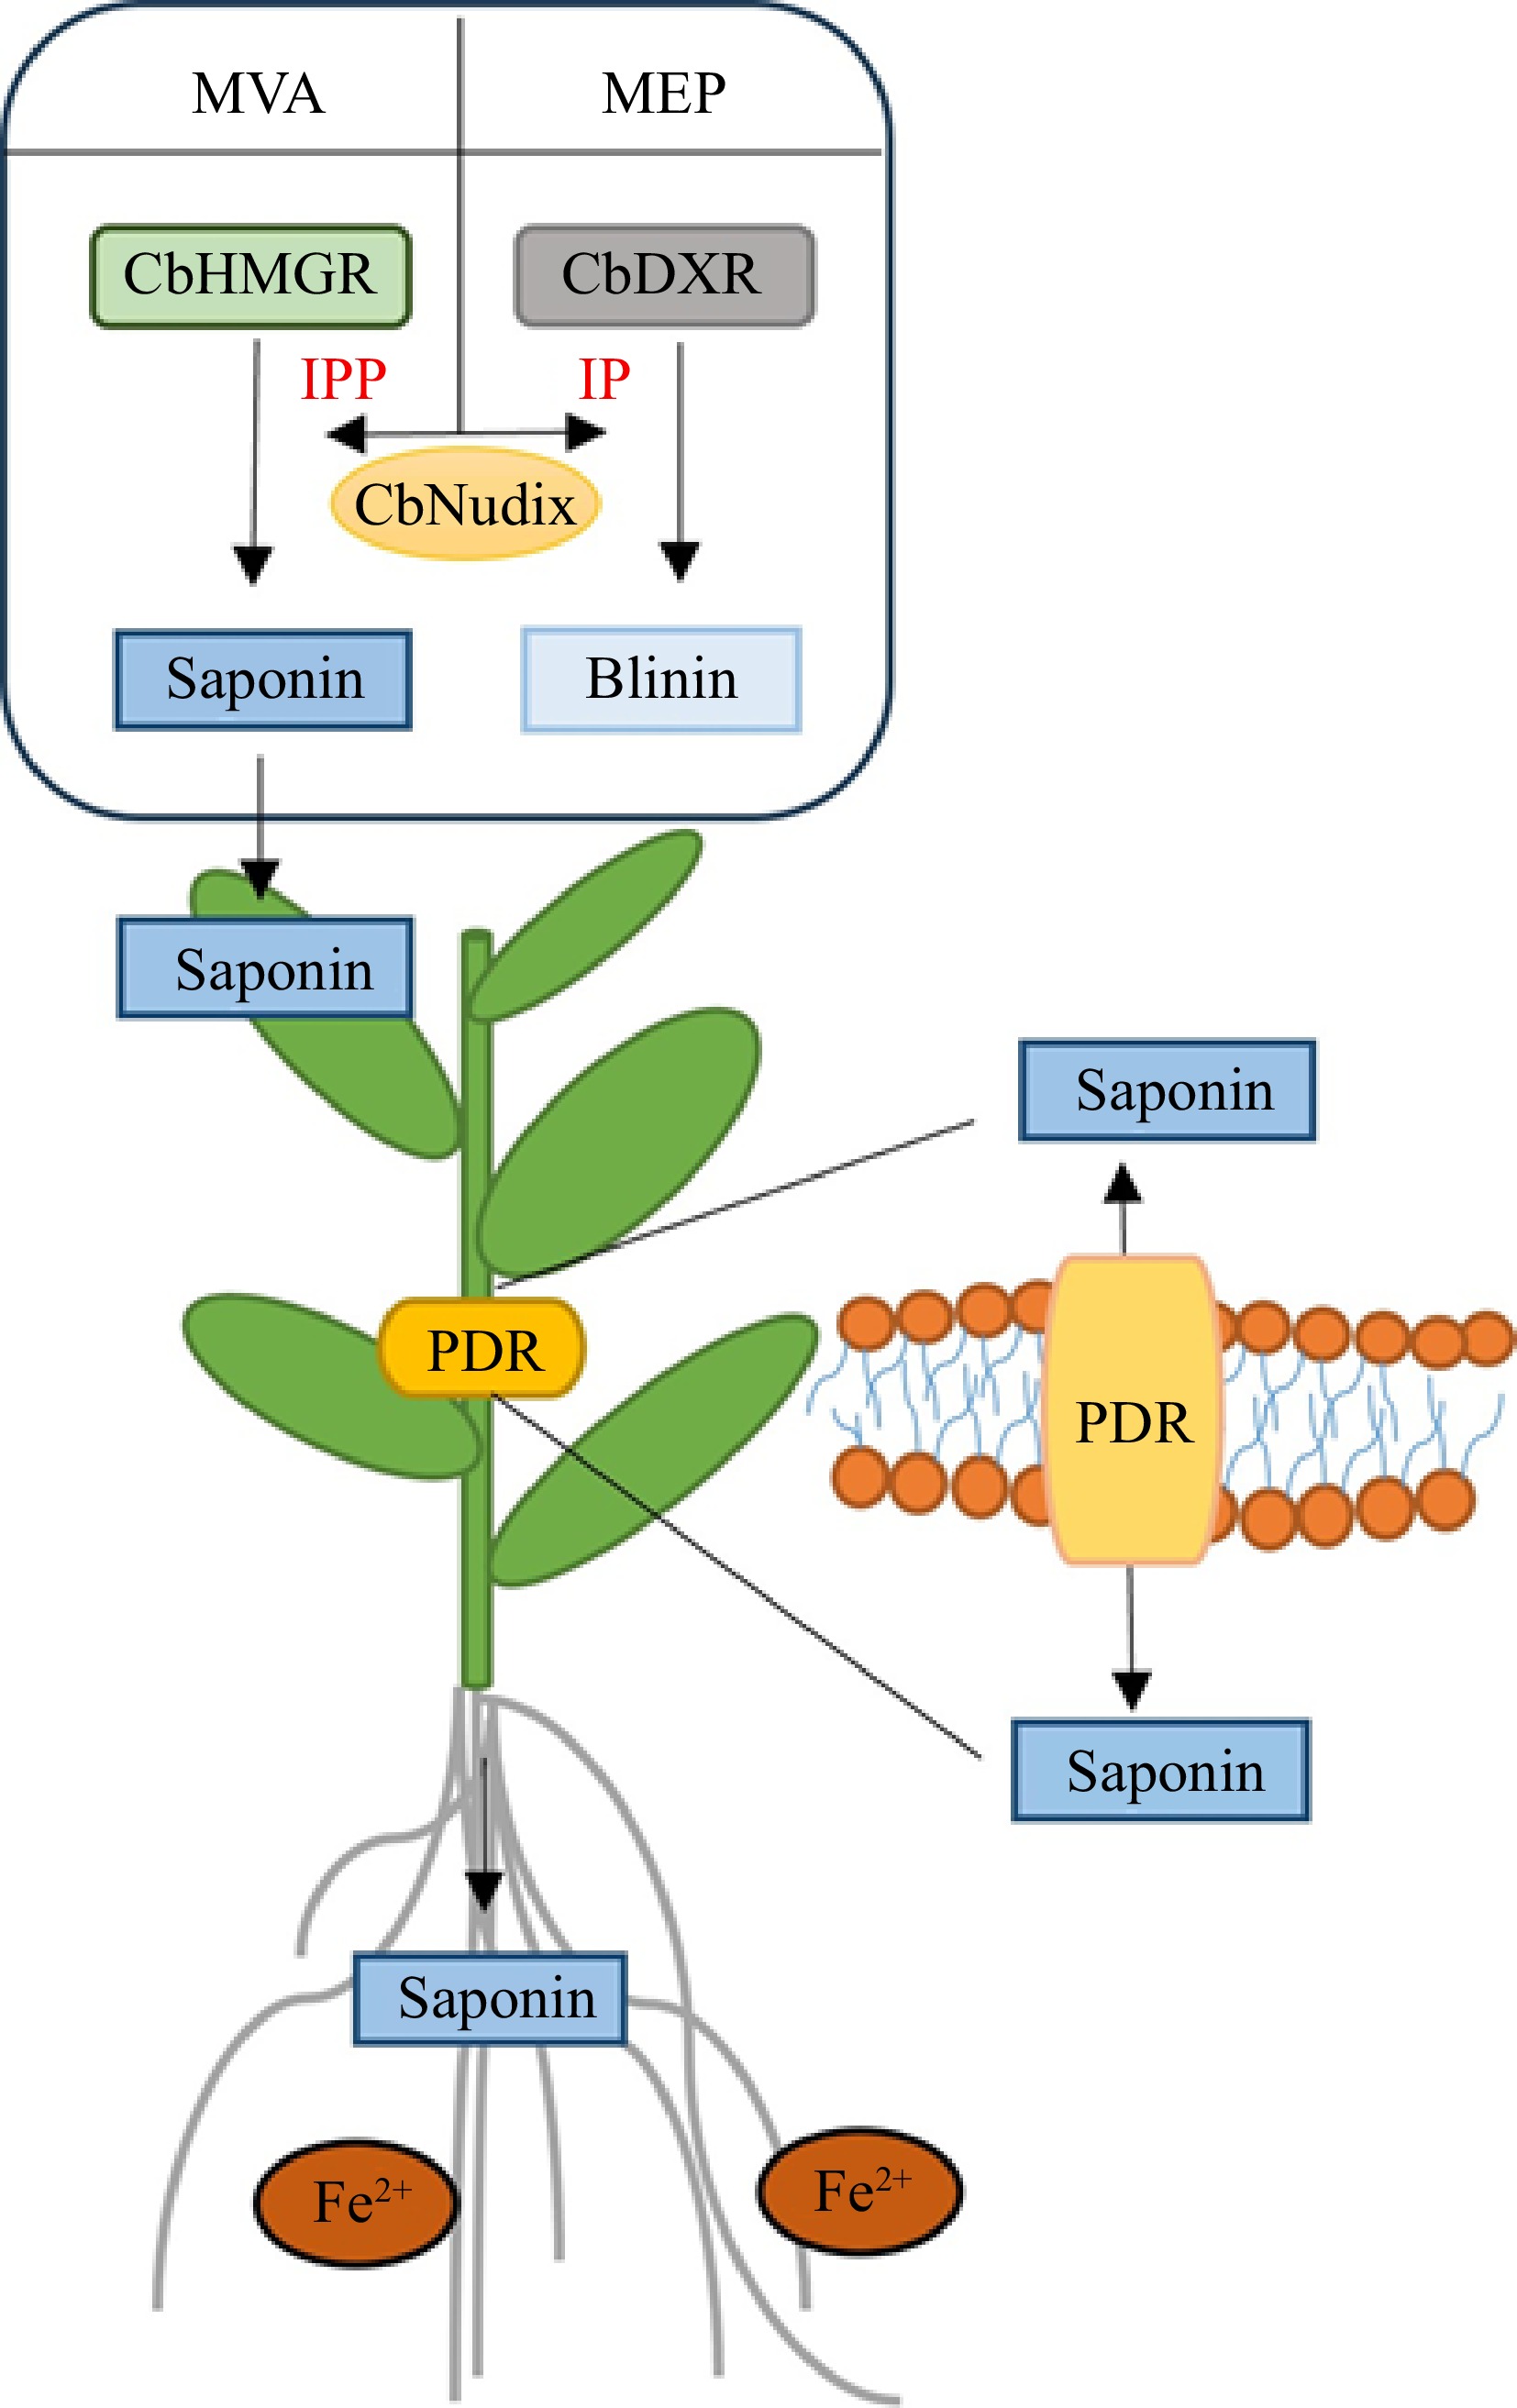
      Figure 8. 

      A model for the transportation of triterpenoid saponins by PRD under Fe2+. Under Fe2+, the activity of the MEP metabolism pathway was enhanced within C. blinii. The solid line represents signal transduction.

    • The authors confirm contribution to the paper as follows: study conception and design: Chen H, Zheng T; research performed: Wang M, Yang M, Zhan J, Zheng T, Zhou M; data analysis: Liu M, Zheng T; project administration: Liu M, Zheng T; draft manuscript preparation: Yang M, Wang M. All authors read and approved the final manuscript.

    • The previous raw data of RNA-sequencing have been deposited in the Sequence Read Archive in National Genomics Data Center (https://ngdc.cncb.ac.cn/) under accession number SRR10053375, SRR10053374 and SRR10053373.

    • We thank all the colleagues in our laboratory for providing useful discussions and technical assistance. In particular, we would like to thank the Yongchuan District Center for Disease Control and Prevention for providing HPLC services. We are very grateful to the editor and reviewers for critically evaluating the manuscript and providing constructive comments for its improvement.

      • The authors declare that they have no conflict of interest.

      • Received 25 August 2023; Accepted 8 January 2024; Published online 26 January 2024

      • The activities of MEP/MVA pathway were stimulated in all tissues by the additional rhizospheric Fe2+.

        Olas was transported from leaves to roots in response to Fe2+, which was demonstrated by the split-root system.

        The cross-tissue transportation of Olas may be mediated by the PDR transporters.

      • # Authors contributed equally: Maojia Wang, Ming Yang

      • Copyright: © 2024 by the author(s). Published by Maximum Academic Press on behalf of Hainan University. This article is an open access article distributed under Creative Commons Attribution License (CC BY 4.0), visit https://creativecommons.org/licenses/by/4.0/.
    Figure (8)  Table (1) References (39)
  • About this article
    Cite this article
    Wang M, Yang M, Zhou M, Zhan J, Liu M, et al. 2024. Effect of rhizospheric Fe2+ on terpenoid biosynthesis and accumulation within Conyza blinii H. Lév. Tropical Plants 3: e003 doi: 10.48130/tp-0024-0003
    Wang M, Yang M, Zhou M, Zhan J, Liu M, et al. 2024. Effect of rhizospheric Fe2+ on terpenoid biosynthesis and accumulation within Conyza blinii H. Lév. Tropical Plants 3: e003 doi: 10.48130/tp-0024-0003

Catalog

  • About this article

/

DownLoad:  Full-Size Img  PowerPoint
Return
Return