ARTICLE   Open Access    

From gene expression to flower patterns: genome-wide characterization of the MADS-box gene family in passion fruit (Passiflora edulis)

  • # Authors contributed equally: Chang An, Jingyi Liao, Lin Lu

More Information
  • Received: 03 November 2023
    Revised: 15 January 2024
    Accepted: 23 January 2024
    Published online: 20 February 2024
    Tropical Plants  3 Article number: e004 (2024)  |  Cite this article
  • 52 MADS-box genes were identified in passion fruit genome, and the reduction of type I genes contributed to the reduction in the size of the MADS-box gene family.

    A putative flower regulation ABC(D)E model of passion fruit were proposed, and the unique floral structure--coronas, similar to stamens, were predominately controlled by B-, C(D)- and E-class genes.

    Many PeMADS genes were also involved in the development regulation of non-floral tissues and/or in phytohormone and stress responses.

  • Passion fruit (Passiflora edulis) is an economically valuable tropical fruit crop renowned for its nutritious juice, aromatic fragrance, and vibrant flowers with distinct floral structure, known as corona. These unique floral features make passion fruit a good candidate for the study of floral organogenesis. MADS-box genes play essential functions in various aspects of plant growth and development, especially for floral morphogenesis. However, a comprehensive investigation of MADS-box gene family members in passion fruit has not yet been conducted. Here, 52 MADS-box genes were identified in the passion fruit genome and classified into two types with five subgroups (type I: Mα, Mβ, Mγ; type II: MIKCC, MIKC*) based on phylogeny. The notable reduction in the abundance of type I MADS-box genes within the passion fruit genome, in contrast to Arabidopsis, is thought to be a contributing factor to the diminished gene number within this gene family. The structural analysis illustrated that PeMADS proteins within the same subfamily are relatively conserved. Moreover, we proposed the putative flower regulation ABC(D)E model of passion fruit and explored the regulatory genes of the characteristic structure corona. We found that the regulation of petals and stamens in passion fruit is similar to that of Arabidopsis, but differs in terms of carpels and sepals. The distinct coronas were predominately controlled by B-, C(D)- and E-class genes, supporting the speculation that the corona might have originated from stamens. Except for the core functions in the floral meristem, many PeMADS genes were also involved in the development regulation of non-floral tissues and/or in phytohormone and stress responses. The co-presence of diverse cis-regulatory elements associated with growth/developmental regulation, phytohormone and stress responses in the promoter regions of PeMADSs might be closely related to their diverse regulatory roles. The results of this study provide valuable insights into the MADS-box genes in passion fruit and their involvement in the development of floral structure. These discoveries lay the foundation for the cultivation of exceptional ornamental varieties of passion fruit.
    Graphical Abstract
  • Soil salinity is one of the major constraints to agricultural production[1] as many crop species are sensitive to salinity and generally cannot grow under NaCl at or over 100 mM[2], which is more likely to occur under an overlap of both drought and high temperature. The exposure to gradually increasing levels of NaCl is usually called salt stress, whereas sudden exposure is considered as salt shock (SS)[3]. The former often occurs in saline soils, and the latter rarely but occasionally takes place in cultivated lands that are vulnerable to flooding by large amounts of seawater[3].

    Studies on tolerance of plants to salt stress have been conducted across diverse plant species[1, 2, 49]. Even now, the mechanism of salt tolerance remains a hot topic in plant-related research fields, with numerous articles reviewing research progress[1016].

    It has been indicated that at the physiological level there are positive correlations between salt tolerance, activities of the antioxidant enzymes such as superoxide dismutase (SOD), peroxidase (POD), catalase (CAT) and ascorbate peroxidase (APX), and the synthesis of antioxidant compounds[8, 17].

    As one of the world's three major food crops, maize (Zea mays) is relatively sensitive to salt stress[18], more sensitive at emergence and seedling stages than at the flowering stage[19]. Maize planting has been expanded into salinity-affected lands because of the ever-growing demand for this crop, where this crop is bound to meet SS. Maize tolerance to salt stress is under intensive and extensive study[2030], but its response to SS, even for other plants, is still largely unclear.

    Huangzao4 (HZ4), Chang7-2 (C7-2), Ye478 (Y478) and Zheng58 (Z58) are important in-use foundation parent inbred lines for maize crossbreeding in China, of which C7-2 and Z58 are derivative inbred lines of HZ4 and Y478[31], respectively. Both HZ4 and C7-2 are of the Tangshan Sipingtou Chinese landrace germplasm, Y478 belongs to Reid's yellow dent germplasm introduced from modern American maize hybrids, and Z58 is from the Lvda red coda Chinese landrace germplasm[31]. According to our pre-experiments, HZ4, C7-2, Y478 and Z58 differed in SS tolerance. The hypothesis was that responses to SS would be different with maize lines differing in tolerance. In this study, we focused on how these maize inbred lines responded to SS in a 1× Hoagland nutrient solution supplemented with 150 NaCl.

    Maize inbred lines of HZ4, C7-2, Y478 and Z58 were grown in a growth room that had a humidity of 60%−80%, temperatures of 28 °C (day) and 26 °C (night), and 12-h light of maximum light intensity of 13,000 lux provided by SYLVANIA Luxline Plus F58W/840 fluorescent light tubes (Germany).

    In brief, maize seeds were surface-sterilized with 75% ethanol and grown in sterile moist sand at 28 °C. At the two-leaf stage, the seedlings of health and uniform growth were treated by removal of the residual endosperm and then transplanted into holes of plastic foam boards, at least six holes and two seedlings per hole for each maize line under each treatment. The plastic foam boards were placed in square plastic pots containing 1× Hoagland nutrient solution at pH 6.0, where roots of the seedlings were completely immersed in the solution. During treatments, the nutrient solution was renewed once every 2 d and vigorously aerated for 15 min every 1 h. At the three-leaf stage, the nutrient solution in the pots was renewed with the nutrient solution supplemented with 150 mM NaCl for SS. The SS treatments were conducted for 5, 24, 48, and 72 h, respectively. The seedlings that were treated by SS for 72 h were transferred for removal of SS (RSS) into the new nutrient solution without the added NaCl and resumed growth for 48 h. Parallel control seedlings were those cultivated in the nutrient solution without the added NaCl.

    Tissues were sampled from the fully expanded 2nd leaves and the roots at 10 a.m. The sampled tissues were immediately used, frozen in liquid nitrogen, or fixed for at least 24 h at 4 °C in the fixation solution containing 4% glutaraldehyde and 0.1 M of K2HPO4-KH2PO4 buffer (pH 7.2). The fixed tissues were used for the scanning electron microscopy (SEM) observation.

    The RWC assay was performed as described in the literature[32] but with minor modifications. In brief, the sampled fresh leaves were immediately weighed (fresh weight, Wf), immersed in distilled water for 24 h, placed on dried filter paper to remove water of the leaf surface, and then weighed (saturated leaf fresh weight, Ws). The saturated leaves were further dried for 2 h at 105 °C and then for 7 h at 70 °C, and weighed (dry weight, Wd). The RWC was calculated as the following formula: RWC (%) = [(Wf-Wd)/(Ws-Wd)] × 100.

    The leaves fixed in the fixation solution were washed three times with the KH2PO4-K2HPO4 buffer (pH 7.4) containing 4% (w/v) glutaraldehyde, and dehydrated for 30 min once sequentially in 30%, 50%, 70%, 80%, and 90% ethanol respectively, and then twice in 100% ethanol. The dehydrated leaves were then observed and imaged by using the Hitachi S-3400N SEM instrument following the procedures in the literature[33].

    The root cell viability was evaluated following methods in the literature[34] but with minor modifications. Fragments (1 cm long) of fresh roots behind the root tips were stained for 30 min in 0.025% (w/v) Evans blue, rinsed for 15 min with deionized water, and then imaged.

    After imaging, roots were crushed with a glass rod, soaked for 30 min in 0.5 mL of a solution containing 50% (v/v) MeOH and 1% (w/v) SDS, heated for 15 min in water bath of 50 °C, and then centrifuged for 15 min at 14,000× g. The optical density value of the resulting supernatant at 600 nm was measured for estimation of Evans blue content by using the SHIMADZU UVmin-1240 spectrophotometer (Japan) and used to evaluate the cell viability.

    The sample tissues were quickly rinsed with deionized water to remove the residues attached on the tissue surfaces, dried for 2 h at 105 °C, and then for 7 h at 70 °C until to a constant weight. The 0.1 g of the dried tissues was wet-ashed at 170 °C in 4 mL of concentrated sulfuric acid containing additional 5 drops of H2O2, and then analyzed by using the 6400 atomic absorption spectrophotometer (Shanghai Jinpeng Analytical Instruments Co., Ltd, China) following the manufacturer's instructions.

    Two hundred mg of the frozen tissues were homogenized in 5 mL of a pre-chilled 50 mM NaH2PO4-Na2HPO4 buffer (pH 7.0) containing 1% polyvinylpyrrolidone (Guangdong Guanghua Chemical Factory Co. Ltd., Shantou, China), 1 mM ascorbic acid (Bio Basic Inc., Toronto, Canada) and 1 mM EDTA, and then centrifuged for 20 min at 15,000× g at 4 °C. The supernatant was used as the crude extract.

    SOD activity was assayed following the p-nitro blue tetrazolium chloride (NBT) method described in the literature[35]but with minor modifications. In brief, the photochemical reaction mixture was composed of 0.1 mL of the crude extract, 1.5 mL of 50 mM NaH2PO4-Na2HPO4 buffer (pH 7.0), 0.3 mL of 13 mM methionine, 750 µM NBT, 0.3 mL of 110 µM EDTA-Na2, 0.5 mL deionized water, and 10 µM riboflavin. The photochemical reaction was conducted for 20 min at 25 °C in a light incubator with 3,000 lux. The absorbance (A) value at 560 nm in the reaction was measured for estimation of SOD activity by using the spectrophotometer. SOD activity was estimated following the formula: = (ACK − AE) / (50% × ACK × Cpro × V), where ACK and AE were the A values of the control tubes and the reaction respectively, Cpro indicated the protein content in the crude extract (mg·L−1), and V represented the total crude extract used (mL).

    POD activity was assayed following the method in the literature[36]but with minor modifications. In brief, 0.02 mL of the crude extract reacted at 25 °C with 1 mL of 10 mM 3,3-dimethylglutaric acid-NaOH (pH 6.0) containing 5.5 mM guaiacol and 5.5 mM H2O2. The A470 nm value of the reaction was measured after reaction for 0, 30, 60, 90, 120 , and 180 s, by using the spectrophotometer. POD activity was estimated following the formula: = △A470 nm / (Cpro × V × t), where △A470 nm was the variation of the A value within the reaction time period, Cpro indicated the protein content in the crude extract (mg·L−1), V was the total crude extract used (mL), and t indicated the reaction time .

    CAT activity was assayed following the method in the literature[37] but with minor modifications. Briefly, 0.1 mL of the crude extract reacted at 25 °C with 1.4 mL of 0.05 M K2HPO4 (pH 7.0) containing 13.2 mM H2O2. The A240 nm value of the reaction was measured every 20 s for total 2 min by using the spectrophotometer. CAT activity was estimated following the formula: = △A 240 nm / (Cpro × V × t), where △A 240 nm was the variation of the A value within the reaction time period, Cpro indicated the protein content in the crude extract (mg·L−1), V was the total crude extract used (mL), and t indicated the reaction time.

    APX activity was measured following the ascorbate oxidation method[38]but with some modifications. The reaction was conducted at 25 °C in the 2-mL solution composed of 0.02 mL of the crude extract, 50 mM potassium phosphate (pH 7.0), 0.1 mM EDTA, 0.5 mM sodium ascorbate, and 0.1 mM H2O2. The A290 nm value of the reaction was measured after reaction for 0, 10, 20, 30, 40, 50, and 60 s by using the spectrophotometer. APX activity was estimated following the formula: = △A290 nm / (Cpro × V × t), where △A290 nm was the variation of the A value within the reaction time period, Cpro indicated the protein content in the crude extract (mg·L−1), V was the total crude extract (mL) used, and t indicated the reaction time.

    The 0.1 mL of the crude extract and 0.1 mL of 0.6% thiobarbituric acid were mixed together, heated for 15 min in boiling water, immediately cooled on ice, and then centrifuged for 10 min at 1,698× g. The A value of the supernatant was measured at 532, 600, and 450 nm by using the spectrophotometer, respectively. The malondialdehyde content was calculated as a formula: = [6.45 × (A 532 nm – A 600nm) − 0.56 × A450 nm] / Cpro, where Cpro indicated the protein content in the crude extract (mg·L-1).

    SAR content was estimated in accordance with the method in the literature[39]but with some modifications. First, 0.1 mL of the crude extract, 0.075 mL of 50 mM NaH2PO4-Na2HPO4 buffer (pH 7.8), and 0.025 mL of 10 mM hydroxylamine hydrochloride (Guangdong Guanghua Chemical Factory Co. Ltd., Shantou, China) were mixed and heated for 20 min at 25 °C. Then, 0.1 mL of 17 mM p-aminobenzene sulfonic acid (Bio Basic Inc., Toronto, Canada) and 0.1 mL of 7 mM α-naphthylamine (Shanghai Silian Chemical Co., Ltd., Shanghai, China) were added and allowed to further react for 30 min at 25 °C. The standard curve was plotted with the solution containing different concentrations of NaNO2, p-aminobenzene sulfonic acid, and α-naphthylamine. The A530 nm value of the reaction was measured by using the spectrophotometer and used to estimate SAR contents in the tissues as a formula: = (2 × X) / 20 × Vs × Cpro, where X was the standard curve reading, 2 was the dilution ratio of the used crude extract, 20 was the reaction time (min), Vs was solution sampled during the colour reaction (mL), and Cpro was the protein content of the crude extract (mg·L−1).

    Statistical analyses of the data was conducted following the t test at a level of p < 0.05 using a programme in SPSS 13.0 software (www.spss.com).

    Under control conditions, no significant differences were observed in phenotype among maize lines (Fig. 1a). The differences among maize lines in leaf phenotype occurred under SS and after RSS (Table 1; Fig. 1a). Under SS, Z58 showed no significant changes in leaf phenotype, and more than 95% of C7-2 leaves died after SS of 72 h (Table 1; Fig. 1a). After RSS, all seedlings of 72 h-SS-stressed Z58 survived, however, all seedlings of 72 h-SS-stressed C7-2 died (Table 1; Fig. 1a).

    Figure 1.  (a) Phenotype, (b) leaf RWC, and (c) root staining of maize inbred lines under SS and after RSS. The SS stress was conducted with 150 mM NaCl. The RSS treatment was performed on maize plants stressed by SS for 72 h. In (b), the data were the means ± standard deviation (SD) of the fully expanded 2nd leaves of 5-leaf-old seedlings (n = 5−10) for each maize line under each treatment, and statistical analysis comparison was conducted between the same maize lines under control and the same SS stress, and between the same maize lines after SS of 72 h and after RSS. In (b), upper and lower cases of the same letter indicated a statistical significance at p < 0.05. In (c), fresh nodal roots (1 cm behind the root tip) from 5-leaf-old seedlings (n = 5−10) of each maize line were stained with Evans blue solution. The data of maize inbred line C7-2 after RSS were not available because of no surviving seedlings. C7-2, Maize inbred line Chang7-2. HZ4, Maize inbred line Huangzao4. RSS, Removal of SS. RWC, Relative water content. SS, Salt shock. Y478, Maize inbred line Ye478. Z58, Maize inbred line Zheng58.
    Table 1.  Phenotypes of seedlings of maize inbred lines under SS and after RSS.
    Maize lineYellowing of leavesDeath rate (%) of seedlings under SS forAfter RSS
    5 h24 h48 h72 hSurviving seedlings (%)
    Z58Slightly; The edge of about 10% of leaves after SS of 72 h0000100
    Y478Obviously; About 15% of leaves began turning yellow after SS of 48 h001.22.150.5
    C7-2Obviously; About 15% of the leaves began turning yellow after SS of 24 h0040.5950
    HZ4Somewhat like C7-20023.58048.65
    The SS stress was conducted with 150 mM NaCl. The RSS treatment was performed on maize plants stressed by SS for 72 h. Leaves were observed and counted from leaves of 15−20 seedlings for each maize line. Survival rate after RSS referred to the percentag of surviving seedlings compared to seedlings stressed after SS of 72 h. C7-2, Maize inbred line Chang 7-2. HZ4, Maize inbred line Huangzao4. RSS, Removal of SS. SS, Salt shock. Y478, Maize inbred line Ye478. Z58, Maize inbred line Zheng58.
     | Show Table
    DownLoad: CSV

    Leaf RWC started to significantly decrease after SS of 5 h but had no significant difference among maize lines. The significant differences of maize lines in leaf RWC occurred after SS of 24, 48 and 72 h, respectively. Leaf RWC was highest in Z58 and lowest in C7-2 after SS of 72 h (Fig. 1b). Notably, leaf RWC of Z58 did not significantly fluctuate under SS (Fig. 1b).

    However, leaf RWC of Z58, Y478 and HZ4 significantly increased after RSS when compared to that in their respective maize lines SS-stressed for 72 h but it was still significantly lower than that of their respective control lines (Fig. 1b).

    The deeper the Evans blue staining indicated the less viability of cells. Consequently, the visible staining differences occurred among roots of maize lines after SS of 5 h and more significantly after SS of 24 h (Fig. 1c), where Evans blue-stained root zone was close to root tips of SS-stressed Z58 but relatively longer in SS-stressed lines of Y478, HZ4 and C7-2 (Fig. 1c).

    After RSS, Evans blue-staining was only at local root zone in SS-stressed Z58 but still in a longer root zone in SS-stressed lines of Y478 and HZ4. The staining depth of SS-stressed roots of maize lines followed Z58 < Y478 < HZ4 (Fig. 1c) but was shallower than that of their respective maize lines after SS of 72 h. Such staining differences were echoed partly by the quantitative assay of Evans blue (Fig. 2a).

    Figure 2.  Evans blue content in (a) fresh nodal roots, and Na+ content in (b) roots and (c) leaves of maize inbred lines under SS and after RSS. The SS was conducted with 150 mM NaCl. The RSS treatment was performed on maize plants stressed by SS for 72 h. In (a), Evans blue content analysis was based on the Evans blue-stained fresh nodal roots (1 cm behind the root tip), where each datum was the mean ± SD from 5-leaf-old seedlings (n = 3−5) for each maize line under each treatment. In (b), each datum was the mean ± SD from a collection of roots of 5-leaf-old seedlings (n = 5−10). In (c), each datum was the mean ± SD from the fully expanded 2nd leaves of 5-leaf-old seedlings (n = 5−10). The statistical analysis comparison was conducted between the same maize line under control and the same SS stress, and between the same maize line after SS of 72 h and after RSS. The upper and lower cases of the same letter indicated a statistical significance at p < 0.05. The data of maize inbred line C7-2 after RSS were not available because of no surviving seedlings. C7-2, Maize inbred line Chang7-2. HZ4, Maize inbred line Huangzao4. RSS, Removal of SS. SD, Standard deviation. SS, Salt shock. Y478, Maize inbred line Ye478. Z58, Maize inbred line Zheng58.

    Both phenotype of shoots (Table 1; Fig. 1a) and root staining (Fig. 1c) under SS and after RSS indicated that SS tolerance degree of maize lines roughly followed Z58 > Y478 > HZ4 > C7-2.

    Under control conditions, there were very slight but no significant differences in Na+ content of either roots (Fig. 2b) or leaves (Fig. 2c) among different maize lines.

    Na+ content in roots of SS-stressed maize lines significantly increased when compared to that in their respective control-treated lines, which roughly fluctuated as follows: highest in roots of Z58 after SS of 5 and 24 h, and no significant differences among maize lines after SS of 48 and 72 h (Fig. 2b). After RSS, Na+ content in roots of SS-stressed maize lines of Z58, Y478 and HZ4 significantly decreased when compared to that in their respective maize lines after SS of 72 h but it was still significantly higher than that in their respective control lines (Fig. 2a). It should be noted that after RSS Na+ content in roots of SS-stressed Z58 was still highest among SS-stressed maize lines, similar to the situation in its roots after SS of 5 and 24 h (Fig. 2b).

    Na+ content in leaves of SS-stressed C7-2 was highest among SS-stressed maize lines (Fig. 2c). After RSS (Fig. 2c), changes in Na+ content in leaves of SS-stressed maize lines were very similar to those in roots (Fig. 2b) of SS-stressed maize lines. Overall, the absolute Na+ content was much higher in leaves than in roots for each SS-stressed maize line.

    Overall, K+ content in roots (Fig. 3a) and leaves (Fig. 3b) of Z58 was highest among maize lines under either control conditions or SS stress.

    Figure 3.  K+ content in (a) roots and (b) leaves, and Ca2+ content in (c) roots and (d) leaves of maize inbred lines under SS and after RSS. The SS was conducted with 150 mM NaCl. The RSS treatment was performed on maize plants stressed by SS for 72 h. Each datum was the mean ± SD from the fully expanded 2nd leaves or a collection of roots of 5-leaf-old seedlings (n = 3−5) for each maize line under each treatment. The statistical analysis comparison was conducted between the same maize line under control and the same SS stress, and between the same maize line after SS of 72 h and after RSS. The upper and lower cases of the same letter indicated a statistical significance at p < 0.05. The data of maize inbred line C7-2 after RSS were not available because of no surviving seedlings. C7-2, Maize inbred line Chang7-2. HZ4, Maize inbred line Huangzao4. RSS, Removal of SS. SD, Standard deviation. SS, Salt shock. Y478, Maize inbred line Ye478. Z58, Maize inbred line Zheng58.

    As for K+ content in roots of SS-stressed maize lines, it showed no significant changes in Z58, significantly decreased in Y478 and HZ4, and significantly increased in C7-2 after SS of 5 h. K+ content tended to decrease although it fluctuated in some maize lines after SS of 24 h (Fig. 3a). After RSS, K+ content in SS-stressed maize lines of Z58 and Y478 was still lower than that in their respective control lines (Fig. 3a).

    Regarding K+ content in leaves of SS-stressed maize lines, it showed no change in Z58, significant decreases in Y478 and C7-2 and a significant increase in HZ4 after SS of 5 h when compared to that in their respective control lines. However, as the SS time prolonged, although K+ content was significantly lower than their respective control maize lines, it fluctuated obviously with maize lines. In general, K+ content in roots (Fig. 3a) and leaves (Fig. 3b) of C7-2 after SS of 48 and 72 h was lowest among SS-stressed maize lines. After RSS, K+ content in SS-stressed lines of Z58 and HZ4 was very close that in their respective control lines (Fig. 3b).

    With aspect to Ca2+ content in roots of SS-stressed maize lines, it significantly increased in Z58 and C7-2, and significantly decreased in Y478 and HZ4 after SS of 5 h (Fig. 3c). Ca2+ content in Z58 significantly decreased but remained relatively constant as SS exceeded 5 h. After RSS, Ca2+ content was still lower in SS-stressed Z58, sharply increased in SS-stressed Y478, and recovered to the control level in SS-stressed HZ4 when compared to that in their respective control maize lines (Fig. 3c).

    As regards Ca2+ content in leaves, it was highest in HZ4 and lowest in Z58 under control conditions. Interestingly, as for Ca2+ content under SS, it changed greatly with maize lines, either increased or decreased at some SS-time points. however, it was still lowest in SS-stressed Z58 when compred to that in teir respective control lines (Fig. 3d). After RSS, Ca2+ content significantly increased in SS-stressed lines of Z58 and Y478 (Fig. 3d).

    In general, malondialdehyde content in roots (Fig. 4a) and leaves (Fig. 4b) of all SS-stressed maize lines tended to significantly increase as SS time prolonged when compared to that in their respective control maize lines, highest in roots (Fig. 4a) and higher in the most cases in leaves (Fig. 4b) of SS-stressed lines of HZ4 and C7-2. Notably, malondialdehyde content in roots (Fig. 4a) and (Fig. 4b) of SS-stressed Z58 and Y478 showed slight changes when SS time was over 24 h, not as dramatically increased as in other SS-stressed maize lines (Fig. 4a). After RSS, malondialdehyde content in roots (Fig. 4a) and leaves (Fig. 4b) of SS-stressed maize lines significantly decreased when compared to that in their respective lines that were SS-stressed for 72 h, but it was still higher than that in their respective control maize lines, highest in SS-stressed HZ4.

    Figure 4.  Malondialdehyde content in (a) roots and (b) leaves, and SAR content in (c) roots and (d) leaves of maize inbred lines under SS and after RSS. The SS was conducted with 150 mM NaCl. The RSS treatment was performed on maize plants stressed by SS for 72 h. Each datum was the mean ± SD from the fully expanded 2nd leaves or a collection of the roots of 5-leaf-old seedlings (n = 3−5) for each maize line. The statistical analysis comparison was conducted between the same maize line under control and the same SS stress, and between the same maize line after SS of 72 h and after RSS. The upper and lower cases of the same letter indicated a statistical significance at p < 0.05. The data of maize inbred line C7-2 after RSS were not available because of no surviving seedlings. C7-2, Maize inbred line Chang7-2. HZ4, Maize inbred line Huangzao4. RSS, Removal of SS. SAR, Superoxide anion radical. SD, Standard deviation. SS, Salt shock. Y478, Maize inbred line Ye478. Z58, Maize inbred line Zheng58.

    As for SAR production in roots, no significant differences were found among maize lines under control conditions (Fig. 4a). Under SS stress, SAR production significantly increased in maize lines but was highest in Z58 especially after SS of 5 h. However, SAR production tended to significantly decline in SS-stressed maize lines when SS time was at and over 24 h although it was higher than that in their respective control lines. After RSS, SAR production situation in SS-stressed lines of Z58, Y478 and HZ4 was almost the same as that in their respective maize lines that were SS-stressed for 72 h (Fig. 4c).

    Regarding SAR production in leaves, SAR production in Z58 and Y478 was much higher than that in HZ4 and C7-2 under control conditions (Fig. 4d). Under SS stress, SAR production was always much lower in most SS-stressed maize lines after SS of 5, 24, and 48 h, and significantly decreased in Y478 but increased in HZ4 and C7-2 after SS of 72 h (Fig. 4d) when compared to that in their respective control lines. After SS, SAR production was almost identical to that in their respective maize lines that were SS-stressed for 72 h (Fig. 4d).

    As for SOD activity in roots, it showed differences among maize lines under control conditions, and significantly increased but was highest in Z58 under SS (Fig. 5a). For SOD activity in leaves, it was much higher in Z58 and Y478 under control conditions, and significantly decreased in Z58, Y478 and C7-2 but significantly increased in HZ4 after SS of 48 and 72 h (Fig. 5b) when compared to that in their respective control lines. After SS, SOD activity was higher in roots of SS-stressed maize lines (Fig. 5a) and only in leaves of SS-stressed HZ4 when compared to that in their respective control lines (Fig. 5b).

    Figure 5.  SOD activity in (a) roots and (b) leaves, and POD activity in (c) roots and (d) leaves of maize inbred lines under SS and after RSS. The SS was conducted with 150 mM NaCl. The RSS treatment was performed on maize plants stressed by SS for 72 h. Each datum was the mean ± SD from the fully expanded 2nd leaves or a collection of the roots of 5-leaf-old seedlings (n = 3−5) for each maize line under each treatment. The statistical analysis comparison was conducted between the same maize line under control and the same SS stress, and between the same maize line after SS of 72 h and after RSS. The upper and lower cases of the same letter indicated a statistical significance at p < 0.05. The data of maize inbred line C7-2 after RSS were not available because of no surviving seedlings. C7-2, Maize inbred line Chang7-2. HZ4, Maize inbred line Huangzao4. POD, Peroxidase. RSS, Removal of SS. SD, Standard deviation. SOD, Superoxide dismutase. SS, Salt shock. Y478, Maize inbred line Ye478. Z58, Maize inbred line Zheng58.

    Overall, the changing patterns of POD activity in either roots (Fig. 5c) or leaves (Fig. 5d) of maize lines either under control conditions and SS or after RSS were almost in line with those SOD activity in corresponding roots (Fig. 5a) or leaves (Fig. 5b) .

    As for CAT activity in roots under SS, it significantly increased in all SS-stressed maize lines (Fig. 6a) but was much higher in SS-stressed Z58 than that in other SS-stressed maize lines especially after SS of 5 h. In leaves under SS, overall, CAT activity significantly increased after SS of 5, and 24 h for all SS-stressed maize lines and significantly decreased after SS of 48, and 72 h for SS-stressed maize lines of Z58 and Y478 (Fig. 6b). Notably, CAT activity was always higher in leaves of SS-stresed maize lines of HZ4 and C7-2 than that in their respective control lines (Fig. 6a). After SS, it was higher in roots (Fig. 6a) of all SS-stressed maize lines, and higher in leaves (Fig. 6b) of SS-stressed maize lines of Z58 and HZ4 than that in their respective control lines.

    Figure 6.  CAT activity in (a) roots and (b) leaves, and APX activity in (c) roots and (d) leaves of maize inbred lines under SS and after RSS. The SS was conducted with 150 mM NaCl. The RSS treatment was performed on maize plants stressed by SS for 72 h. Each datum was the mean ± SD from the fully expanded 2nd leaves or a collection of the roots of 5-leaf-old seedlings (n = 3−5) for each maize line under each treatment. The statistical analysis comparison was conducted between the same maize line under control and the same SS stress, and between the same maize line after SS of 72 h and after RSS. The upper and lower cases of the same letter indicated a statistical significance at p < 0.05. The data were not available for maize inbred line C7-2 after RSS because of no surviving seedlings. APX, Ascorbate peroxidase; CAT, Catalase. C7-2, Maize inbred line Chang7-2. HZ4, Maize inbred line Huangzao4. RSS, Removal of SS. SD, Standard deviation. SS, Salt shock. Y478, Maize inbred line Ye478. Z58, Maize inbred line Zheng58.

    Overall, APX activity changes in roots (Fig. 6c) under control conditions and SS or after RSS were somewhat similar to CAT activity found in roots (Fig. 6a) although there were slight differences for some maize lines. As for APX activity in leaves, it was always higher in SS-stressed maize lines of HZ4 and C7-2, but significantly lower in SS-stressed maize lines of Z58 and Y478 after SS of 72 h when compared to that in their respective control lines (Fig. 6d). After RSS, APX activity was much higher in roots (Fig. 6c) of SS-stressed maize lines of Z58 and HZ4, and lower in leaves (Fig. 6d) of SS-stressed maize lines of Z58 and Y478 but much higher in leaves (Fig. 6d) of SS-stressed HZ4 when compared to that in their respective control lines.

    The leaf stomata were always opened in Z58 under SS, began to close in HZ4 and C7-2 after SS of 24 h and in Y478 after SS of 48 h (Fig. 7a) when compared to those of their respective controls lines (Fig. 7b). After RSS, the leaf stomata were still opened in SS-stressed Z58, slightly opened in SS-stressed Y478, and still closed in SS-stressed HZ4 (Fig. 7a).

    Figure 7.  Stomatal behaviour in leaves of maize inbred lines under SS and after RSS. The SS was conducted with 150 mM NaCl. The RSS treatment was performed on maize plants stressed by SS for 72 h. The photos of the leaf stomata were taken by SEM from the central region of the front surface of the fully expanded 2nd leaves of 3-leaf-old seedlings (n = 5) for each maize line under each treatment. The data of maize inbred line C7-2 after RSS were not available because of no surviving seedlings. C7-2, Maize inbred line Chang7-2. HZ4, Maize inbred line Huangzao4. RSS, Removal of SS. SEM, Scanning electron microscopy. SS, Salt shock. Y478, Maize inbred line Ye478. Z58, Maize inbred line Zheng58.

    In this study, responses of four maize inbred lines of Z58, Y478, HZ4 and C7-2 to SS and RSS were characterized. In terms of phenotype, SS tolerance was strongest for Z58 and weakest for C7-2 (Table 1; Fig. 1a).

    The decreased leaf RWC (Fig. 1b) and significantly increased Na+ content in roots (Fig. 2b) of SS-stressed maize lines after SS of 5 h suggest that maize suffers from the combined effects of water deficit, Na+ accumulation-induced osmotic stress at the whole-plant level once SS begins, somewhat differing from the two-phase ('osmotic' response/water deficit that dominates in Phase1 and the salt-specific response/salt toxicity in Phase 2) response model of plant growth under stepwise salt stress[40] .

    The salt tolerance mechanisms in plants partly depend on controlling Na+ uptake and transport from roots to shoots[6]. It was reported that maize cultivars of lower Na+ contents were more sensitive to salt than cultivars of higher Na+ contents[20, 27, 30]. The enhanced salt tolerance of tomato plants expressing yeast HAL5 gene was related to a lower Na+ transport rate from roots to shoots[41]. Interestingly, our results indicated that Na+ content showed massive differences in leaves (Fig. 2c) but not in roots (Fig. 2b) among SS-stressed maize lines, highest in C7-2 leaves (Fig. 2c). In addition, Na+ content increased highly in C7-2 leaves within a short SS time (viz. after SS of 5 h) but in leaves of other maize lines only after a longer SS time (viz. after SS of 72 h) (Fig. 2c). These results together with Evans blue staining of SS-stressed roots (Fig. 1c) suggest that Na+ transport rate from roots to shoots is maybe slower in SS-tolerant maize lines than in SS-sensitive maize lines, and further imply that maintaining Na+ homeostasis in cells of leaves is more important for SS tolerance of maize.

    A common oxidative stress on plants under salt stress results from over-production of reactive oxygen species (ROS) such as SARs[42]. High levels of ROS can damage cells[42]. However, an appropriate level of ROS is also important for plant growth and development because ROS plays a pivotal signalling role in stress-triggered tolerance mechanisms[4345]. Therefore, a balance between production and removal of ROS must be tightly regulated to tolerate stress[17, 44]. In this study, SAR levels were overall much higher in roots than in leaves of SS-stressed maize especially after SS of 5 h (Fig. 4c). Z58, the most tolerant maize line, had the highest SAR level in roots (Fig. 4c) and the lowest Na+ content in leaves after SS of 5 h (Fig. 2c). However, C7-2, the most sensitive maize lines, had a lower SAR level in roots after SS of 5 h (Fig. 4c) and the highest Na+ level in leaves after SS of 72 h (Fig. 2c). These results strongly indicate that SS-tolerant maize lines can easily generate SAR signalling in roots than SS-sensitive maize lines at the onset of SS, and further implicate that the Na+-induced SAR signalling is probably involved in mediating the Na+ transport from roots to shoots and/or in balancing intracellular Na+.

    The intracellular K+/Na+ ratio is a key determining trait of salt tolerance[46]. Lower K+ levels can further increase Na+ toxicity under salt stress because Na+ can compete with K+ for enzyme activation and protein biosynthesis[46]. Coupling of the lowest K+ contents (Fig. 3b) with the highest Na+ contents (Fig. 2c) in C7-2 leaves after SS of 5, 48, and 72 h suggest that Na+ accumulation under SS likely leads to leakiness of more cytosolic K+ in SS-sensitive maize than in SS-tolerant maize, in agreement with the prior viewpoints[47].

    The peroxidation of the cell membrane by ROS is one of the main causes of membrane damage, resulting in production of malondialdehyde[48, 49]. The high malondialdehyde contents in both roots (Fig. 4a) and leaves (Fig. 4b) in SS-stressed maize lines of HZ4 and C7-2 suggest that keeping the cell membrane stable is of great importance in maize tolerance to SS.

    High Ca2+ levels benefit plants under salt stress by compensating/minimizing the Na+-induced leakiness of cytosolic K+[50], increasing the relative availability of water for maize growth[51], and maintaining K+/Na+ selectivity[46]. Salt stress can cause a decrease in Ca2+ influx and an increase in Ca2+ efflux from the maize root cells[52]. During the first phase after approximately 2-3 weeks of salt stress applied in a hydroponic nutrient solution via daily NaCl increases, salt-sensitive maize cultivar 8023 had higher concentrations of Ca2+ than did salt-tolerant maize cultivar Pioneer 3906, although Ca2+ concentrations in shoots decreased in both two cultivars[21]. In cotton treated by SS in a 0.1× modified Hoagland solution supplemented with NaCl and CaCl2, Ca2+ influx increased in proportion to salt concentration (ranging from 150 to 250 mM NaCl)[50]. In this study, although Ca2+ content fluctuated greatly among roots of maize lines during SS (Fig. 3c), it gradually increased in leaves of Z58 and Y478 as SS time prolonged, and significantly decreased in leaves of HZ4 and C7-2 after SS of more than 24 h (Fig. 3d). Such discrepancies among different studies may be due to differences in treatment conditions/processes and materials. Anyway, our results suggest that maintaining high levels of Ca2+ in leaves is important to enhance maize tolerance to SS. These results together strongly indicate that Ca+/K+/Na+ balance is most important for palnt tolerance to salt stress but differ with plant species.

    SOD, POD, CAT and APX are major antioxidant enzymes for plants to cope with oxidative damage under abiotic stresses[9, 17, 42, 43]. In this study, that the activities of the enzymes in SS-stressed maize increased but were highest activities in roots of Z58 in a short SS time (viz. after SS of 5 h) (Figs 5 & 6) suggest that increasing the activities of the antioxidant enzymes in roots is more significant at the initial SS phase than the late SS phase for maize to tolerate SS. This is likely because roots are only one tissue that is directly exposed to SS environments, on the other hand, the early and timely increase in the enzyme activity is conducive to the reconstruction of the antioxidant systems for maize to adapt to the ensuing SS. In addition, the differences in the enzyme activities between roots and leaves and among different maize lines under SS (Figs 5 & 6) implies that the utilization of antioxidant systems under SS varies with tissues and maize lines, with APX activity pattern as an example which significantly decreased in leaves of Z58 but significantly increased in leaves of HZ4 and C7-2 under SS (Fig. 6d).

    The opening and closing of leaf stomata affect the entrance of CO2 into leaves, of which the stomatal closure not only causes the accumulation of ROS[42, 53] but also inhibits the production of osmoprotectants and radical scavengers[6]. The leaf stomata were always opened in Z58 and closed earlier in other maize lines under SS (Fig. 7a). The more significantly increased SAR levels in leaves of Y478, HZ4 and C7-2 as SS time prolonged (Fig. 4d). These results suggest that opening of the leaf stomata is particularly crucial to enhance maize tolerance to SS.

    Taken all results together, the related mechanisms of SS tolerance of maize as well as a possible way to improve maize SS tolerance by spraying Ca and K fertilizer were proposed (Fig. 8).

    Figure 8.  Schematic mechanisms of maize tolerance to SS, and a possible measure to improve tolerance to SS. A possible measure to improve maize tolerance to SS by spraying Ca and K fertilizer onto leaf surfaces was suggested and shown. APX, Ascorbate peroxidase; CAT, Catalase; POD, Peroxidase; ROS, Reactive oxygen species; SAR, Superoxide anion radical; SOD, Superoxide dismutase; SS, Salt shock.

    Maize has no clear processes of phase-order-response to SS, which suffers from the combined effects of osmotic stress, water deficiency, and Na+ accumulation-induced toxicity once SS occurs. Stronger tolerance of maize to SS is characterized by (1) timely increases in activities of antioxidant enzymes (SOD, POD, CAT and APX) and a stronger SAR-mediated signalling necessary to trigger the relevant tolerance mechanisms in roots once SS occurs; (2) a slow Na+ transport rate from roots to shoots especially in the early SS stage; and (3) opening of leaf stomata, and fine cell membrane integrity to prevent leakage of Ca2+ and K+ under SS. However, these mechanisms should be verified with more maize lines in future.

    The authors confirm contribution to the paper as follows: study conception and design: Li YZ, Fan XW; data collection: Pan JL; analysis and interpretation of results: Li YZ, Pan JL; draft manuscript preparation: Li YZ. All authors reviewed the results and approved the final version of the manuscript.

    All data generated or analyzed during this study are included in this published article.

    We are grateful to Professors Yu Li and Yun-Su Shi, the Institute of Crop Sciences, CAAS, who kindly supplied the maize seeds.

  • The authors declare that they have no conflict of interest.

  • Supplemental Table S1 Transcriptome sample information for organ development of passion fruit flower.
    Supplemental Table S2 Specific primers for PeMADS genes for qRT-PCR.
    Supplemental Table S3 List of CDS and protein sequences of 52 PeMADS genes.
    Supplemental Table S4 Multiple sequence alignment results of MADS-domain in PeMADS proteins.
    Supplemental Table S5 Protein sequences of MADS gene families used in phylogenetic analysis.
    Supplemental Table S6 Cis-acting elements in promoter region of PeMADS genes.
    Supplemental Table S7 Results of intraspecific collinearity analysis(intraspecific and interspecific).
    Supplemental Table S8 PeMADS protein homology modeling results.
    Supplemental Table S9 Expression matrix of PeMADS genes in different development stages of floral organs.
    Supplemental Table S10 Expression matrix of PeMADS genes in vegetative organs.
    Supplemental Table S11 Expression patterns of PeMADS genes in response to phytohormones.
  • [1]

    Vanderplank J. 1991. Passion flowers and passion fruit. London, UK: Cassell Publishers Limited.

    [2]

    Ulmer T, MacDougal JM. 2004. Passiflora: passionflowers of the world. Oregon, USA: Timber Press (OR).

    [3]

    Winterhalter P. 1990. Bound terpenoids in the juice of the purple passion fruit (Passiflora edulis Sims). Journal of Agricultural and Food Chemistry 38:452−55

    doi: 10.1021/jf00092a026

    CrossRef   Google Scholar

    [4]

    Coleta M, Batista MT, Campos MG, Carvalho R, Cotrim MD, et al. 2006. Neuropharmacological evaluation of the putative anxiolytic effects of Passiflora edulis Sims, its sub-fractions and flavonoid constituents. Phytotherapy Research 20:1067−73

    doi: 10.1002/ptr.1997

    CrossRef   Google Scholar

    [5]

    Deng J, Zhou Y, Bai M, Li H, Li L. 2010. Anxiolytic and sedative activities of Passiflora edulis f. flavicarpa. Journal of Ethnopharmacology 128:148−53

    doi: 10.1016/j.jep.2009.12.043

    CrossRef   Google Scholar

    [6]

    Gadioli IL, da Cunha MdSB, de Carvalho MVO, Costa AM, Pineli LdLdO. 2018. A systematic review on phenolic compounds in Passiflora plants: Exploring biodiversity for food, nutrition, and popular medicine. Critical Reviews in Food Science and Nutrition 58:785−807

    doi: 10.1080/10408398.2016.1224805

    CrossRef   Google Scholar

    [7]

    Abreu PP, Souza MM, Santos EA, Pires MV, Pires MM, et al. 2009. Passion flower hybrids and their use in the ornamental plant market: perspectives for sustainable development with emphasis on Brazil. Euphytica 166:307−15

    doi: 10.1007/s10681-008-9835-x

    CrossRef   Google Scholar

    [8]

    Thokchom R, Mandal G. 2017. Production preference and importance of passion fruit (Passiflora edulis): A review. Journal of Agricultural Engineering and Food Technology 4:27−30

    Google Scholar

    [9]

    Riechmann JL, Ratcliffe OJ. 2000. A genomic perspective on plant transcription factors. Current opinion in plant biology 3:423−34

    doi: 10.1016/S1369-5266(00)00107-2

    CrossRef   Google Scholar

    [10]

    Theissen G, Becker A, Di Rosa A, Kanno A, Kim JT, et al. 2000. A short history of MADS-box genes in plants. Plant Molecular Biology 42(1):115−49

    Google Scholar

    [11]

    Honma T, Goto K. 2001. Complexes of MADS-box proteins are sufficient to convert leaves into floral organs. Nature 409:525−29

    doi: 10.1038/35054083

    CrossRef   Google Scholar

    [12]

    Ng M, Yanofsky MF. 2001. Function and evolution of the plant MADS-box gene family. Nature Reviews Genetics 2:186−95

    doi: 10.1038/35056041

    CrossRef   Google Scholar

    [13]

    Saedler H, Becker A, Winter KU, Kirchner C, Theißen G. 2001. MADS-box genes are involved in floral development and evolution. Acta Biochimica Polonica 48:351−58

    doi: 10.18388/abp.2001_3920

    CrossRef   Google Scholar

    [14]

    Smaczniak C, Immink RGH, Angenent GC, Kaufmann K. 2012. Developmental and evolutionary diversity of plant MADS-domain factors: insights from recent studies. Development 139:3081−98

    doi: 10.1242/dev.074674

    CrossRef   Google Scholar

    [15]

    Bloomer RH, Dean C. 2017. Fine-tuning timing: natural variation informs the mechanistic basis of the switch to flowering in Arabidopsis thaliana. Journal of Experimental Botany 68:5439−52

    doi: 10.1093/jxb/erx270

    CrossRef   Google Scholar

    [16]

    Callens C, Tucker MR, Zhang D, Wilson ZA. 2018. Dissecting the role of MADS-box genes in monocot floral development and diversity. Journal of Experimental Botany 69:2435−59

    doi: 10.1093/jxb/ery086

    CrossRef   Google Scholar

    [17]

    Alvarez-Buylla ER, Pelaz S, Liljegren SJ, Gold SE, Burgeff C, et al. 2000. An ancestral MADS-box gene duplication occurred before the divergence of plants and animals. Proceedings of the National Academy of Sciences of the United States of America 97:5328−33

    doi: 10.1073/pnas.97.10.5328

    CrossRef   Google Scholar

    [18]

    Par̆enicová L, de Folter S, Kieffer M, Horner DS, Favalli C, et al. 2003. Molecular and Phylogenetic Analyses of the Complete MADS-Box Transcription Factor Family in Arabidopsis: New Openings to the MADS World. The Plant Cell 15:1538−51

    doi: 10.1105/tpc.011544

    CrossRef   Google Scholar

    [19]

    Becker A, Theißen G. 2003. The major clades of MADS-box genes and their role in the development and evolution of flowering plants. Molecular Phylogenetics and Evolution 29:464−89

    doi: 10.1016/S1055-7903(03)00207-0

    CrossRef   Google Scholar

    [20]

    Nam J, Kim J, Lee S, An G, Ma H, et al. 2004. Type I MADS-box genes have experienced faster birth-and-death evolution than type II MADS-box genes in angiosperms. Proceedings of the National Academy of Sciences 101:1910−15

    doi: 10.1073/pnas.0308430100

    CrossRef   Google Scholar

    [21]

    Kaufmann K, Melzer R, Theißen G. 2005. MIKC-type MADS-domain proteins: structural modularity, protein interactions and network evolution in land plants. Gene 347:183−98

    doi: 10.1016/j.gene.2004.12.014

    CrossRef   Google Scholar

    [22]

    Coen ES, Meyerowitz EM. 1991. The war of the whorls: genetic interactions controlling flower development. Nature 353:31−37

    doi: 10.1038/353031a0

    CrossRef   Google Scholar

    [23]

    Zahn LM, Feng B, Ma H. 2006. Beyond the ABC-model: regulation of floral homeotic genes. Advances in Botanical Research 44:163−207

    doi: 10.1016/S0065-2296(06)44004-0

    CrossRef   Google Scholar

    [24]

    Angenent GC, Colombo L. 1996. Molecular control of ovule development. Trends in Plant Science 1:228−32

    doi: 10.1016/1360-1385(96)86900-7

    CrossRef   Google Scholar

    [25]

    Dreni L, Kater MM. 2014. MADS reloaded: evolution of the AGAMOUS subfamily genes. New Phytologist 201:717−32

    doi: 10.1111/nph.12555

    CrossRef   Google Scholar

    [26]

    Gustafson-Brown C. 1996. Characterization of the Arabidopsis floral homeotic gene APETALA1. Thesis. University of California, San Diego

    [27]

    Jack T, Brockman LL, Meyerowitz EM. 1992. The homeotic gene APETALA3 of Arabidopsis thaliana encodes a MADS box and is expressed in petals and stamens. Cell 68:683−97

    doi: 10.1016/0092-8674(92)90144-2

    CrossRef   Google Scholar

    [28]

    Goto K, Meyerowitz EM. 1994. Function and regulation of the Arabidopsis floral homeotic gene PISTILLATA. Genes & Development 8:1548−60

    doi: 10.1101/gad.8.13.1548

    CrossRef   Google Scholar

    [29]

    Hugouvieux V, Silva CS, Jourdain A, Stigliani A, Charras Q, et al. 2018. Tetramerization of MADS family transcription factors SEPALLATA3 and AGAMOUS is required for floral meristem determinacy in Arabidopsis. Nucleic Acids Research 46:4966−77

    doi: 10.1093/nar/gky205

    CrossRef   Google Scholar

    [30]

    Pinyopich A, Ditta GS, Savidge B, Liljegren SJ, Baumann E, et al. 2003. Assessing the redundancy of MADS-box genes during carpel and ovule development. Nature 424:85−88

    doi: 10.1038/nature01741

    CrossRef   Google Scholar

    [31]

    Pelaz S, Ditta GS, Baumann E, Wisman E, Yanofsky MF. 2000. B and C floral organ identity functions require SEPALLATA MADS-box genes. Nature 405:200−3

    doi: 10.1038/35012103

    CrossRef   Google Scholar

    [32]

    Ditta G, Pinyopich A, Robles P, Pelaz S, Yanofsky MF. 2004. The SEP4 gene of Arabidopsis thaliana functions in floral organ and meristem identity. Current Biology 14:1935−40

    doi: 10.1016/j.cub.2004.10.028

    CrossRef   Google Scholar

    [33]

    Ruelens P, Zhang Z, van Mourik H, Maere S, Kaufmann K, et al. 2017. The origin of floral organ identity quartets. The Plant Cell 29:229−42

    doi: 10.1105/tpc.16.00366

    CrossRef   Google Scholar

    [34]

    Seo E, Lee H, Jeon J, Park H, Kim J, et al. 2009. Crosstalk between cold response and flowering in Arabidopsis is mediated through the flowering-time gene SOC1 and its upstream negative regulator FLC. The Plant Cell 21:3185−97

    doi: 10.1105/tpc.108.063883

    CrossRef   Google Scholar

    [35]

    Li D, Liu C, Shen L, Wu Y, Chen H, et al. 2008. A repressor complex governs the integration of flowering signals in Arabidopsis. Developmental Cell 15:110−20

    doi: 10.1016/j.devcel.2008.05.002

    CrossRef   Google Scholar

    [36]

    Tapia-López R, García-Ponce B, Dubrovsky JG, Garay-Arroyo A, Pérez-Ruíz RV, et al. 2008. An AGAMOUS-related MADS-box gene, XAL1 (AGL12), regulates root meristem cell proliferation and flowering transition in Arabidopsis. Plant Physiology 146:1182−92

    doi: 10.1104/pp.107.108647

    CrossRef   Google Scholar

    [37]

    Yu LH, Miao ZQ, Qi GF, Wu J, Cai XT, et al. 2014. MADS-box transcription factor AGL21 regulates lateral root development and responds to multiple external and physiological signals. Molecular Plant 7:1653−69

    doi: 10.1093/mp/ssu088

    CrossRef   Google Scholar

    [38]

    Dreni L, Zhang D. 2016. Flower development: the evolutionary history and functions of the AGL6 subfamily MADS-box genes. Journal of Experimental Botany 67:1625−38

    doi: 10.1093/jxb/erw046

    CrossRef   Google Scholar

    [39]

    Ferrándiz C, Liljegren SJ, Yanofsky MF. 2000. Negative Regulation of the SHATTERPROOF Genes by FRUITFULL During Arabidopsis Fruit Development. Science 289:436−38

    doi: 10.1126/science.289.5478.436

    CrossRef   Google Scholar

    [40]

    Zheng Y, Liu M, Jia C, Wang J, Xu B, et al. 2020. Characteristics of banana B genome MADS-box family demonstrate their roles in fruit development, ripening, and stress. Scientific Reports 10:20840

    doi: 10.1038/s41598-020-77870-w

    CrossRef   Google Scholar

    [41]

    Wang Y, Zhang J, Hu Z, Guo X, Tian S, Chen G. 2019. Genome-wide analysis of the MADS-Box transcription factor family in Solanum lycopersicum. International Journal of Molecular Sciences 20:2961

    doi: 10.3390/ijms20122961

    CrossRef   Google Scholar

    [42]

    Wang P, Wang S, Chen Y, Xu X, Guang X, et al. 2019. Genome-wide analysis of the MADS-Box gene family in watermelon. Comput Biol Chem 80:341−50

    doi: 10.1016/j.compbiolchem.2019.04.013

    CrossRef   Google Scholar

    [43]

    Sheng XG, Zhao ZQ, Wang JS, Yu HF, Shen YS, et al. 2019. Genome wide analysis of MADS-box gene family in Brassica oleracea reveals conservation and variation in flower development. BMC Plant Biology 19:106

    doi: 10.1186/s12870-019-1717-y

    CrossRef   Google Scholar

    [44]

    Potter SC, Luciani A, Eddy SR, Park Y, Lopez R, et al. 2018. HMMER web server: 2018 update. Nucleic Acids Research 46:W200−W204

    doi: 10.1093/nar/gky448

    CrossRef   Google Scholar

    [45]

    Letunic I, Khedkar S, Bork P. 2021. SMART: recent updates, new developments and status in 2020. Nucleic acids research 49:D458−D460

    doi: 10.1093/nar/gkaa937

    CrossRef   Google Scholar

    [46]

    Marchler-Bauer A, Lu S, Anderson JB, Chitsaz F, Derbyshire MK, et al. 2011. CDD: a Conserved Domain Database for the functional annotation of proteins. Nucleic Acids Research 39:D225−D229

    doi: 10.1093/nar/gkq1189

    CrossRef   Google Scholar

    [47]

    Gasteiger E, Gattiker A, Hoogland C, Ivanyi I, Appel RD, et al. 2003. ExPASy: the proteomics server for in-depth protein knowledge and analysis. Nucleic acids research 31:3784−88

    doi: 10.1093/nar/gkg563

    CrossRef   Google Scholar

    [48]

    Edgar RC. 2004. MUSCLE: multiple sequence alignment with high accuracy and high throughput. Nucleic acids research 32:1792−97

    doi: 10.1093/nar/gkh340

    CrossRef   Google Scholar

    [49]

    Waterhouse AM, Procter JB, Martin DMA, Clamp M, Barton GJ. 2009. Jalview Version 2—a multiple sequence alignment editor and analysis workbench. Bioinformatics 25:1189−91

    doi: 10.1093/bioinformatics/btp033

    CrossRef   Google Scholar

    [50]

    Katoh K, Standley DM. 2013. MAFFT Multiple Sequence Alignment Software Version 7: Improvements in Performance and Usability. Molecular Biology and Evolution 30:772−80

    doi: 10.1093/molbev/mst010

    CrossRef   Google Scholar

    [51]

    Chernomor O, von Haeseler A, Minh BQ. 2016. Terrace Aware Data Structure for Phylogenomic Inference from Supermatrices. Systematic Biology 65:997−1008

    doi: 10.1093/sysbio/syw037

    CrossRef   Google Scholar

    [52]

    He Z, Zhang H, Gao S, Lercher MJ, Chen W-H, Hu S. 2016. Evolview v2: an online visualization and management tool for customized and annotated phylogenetic trees. Nucleic Acids Research 44:W236−W241

    doi: 10.1093/nar/gkw370

    CrossRef   Google Scholar

    [53]

    Bailey TL, Johnson J, Grant CE, Noble WS. 2015. The MEME Suite. Nucleic Acids Research 43:W39−W49

    doi: 10.1093/nar/gkv416

    CrossRef   Google Scholar

    [54]

    Chen C, Chen H, Zhang Y, Thomas HR, Frank MH, et al. 2020. TBtools: an integrative toolkit developed for interactive analyses of big biological data. Molecular Plant 13:1194−202

    doi: 10.1016/j.molp.2020.06.009

    CrossRef   Google Scholar

    [55]

    Lescot M, Déhais P, Thijs G, Marchal K, Moreau Y, et al. 2002. PlantCARE, a database of plant cis-acting regulatory elements and a portal to tools for in silico analysis of promoter sequences. Nucleic Acids Research 30:325−27

    doi: 10.1093/nar/30.1.325

    CrossRef   Google Scholar

    [56]

    Wang Y, Tang H, DeBarry JD, Tan X, Li J, et al. 2012. MCScanX: a toolkit for detection and evolutionary analysis of gene synteny and collinearity. Nucleic Acids Research 40:e49−e49

    doi: 10.1093/nar/gkr1293

    CrossRef   Google Scholar

    [57]

    Waterhouse A, Bertoni M, Bienert S, Studer G, Tauriello G, et al. 2018. SWISS-MODEL: homology modelling of protein structures and complexes. Nucleic Acids Research 46:W296−W303

    doi: 10.1093/nar/gky427

    CrossRef   Google Scholar

    [58]

    DeLano WL. 2002. Pymol: An open-source molecular graphics tool. CCP4 Newsletter on Protein Crystallography 40:82−92

    Google Scholar

    [59]

    Chen P, Li Y, Zhao L, Hou Z, Yan M, et al. 2017. Genome-wide identification and expression profiling of ATP-binding cassette (ABC) transporter gene family in pineapple (Ananas comosus (L.) Merr.) reveal the role of AcABCG38 in pollen development. Frontiers in plant science 8:2150

    doi: 10.3389/fpls.2017.02150

    CrossRef   Google Scholar

    [60]

    Wu Y, Tian Q, Huang W, Liu J, Xia X, et al. 2020. Identification and evaluation of reference genes for quantitative real-time PCR analysis in Passiflora edulis under stem rot condition. Molecular Biology Reports 47:2951−62

    doi: 10.1007/s11033-020-05385-8

    CrossRef   Google Scholar

    [61]

    Gasteiger E, Hoogland C, Gattiker A, Duvaud S, Wilkins MR, et al. 2005. Protein identification and analysis tools on the ExPASy server. In The Proteomics Protocols Handbook, ed. Walker JM. Totowa, NJ: Humana Press. pp. 571−607. https://doi.org/10.1385/1-59259-890-0:571

    [62]

    Arora R, Agarwal P, Ray S, Singh AK, Singh VP, et al. 2007. MADS-box gene family in rice: genome-wide identification, organization and expression profiling during reproductive development and stress. BMC Genomics 8:242

    doi: 10.1186/1471-2164-8-242

    CrossRef   Google Scholar

    [63]

    Díaz-Riquelme J, Lijavetzky D, Martínez-Zapater JM, Carmona MJ. 2008. Genome-wide analysis of MIKCC-type MADS box genes in grapevine. Plant Physiology 149:354−69

    doi: 10.1104/pp.108.131052

    CrossRef   Google Scholar

    [64]

    Liu J, Fu X, Dong Y, Lu J, Ren M, et al. 2018. MIKCC-type MADS-box genes in Rosa chinensis: the remarkable expansion of ABCDE model genes and their roles in floral organogenesis. Horticulture Research 5:25

    doi: 10.1038/s41438-018-0031-4

    CrossRef   Google Scholar

    [65]

    Xie T, Chen C, Li C, Liu J, Liu C, et al. 2018. Genome-wide investigation of WRKY gene family in pineapple: evolution and expression profiles during development and stress. BMC Genomics 19:490

    doi: 10.1186/s12864-018-4880-x

    CrossRef   Google Scholar

    [66]

    Han A, Pan F, Stroud JC, Youn HD, Liu JO, et al. 2003. Sequence-specific recruitment of transcriptional co-repressor Cabin1 by myocyte enhancer factor-2. Nature 422:730−34

    doi: 10.1038/nature01555

    CrossRef   Google Scholar

    [67]

    Lai X, Daher H, Galien A, Hugouvieux V, Zubieta C. 2019. Structural basis for plant MADS transcription factor oligomerization. Computational and Structural Biotechnology Journal 17:946−53

    doi: 10.1016/j.csbj.2019.06.014

    CrossRef   Google Scholar

    [68]

    Theißen G. 2001. Development of floral organ identity: stories from the MADS house. Current Opinion in Plant Biology 4:75−85

    doi: 10.1016/S1369-5266(00)00139-4

    CrossRef   Google Scholar

    [69]

    Chang YS, Cheng CY. 1992. Effects of temperature and light on growth and flower formation of passionfruit. Journal of the Chinese Society for Horticultural Science 38:30−36

    Google Scholar

    [70]

    Liu FY, Peng YL, Chang YS. 2015. Effects of temperature and ethylene response inhibitors on growth and flowering of passion fruit. Horticultural Science and Technology 33:356−63

    doi: 10.7235/hort.2015.13111

    CrossRef   Google Scholar

    [71]

    Nam J, DePamphilis CW, Ma H, Nei M. 2003. Antiquity and evolution of the MADS-box gene family controlling flower development in plants. Molecular Biology and Evolution 20:1435−47

    doi: 10.1093/molbev/msg152

    CrossRef   Google Scholar

    [72]

    Guo H, Lee TH, Wang X, Paterson AH. 2013. Function relaxation followed by diversifying selection after whole-genome duplication in flowering plants. Plant Physiology 162:769−78

    doi: 10.1104/pp.112.213447

    CrossRef   Google Scholar

    [73]

    de Folter S, Immink RGH, Kieffer M, Pařenicová L, Henz SR, et al. 2005. Comprehensive interaction map of the Arabidopsis MADS box transcription factors. The Plant Cell 17:1424−33

    doi: 10.1105/tpc.105.031831

    CrossRef   Google Scholar

    [74]

    Melzer R, Theißen G. 2009. Reconstitution of 'floral quartets' in vitro involving class B and class E floral homeotic proteins. Nucleic Acids Research 37:2723−36

    doi: 10.1093/nar/gkp129

    CrossRef   Google Scholar

    [75]

    Theißen G, Saedler H. 2001. Floral quartets. Nature 409:469−71

    doi: 10.1038/35054172

    CrossRef   Google Scholar

    [76]

    Ó'Maoiléidigh DS, Graciet E, Wellmer F. 2014. Gene networks controlling Arabidopsis thaliana flower development. New Phytologist 201:16−30

    doi: 10.1111/nph.12444

    CrossRef   Google Scholar

    [77]

    Gong P, Song C, Liu H, Li P, Zhang M, et al. 2021. Physalis floridana CRABS CLAW mediates neofunctionalization of GLOBOSA genes in carpel development. Journal of Experimental Botany 72:6882−903

    doi: 10.1093/jxb/erab309

    CrossRef   Google Scholar

    [78]

    Zhang L, Chen F, Zhang X, Li Z, Zhao Y, et al. 2020. The water lily genome and the early evolution of flowering plants. Nature 577:79−84

    doi: 10.1038/s41586-019-1852-5

    CrossRef   Google Scholar

    [79]

    Zahn LM, Leebens-Mack J, dePamphilis CW, Ma H, Theissen G. 2005. To B or Not to B a flower: The Role of DEFICIENS and GLOBOSA orthologs in the evolution of the angiosperms. Journal of Heredity 96:225−40

    doi: 10.1093/jhered/esi033

    CrossRef   Google Scholar

    [80]

    Tsai WC, Pan ZJ, Hsiao YY, Chen LJ, Liu ZJ. 2014. Evolution and function of MADS-box genes involved in orchid floral development. Journal of Systematics and Evolution 52:397−410

    doi: 10.1111/jse.12010

    CrossRef   Google Scholar

    [81]

    Li H, Liang W, Jia R, Yin C, Zong J, et al. 2010. The AGL6-like gene OsMADS6 regulates floral organ and meristem identities in rice. Cell Research 20:299−313

    doi: 10.1038/cr.2009.143

    CrossRef   Google Scholar

    [82]

    Fan J, Li W, Dong X, Guo W, Shu H. 2007. Ectopic expression of a hyacinth AGL6 homolog caused earlier flowering and homeotic conversion in Arabidopsis. Science in China Series C: Life Sciences 50:676−89

    doi: 10.1007/s11427-007-0083-4

    CrossRef   Google Scholar

    [83]

    Tsuchimoto S, Mayama T, Van Der Krol A, Ohtsubo E. 2000. The whorl-specific action of a petunia class B floral homeotic gene. Genes to Cells 5:89−99

    doi: 10.1046/j.1365-2443.2000.00308.x

    CrossRef   Google Scholar

    [84]

    Reinheimer R, Kellogg EA. 2009. Evolution of AGL6-like MADS box genes in grasses (Poaceae): Ovule expression is ancient and palea expression is new. The Plant Cell 21:2591−605

    doi: 10.1105/tpc.109.068239

    CrossRef   Google Scholar

    [85]

    Becker A, Kaufmann K, Freialdenhoven A, Vincent C, Li MA, et al. 2002. A novel MADS-box gene subfamily with a sister-group relationship to class B floral homeotic genes. Molecular Genetics and Genomics 266:942−50

    doi: 10.1007/s00438-001-0615-8

    CrossRef   Google Scholar

    [86]

    Yamada K, Saraike T, Shitsukawa N, Hirabayashi C, Takumi S, Murai K. 2009. Class D and Bsister MADS-box genes are associated with ectopic ovule formation in the pistil-like stamens of alloplasmic wheat (Triticum aestivum L.). Plant Molecular Biology 71:1−14

    doi: 10.1007/s11103-009-9504-z

    CrossRef   Google Scholar

    [87]

    Kwantes M, Liebsch D, Verelst W. 2012. How MIKC* MADS-box genes originated and evidence for their conserved function throughout the evolution of vascular plant gametophytes. Molecular Biology and Evolution 29:293−302

    doi: 10.1093/molbev/msr200

    CrossRef   Google Scholar

    [88]

    Hemingway CA, Christensen AR, Malcomber ST. 2011. B- and C-class gene expression during corona development of the blue passionflower (Passiflora caerulea, Passifloraceae). American Journal of Botany 98:923−34

    doi: 10.3732/ajb.1100026

    CrossRef   Google Scholar

    [89]

    Moon J, Suh SS, Lee H, Choi K-R, Hong CB, et al. 2003. The SOC1 MADS-box gene integrates vernalization and gibberellin signals for flowering in Arabidopsis. The Plant Journal 35:613−23

    doi: 10.1046/j.1365-313X.2003.01833.x

    CrossRef   Google Scholar

    [90]

    Sheldon CC, Rouse DT, Finnegan EJ, Peacock WJ, Dennis ES. 2000. The molecular basis of vernalization: The central role of FLOWERING LOCUS C (FLC). Proceedings of the National Academy of Sciences of the United States of America 97:3753−58

    doi: 10.1073/pnas.97.7.3753

    CrossRef   Google Scholar

    [91]

    Castelán-Muñoz N, Herrera J, Cajero-Sánchez W, Arrizubieta M, Trejo C, et al. 2019. MADS-box genes are key components of genetic regulatory networks involved in abiotic stress and plastic developmental responses in plants. Frontiers in Plant Science 10:853

    doi: 10.3389/fpls.2019.00853

    CrossRef   Google Scholar

    [92]

    Rose JKC, Bennett AB. 1999. Cooperative disassembly of the cellulose–xyloglucan network of plant cell walls: parallels between cell expansion and fruit ripening. Trends in Plant Science 4:176−83

    doi: 10.1016/S1360-1385(99)01405-3

    CrossRef   Google Scholar

    [93]

    Scorza LCT, Hernandes-Lopes J, Melo-de-Pinna GFA, Dornelas MC. 2017. Expression patterns of Passiflora edulis APETALA1/FRUITFULL homologues shed light onto tendril and corona identities. EvoDevo 8:3

    doi: 10.1186/s13227-017-0066-x

    CrossRef   Google Scholar

    [94]

    Liu J, Liu L, Li Y, Jia C, Zhang J, et al. 2015. Role for the banana AGAMOUS-like gene MaMADS7 in regulation of fruit ripening and quality. Physiologia Plantarum 155:217−31

    doi: 10.1111/ppl.12348

    CrossRef   Google Scholar

    [95]

    Liu J, Zhang J, Wang J, Zhang J, Miao H, et al. 2018. MuMADS1 and MaOFP1 regulate fruit quality in a tomato ovate mutant. Plant Biotechnology Journal 16:989−1001

    doi: 10.1111/pbi.12843

    CrossRef   Google Scholar

  • Cite this article

    An C, Liao J, Lu L, Cai X, Liu R, et al. 2024. From gene expression to flower patterns: genome-wide characterization of the MADS-box gene family in passion fruit (Passiflora edulis). Tropical Plants 3: e004 doi: 10.48130/tp-0024-0004
    An C, Liao J, Lu L, Cai X, Liu R, et al. 2024. From gene expression to flower patterns: genome-wide characterization of the MADS-box gene family in passion fruit (Passiflora edulis). Tropical Plants 3: e004 doi: 10.48130/tp-0024-0004

Figures(11)  /  Tables(2)

Article Metrics

Article views(4659) PDF downloads(654)

ARTICLE   Open Access    

From gene expression to flower patterns: genome-wide characterization of the MADS-box gene family in passion fruit (Passiflora edulis)

Tropical Plants  3 Article number: e004  (2024)  |  Cite this article

Abstract: Passion fruit (Passiflora edulis) is an economically valuable tropical fruit crop renowned for its nutritious juice, aromatic fragrance, and vibrant flowers with distinct floral structure, known as corona. These unique floral features make passion fruit a good candidate for the study of floral organogenesis. MADS-box genes play essential functions in various aspects of plant growth and development, especially for floral morphogenesis. However, a comprehensive investigation of MADS-box gene family members in passion fruit has not yet been conducted. Here, 52 MADS-box genes were identified in the passion fruit genome and classified into two types with five subgroups (type I: Mα, Mβ, Mγ; type II: MIKCC, MIKC*) based on phylogeny. The notable reduction in the abundance of type I MADS-box genes within the passion fruit genome, in contrast to Arabidopsis, is thought to be a contributing factor to the diminished gene number within this gene family. The structural analysis illustrated that PeMADS proteins within the same subfamily are relatively conserved. Moreover, we proposed the putative flower regulation ABC(D)E model of passion fruit and explored the regulatory genes of the characteristic structure corona. We found that the regulation of petals and stamens in passion fruit is similar to that of Arabidopsis, but differs in terms of carpels and sepals. The distinct coronas were predominately controlled by B-, C(D)- and E-class genes, supporting the speculation that the corona might have originated from stamens. Except for the core functions in the floral meristem, many PeMADS genes were also involved in the development regulation of non-floral tissues and/or in phytohormone and stress responses. The co-presence of diverse cis-regulatory elements associated with growth/developmental regulation, phytohormone and stress responses in the promoter regions of PeMADSs might be closely related to their diverse regulatory roles. The results of this study provide valuable insights into the MADS-box genes in passion fruit and their involvement in the development of floral structure. These discoveries lay the foundation for the cultivation of exceptional ornamental varieties of passion fruit.

    • Passion fruit (Passiflora edulis), belonging to the Passifloraceae family and the Passiflora genus, is widely cultivated in tropical and subtropical regions[1,2]. It is renowned for its aromatic fruits, which exhibit fragrances reminiscent of various fruits, including bananas and pineapples. The fruit is not only nutritionally rich but can also be harvested year-round, contributing significantly to its economic value[36]. Moreover, passion fruit displays vibrant and large flowers with a distinctive secondary corona structure – a white or colorful fringe-like structure formed between the petals and pistils[2]. It also holds great significance as a horticultural plant, finding widespread use in applications like fence landscaping and small potted plants[7,8]. Furthermore, the special floral structure (sepal-petal-corona-stamen-carpel) in passion fruit also makes it an excellent and unique plant model for investigating floral organ morphology.

      MADS-box gene family members are ubiquitously distributed among plants, animals, and fungi, playing crucial roles throughout plant growth and development[911]. MADS-box genes are instrumental in governing a spectrum of biological processes[1214], encompassing floral transition, control of flowering time, endosperm and embryo development, seed germination, fruit development, abiotic stress responses, and notably, they assume central roles in the morphogenesis of plant floral organs[15,16]. Based on protein domain characteristics and phylogenetic tree relationships, the MADS-box gene family can be classified into two primary types: Type I and Type II[17]. Type I genes can be further divided into three subclasses: Mα, Mβ, and Mγ[18], while Type II genes, also known as MIKC-type genes in plants, consist of the MIKCC and MIKC* groups. Moreover, the MIKCc group can be further classified into 12 major subclades[19]. Notably, Type I genes have undergone more rapid evolutionary changes from birth to death compared to Type II genes[20]. Both Type I and Type II protein sequences share a conserved domain named as MADS-domain, comprising 58-60 amino acids located in the N-terminal region, which serves as an identifying feature of MADS-box proteins. Whereas, Type II MADS-box proteins in plants possess three additional domains in addition to the MADS-box domain: an intervening region with relatively low conservation, a moderately conserved Keratin-like domain, and a variable C-terminal region[21].

      Among the MIKCC-type genes, specific members are known to form the well-established ABC(D)E model, providing a genetic basis for floral organ specification and development[22,23]. According to this model, the identification of floral organs in each whorl is governed by unique combinations of genes from classes A, B, C, D, and E. Sepal identification is jointly determined by A- and E-class genes, whereas petals are controlled by A-, B-, and E-class genes. The formation of stamens relies on B-, C- and E-class genes, while carpels are regulated by C- and E-class genes. Ovule specification is particularly controlled by C-, D-, and E-class genes[2325]. In MADS-box gene family of Arabidopsis thaliana, numerous functional genes have been confirmed to be associated with the ABC(D)E model. For instance, A-class genes include APETALA1(AP1)[26]; APETALA3(AP3) and PISTILLATA(PI) belongs to class B[27,28]; AGAMOUS (AG) is a C-class gene and also involved in floral meristem development[29]; class D gene AGL11 is expressed in ovules[30]; the E class comprises SEPALLATA (SEP1, SEP2, SEP3, and SEP4), which exhibit functional redundancy and are required for specifying the identity of all floral organs[31,32]. Proteins encoded by ABC(D)E model genes form quaternary complexes that bind to CArG-box (CC[A/T]6GG) of DNA sequences, and this complex subsequently acts on downstream target genes to regulate flower development[33]. Additionally, MADS-box genes in A. thaliana perform various functions in other development processes, AGAMOUS-LIKE 20 (AGL20) serves as a key activator in integrating floral inductive pathways[34] , while FLC and SVP are involved in regulating flowering time[35]. AGL21 and AGL12 are associated with root development[36,37], and the AGL6 is involved in floral meristem and seed development[38]. FRUITFULL (FUL), SHATTERPROOF 1 and 2 (SHP1 and SHP2), collectively function in the complex regulation of fruit ripening and development[39].

      The distinctive floral morphology of passion fruit makes it an excellent candidate for the study of floral organogenesis and enhances our understanding of the ABC(D)E model. While extensive research has explored MADS-box gene family members in various plants[4043], a comprehensive investigation of these members in passion fruit has not yet been carried out. Here, we identified a total of 52 MADS-box genes in passion fruit and conducted a systematic analysis, including analysis of gene structure, motif composition, phylogenetic relationships, chromosomal localization, collinearity, and expression patterns. Notably, we also proposed an ABC(D)E model to elucidate the regulation of the unique floral structure (sepal-petal-corona-stamen-carpel) in passion fruit. Our findings could provide valuable insights for further functional investigations of passion fruit MADS-box genes and their potential applications in floral modification breeding.

    • Passion fruit genome and protein sequences were obtained from the National Genomics Data Center (NGDC) database (https://ngdc.cncb.ac.cn/) under the accession number GWHAZTM00000000. We employed two distinct strategies, namely the Hidden Markov Model (HMM) search and BLAST search, to identify MADS-box genes in passion fruit. Regarding the HMM method, the MADS-box SFR family domain (PF00319) was sourced from the Pfam database (www.pfam.org) and subsequently applied for a comprehensive search against the passion fruit protein sequences using HMMER3 (v3.3.2) software (http://hmmer.janelia.org/)[44]. Simultaneously, plant MADS-box protein sequences were obtained from the NCBI database (www.ncbi.nlm.nih.gov) and used as initial queries for BLASTP searches. Only homologous sequences with an E-value of less than 1e-5 were retained for subsequent analyses. The sequences identified from both the HMM search and BLAST search were consolidated and the redundant members were removed to produce a set of preliminary MADS-box candidates. These candidates then underwent rigorous verification of the MADS-box domain through the SMART (http://smart.embl-heidelberg.de)[45] and CDD (Conserved Domain Database) search (www.ncbi.nlm.nih.gov/cdd)[46] . The confirmed MADS-box genes were renamed according to their positions on the passion fruit chromosomes. Subcellular localization analysis was conducted using the WoLF PSORT tool (https://wolfpsort.hgc.jp), while the ExPASy website tool (www.expasy.org)[47] was harnessed to predict molecular weight (MW), isoelectric point (pI), and the grand average of hydropathicity (GRAVY).

    • Multiple sequence alignment of all 52 putative MADS-box protein sequences was performed by MUSCLE[48], and the alignment was visualized and edited by software Jalview v 2.11.2.0[49]. For phylogenetic analysis, the 105 MADS-box protein sequences of Arabidopsis were downloaded from the TAIR database (www.arabidopsis.org)[18], those sequences were combined with putative members from passion fruit to construct the phylogenetic tree. The multiple protein sequence alignment of all 157 protein sequences was produced using software MAFFT v7.407[50]. The resulting alignments were used for exploring the phylogenetic relationship of MADS-box protein in Arabidopsis and passion fruit. Phylogenetic analysis was performed by software IQ-TREE v1.6.12[51] with maximum likelihood estimation based on the most suitable model and 1000 bootstraps. The phylogenetic tree was visualized using Evolview (https://evolgenius.info/evolview-v2/)[52].

    • To identify the conservative motifs among the putative MADS-box members of passion fruit, the full-length protein sequences were analyzed website tool MEME (https://meme-suite.org/meme/tools/meme)[53] with parameters that the maximum number of finding motifs is 10. Exon-intron structure of MADS-box genes were distinguished using GFF files, which was acquired from the annotation information of the passion fruit genome. The exact region of conservative MADS-box domain was identified from the CDD (Conserved Domain Database) database (www.ncbi.nlm.nih.gov/cdd)[46].

      To explore the possible-regulator-factors of MADS-box genes from passion fruit, TBtools v1.1047 software[54] was used to extract the 2000-bp upstream region as putative promoter regions, which end with the translation initiation codon of each MADS-box genes. The cis-acting elements contained in promoter regions were marked using the PlantCARE database (http://bioinformatics.psb.ugent.be/webtools/plantcare/html)[55], and the statistics analysis and plotting were finished using R package pheatmap (https://CRAN.R-project.org/package=pheatmap).

    • The exact location of MADS-box genes was extracted from the annotation file of the passion fruit genome, and anchored to corresponding chromosomes. Duplication events of genes occurring in the evolution of the passion fruit genome were analyzed by Multicollinearity Scanning Toolkit (MCScanX)[56] with default parameters. The genomic data of Oryza sativa (v7.0), Solanum lycopersicum (ITAG3.2), A. thaliana (TAIR10), Vitis vinifera (Genoscope.12X), Zea mays (RefGen_V4) were retrieved from the JGI Phytozome database (https://phytozome-next.jgi.doe.gov). A similar procedure was also applied to demonstrate the collinearity relationships and gene duplications of orthologous MADS-box genes obtained from passion fruit and these five species. The result was visualized by functions of TBtools[54]. Based on the above results of duplicated events within passion fruit, the ratios Ka/Ks of tandem duplicated and segmental duplicated gene pairs were also calculated using TBtools[54].

    • All MADS-box protein sequences were submitted to SWISS-MODEL (https://swissmodel.expasy.org)[57] for predicting tertiary structure with homology modeling method, and secondary structures could be marked by the corresponding original model from PDB databases (www.rcsb.org). The predicted models were visualized using Pymol[58].

    • The fresh samples of passion fruit (P. edulis) were collected from the orchard located in the Institute of Horticulture, Guangxi Academy of Agricultural Sciences (China). The whole floral tissue was divided into bract, sepal, corona filament or corona, stamen, stigma, ovule (dividing under dissecting microscope). The identification of development stages of floral tissues was based on the horizontal width of buds with bracts (more details about distinguishing different development stages are listed in Supplemental Table S1). Samples of leaves, stems and tendril tissues were collected at 110 d after anthesis. The fruit were collected at 53 d post anthesis (DPA), DPA60, DPA100 and DPA128, respectively. The tissues samples were immediately frozen in liquid nitrogen after picking and stored at −70 °C.

      The grown and healthy plants of passion fruit were subjected to abiotic stress treatments (cold and heat) with three biological replicates. The whole plants were transferred into a growth chamber with temperature of 20 °C as the cold-stress condition while the heat-stress condition had a temperature of 30 °C. Samples of floral buds were collected under different treatment times (1, 4, 12, 24 h for heat stress; 4, 24 h for cold stress). Plants cultivated under 25 °C were used as control. All samples were collected for RNA extraction.

      Reference to previous common methods of RNA extraction[59], total RNA from different tissues was extracted by RNA extraction Kit (Omega Bio-Tek, Shanghai, China) with manufacturer's protocol. Following a standardized process, RNA samples were quantified and PCR library construction was performed. The analysis result was sequenced using NEB next Ultra RNA Library Prep Kit (NEB, Beverly City, MA, USA) for Illumina Biolabs. Each biological replicate used 1 µg RNA as an experiment sample. After the related processing flow of initial RNA-seq data file, TPM value of RNA-seq for each PeMADS gene were calculated, and the heatmap of the TPM value was constructed using R package (pheatmap) and chiplot (www.chiplot.online) with log2 (TPM + 0.0001) as the unit of measure.

    • Based on the above standards of identifying different development stages for flowers, the tissues used for qRT-PCR analysis was br1 (bract at stage1), se1, pe1, ca1, st8, sg1 and ov5. Two-month-old healthy passion fruit plants were also subjected to ABA (100 μM) and GA (100 μM) treatments, while untreated plants served as controls. Leaf samples from phytohormone-treated plants were collected at 0, 12, 24, and 48 h post-treatment from three independent seedlings. All collected samples were immediately stored in liquid nitrogen before total RNA extraction. The Trizol reagent (Invitrogen, Carlsbad, CA, USA) was used to extract total RNA. ThermoScript RT-PCR kit (Thermo Fisher Scientific, Carlsbad, CA, USA) was used for reverse transcription. The quantitative real-time PCR (qRT-PCR) was performed by the following procedures: 95 °C for 30 s, followed by 40 cycles of 95 °C for 10 s and 60 °C for 30 s. The reaction volume was 20 µl, including 1 µl cDNA per sample, 10 µl 2× Taq Pro Universal SYBR qPCR Master Mix (Vazyme, Nanjing, China) and 0.4 µl per primer, the whole system was complemented by ddH2O to 20 µl. The reaction was carried out in a Bio-Rad Real-time PCR system (Foster City, CA, USA) with three biological replicates per sample. EF1α was used as a reference gene[60]. The relative expression levels were calculated using the 2−ΔΔCᴛ method. Primers were designed using the IDT website (https://sg.idtdna.com/pages). Primer sequences are listed in Supplemental Table S2.

    • To ensure a comprehensive screening of gene family members, the putative PeMADS genes were identified by combining the results from hidden Markov model (HMM) and the blast search. Ultimately, a total of 52 MADS-box gene family members were successfully identified from the whole genome of passion fruit (Table 1). The members were designated as PeMADS1-PeMADS51 based on their sequential positions on the chromosomes, while a single member (P_eduliaContig70023089.g) mapped to a contig was named PeMADS52. Predicted physicochemical properties of PeMADS genes coding proteins are list in Table 1. These proteins exhibit variable lengths, with the longest one being 650 aa (PeMADS7) while the shortest one is 66 aa (PeMADS29). Correspondingly, PeMADS7 possesses the heaviest molecular weight (MW) of 71,572.97 Da, while PeMADS29 has the lightest protein, only 7,697.02 Da. The protein isoelectric points (PI) range from 4.89 (PeMADS41) to 10.69 (PeMADS29). According to the Instability Index[61], only PeMADS4, PeMADS13, and PeMADS23 are considered stable proteins (value is smaller than 40). The aliphatic amino acid index (A.I.) varies from 66.05 (PeMADS4) to 100.41 (PeMADS27), indicating a significant difference in thermal stability among the PeMADS proteins. With the exception of PeMADS22, the grand average of hydropathicity score (GRAVY) of other proteins are negative, which means only PeMADS22 is a hydrophobic protein, and most proteins are hydropathicity. The prediction of subcellular localization reveals that the major action site of proteins is the nucleus, followed by chloroplasts and mitochondria. Two members, PeMADS23 and PeMADS28, are located in the cytoplasm. For detailed sequence information of all members, refer to Supplemental Table S3.

      Table 1.  Characteristics about 52 PeMADS proteins of passion fruit

      Gene nameGene IDChromosomeSize (aa)MW (Da)PIInstability
      Index
      A.I.GRAVYPredicted Location
      PeMADS1P_edulia010000232.gLG0135540,132.206.3642.6675.27−0.63Nucleus
      PeMADS2P_edulia010000334.gLG0119021,875.009.7648.9376.47−0.826Nucleus
      PeMADS3P_edulia010000557.gLG0119422,380.579.7348.1376.91−0.818Nucleus
      PeMADS4P_edulia010000858.gLG0138742,577.71935.1666.05−0.687Nucleus
      PeMADS5P_edulia010002143.gLG0122525,469.3210.3148.6472.8−0.629Nucleus
      PeMADS6P_edulia010002220.gLG0125129,014.905.8463.8980−0.551Nucleus
      PeMADS7P_edulia010002256.gLG0165071,572.978.8842.5789.43−0.259Nucleus
      PeMADS8P_edulia010002353.gLG0122325,645.299.5153.2283.54−0.658Nucleus
      PeMADS9P_edulia010002348.gLG0122325,567.898.1157.0892.29−0.209Mitochondria
      PeMADS10P_edulia010002733.gLG0122325,520.758.1258.3390.54−0.242Mitochondria
      PeMADS11P_edulia010002726.gLG0122325,663.329.5150.7482.24−0.671Nucleus
      PeMADS12P_edulia010003864.gLG0122725,943.719.085382.91−0.609Nucleus
      PeMADS13P_edulia010004192.gLG0112814,242.5410.3337.3691.33−0.087Nucleus
      PeMADS14P_edulia010004199.gLG0116619,203.349.345.2793.31−0.031Nucleus
      PeMADS15P_edulia010004299.gLG0134238,721.376.0855.6974.18−0.57Nucleus
      PeMADS16P_edulia010004354.gLG0128332,306.418.2256.2575.51−0.63Nucleus
      PeMADS17P_edulia010004671.gLG0127431,672.199.2843.2380.47−0.444Nucleus
      PeMADS18P_edulia010004713.gLG0121224,765.599.7444.184.2−0.322Nucleus
      PeMADS19P_edulia010005413.gLG0115417,785.609.6143.3287.34−0.638Nucleus
      PeMADS20P_edulia020006530.gLG02789,025.349.6944.2483.72−0.615Nucleus
      PeMADS21P_edulia020007073.gLG0224428,034.946.4856.5785.53−0.696Nucleus
      PeMADS22P_edulia030008390.gLG0314115,691.086.840.5989.360.119Nucleus
      PeMADS23P_edulia030008412.gLG0323327,189.878.3937.5386.57−0.842Cytoplasm
      PeMADS24P_edulia030008784.gLG0325529,597.757.6962.0485.25−0.698Nucleus
      PeMADS25P_edulia030008868.gLG0323327,283.188.3264.5785.75−0.738Mitochondria
      PeMADS26P_edulia030009361.gLG0322925,959.029.244.399.21−0.374Nucleus
      PeMADS27P_edulia040010097.gLG0429634,731.288.3674.87100.41−0.349Nucleus
      PeMADS28P_edulia040010305.gLG0422626,236.009.1845.2975.49−0.773Cytoplasm
      PeMADS29P_edulia040010846.gLG04667,697.0210.6939.1779.7−0.239Nucleus
      PeMADS30P_edulia050011612.gLG05677,764.039.8343.493.13−0.452Nucleus
      PeMADS31P_edulia050012002.gLG0511712,998.9710.2146.3866.67−0.506Nucleus
      PeMADS32P_edulia060013073.gLG0624227,917.838.7244.4482.64−0.695Nucleus
      PeMADS33P_edulia060013103.gLG0616819,304.068.4350.7891.19−0.642Nucleus
      PeMADS34P_edulia060013465.gLG068810,152.749.5976.0982.95−0.448Nucleus
      PeMADS35P_edulia060013580.gLG0624027,317.309.1749.1284.17−0.561Nucleus
      PeMADS36P_edulia060013765.gLG0629131,621.315.3352.1372.51−0.417Chloroplast
      PeMADS37P_edulia060015308.gLG0633137,420.775.2862.0671−0.684Nucleus
      PeMADS38P_edulia060015605.gLG0622125,409.119.1740.883.8−0.576Nucleus
      PeMADS39P_edulia060015604.gLG0618821,618.598.8143.1884.04−0.624Nucleus
      PeMADS40P_edulia060016494.gLG0624328,153.007.1357.7991.11−0.658Nucleus
      PeMADS41P_edulia060016711.gLG0617520,210.434.8954.1869.66−1.058Chloroplast
      PeMADS42P_edulia060016709.gLG0617920,635.045.0558.7273.02−1.001Chloroplast
      PeMADS43P_edulia060016710.gLG0619822,057.865.6958.4181.82−0.657Chloroplast
      PeMADS44P_edulia070017407.gLG0718120,894.808.8571.8170.61−0.809Nucleus
      PeMADS45P_edulia070017456.gLG0724828,225.449.5847.590.48−0.497Nucleus
      PeMADS46P_edulia070017776.gLG0717219,278.411050.288.37−0.621Nucleus
      PeMADS47P_edulia080019101.gLG0821424,404.509.6653.6570.23−0.866Nucleus
      PeMADS48P_edulia080020106.gLG0813014,779.159.3842.3584.69−0.338Nucleus
      PeMADS49P_edulia090020757.gLG0920623,473.426.9844.3267.57−0.681Nucleus
      PeMADS50P_edulia090021063.gLG0920423,738.659.2344.2686.96−0.739Nucleus
      PeMADS51P_edulia090021542.gLG0921424,401.799.0659.6967.48−0.697Nucleus
      PeMADS52P_eduliaContig70023089.gContig725328,637.179.4649.6494.47−0.316Nucleus
    • The protein sequences of 52 candidate PeMADS were subjected to alignment analysis to further elucidate the constitution and structure of MADS-domain (Supplemental Table S4). As is shown in Fig. 1a, there is a highly conserved domain in all 52 PeMADS proteins. The sequence logo was utilized to accurately depict the composition of the MADS-box region. By employing the SWISS-MODEL web server and utilizing protein homology modeling, a three-dimensional (3-D) model of MADS-box domain was constructed. This model could be divided approximately into three regions, comprising one α-helix and two β-sheets (Fig. 2b). Through analysis of amino acid distribution at each residue position within the MADS domain, 24 sites out of the 57 residues were identified as highly conserved if the percentage of a specific amino acid exceeded 80% at that particular site (Fig. 2c). Integrating the aforementioned information with the proteins' tertiary structure, the first helix contained 14 conserved residues (Arg-17, Gln-18, Val-19, Thr-20, Lys-23, Arg-24, Arg-25, Gln-27, Leu-28, Lys-30, Lys-31, Glu-34, Leu-35 and Cys-39), while the first sheet region contained one conserved residue (Phe-48), and the second region lacked any conserved residues. Among 57 residues, Arg-3, Arg-17, Arg-24, Lys-31, Glu-34 exist in all protein sequences.
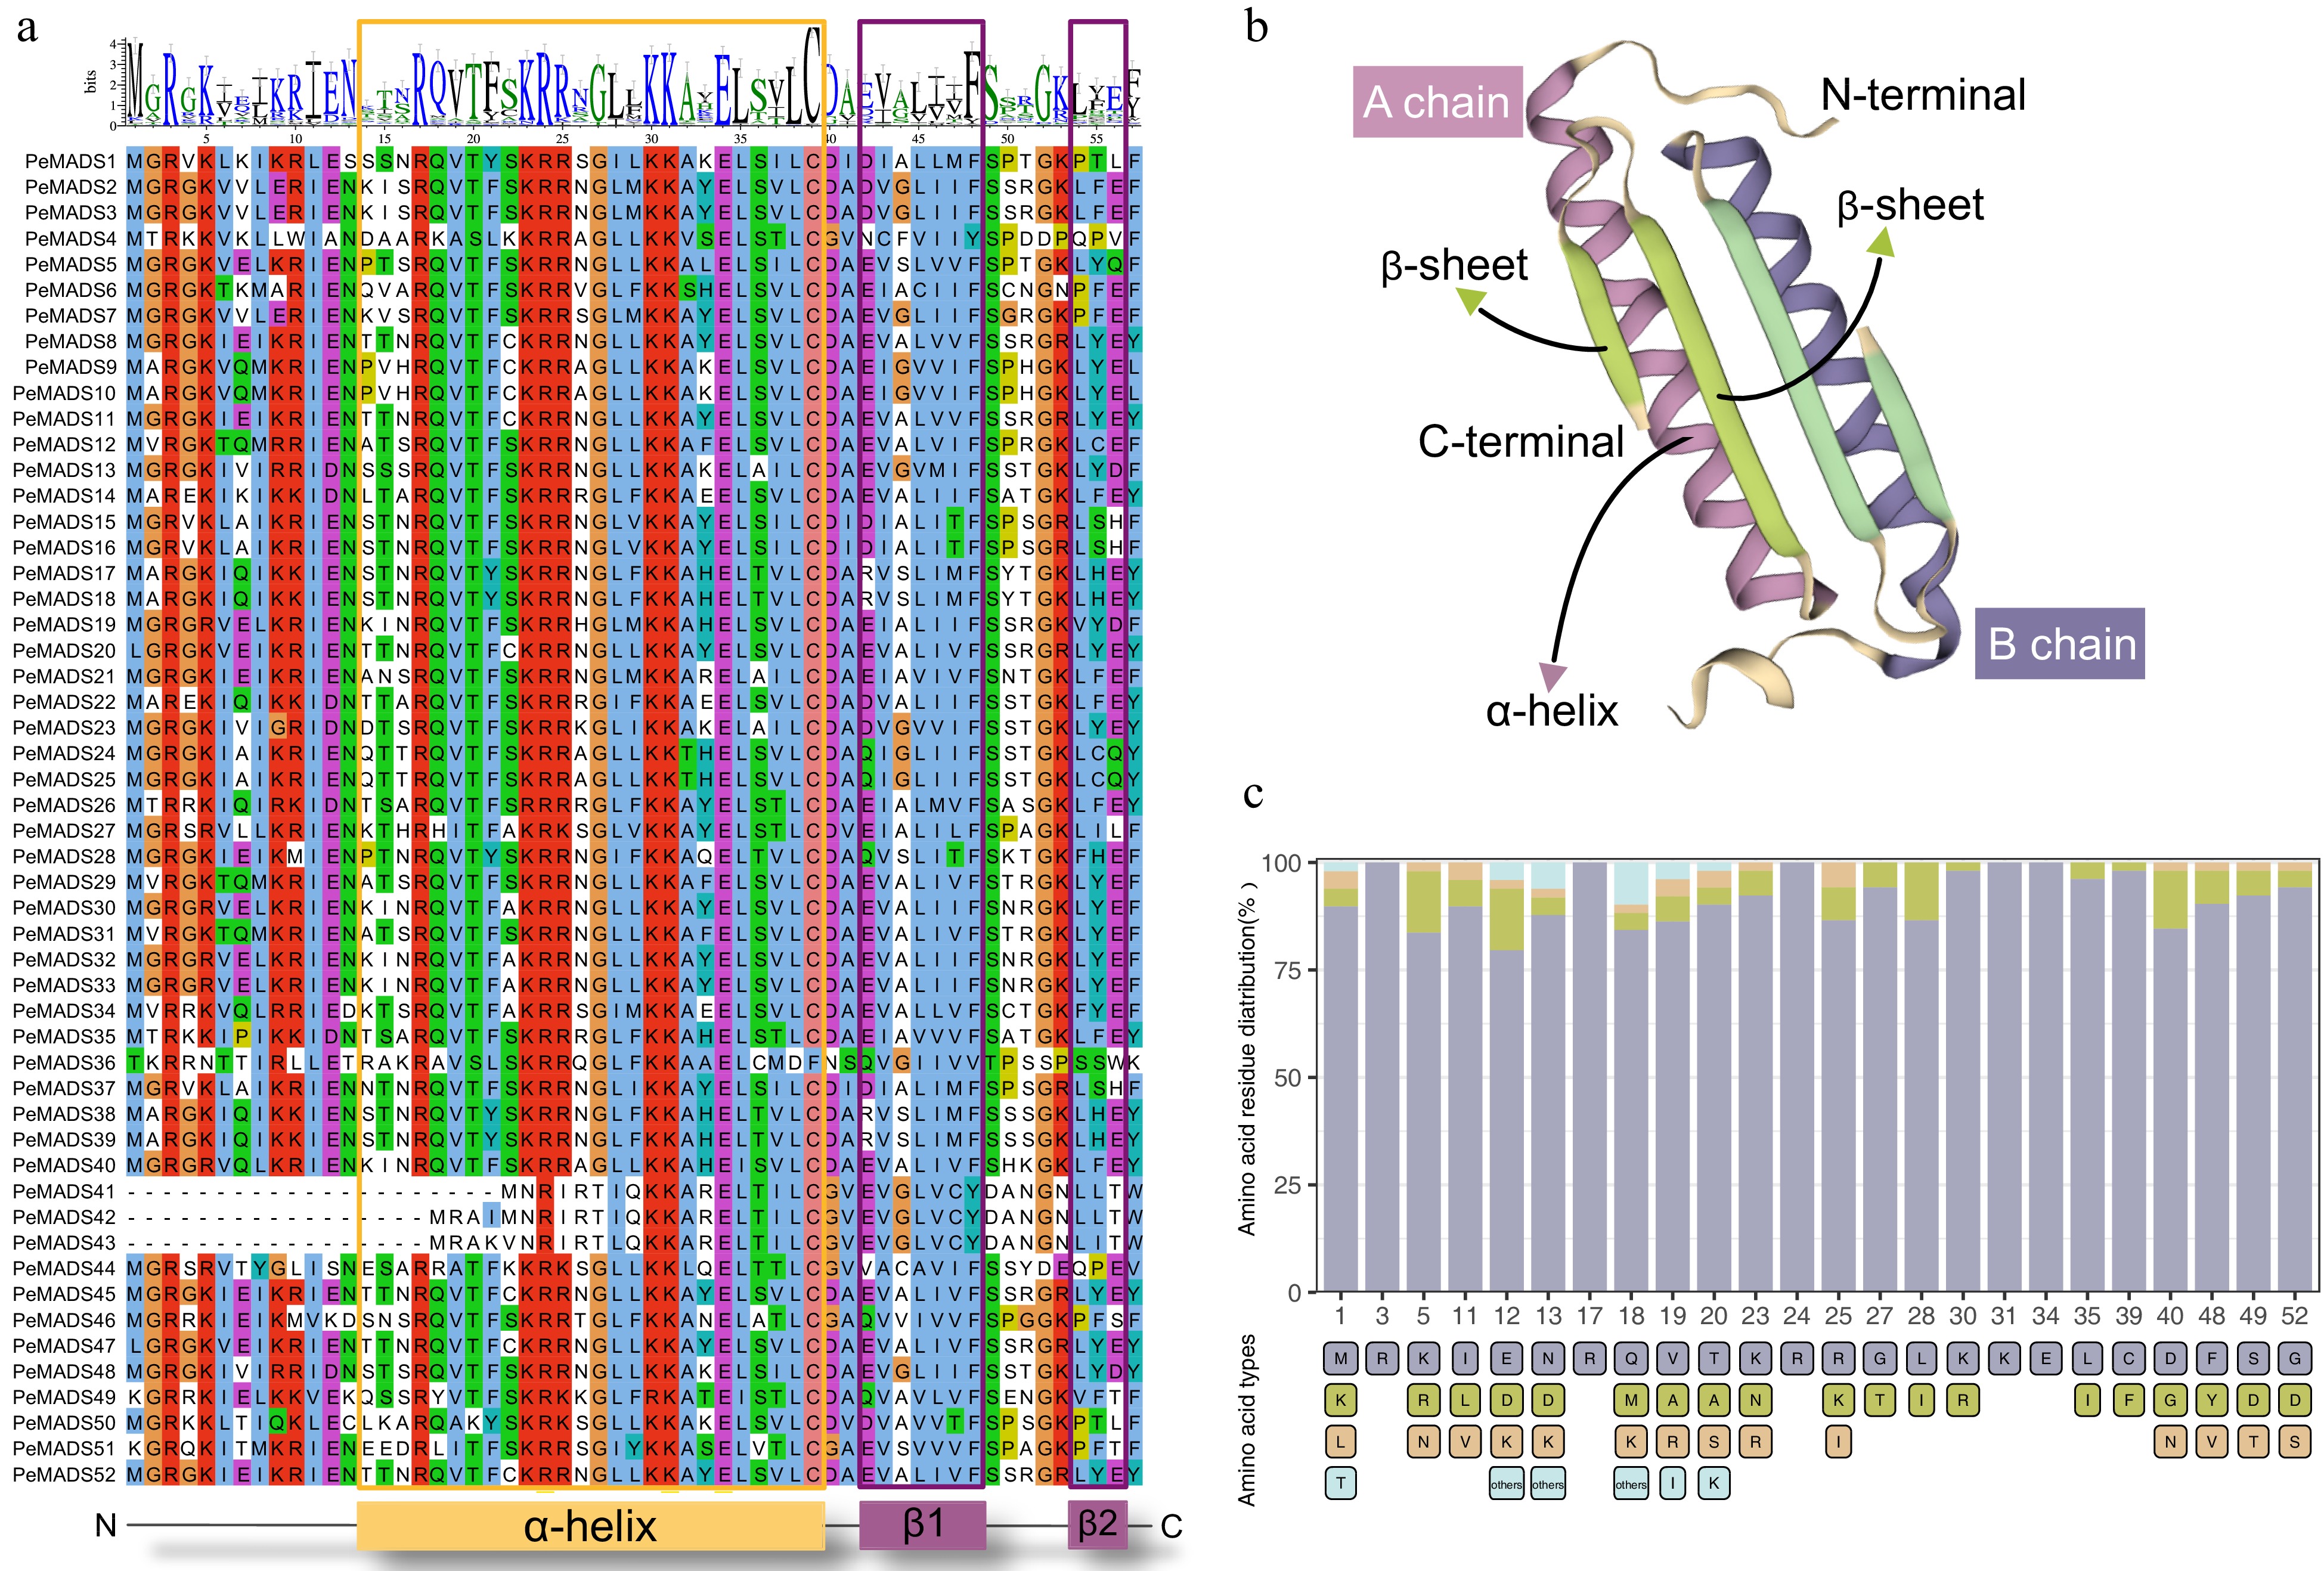
      Figure 1. 

      Characterization of MADS-box domain. (a) Multiple sequence alignment of MADS-domain region from 52 PeMADS proteins. (b) Predicted three-dimensional structure of MADS-domain. (c) Distribution of amino acids in conserved residues of MADS-domain: number represents the positions of residues; bottom label represents species of amino acids.
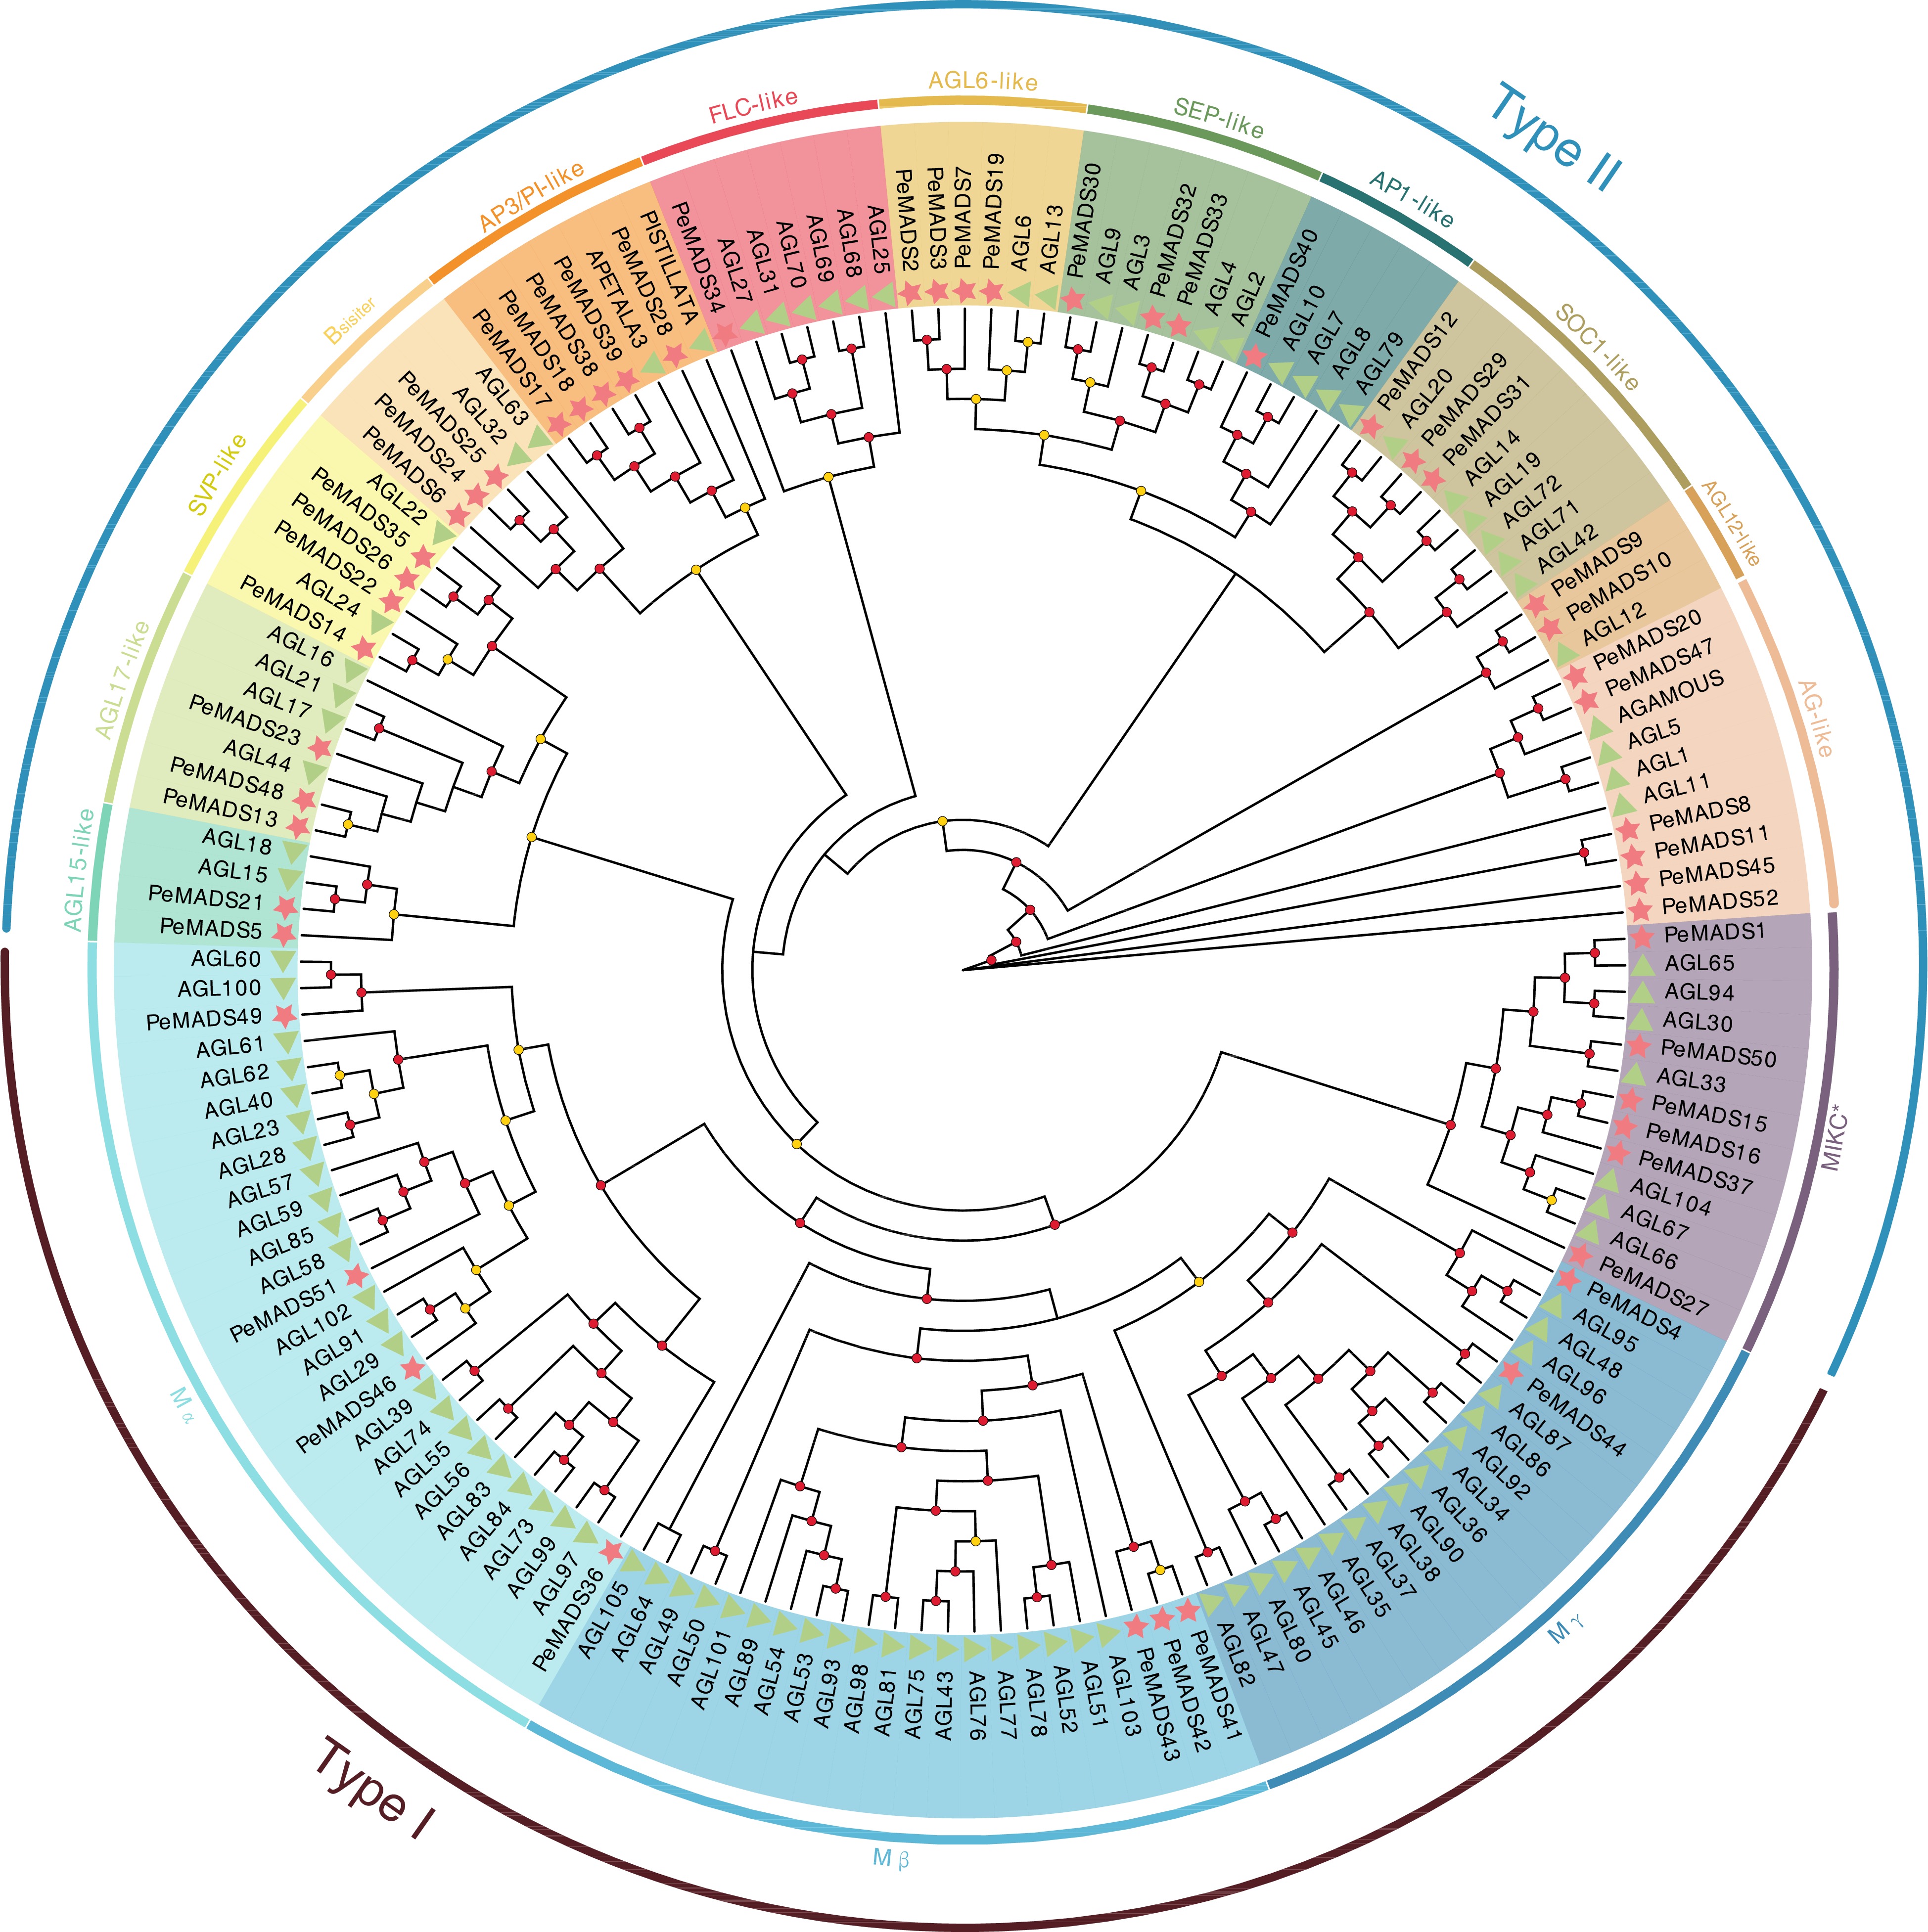
      Figure 2. 

      Phylogenetic tree of PeMADS proteins from Passiflora edulis (Pe) and Arabidopsis thaliana (At). Red starts and green triangles indicate passion fruit and Arabidopsis, respectively. The circle placed on the tree indicated the bootstrap value (≥ 90, red circle; 60~90, yellow circle; < 60, not shown).

    • To examine the phylogenetic relationships among MADS-box proteins from different species and ascertain the subfamily to which each PeMADS belong, a phylogenetic tree was constructed. The tree was based on the alignment result of MADS protein which is 105 sequences from Arabidopsis and 52 sequences from passion fruit (Fig. 2, Supplemental Table S5). According to previous studies and topology of the phylogenetic tree[18,6264], the PeMADS members were classified into two groups: type I, consisting of nine members (four as Mα, three as Mβ, and two as Mγ) while 43 members were classified as type II. Within the type II group, only six PeMADS proteins belonged to MIKC* category, while the remaining members were classified as MIKCC. The MIKCC proteins were further divided into 12 clades. Sequences of both passion fruit and Arabidopsis could be identified in all clades. Most PeMADS were determined in AG-like clade (six members), while the PI-like, FLC-like and AP1-like clades each had only one member. Inside the PI-like clade, the Arabidopsis MADS-box proteins showed homology with only one other member (PISTILATA and PeMADS28).

    • The phylogenetic relationship of PeMADS proteins was depicted using a phylogenetic tree with bootstrap values. The classification obtained from the phylogenetic tree analysis aligned with the aforementioned analysis (Fig. 3a). To identify and compare the common motifs of proteins within different groups, the MEME search tool was employed to 52 PeMADS proteins, and the first ten motifs with the highest conservation were detected (motif 1−10; Fig. 3b). As illustrated in the figure, members within the same group typically exhibited similar construction of motifs, particularly noticeable in B sister, AP3-like group and AGL6-like group. PeMADS proteins displayed varying numbers and distribution of conserved motifs, with a maximum of seven motifs and a minimum of one. Except for Mβ members, motif 1 could be observed in all proteins, which could be an obvious character of MADS-box proteins. Generally, the construction of Type I members was simpler than Type II members, especially Mγ group which contained only one motif. The location of MADS-box domain sequences was mapped to the full-length proteins (Fig. 3c). All members could detect MADS domain, whereas the length of the MADS domain is relatively short in the Mβ group. Except for MIKC* group, most Type II members contained K-box domain. Type II protein lacking the K-box domain were shorter than same group members, possibly due to the loss of terminal protein sequences.
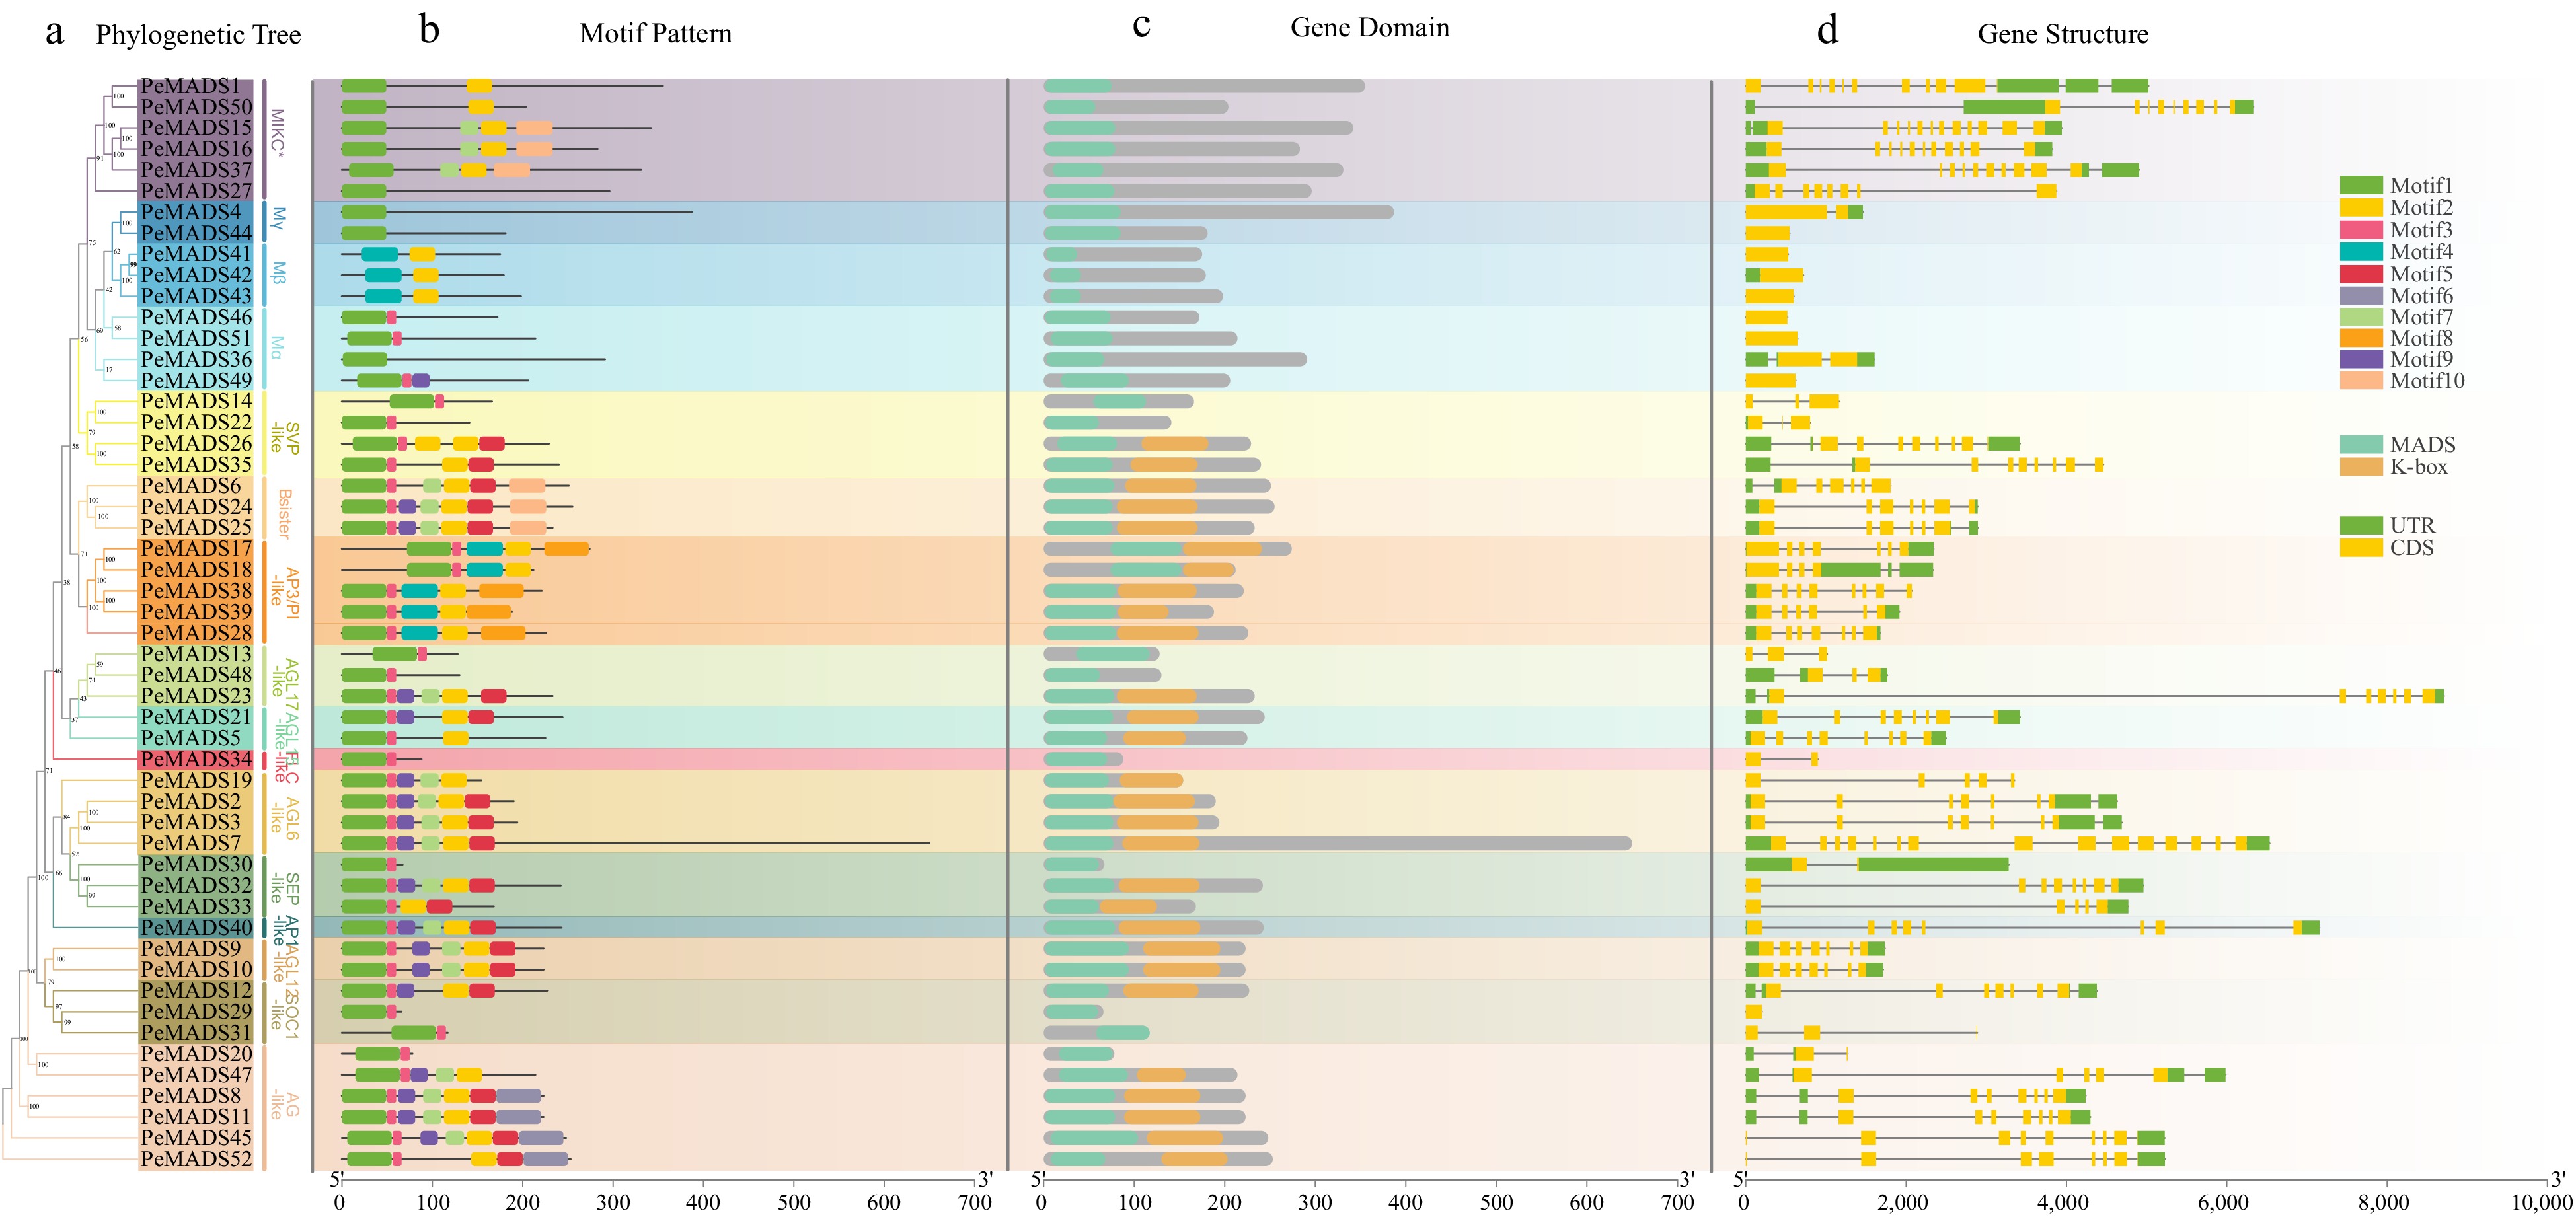
      Figure 3. 

      The phylogenetic relationship, conserved motifs and gene structures of PeMADSs. (a) The phylogenetic tree of 52 PeMADS proteins. (b) Distribution of conserved motifs in PeMADS proteins. (c) Distribution of MADS-domain and K-domain of PeMADS proteins.(d) The gene structures of the PeMADSs, include coding sequences (CDS) and untranslated regions (UTR).

      To investigate the structural diversity of PeMADS gene, the intron-exon organization of coding sequences was visualized reference to the GFF annotation file of passion fruit genome (Fig. 3c). The structure of type II group (MIKCC and MIKC*) was more complex. Nearly 33 (76.74%) type II members contained at least five CDS regions, among which the CDS regions of PeMADS7 was up to 15. Otherwise, type I groups (Mα, Mβ and Mγ) possessed less CDS regions, most members only had zero or single CDS regions, only PeMADS36 had two introns. The above discovery suggests that the transcription and splicing process of type II genes might be more complex than type I.

    • Cis-element species and distribution could partly imply the transcription regulation and the expression pattern of associate genes. The putative promoters of PeMADS genes,spanning 2000 base pairs, were predicted using the PlantCARE server (Supplemental Table S6). A total of 39 types of cis-elements were identified and categorized into five groups: light response (16), phytohormone response (10), stress response (7) and plant growth regulation (6). Figure 4b illustrates that the majority of genes exhibited a higher proportion of light-responsive elements, followed by phytohormone-responsive elements, whereas elements associated with plant growth regulation were the least abundant. The proportions indicate that the expression of the PeMADS gene was substantially affected by light. G-box element (127), Box 4 (117), GT1-motif (70) were the most common light-responsive elements. Phytohormone-responsive elements accounted for a considerable portion of the cis-elements, with ABRE (134; abscisic acid response), AAGAA motif (106; abscisic acid response), CGTCA motif (79; MeJA response) and ERE (53; ethylene response) being the most frequently identified elements. Some types of elements centralized exist on one gene, for instance, the number of ABRE element was obviously higher in PeMADS2 and PeMADS50, implying those genes might be more possible to play a vital role in corresponding phytohormone regulation. ARE elements (135; anaerobic induction), 58 drought stress response elements (MBS and DRE core), 25 WUN-motif (mechanical injury response) and 38 LTR (low temperature response) indicated that PeMADSs could respond to abiotic stresses. ARE elements could be detected in promoter sequences of all genes, speculating anaerobic conditions was one of critical factors which induce the transcription of PeMADS gene. However, cis-elements related to plant growth such as CAT-box, CCGTCC-box, and RY-element were comparatively limited. Within the promoter region of each gene, the count of such elements did not exceed four.
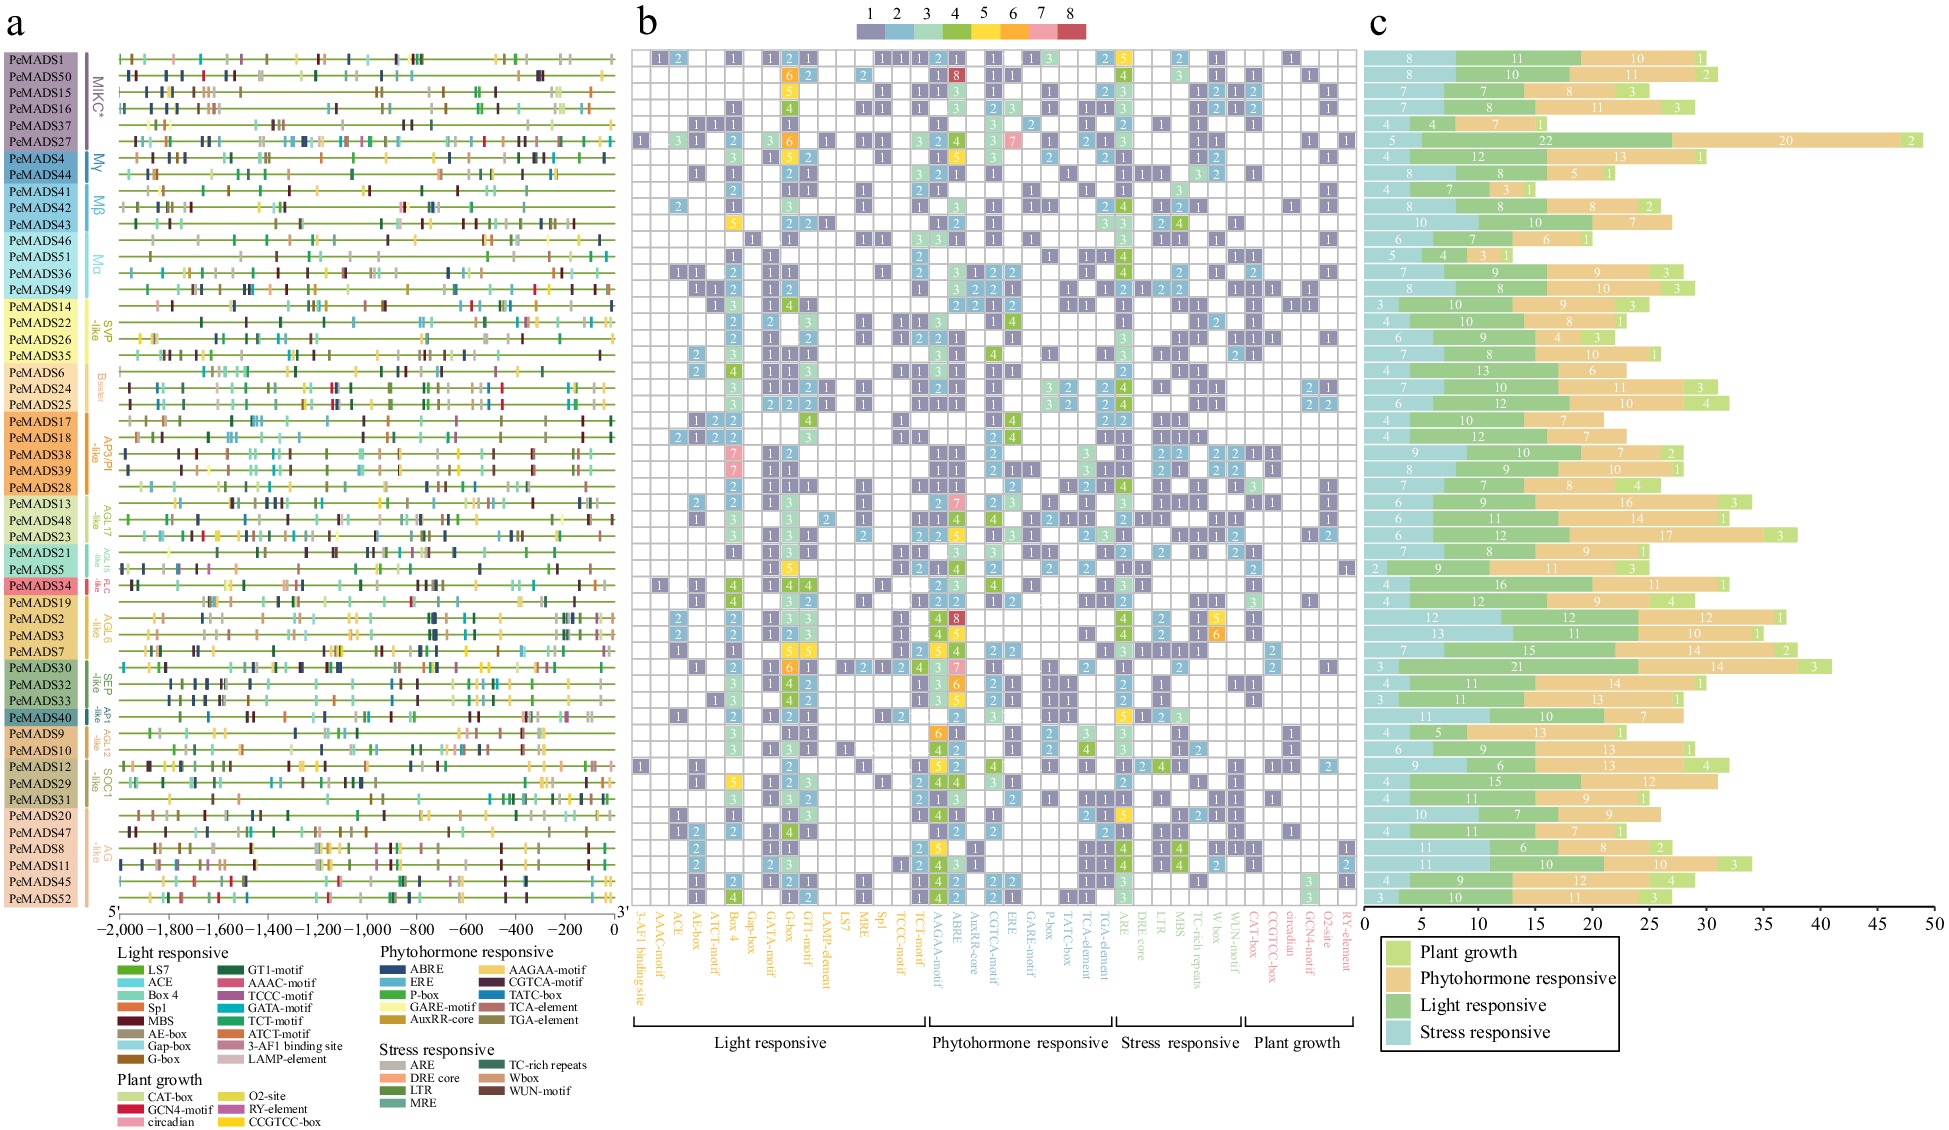
      Figure 4. 

      (a) Analysis of cis-elements in the promoter region of PeMADS genes. (b) Heatmap of the number of cis-elements, the different color represents the number of cis-elements. (c) The sum of cis-elements in categories shown as a histogram.

    • Based on the passion fruit genome's annotation files, 51 out of 52 PeMADS genes were assigned to nine linkage groups (LG01-LG09), and only one member (PeMADS52) was found on unassembled contig 7. The majority of MADS genes were concentrated on LG01 (19, 36.54%), particularly on the terminal region of LG01, encompassing approximately 33 Mb and containing 15 PeMADS genes. LG06 had the second highest number of MADS genes (12, 23.07%), followed by LG03 (5, 9.61%). The remaining linkage groups (LG02, LG04, LG05, LG07, LG08, LG09) contained only 1−3 PeMADS genes each. Numerous MADS genes were located near the proximate or the distal ends of the linkage groups. There was no apparent evidence suggesting a direct connection between the number of MADS genes and the length of linkage groups.

      Based on the collinearity analysis conducted using MCScanX, only one tandem duplication gene pair, PeMADS42 and PeMADS43, was identified from LG06. Additionally, a total of 20 segmental duplication gene pairs were discovered, comprising 28 PeMADS genes located on duplicated segments across nine linkage groups (Fig. 5). Most duplicated gene pairs belong to the MIKCc group (24 pairs, accounting for 85.71% of the total). The MIKC* group and Mα have two gene pairs respectively, and those genes could be produced by whole genome duplication or the segmental genome duplication events.

      Figure 5. 

      Distribution and collinearity of PeMADS genes in the passion fruit genome. PeMADSs marked by red has synteny with other genes. Gray lines indicate synteny blocks in passion fruit genome, brown lines indicate segmental duplicated MADS gene pairs of passion fruit.

      To further investigate the evolutionary process of the passion fruit MADS-box gene family, a comparative systemic analysis was conducted between passion fruit and six representative species (Fig. 6), which cover three dicots (A. thaliana, S. lycopersicum and V. vinifera) and two monocots (O. sativa and Z. mays). The number of synteny blocks observed in A. thaliana, S. lycopersicum, V. vinifera, O. sativa and Z. mays were 996, 982, 922, 399 and 328 respectively. Among the 52 PeMADS genes, different numbers of genes exhibited syntenic relationships with the six species. A total of 33 members show colinearity with grape (33), followed by tomato (26), Arabidopsis (19) and rice (5), maize contains the least number (2). These findings suggest that the collinearity relationship between passion fruit and dicotyledons was closer than that between monocotyledons. Notably, most identified PeMADS exhibited synteny relationships with more than one species. PeMADS15 showed collinear counterparts in passion fruit and five other species, indicating its potential existence prior to ancestral divergence and its association with vital characteristics. Whereas some of the PeMADS syntenic gene pairs were exclusively found in dicotyledons or monocotyledons, suggesting their emergence after the divergence between these two groups. Syntenic PeMADS genes in five species are highlighted in Supplemental Table S7.
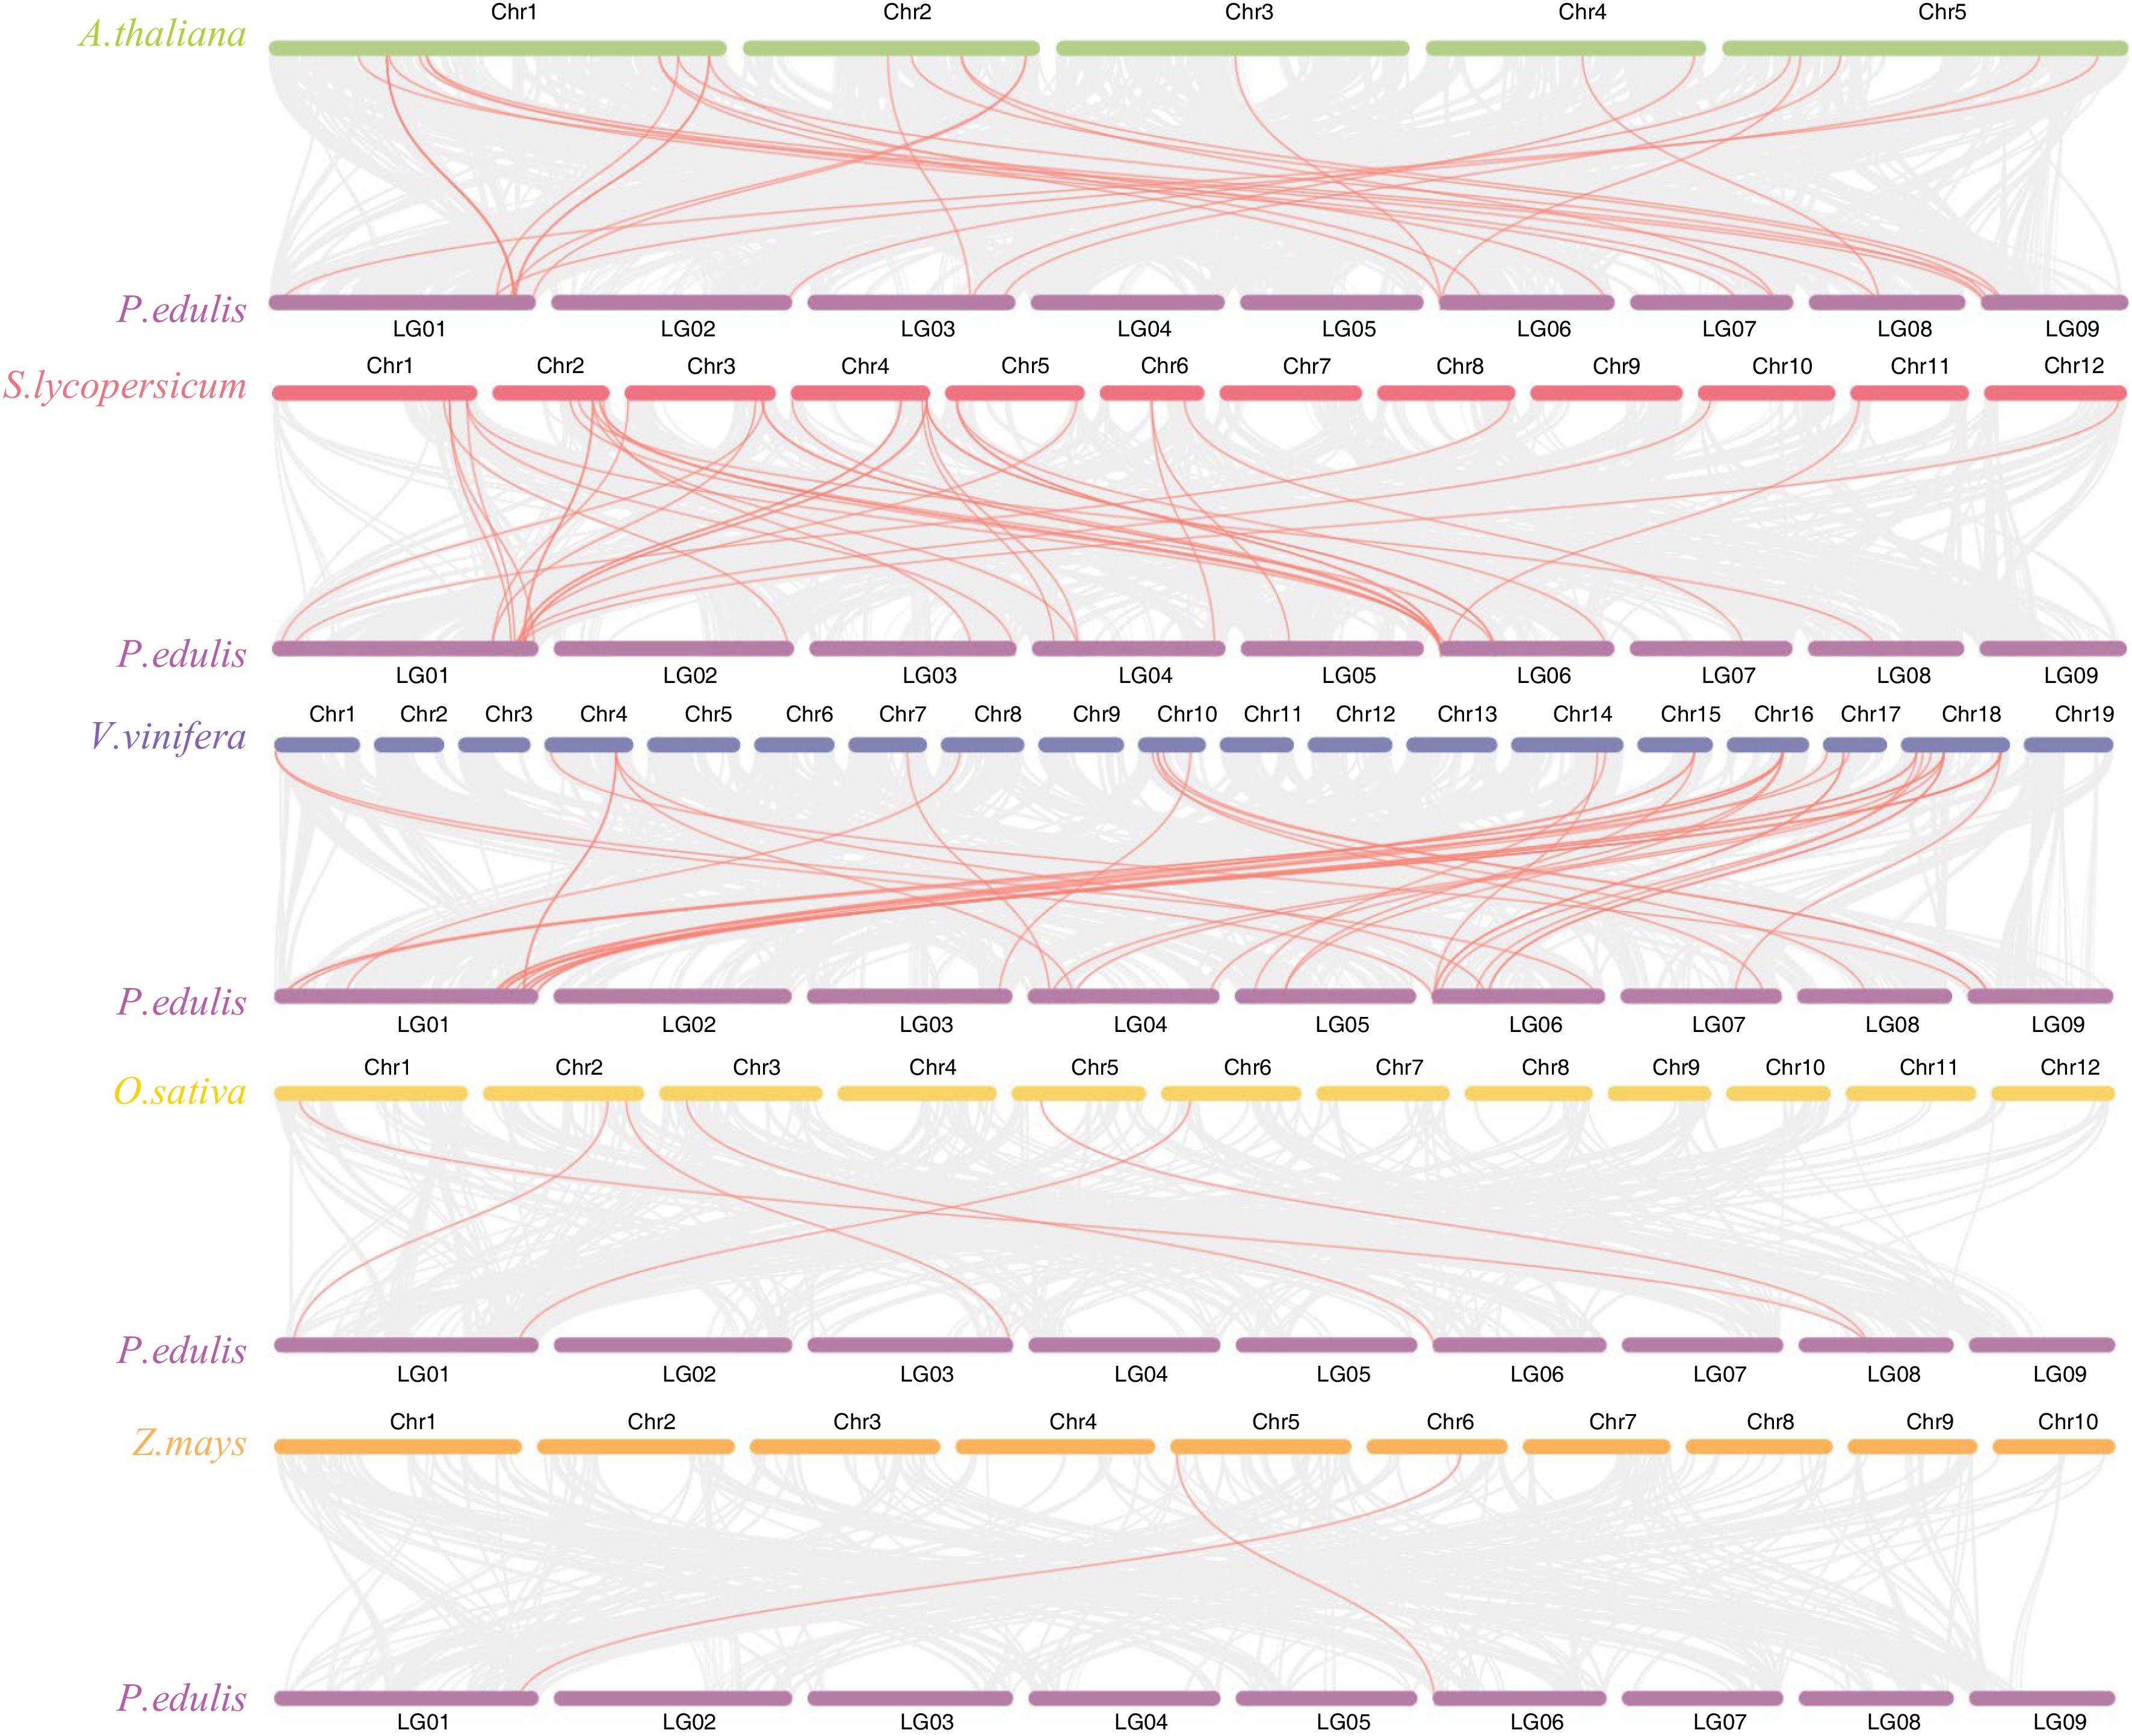
      Figure 6. 

      Synteny analysis of PeMADS genes and five representative plants species. Gray lines in the background indicate the collinear blocks between passion fruit and other plant genomes, while red lines highlight the systemic gene pairs of PeMADSs between passion fruit and other plant genomes.

      To gain insights into the evolutionary constraints affecting the passion fruit MADS-box gene family, we calculated the Ka/Ks (non-synonymous substitution/synonymous substitution) ratios for both segmental duplicated gene pairs and tandem duplicated gene pairs using the NG method. As shown in Table 2, it can be observed that all segmental duplicated gene pairs have Ka/Ks values below 1, indicating a strong purifying selective pressure acting on these duplicated gene pairs throughout evolution. In contrast, the only tandem duplicated gene pairs (PeMADS42 and PeMADS43) exhibited Ka/Ks > 1, suggesting that positive selection has influenced these gene pairs[65].

      Table 2.  The Ka/Ks ratios of the duplicated PeMADS gene pairs.

      Duplicated gene pairsKaKsKa/KsGroupDuplicated type
      PeMADS2 & PeMADS300.010MIKCC/MIKCCSegmental
      PeMADS3 & PeMADS70.130.570.24MIKCC/MIKCCSegmental
      PeMADS3 & PeMADS190.261.380.19MIKCC/MIKCCSegmental
      PeMADS8 & PeMADS110.010.020.28MIKCC/MIKCCSegmental
      PeMADS8 & PeMADS450.040.540.08MIKCC/MIKCCSegmental
      PeMADS9 & PeMADS100.010.010.43MIKCC/MIKCCSegmental
      PeMADS15 & PeMADS1600.020.29MIKC*/MIKC*Segmental
      PeMADS17 & PeMADS180.010.010.42MIKCC/MIKCCSegmental
      PeMADS17 & PeMADS280.291.290.22MIKCC/MIKCCSegmental
      PeMADS17 & PeMADS380.050.670.08MIKCC/MIKCCSegmental
      PeMADS18 & PeMADS280.221.150.19MIKCC/MIKCCSegmental
      PeMADS18 & PeMADS380.070.550.12MIKCC/MIKCCSegmental
      PeMADS20 & PeMADS470.030.510.07MIKCC/MIKCCSegmental
      PeMADS24 & PeMADS2500.010.3MIKCC/MIKCCSegmental
      PeMADS26 & PeMADS350.220.710.31MIKCC/MIKCCSegmental
      PeMADS28 & PeMADS380.321.520.21MIKCC/MIKCCSegmental
      PeMADS29 & PeMADS310.010.290.05MIKCC/MIKCCSegmental
      PeMADS32 & PeMADS330.010.020.28MIKCC/MIKCCSegmental
      PeMADS46 & PeMADS510.553.980.14Mα/MαSegmental
      PeMADS52 & PeMADS450.160.220.71MIKCC/MIKCCSegmental
      PeMADS42 & PeMADS430.140.062.42Mβ/Mβtandem
    • The protein structure homology modeling was performed using the SWISS-MODEL database, utilizing homologous templates retrieved from the PDB database. The three-dimensional models for all PeMADS protein sequences were generated and are presented in Supplemental Table S8. The predicted structures with highest GMQE and QMEAN scores for each subfamily were visualized using PyMOL and displayed in Fig. 7. Based on previous research on MADS transcription factors, the highly conserved MADS domain structure could be broadly categorized into one α-helix and two β-sheets. The flexible intervening domain was predominantly α-helical, while the K domain consisted of three α-helices. C-terminal domain generally exhibits variable structures[66,67]. Analogously, except for PeMADS7, which has the longest protein chain and a more complex structure, the remaining members displayed comparable structures, consisting of one to three α-helices, two β-sheets. Notably, nearly all members exhibited αββ structures in the N-terminal region, resembling the MDAS domain structure identified in human and yeast. However, the structure of other regions did not correspond to the expected characteristics of the I-domain and K-domain. This discrepancy may be attributed to the availability of suitable homologous models for the majority of PeMADS protein sequences. The coverage of homology modeling was approximately 50%, primarily focused on the N-terminal region, suggesting that successful modeling of certain structures towards the C-terminal region may have been limited.
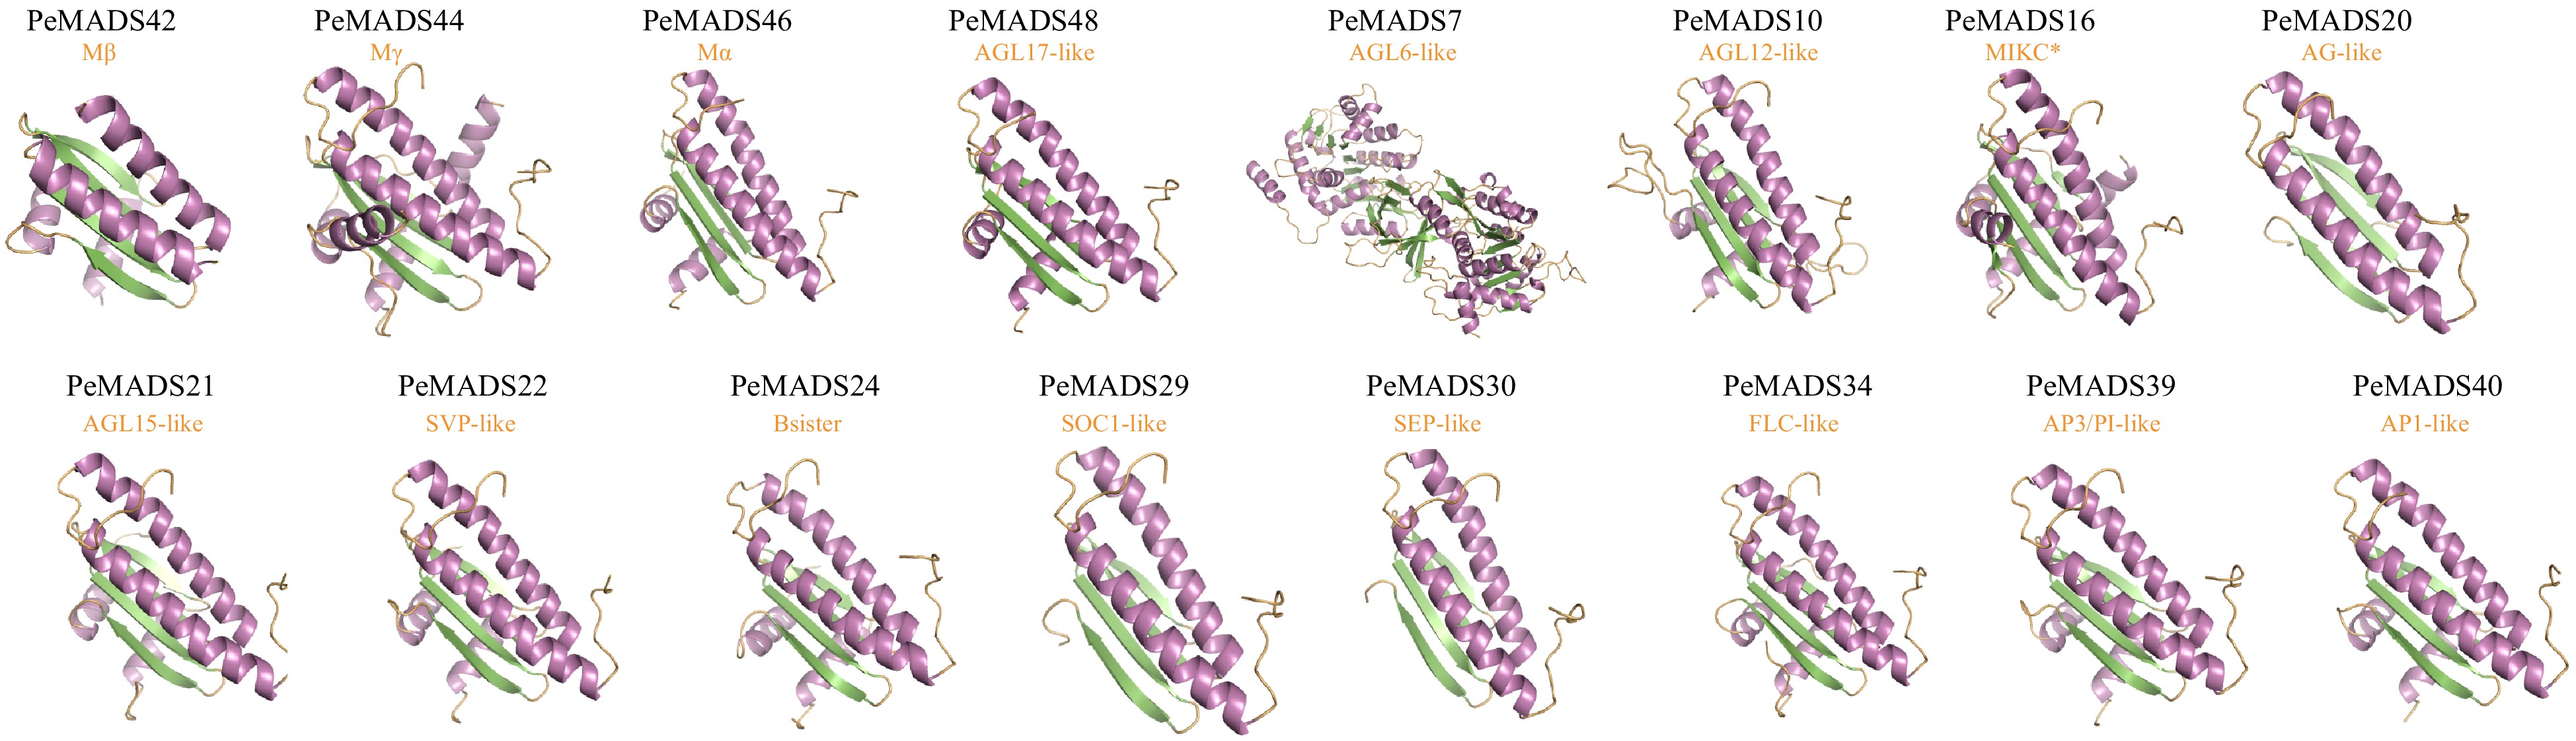
      Figure 7. 

      Predicted three-dimensional structures of the passion fruit MADS-box protein sequences.

    • Based on the conclusions drawn from previous studies, the 'ABC(D)E model' which proposes a hypothesis for the formation and identity of floral organs, was closely relevant to the MADS-box gene family[68]. In order to gain insights into the expression pattern of MADS-box genes, the flower (dividing into six species of floral structures) and the fruit were selected as sampling parts. The expression levels of 52 PeMADS genes were detected from these tissues during different development stages (Supplemental Table S9). Only the genes with the highest TPM value exceeding 6 are shown in Fig. 8.
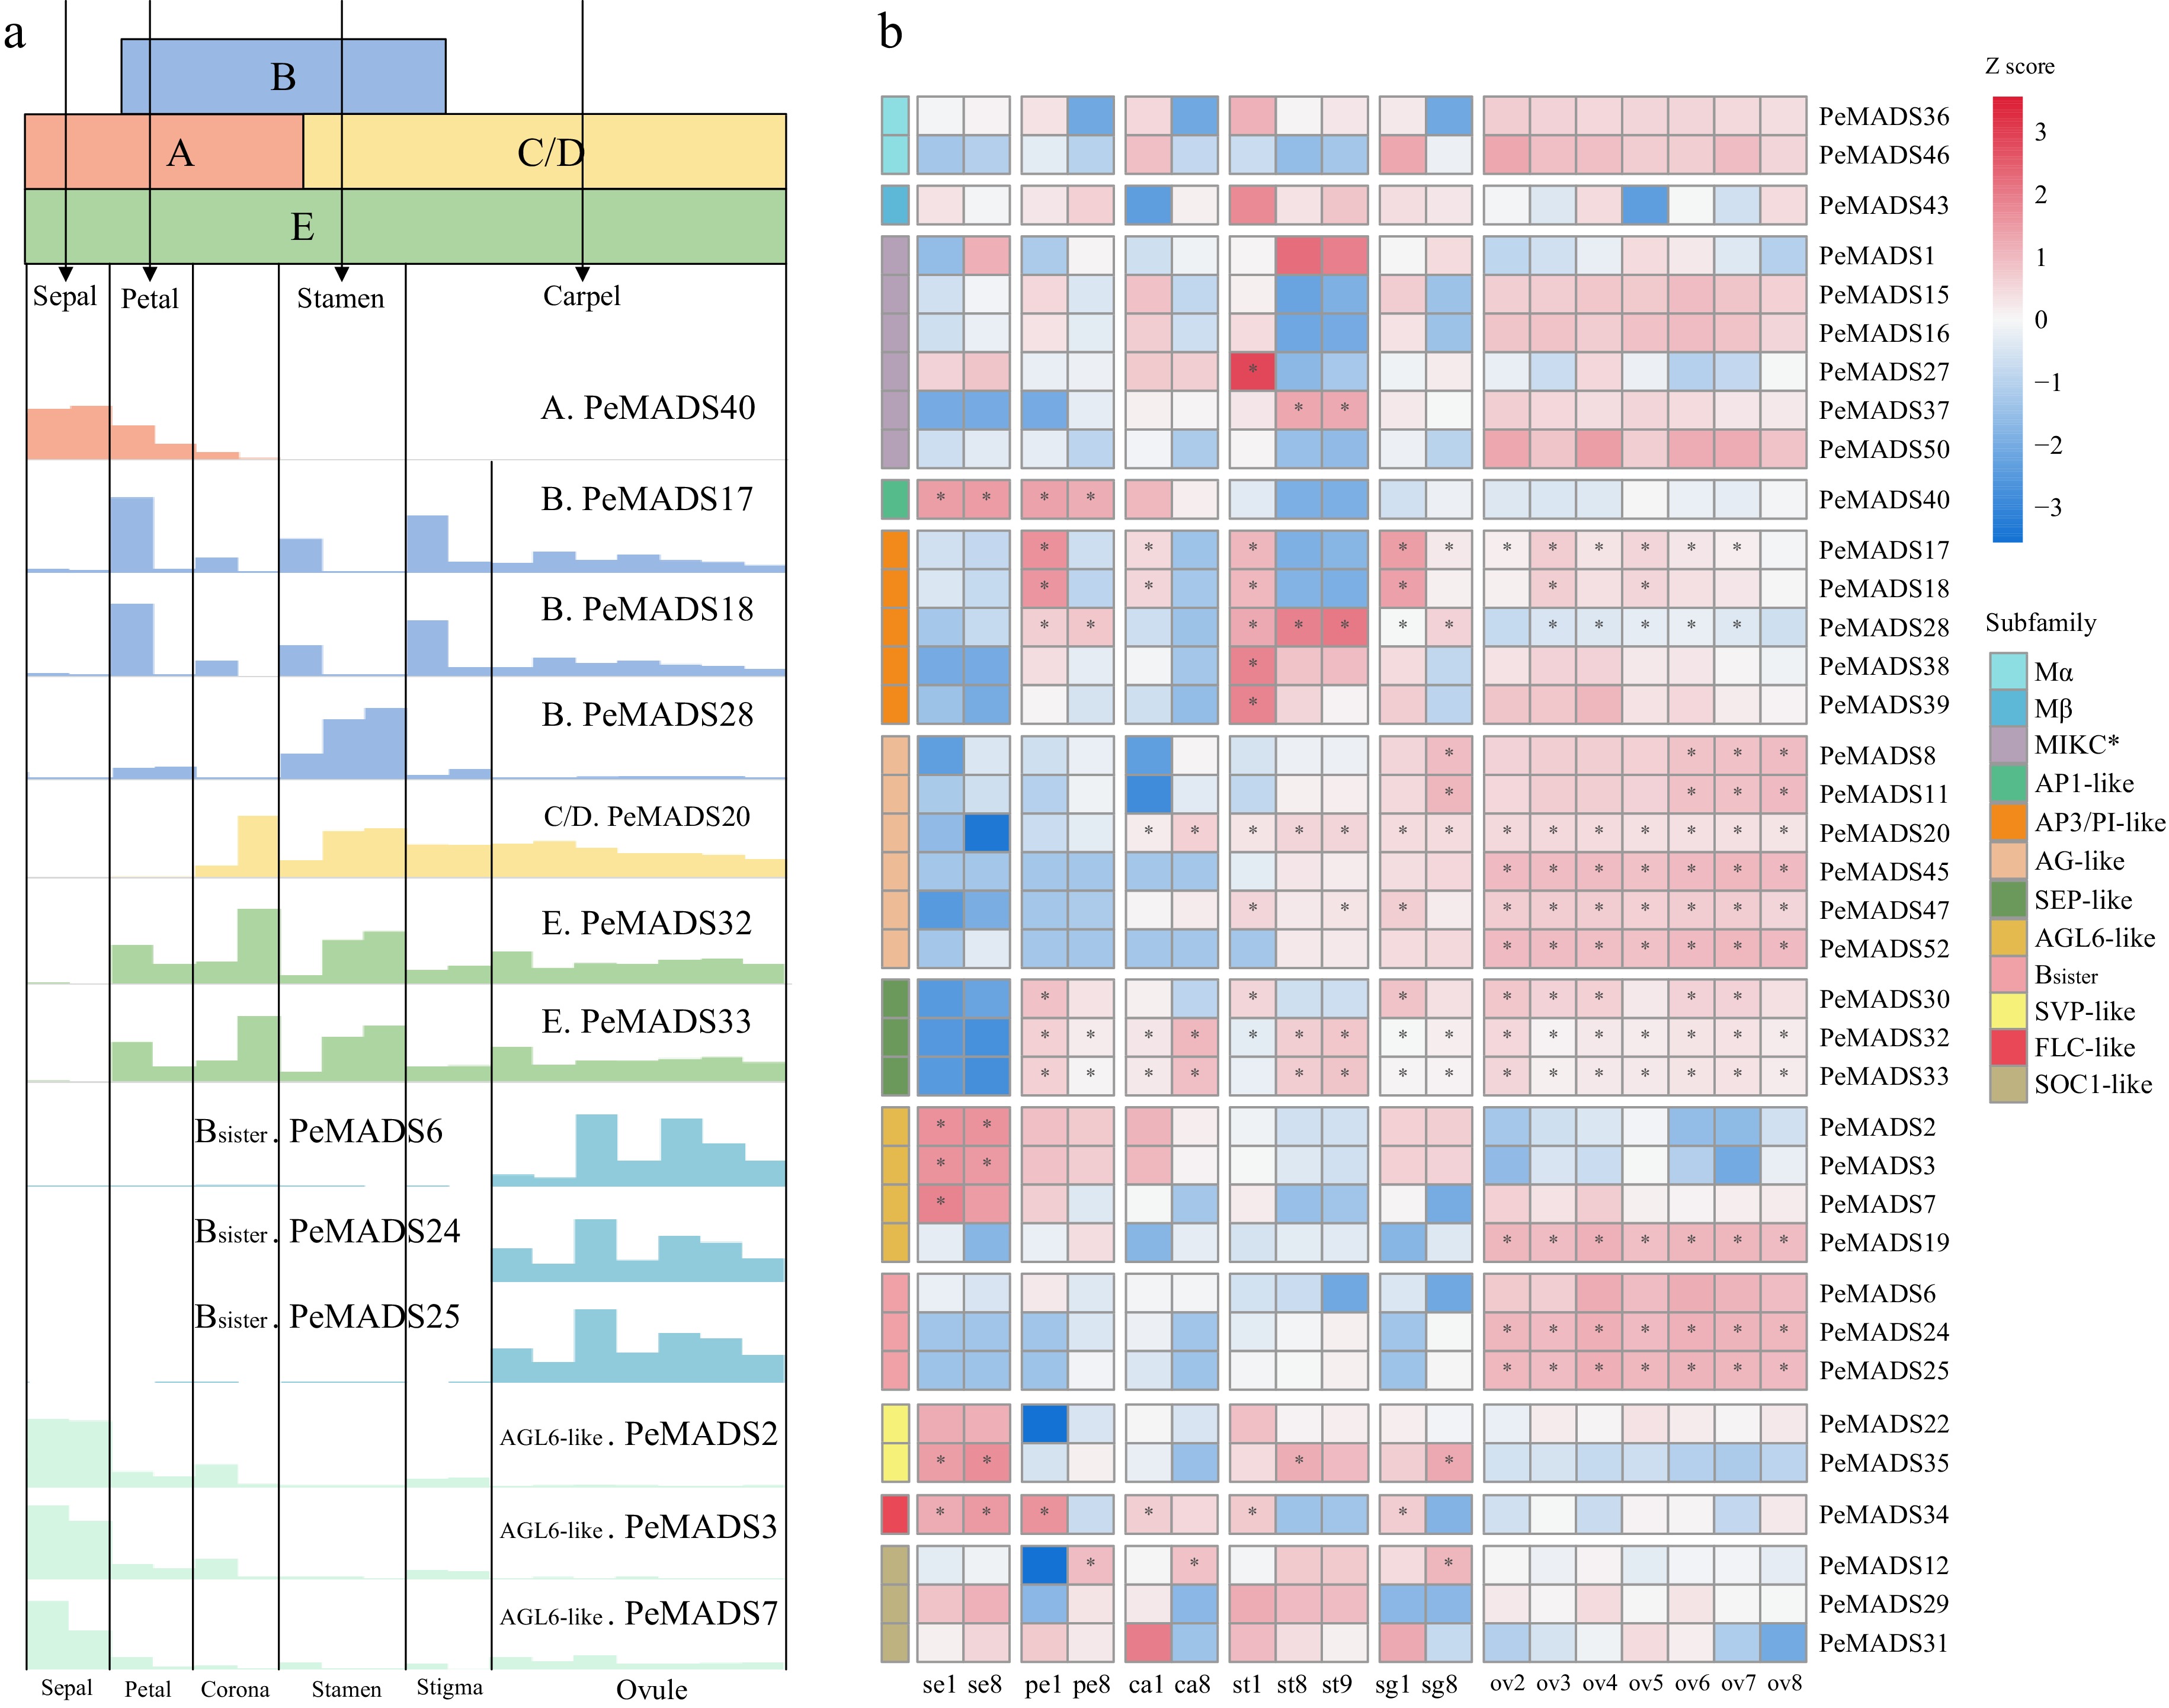
      Figure 8. 

      The expression profile of MADS-box genes in floral tissues. (a) The ABC(D)E model in Eudicots, the bottom illustration indicates the gene expression values (bar heights) of ABC(D)E members in passion fruit. (b) Gene expression patterns of MADS-box gene family from floral tissues of passion fruit.

      As shown in Fig. 8b, the expression level of Type I genes (PeMADS36/46/43) were generally lower compared to most Type II genes. As to Type II genes, PeMADS27 and PeMADS37 (MIKC* group) were detected in the early development stage and mid-and-late stage of stigmas, respectively, which might indicate genes from the MIKC* group influence stigmas development. Moreover, the expression profile within MIKCc group exhibited greater variability, with many genes showing high expression in multiple tissues. For example, PeMADS8/PeMADS11 were highly expressed in the last stage of stigmas and the last three stage of ovules. PeMADS32/33 were primarily expressed in any sampled tissues except sepals and the early stage of stamens. PeMADS17/18 were abundant in the early stages of petals, coronas, stamens, stigma and nearly all stages of ovules. Similarly, PeMADS28, also from the same subfamily, exhibited preferential expression in stamens, with slightly higher expression levels in petals and stigmas compared to other tissues. PeMADS40 was highly expressed in sepals and petals. PeMADS20 was mainly expressed in the late stage of coronas and stamens, nearly all stage of stigmas and ovules, and it was similar to the expression profile of PeMADS47, which exhibited relatively low expression in the corona, part stages of stamens and stigmas. PeMADS2/3/7 were abundant in sepals, petals and coronas. On the contrary, the expression patterns of many PeMADS genes were highly tissue-specific. For instance, PeMADS6/24/25/45/52 were abundant in all stages of ovules. PeMADS38/39 were only highly expressed in the first stage of stamen. Additionally, the expression levels of certain genes changed during the development process of specific tissue. For example, during the development of sepals and stigmas, the expression level of PeMADS35 gradually increased, and PeMADS28 displayed a similar ascending trend in stamens.

      Based on the expression profiles described above, PeMADS genes that match the expression patterns of homologues genes within the same subfamily were identified as potential members of the ABC(D)E model of passion fruit. Ultimately, PeMADS40 was categorized as an A group member, while PeMADS17, PeMADS18 and PeMADS28 belong to the B group, PeMADS20 was identified as a member of the C group, PeMADS32/PeMADS33 were classified as members of the E group. Additionally, three genes, namely PeMADS6, PeMADS24, and PeMADS25, belong to the B sister group, while PeMADS2, PeMADS3, and PeMADS7 belong to the AGL6-like group. The details of the expression trends are shown in Fig. 8a.

      To validate the reliability of predicted ABC(D)E model for passion fruit. Six PeMADS genes from different groups were selected as representatives for qRT-PCR analysis (Fig. 9b). PeMADS40, as an A group member, exhibited high expression levels in sepals, petals, and corona. B group member, PeMADS28 highly expressed in petals, stamens and sigmas. PeMADS20 (C/D group member) mainly expressed in the inner four whorls (ovule, stigma stamen and corona). PeMADS33 (E group gene) expressed in nearly all tissues excepting sepal. PeMADS6 (B sister) specifically expressed in ovules. PeMADS2 from AGL6-like group presented preferential expression in the first three whorls (sepal, petal and corona). Overall, the qRT-PCR analysis results were consistent with the RNA-seq data.
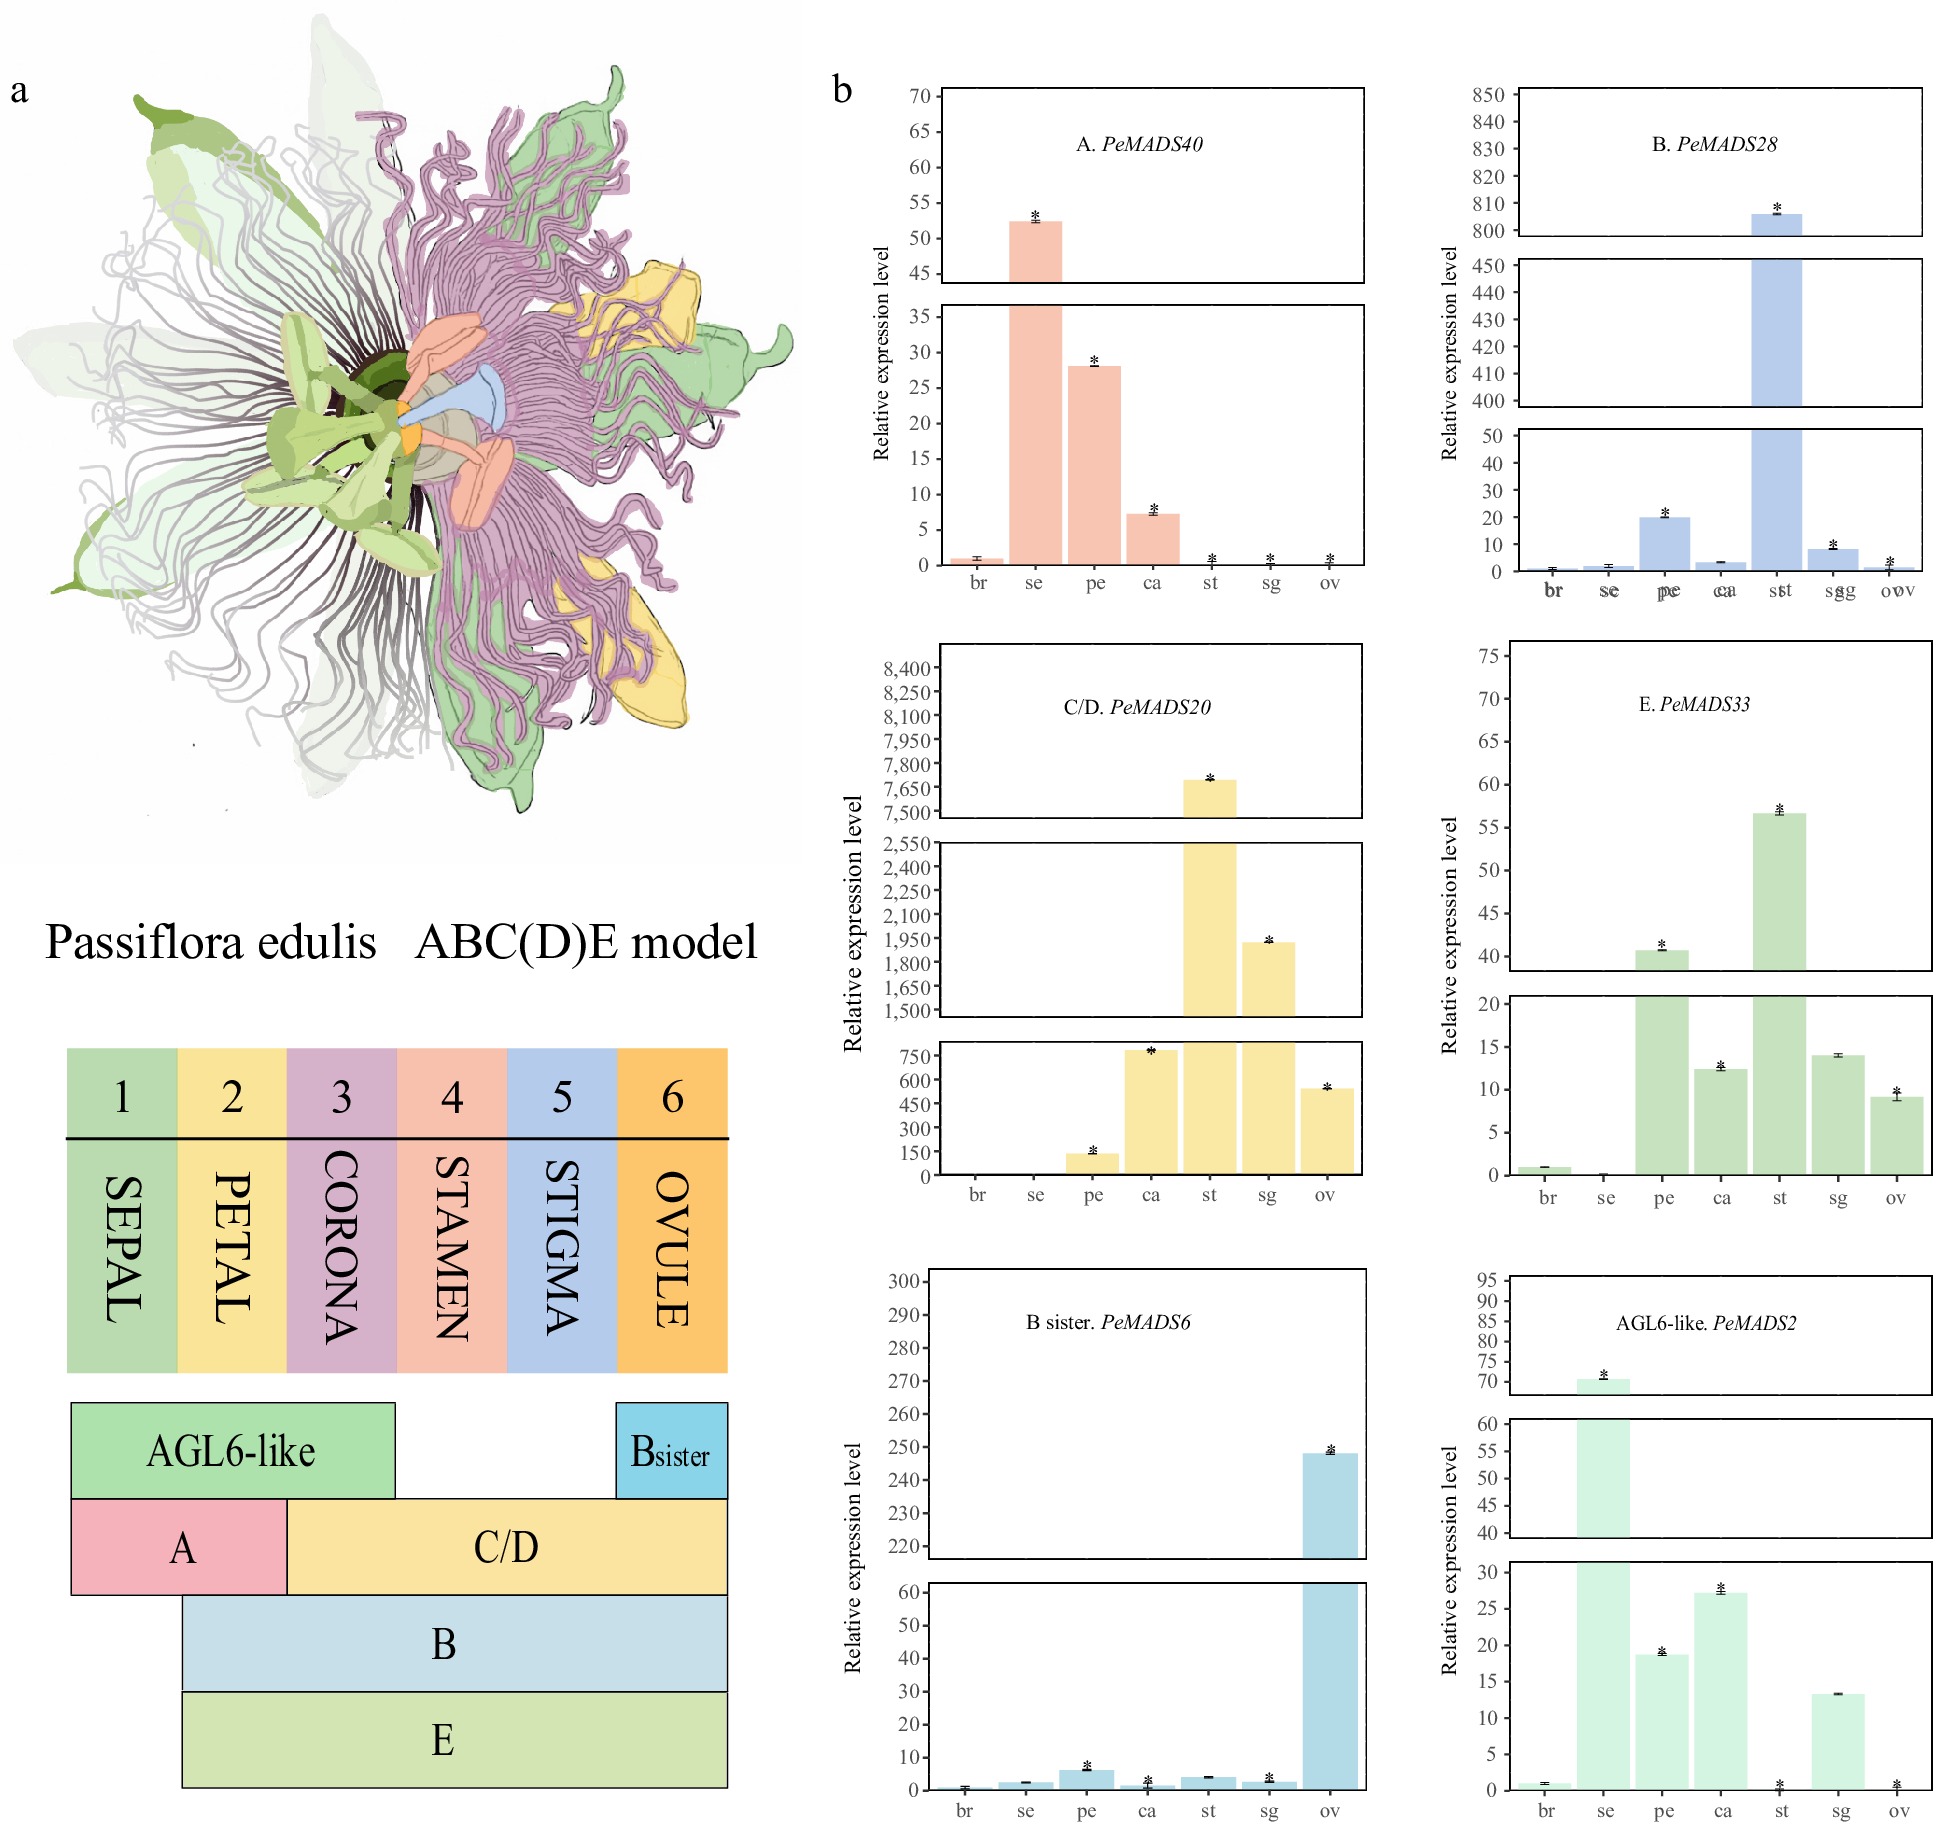
      Figure 9. 

      qRT-PCR analysis of part members from the ABC(D)E model. (a) Illustration of passion fruit floral structure and summarization of the ABC(D)E model in passion fruit. (b) qRT-PCR results of six representative members from the ABC(D)E model, all experiments were performed independently at least three times. Error bars represent the standard deviation. Asterisks indicate significant differences in transcript levels compared with the early development stage of bract (br1). (* p < 0.05).

    • Except for the core functions in floral meristem, MADS-box genes have been reported to be involved in various growth regulatory processes, like the maturation of fruit[39]. To further investigate the tissue-specific expression of PeMADS genes, the RNA-seq data of vegetative organs (tendril, stem, leaf) and fruits with different stages of maturation were extracted for analysis. Excluding the MADS-box members with rather lower expression level (highest TPM value is less than 5), 31 PeMADSs were retained (Fig. 10a). The expression levels of partial genes were higher in fruit tissue, like PeMADS2/11/32/33/34/47/45. Notably, PeMADS34 showed significant induction during the early development stage of fruits, with its expression decreasing as the fruit matured. Most genes expressed during the fruit maturation belong to the AG-like and SEP-like subfamilies. Conversely, certain PeMADS genes were primarily detected in vegetative organs. PeMADS9/12/40 highly expressed in tendril and stem. PeMADS22/35 mainly expressed in tendril, stem and leaf. The expression level of PeMADS1/29/31 were higher in stem and leaf. It should be noticed that the members from ABCD(E) model were also associated with the development of these non-floral organs, which might indicate the diversified functions of MADS-box members.
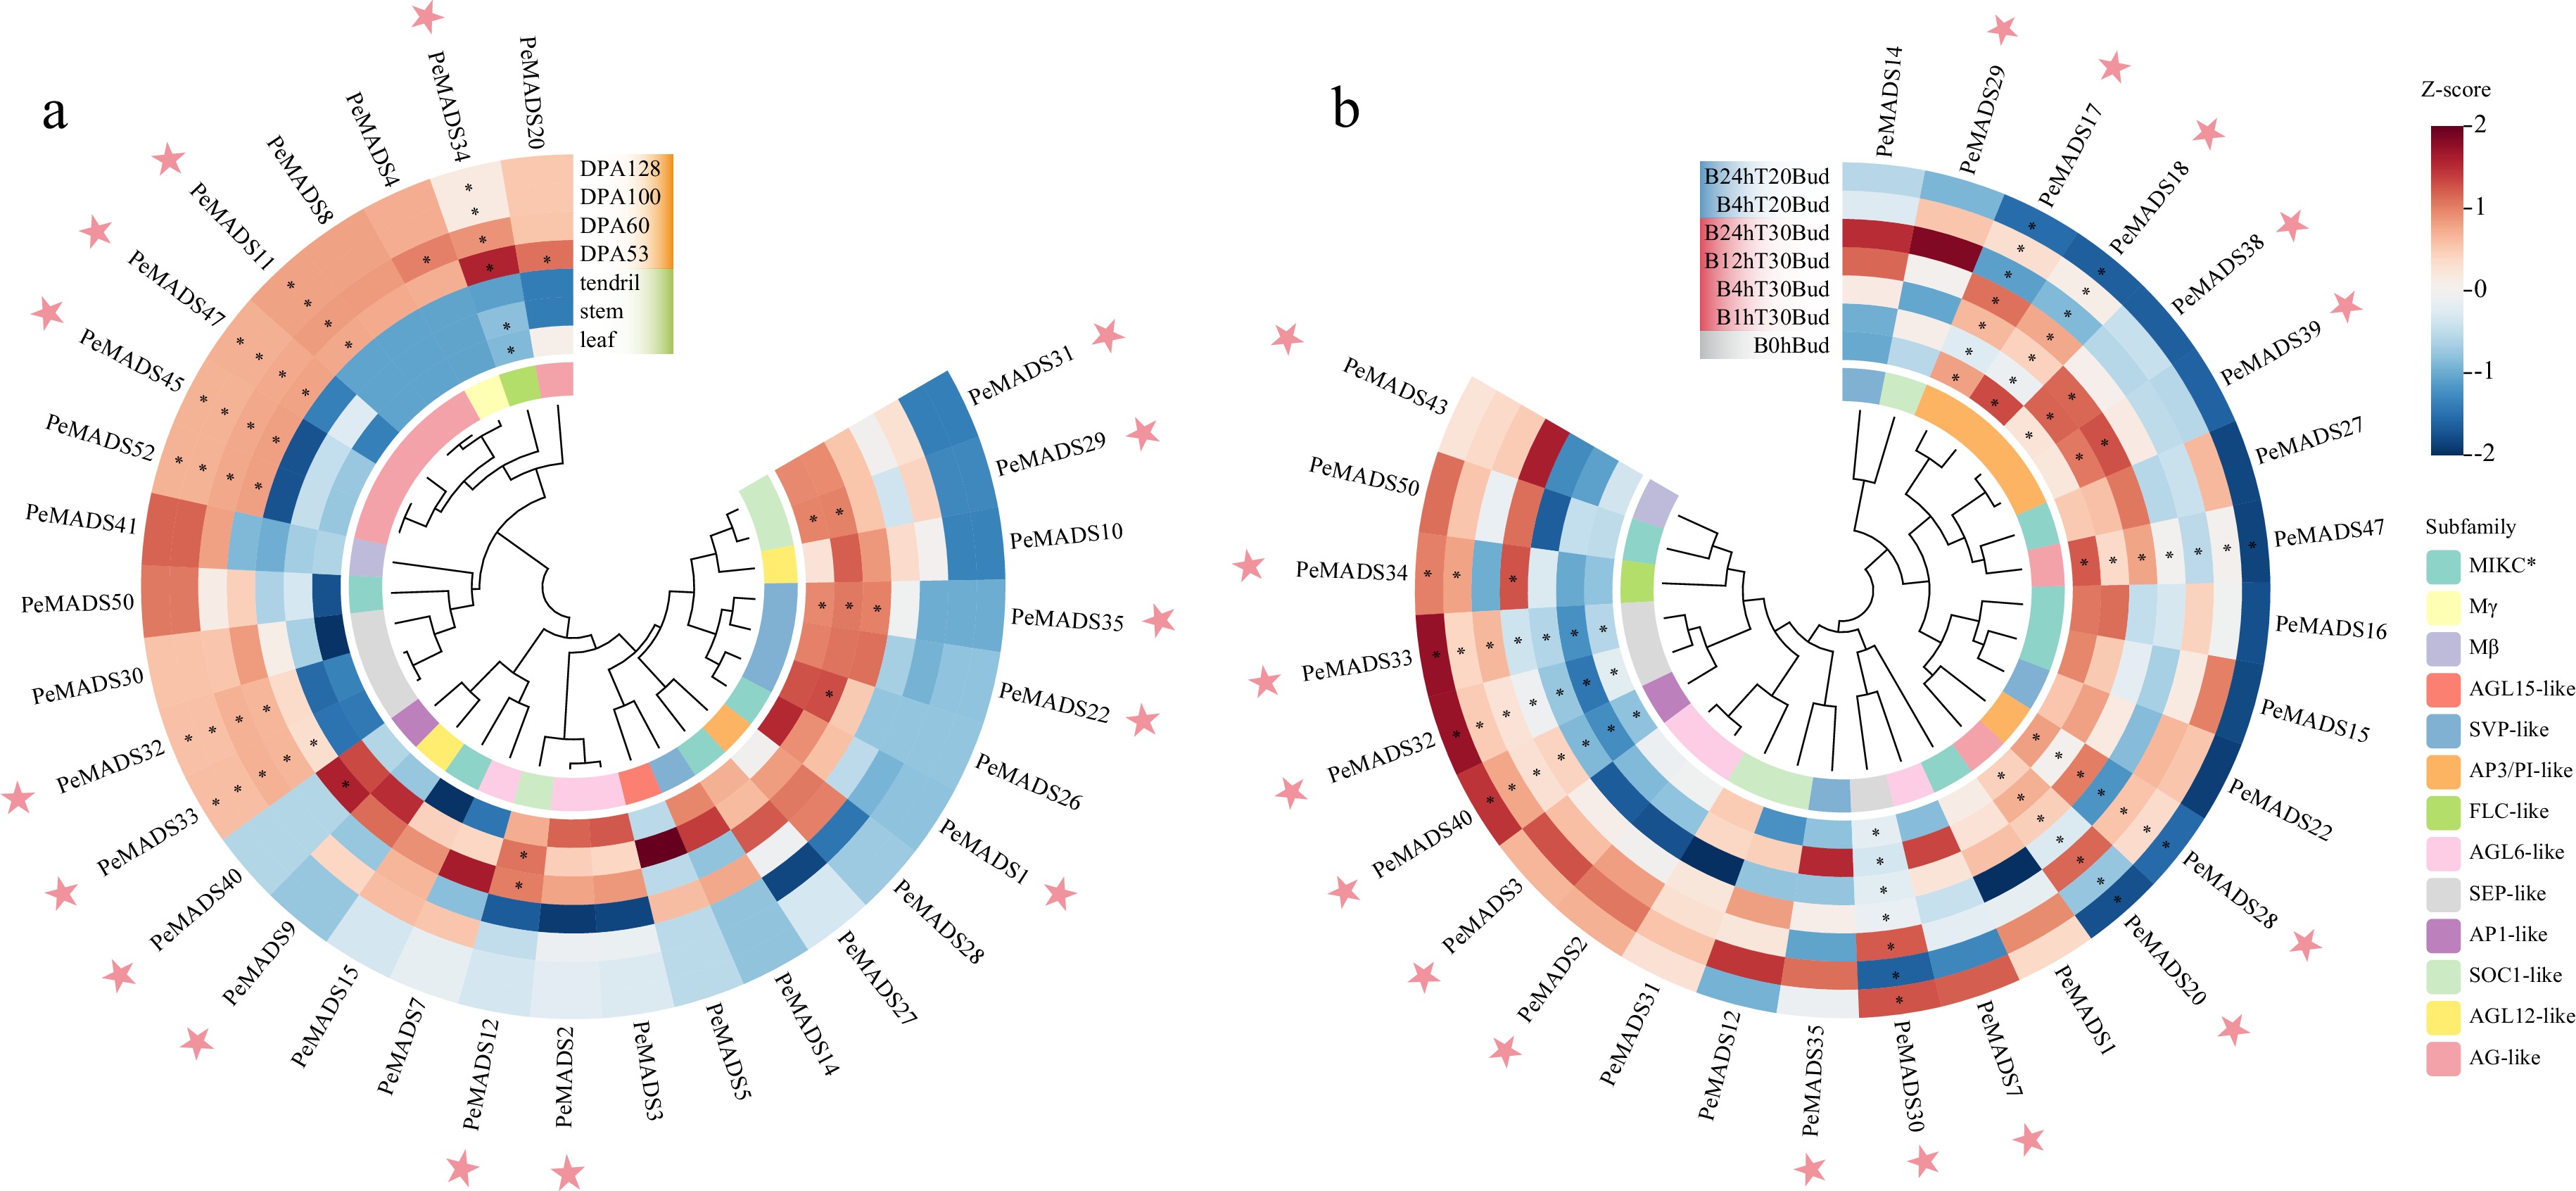
      Figure 10. 

      Expression profiles of PeMADS genes in (a) non-floral organs and (b) under temperature stresses, DPA indicates days post anthesis; '1, 4, 12, 24 h' represents the time of stress treatment. Temperature of 20 °C (T20) is regarded as cold stress, while a temperature of 30 °C is regarded as heat stress (T30). The pink stars highlight the members with specific expression characteristics during fruit development or under temperature treatment.

      The differentiation of flower buds and the development of floral organs in passion fruit are highly temperature-sensitive. As observed by Chang & Cheng, high temperatures (30/25 °C) could make flower buds more susceptible to abortion, while low temperatures (20/15 °C) result in the inhibition of flower bud formation[69,70]. To explore the response of PeMADS genes under low-temperature (20 °C) and high-temperature stress (30 °C), the RNA-seq data was acquired from examined buds with a series of processing-time gradient. After excluding members with low expression levels, significant differences in expression profiles were observed among the remaining PeMADS genes under temperature stresses (Fig. 10b). Some members were induced under cold conditions, including PeMADS2/3/30/32/33/34/40. Among them, the expression of PeMADS30/32/33/40 were significantly increased with longer processing time. The change in expression were more complex under heat conditions, the expression level of most genes increased in different degrees. PeMADS38/39, were up-regulated at 1 and 4 h of processing time, while down-regulated at 12 and 24 h. As for PeMADS7/35/20/28/29/30/43, their expression levels noticeably increased at specific processing times, while the expression of PeMADS17/18/47 were repressed under heat stress. Presumably, the E-class genes (PeMADS32/33) and the A-class genes (PeMADS40) might respond to cold stress, while the C/D-class gene (PeMADS20) and the B-class gene (PeMADS28) were mainly induced under heat stress. The expression levels of the aforementioned genes are listed in Supplemental Table S10.

      To elucidate the response patterns of PeMADS genes to phytohormone treatments, qRT-PCR was employed to analyze the relative expression profiles of six selected PeMADS genes in plant leaves subjected to different phytohormones (ABA and GA) at various time points (0, 12, 24, and 48 h) (Fig. 11, Supplemental Table S11). Under ABA treatment, the expression of PeMADS2, PeMADS28, and PeMADS38 was significantly downregulated at different time points. The expression of PeMADS17 and PeMADS34 were initially induced and gradually upregulated at 12 and 24 h post treatment, followed by downregulation at 48 h. PeMADS19 exhibited a significant induction of high expression within a short period (12 h), but as the treatment time extended, the expression gradually decreased, with notable suppression observed at 48 h. In the case of GA treatment, PeMADS2 showed a gradual downregulation with the prolongation of treatment time, while the relative expression of PeMADS17 was initially suppressed at 12 h post-treatment, followed by induced upregulation, reaching its highest expression level at 24 h post-treatment. The relative expression of PeMADS19 was induced and upregulated after GA treatment, with the highest expression level observed at 48 h. Additionally, the expression of PeMADS28, PeMADS34, and PeMADS38 was all inhibited, with significant differences observed at 12 h. These findings suggested that PeMADS genes generally play roles in responding to phytohormones (Supplemental Table S11).
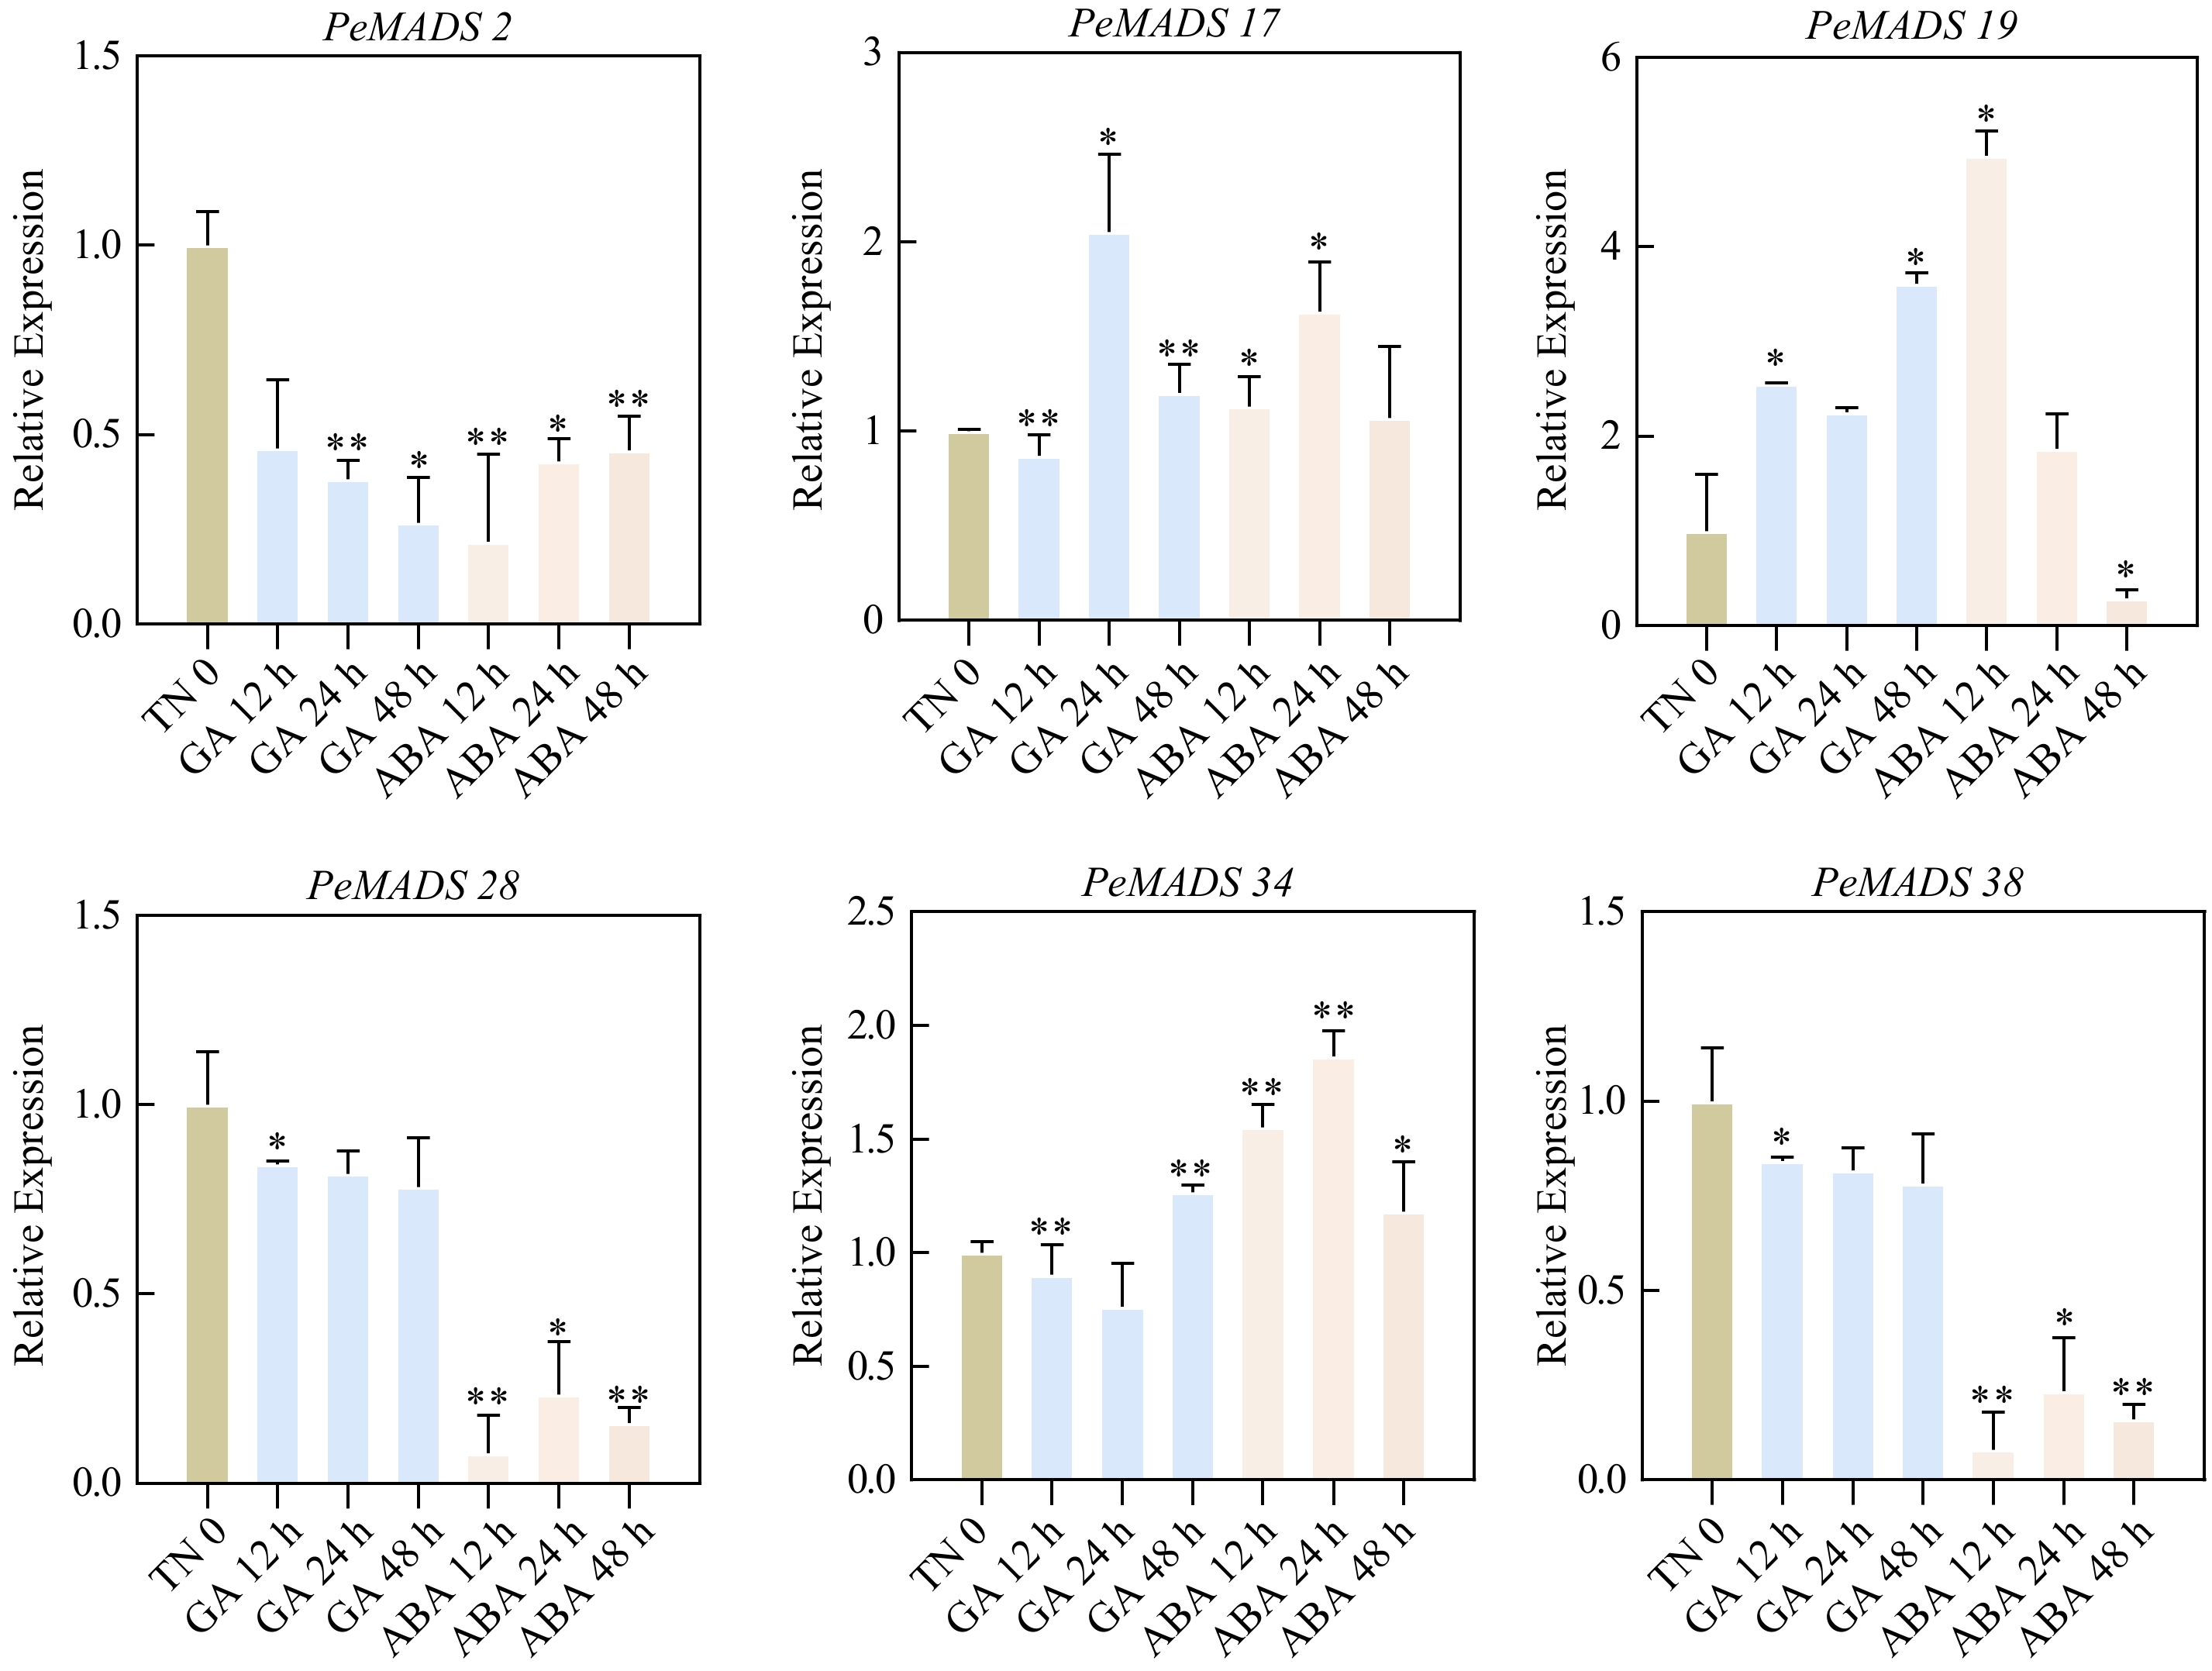
      Figure 11. 

      Expression patterns of PeMADS genes in response to phytohormones. Leaf samples were collected at 0, 12, 24 and 48 h after GA and ABA treatments. Significant differences were analyzed by the Student's t-test (* p-value < 0.05, ** p-value < 0.01, *** p-value < 0.001, and **** p-value < 0.0001).

    • The MADS-box gene family plays crucial roles in the morphology development of diverse plant organs, particularly in the floral development of angiosperms[71]. Since the completion of the genome sequences of numerous significant plant species, MADS-box genes have been systematically identified and examined at the genome level in various plants. In the present work, we have successfully identified 52 MADS-box genes in the genome of the passion fruit, and conducted analyses on their phylogenic relationships, gene structure, gene synteny and prediction of cis-elements in all members. However, it should be noted that the gene number is relatively low compared to other flowering plants (angiosperms). Several common crops, such as Arabidopsis, wheat, and tomato, possess over 100 members in the MADS-box gene family. It is well-known that whole genome duplication events play a significant role in the expansion of gene numbers and species diversification. Whole-genome duplication events exert a significant influence on gene proliferation and species diversification, prominently shaping the evolutionary trajectory of flowering plants through subsequent gene losses[72]. In the case of passion fruit, the reduction of type I genes resulted in a reduction in the size of the MADS-box gene family. Moreover, on a genome scale we reveal that specific subfamilies of PeMADS primarily evolved via segmental duplication rather than tandem amplification. Furthermore, the higher number of exons in type II (MIKC) genes (ranging from 5 to 15) compared to type I (1−2) is consistent with observations in other species, including sesame, rice, and soybeans. This findings align with the more intricate and versatile functions attributed to type II (MIKC) genes in contrast to type I (M-type) genes[73,74].

    • In this study, we provide a summary of the ABC(D)E model in passion fruit based on tissue-specific expression profiles. The six parts of floral organs in passion fruit were regulated by different combinations of ABC(D)E-class genes. Specifically, the carpel (including ovules and stigmas), stamens and coronas were controlled by the same pattern, B-, C(D)- and E-class genes. Petals are regulated by A-, B- and E-class genes. A-class genes is the only type functions in sepals (Fig. 9a).

      Referring to the well-studied A. thaliana MADS gene family, the classic ABC(D)E model of floral organ identities can be described as follows: AP1 belongs to A group (performing functions for sepals and petals), AP3 and PI are classified as B group (performing functions for petals and stamens), AG is identified as C group (performing functions for stamen and carpel), while SEP genes belongs to E group (performing functions in all floral whorls)[75,76]. In our study, the expression profiles of passion fruit ABC(D)E homologues partly agree with the putative model derived from A. thaliana. The regulation of petals and stamens in passion fruit is similar to that of A. thaliana, but differs in terms of carpels and sepals. With the exception of previous detected C- and E-genes, we found that B-class genes are found expressed in carpels and corona, indicating an expanded regulatory role of B-class in passion fruit. Conversely, the types of genes that regulate sepals are reduced, with only A-class genes associated with sepal development. Notably, the mutation of the B-class gene DoLL1, in Physalis floridana leads to abnormal development of ovules and stigmas, suggesting the regulatory functions of B-class genes in carpels[77]. Previous studies have speculated that the wider expression patterns could be associated with subfunctionalization and neofunctionalization of ABC(D)E genes[78]. Hence, we suggest that the increased number of whorls regulated by B-class gene in passion fruit might be a result of adaption to its floral development.

      In addition to the classic ABC(D)E model, two other types of homologues, B sister and AGL6-like genes, also exhibit tissue-specific characteristics in passion fruit flowers. The phylogenetic relationship indicates that AGL6-like genes are sister to SEP-like gene(E-class)[79,80]. Correlational research suggests that AGL6-like in rice could regulate the development of four whorls of floral organs, which is similar to the function of E-class genes[81]. The expression of AGL6 homologous gene has been detected in the first and second whorl of flowers in Hyacinthus orientalis[82]and Petunia hybrida[83]. AGL-6 like genes may be associated with inner perianth formation in angiosperms[84]. In passion fruit, E-class gene are detected in all flower whorls except for sepals. While the expression level of AGL6-like genes is extremely high in sepal. We propose that AGL6 homologues partly assume the function of E-class genes in the evolution of passion fruit and assist A-class genes in sepal identification. Similarly, B sister genes are primarily transcribed in the female reproductive organs of plants[85], and their aberrant expression leads to ovule development failure in wheat[86]. The same expression pattern is observed in passion fruit, where B sister genes are specifically expressed in ovule tissues, suggesting their role in ovule development. In addition to the above results, three members of MIKC* gene family exhibit prominent expression in stamens, aligning with previous speculations regarding the conserved function of MIKC* gene in male gametophytes of angiosperms[87]. Therefore, we propose the MIKC* genes may serve a similar function in male gametophytes of passion fruit.

      Corona filaments are a distinctive structure in passion fruit and a significant attraction of its floral organs. However, the exact regulatory pathway underlying corona filament formation remains unknown. In this study, we found that corona filaments are mainly controlled by B-, C/D- and E- class genes, with C/D-class exhibiting the highest expression levels among all genes. Previous researches has also detected the expression of B- and C/D-class genes in coronas and the speculated that the tissue's origin is from stamens based on the species of regulated genes and its developmental characteristics[88]. Nevertheless, stronger evidence is still needed to elucidate the origin of the corona tissue.

    • Arabidopsis has reported a total of 108 MADS-box genes[18], whereas passion fruit has only identified 52 MADS-box members. However, there is no significant difference in the number of Type II genes between two species (46 in Arabidopsis, 43 in passion fruit). Thus, the disparity mainly lies in the number of Type I genes (59 in Arabidopsis, nine in passion fruit), and duplication events of Type I genes are frequent in Arabidopsis[20]. These duplication events of Type I genes may explain the imbalanced distribution of MADS-box gene members between Arabidopsis and passion fruit.

      Based on the phylogenetic relationship, the 37 MIKCc genes were unevenly classified into 12 gene clades (Fig. 2). Interestingly, compared to their homologous members in Arabidopsis within the same clade, there is an expansion of corresponding members in passion fruit, particularly in the AG-like, AGL6-like, AP3/PI-like and SVP-like clades. This expansion is especially prominent in the AG-like (C-class homologous of ABCE model) and AP3/PI-like (B-class homologous of ABCE model homologous) clades. In our study, most genes in the AP3/PI-like clade and all genes in the AG-like clade were generated through segmental duplications, and nearly all members showed high expression levels in various tissues. This broader regulation scope of the B- and C-class genes, compared to the classic ABC(D)E model, may explain the increase in these two clades. Moreover, there is a decrease in the number of gene members in certain clades, including SOC1-like, AP1-like and FLC-like. SOC1-like genes mediate the control of flowering through vernalization, photoperiod and gibberellin-dependent pathways[89]. The FLC gene serves as a central factor in Arabidopsis vernalization[64,90]. The loss of genes from these two clades in passion fruit could potentially affect the flowering machinery of the plant.

    • Beside the function in flower development, MADS-box genes also play a crucial role in multiple physiological processes of plants, including abiotic stress response and development of non-floral organs[91]. AGL4 encodes a MADS and are involved in weakening cell walls during dehiscence, abscission, and cellular expansion[92]. In passion fruit, its homologue (PeMADS32/33) exhibits expression in various tissues, with a significant up-regulation observed under cold stress conditions. Based on these findings, we propose that these two genes could play a role in cell wall remodeling during cold stress. Besides, hormone-responsive elements were detected in the putative promoter regions of many PeMADSs including PeMADS2/19/34, and expression analysis using qRT-PCR also revealed that these genes were widely involved in phytohormone responses. The diverse cis-regulatory elements in the promoter regions may contribute to the functioning of PeMADS genes in different processes. Our results shown that the expression profile of AP1 homologue (PeMADS40) exhibits exceptionally high expression in tendrils, which is consistent with previous studies[93]. It provides some evidence supporting the origin of tendrils. In banana and tomato, members of the AG-like and SEP-like subfamily are considered key regulators of fruit development and ripening processes[40,94,95]. Similarly, among the PeMADS genes that highly expressed in fruit of passion fruit, a significant portion belong to the AG-like and SEP-like subfamilies.

    • Passion fruit is an economic valuable tropical fruit crop characterized with nutritious juice, aromatic smell and bright flowers with distinct coronal filaments. Here, we present a comprehensive analysis of MADS-box genes in passion fruit, covering gene identification, phylogenetic relationships, gene structure, motif composition, chromosomal mapping, gene duplication and synteny, cis-element predictions, and tissue-specific expression profiles. A total of 52 PeMADS genes were identified and classified into two types with five subgroups (type I: Mα, Mβ, Mγ; type II: MIKCC, MIKC*) based on phylogenetic analysis. The relatively limited abundance of this gene family in passion fruit can be attributed to the reduction in type I genes, while certain subfamilies undergo amplification of PeMADSs predominantly through segmental duplications. Structural analysis including exon-intron organization, motif composition and homologous protein modeling reveals the relatively conserved features of PeMADSs within the same subfamily. Furthermore, we systematically discussed MADS-box genes involved in the ABC(D)E model of flower organ identity. Our findings indicate that the regulation of petals and stamens in passion fruit is similar to that of Arabidopsis but diverges concerning carpels and sepals. Notably, the distinctive floral organ in passion fruit, the corona, is primarily controlled by B-, C(D)-, and E-class genes, supporting the speculation of its stamen origin. In addition to the classic ABC(D)E model, B sister and AGL6-like genes exhibit tissue-specific characteristics in passion fruit flowers. AGL6 homologues might be involved in sepal identification, while B sister genes are specifically expressed in ovule tissues, suggesting their role in ovule development. Besides, many of PeMADSs tend to express in both reproductive and vegetative organs, and some members are also induced under temperature stresses. These results give an insight into the relationship between the structure and function of MADS-box genes in passion fruit. Ultimately, this study lays a foundation for further investigations into the functions of MADS-box genes in passion fruit tissue development, particularly in flower organ identity.

    • The authors confirm contribution to the paper as follows: study conception and design: Qin Y, Zheng P; data collection: Lu L, Chen S, Shen M; analysis and interpretation of results: Cai X, Liu R, Wang X; draft manuscript preparation: An C, Liao J. All authors reviewed the results and approved the final version of the manuscript.

    • The data presented in this study are available in the article, Supplementary materials and online repositories. The passion fruit genome data and transcriptome data used in this work were deposited in the National Genome Data Center (NGDC) (https://ngdc.cncb.ac.cn) database under accession number GWHAZTM00000000 and CNP0002747, respectively.

      • This work was supported by Science and Technology Innovation Project of Pingtan Science and Technology Research Institute (PT2021007, PT2021003), General Project of Guangxi Natural Science Foundation (2022GXNSFAA035535), Guangxi Academy of Agricultural Sciences basic Research Project (Gui Nong Ke 2021YT046). We thank Zhenjiang Zheng from Fujian Lianmi Ecological Agriculture Development Co., LTD for his assistance during sample collection.

      • The authors declare that they have no conflict of interest.

      • Received 3 November 2023; Accepted 23 January 2024; Published online 20 February 2024

      • 52 MADS-box genes were identified in passion fruit genome, and the reduction of type I genes contributed to the reduction in the size of the MADS-box gene family.

        A putative flower regulation ABC(D)E model of passion fruit were proposed, and the unique floral structure--coronas, similar to stamens, were predominately controlled by B-, C(D)- and E-class genes.

        Many PeMADS genes were also involved in the development regulation of non-floral tissues and/or in phytohormone and stress responses.

      • # Authors contributed equally: Chang An, Jingyi Liao, Lin Lu

      • Copyright: © 2024 by the author(s). Published by Maximum Academic Press on behalf of Hainan University. This article is an open access article distributed under Creative Commons Attribution License (CC BY 4.0), visit https://creativecommons.org/licenses/by/4.0/.
    Figure (11)  Table (2) References (95)
  • About this article
    Cite this article
    An C, Liao J, Lu L, Cai X, Liu R, et al. 2024. From gene expression to flower patterns: genome-wide characterization of the MADS-box gene family in passion fruit (Passiflora edulis). Tropical Plants 3: e004 doi: 10.48130/tp-0024-0004
    An C, Liao J, Lu L, Cai X, Liu R, et al. 2024. From gene expression to flower patterns: genome-wide characterization of the MADS-box gene family in passion fruit (Passiflora edulis). Tropical Plants 3: e004 doi: 10.48130/tp-0024-0004

Catalog

  • About this article

/

DownLoad:  Full-Size Img  PowerPoint
Return
Return