-
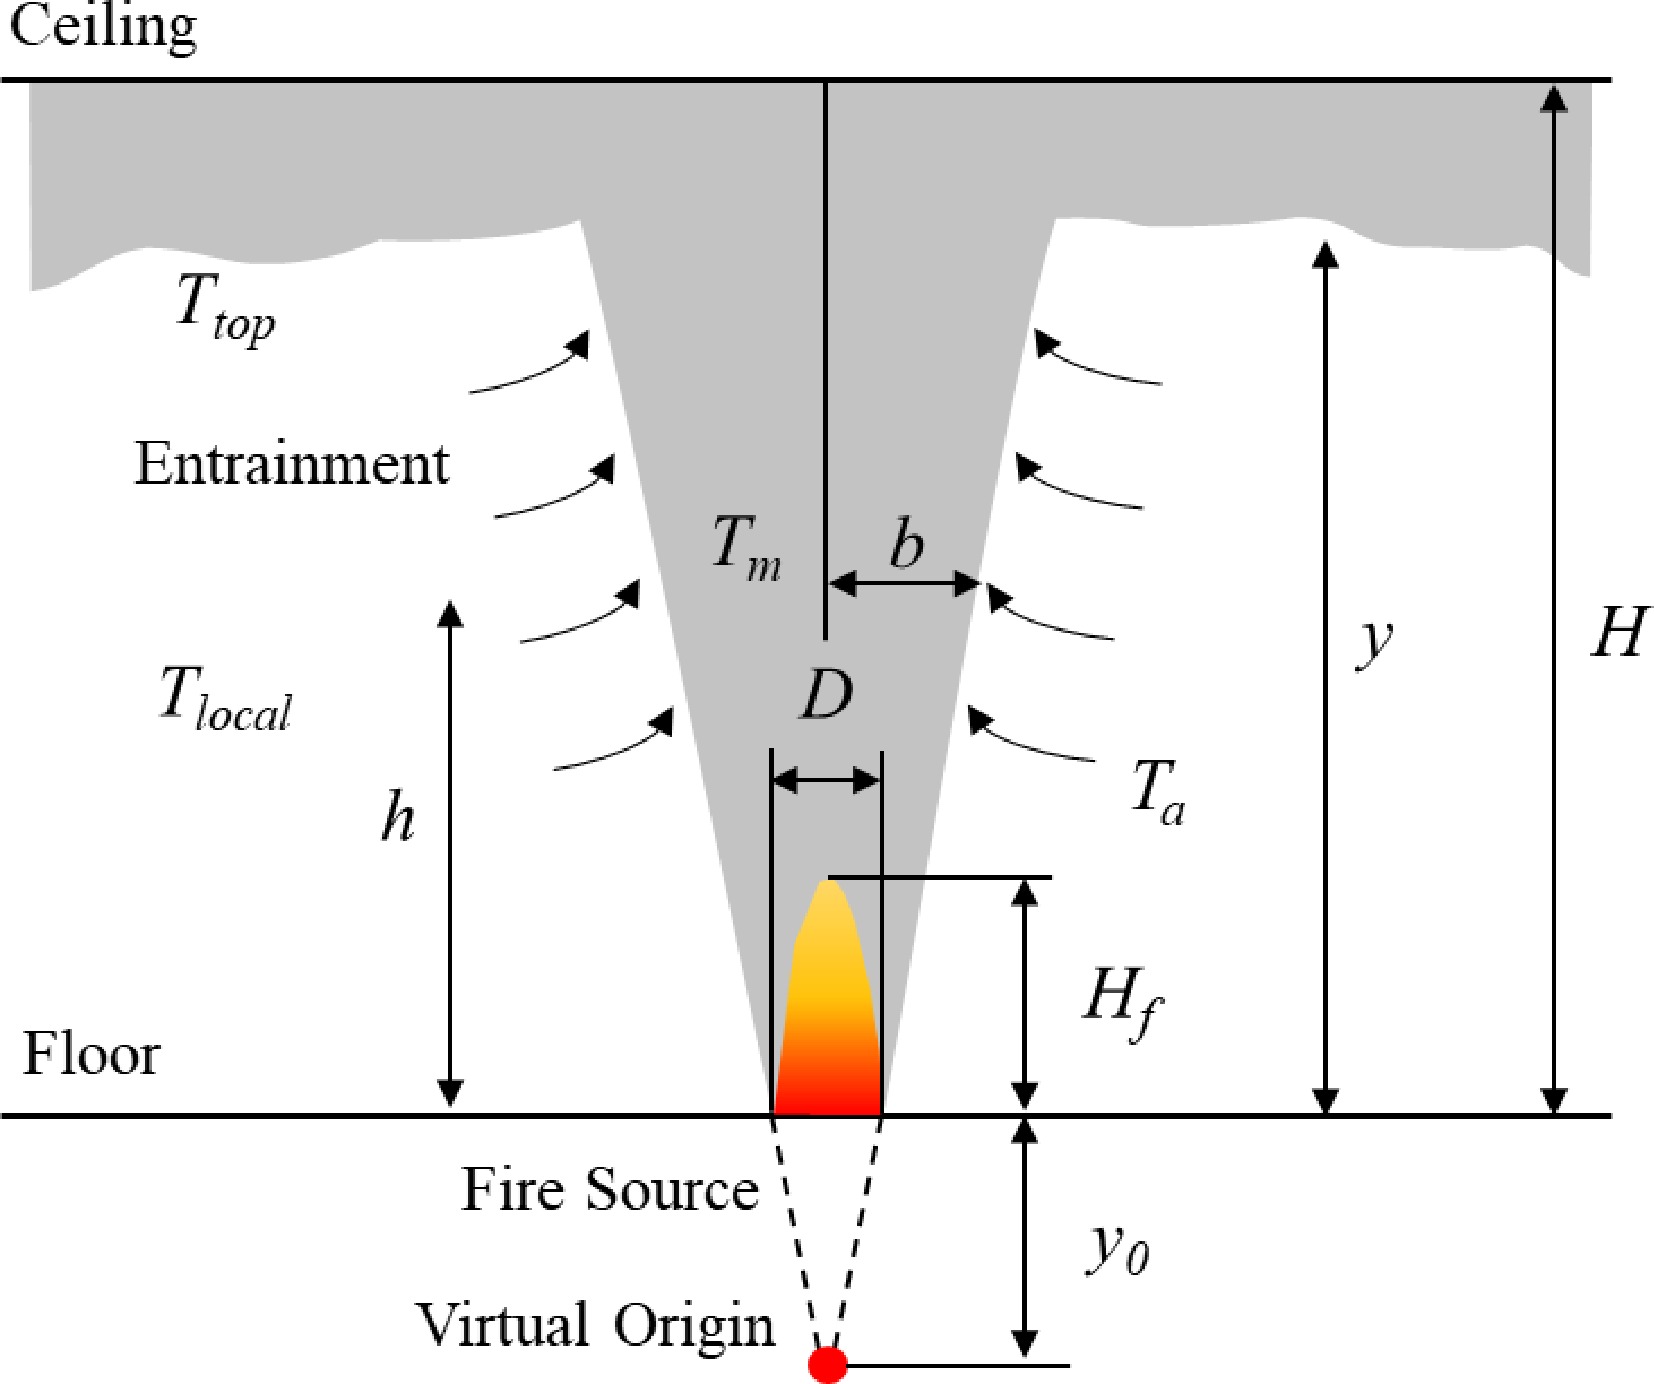
Figure 1.
Illustration of virtual origin of fire source.
-
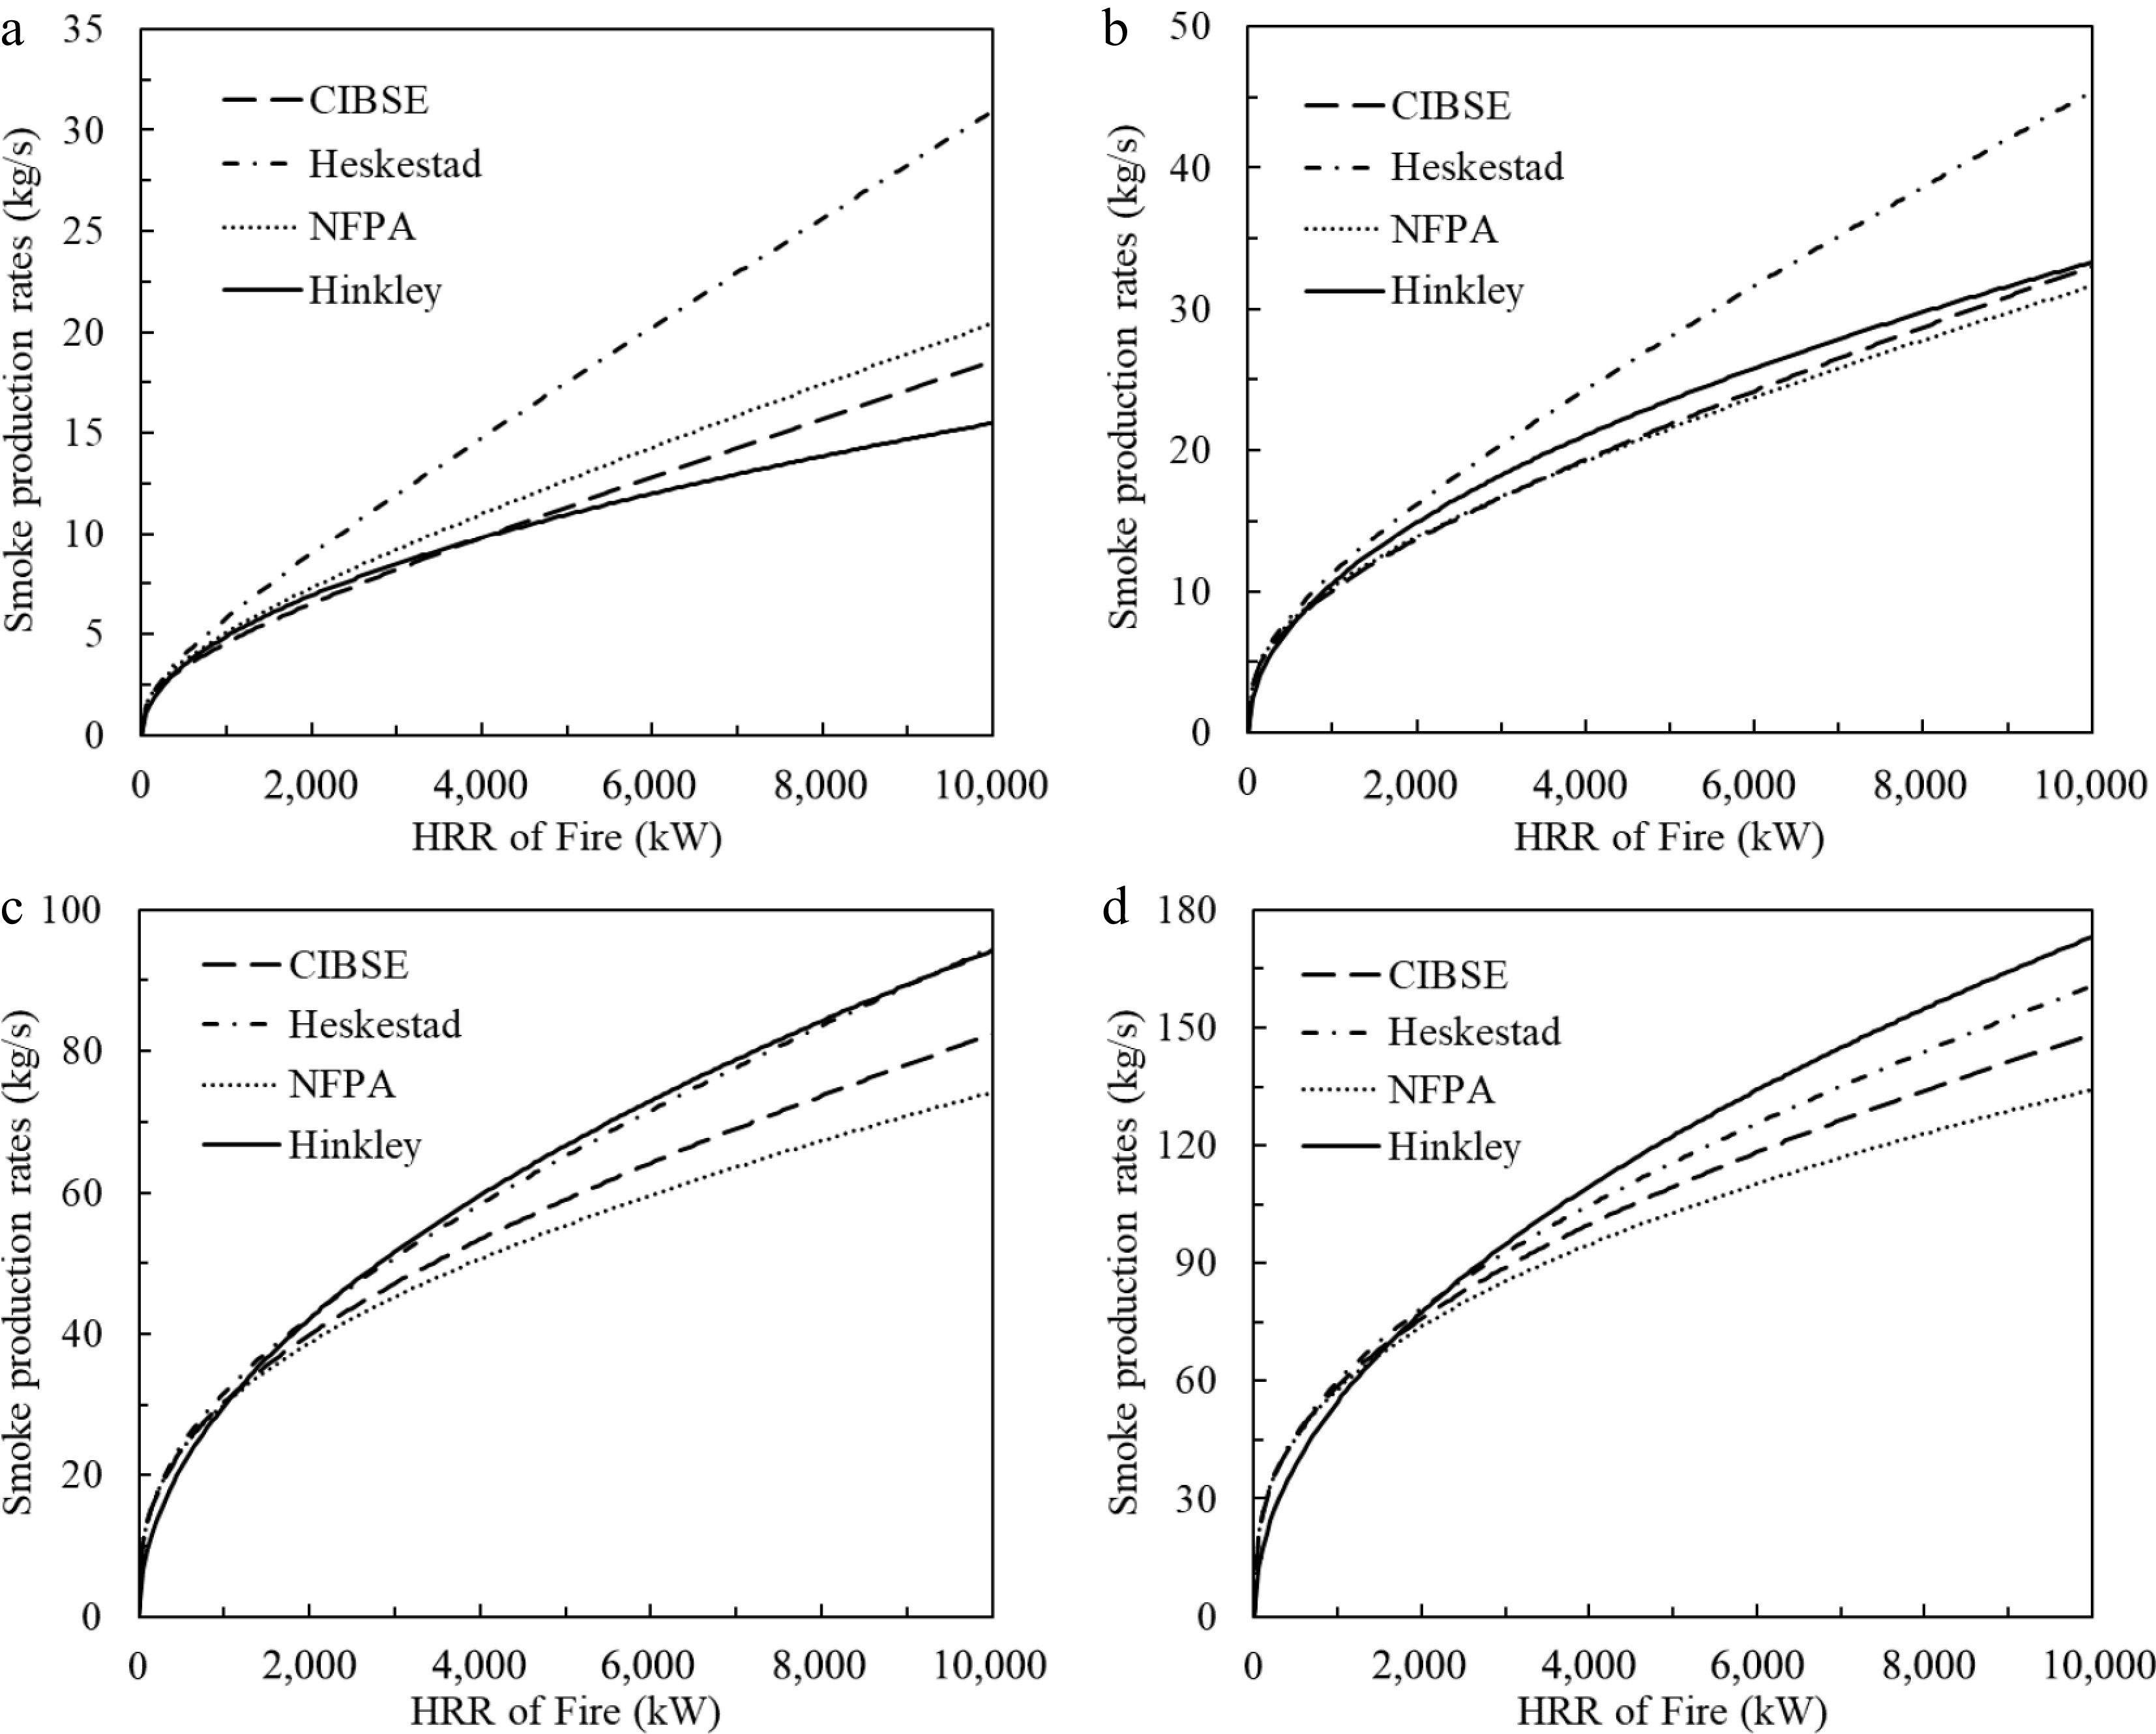
Figure 2.
Comparison of predicted smoke production rates by different models with varied smoke clear height. (a) y = 3 m, (b) y = 5 m, (c) y = 10 m, (d) y = 15 m.
-
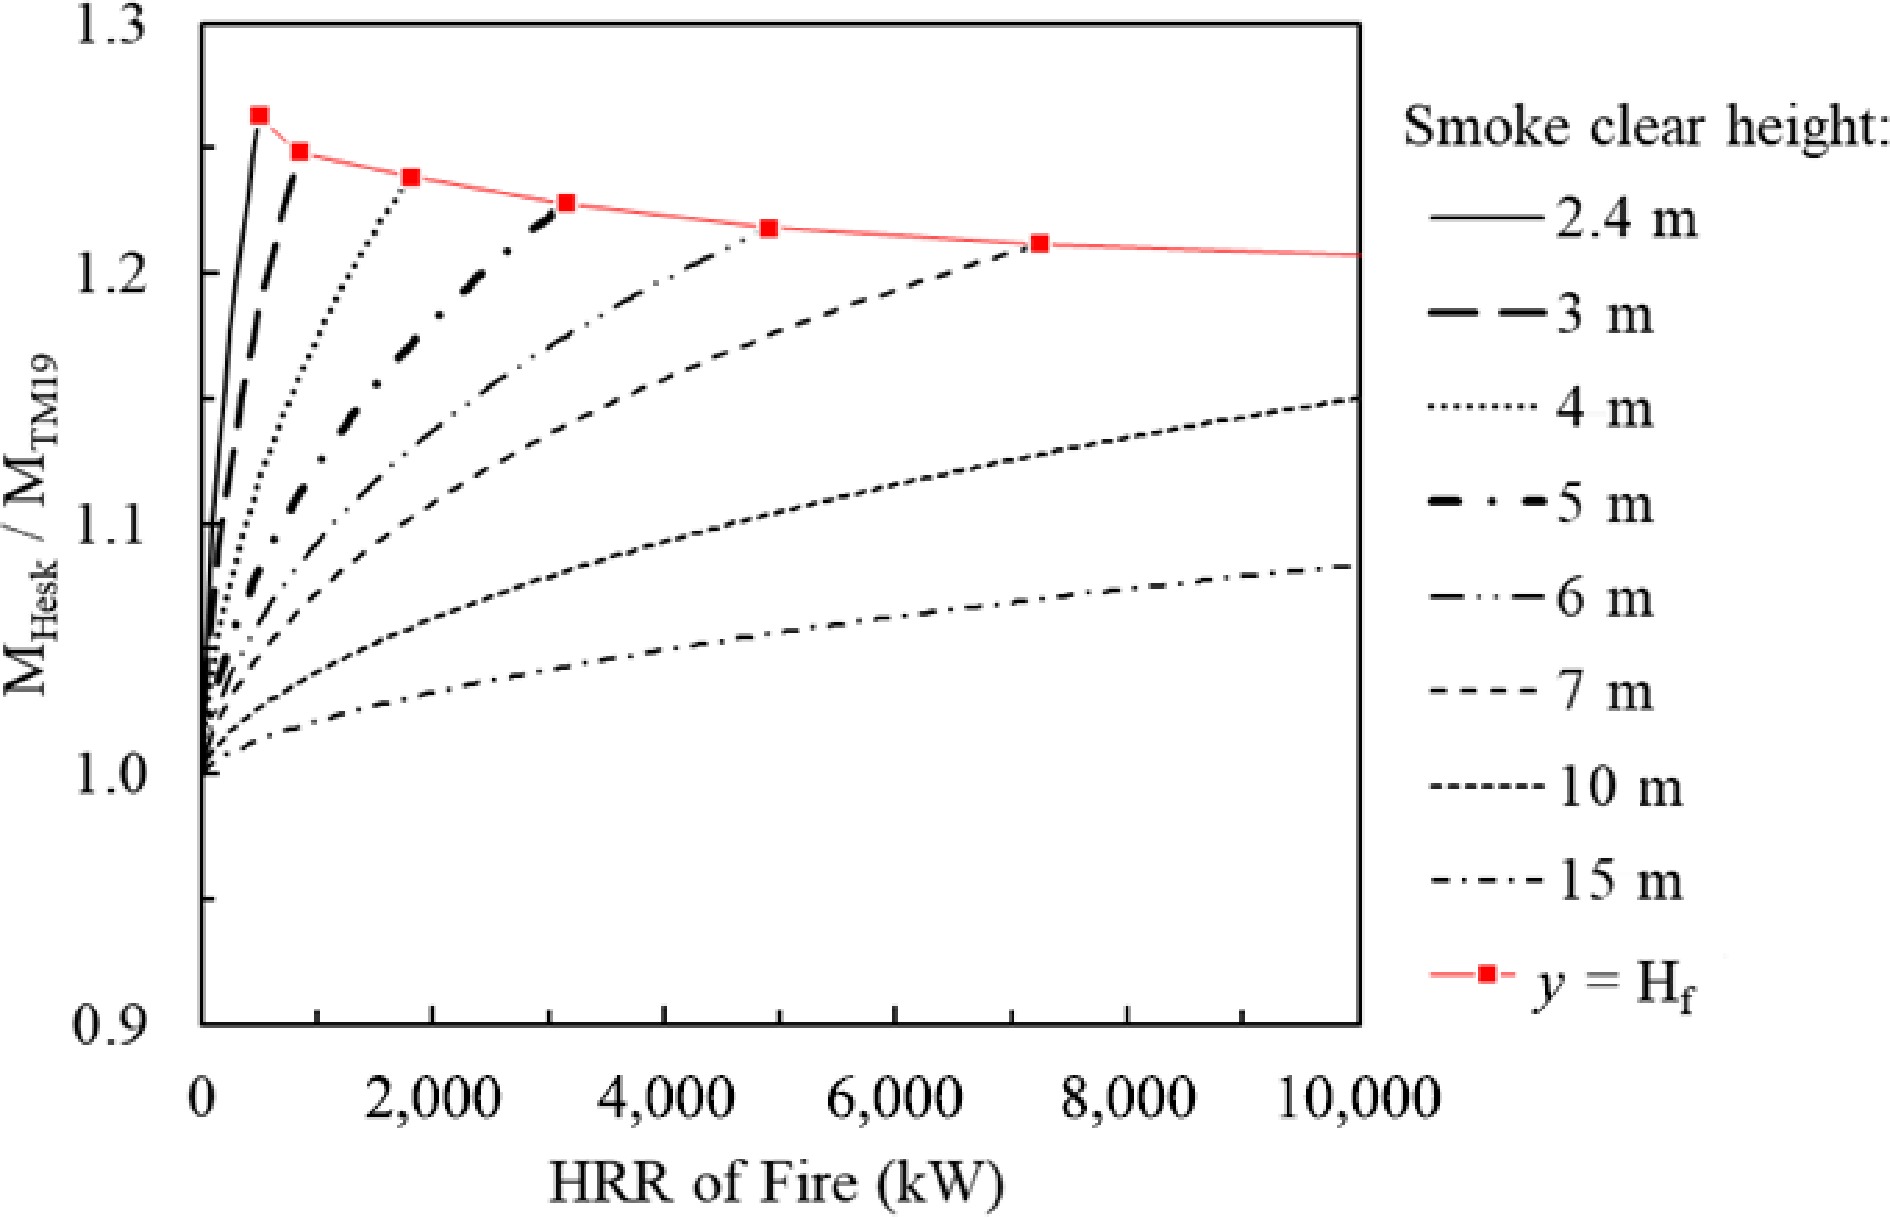
Figure 3.
Comparison of predicted smoke production rates from CIBSE and the Heskestad model.
-
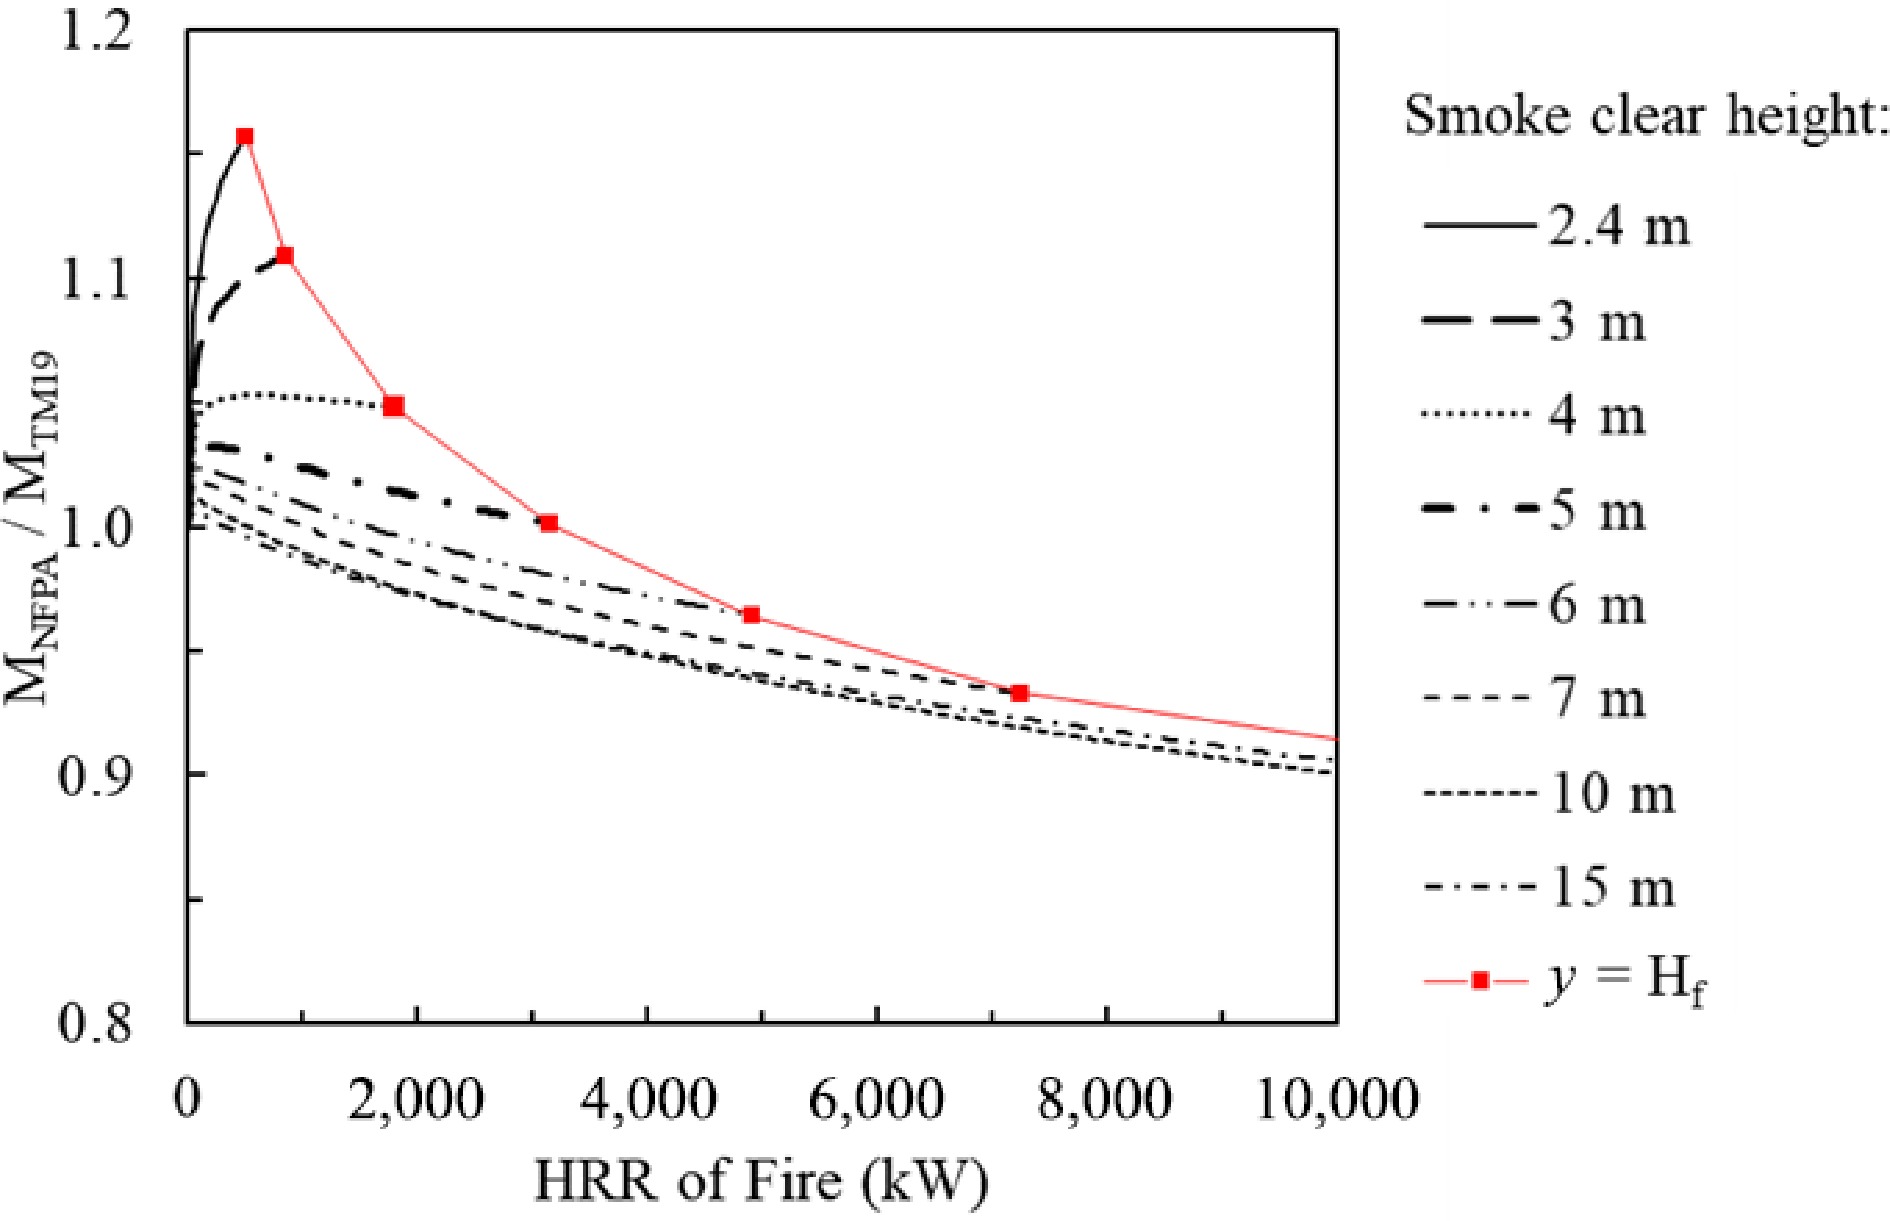
Figure 4.
Comparison of predicted smoke production rates from the CIBSE model and the NFPA model.
-
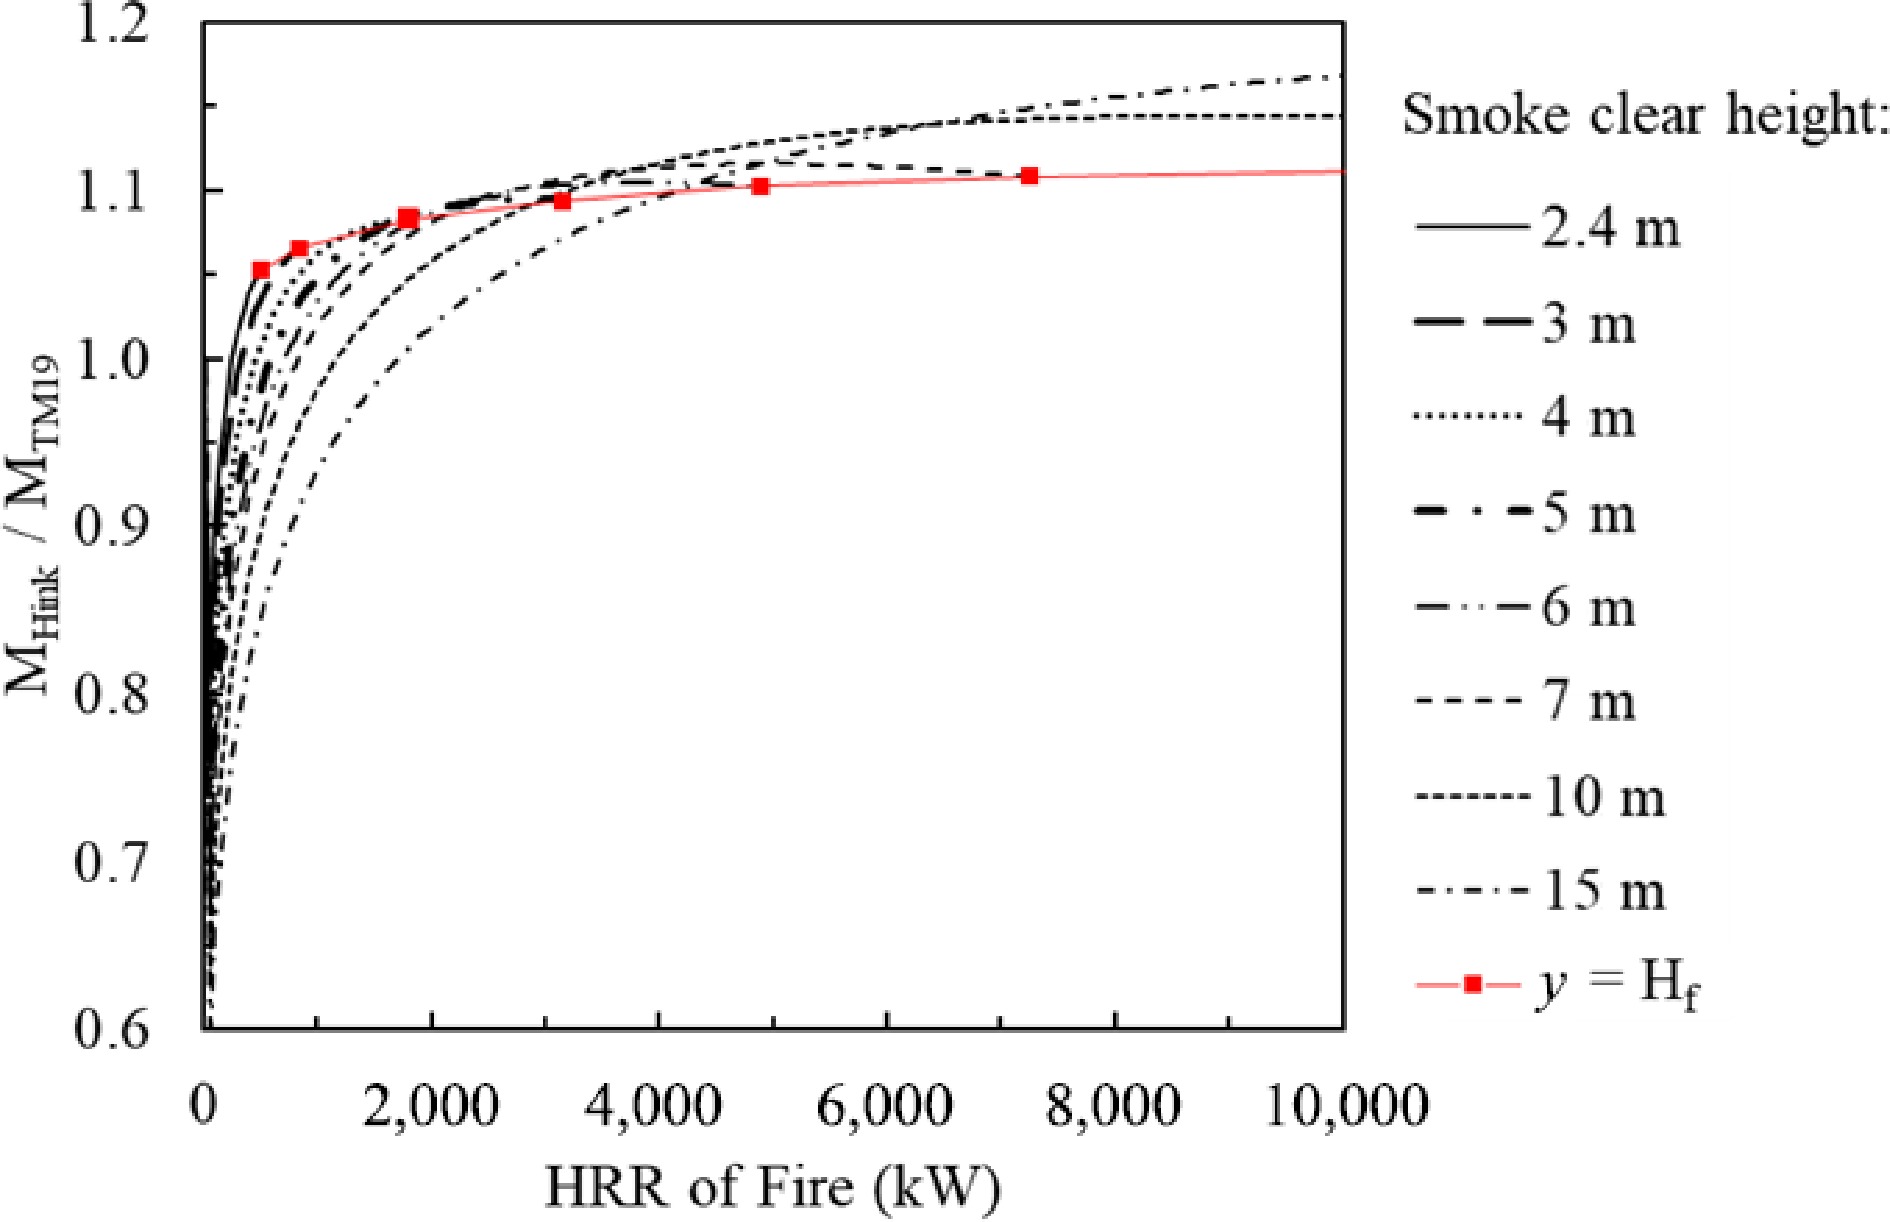
Figure 5.
Comparison of predicted smoke production rates from CIBSE model and Hinkley's model.
-
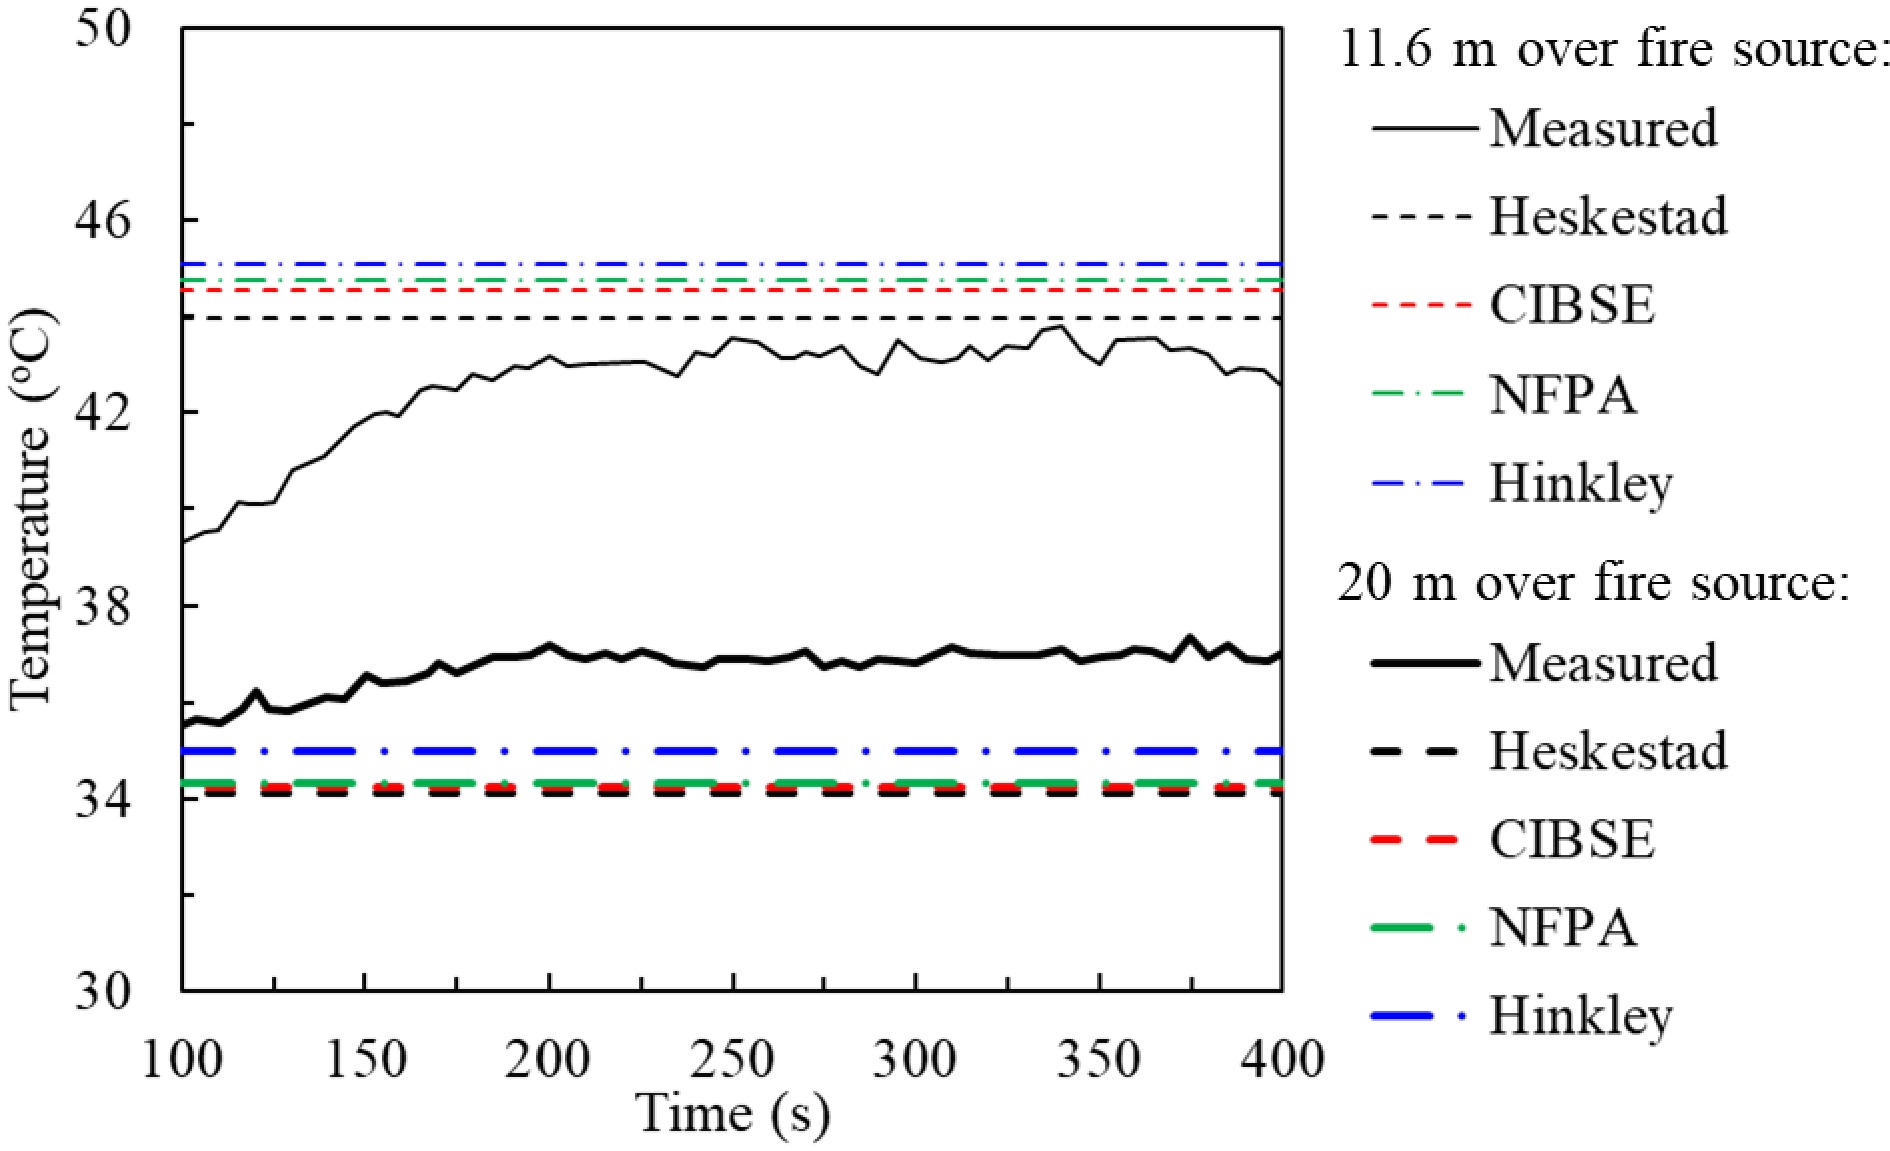
Figure 6.
Measured and predicted smoke temperature at 11.6 and 20 m above fire source. Experimental conditions: one A0-tray plus one A1-tray containing 22.5 l of methylated spirit; Fire HRR: 1.05 MW; atrium height: 35 m.
-
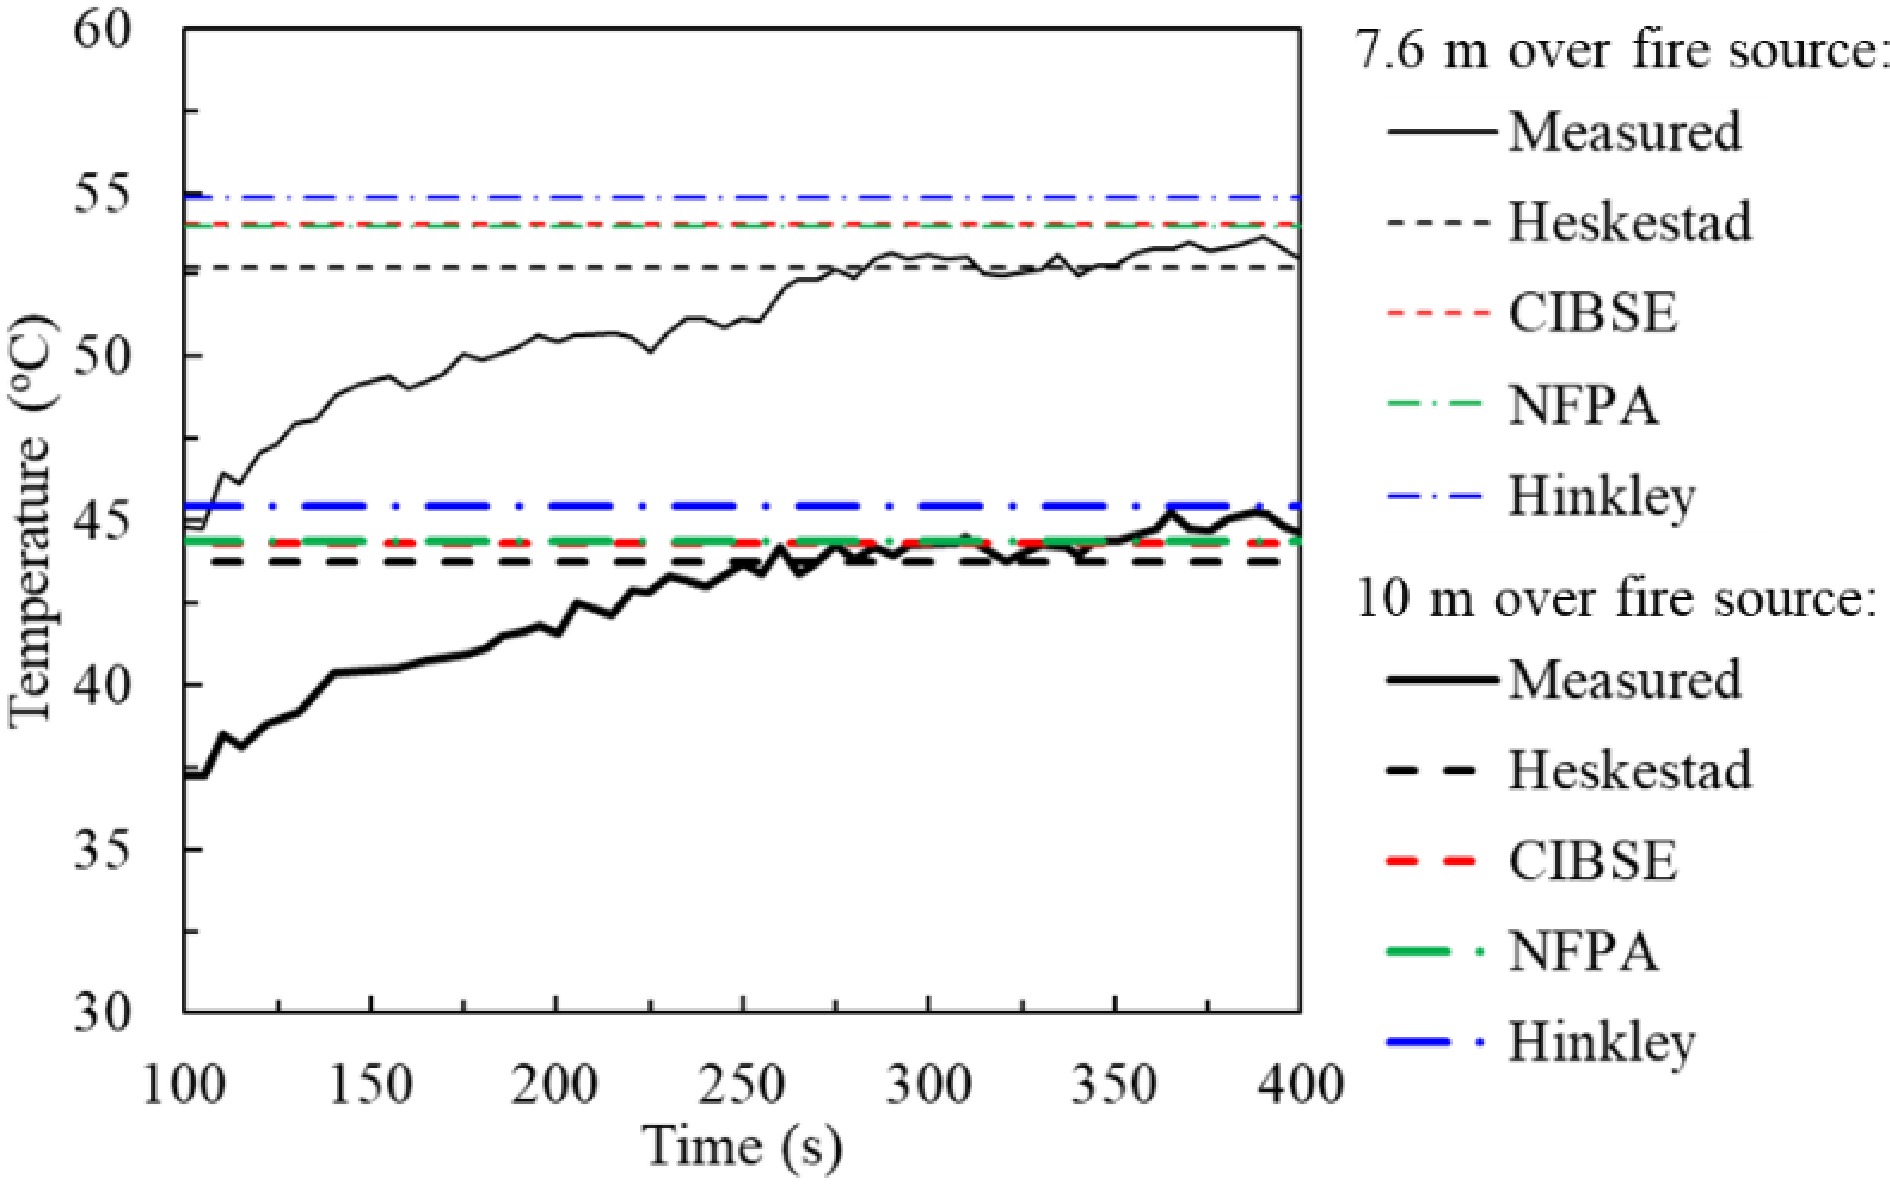
Figure 7.
Measured and predicted smoke temperature at 7.6 and 10 m above fire source. Experimental conditions: one A0-tray containing 15 l of methylated spirit; Fire size (HRR): 0.7 MW; height of passenger transport interchange centre: 12 m.
-
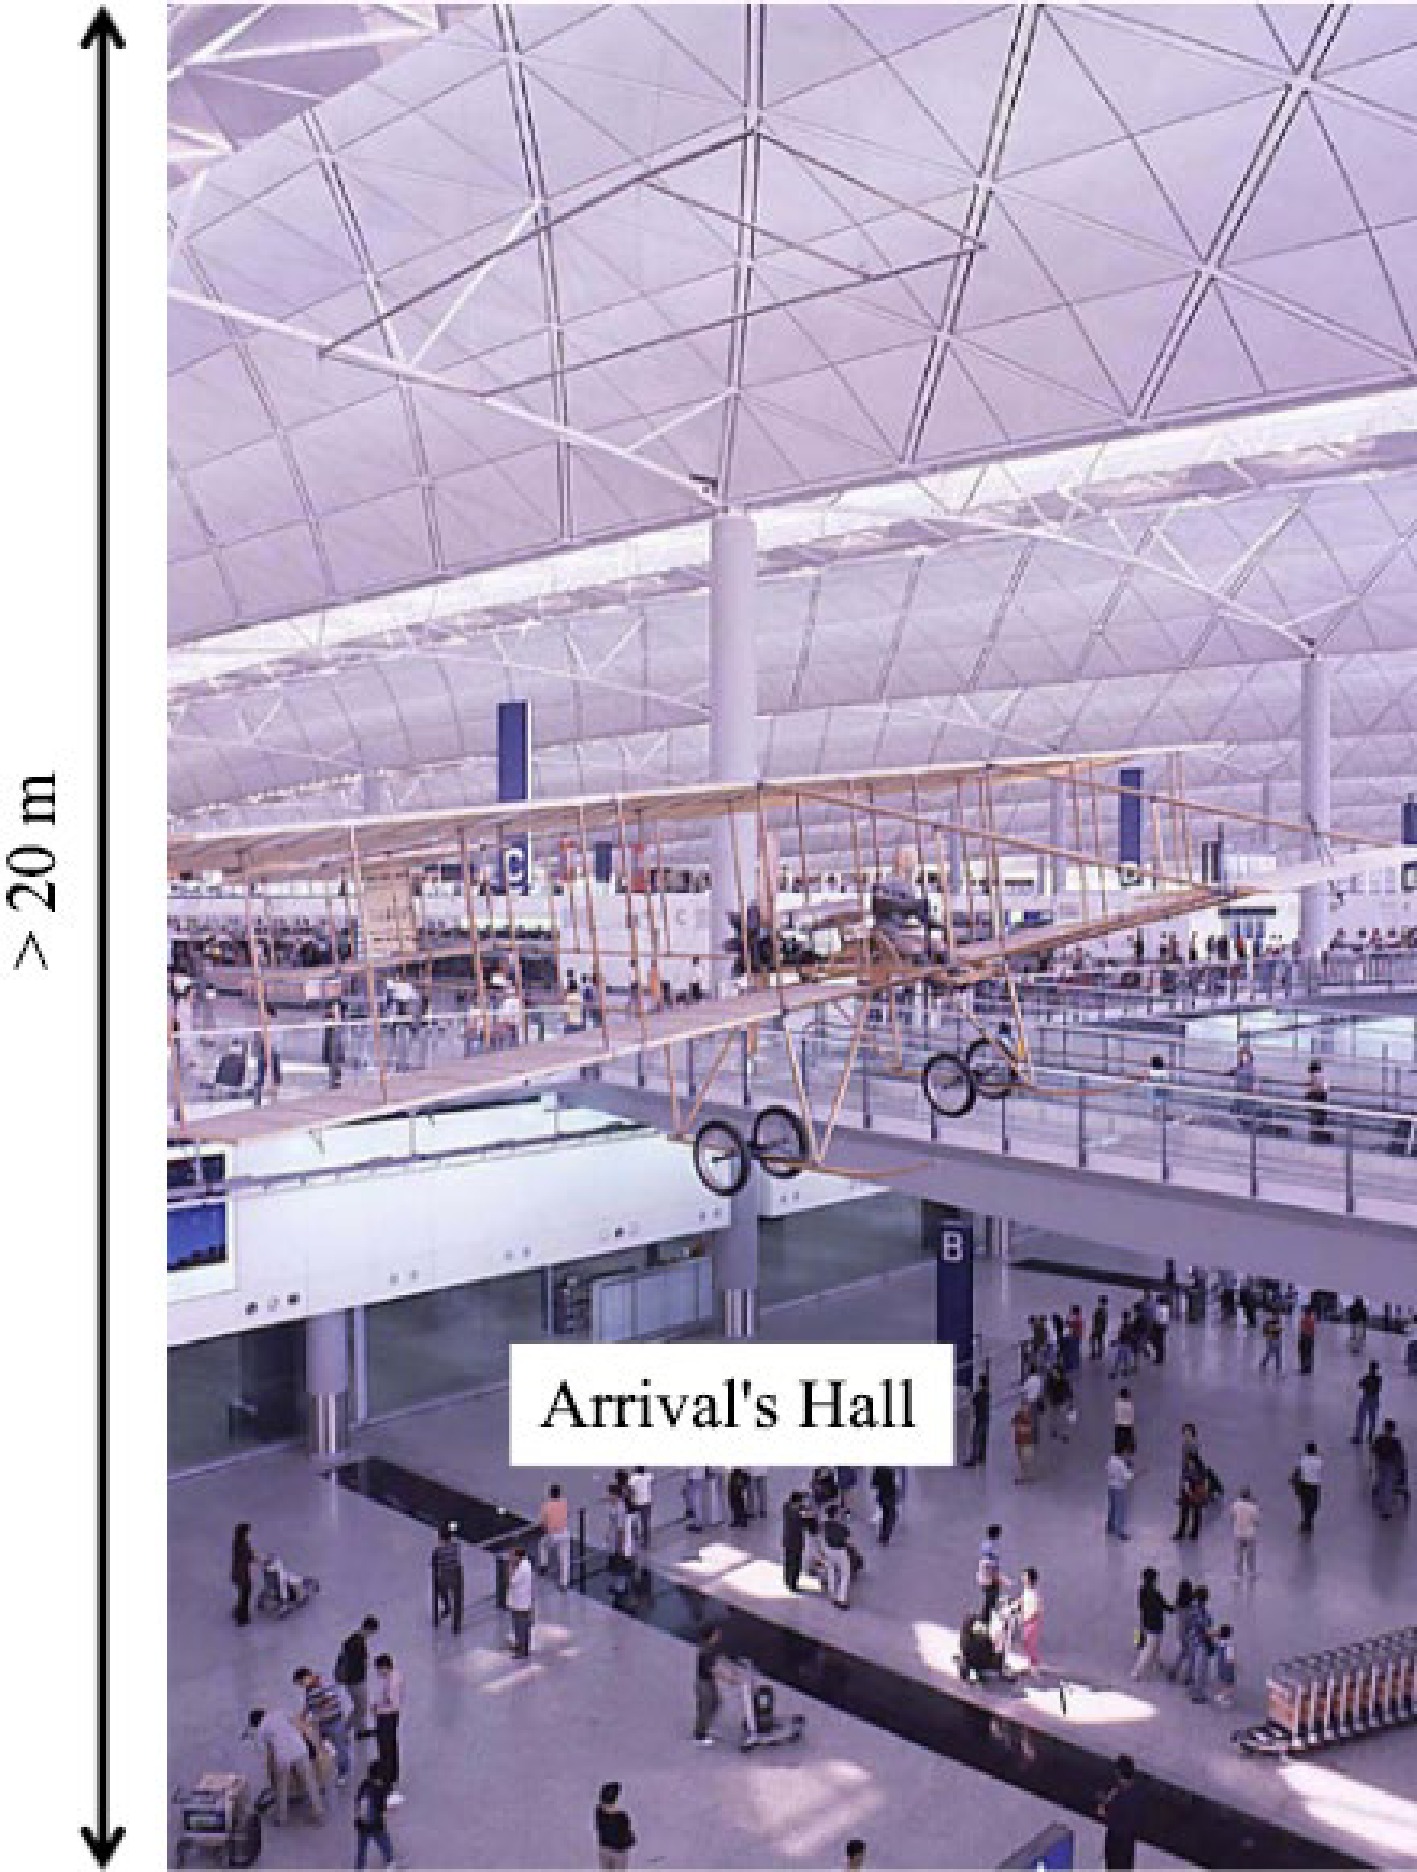
Figure 8.
Arrival's hall of Hong Kong International Airport terminal 1.
-
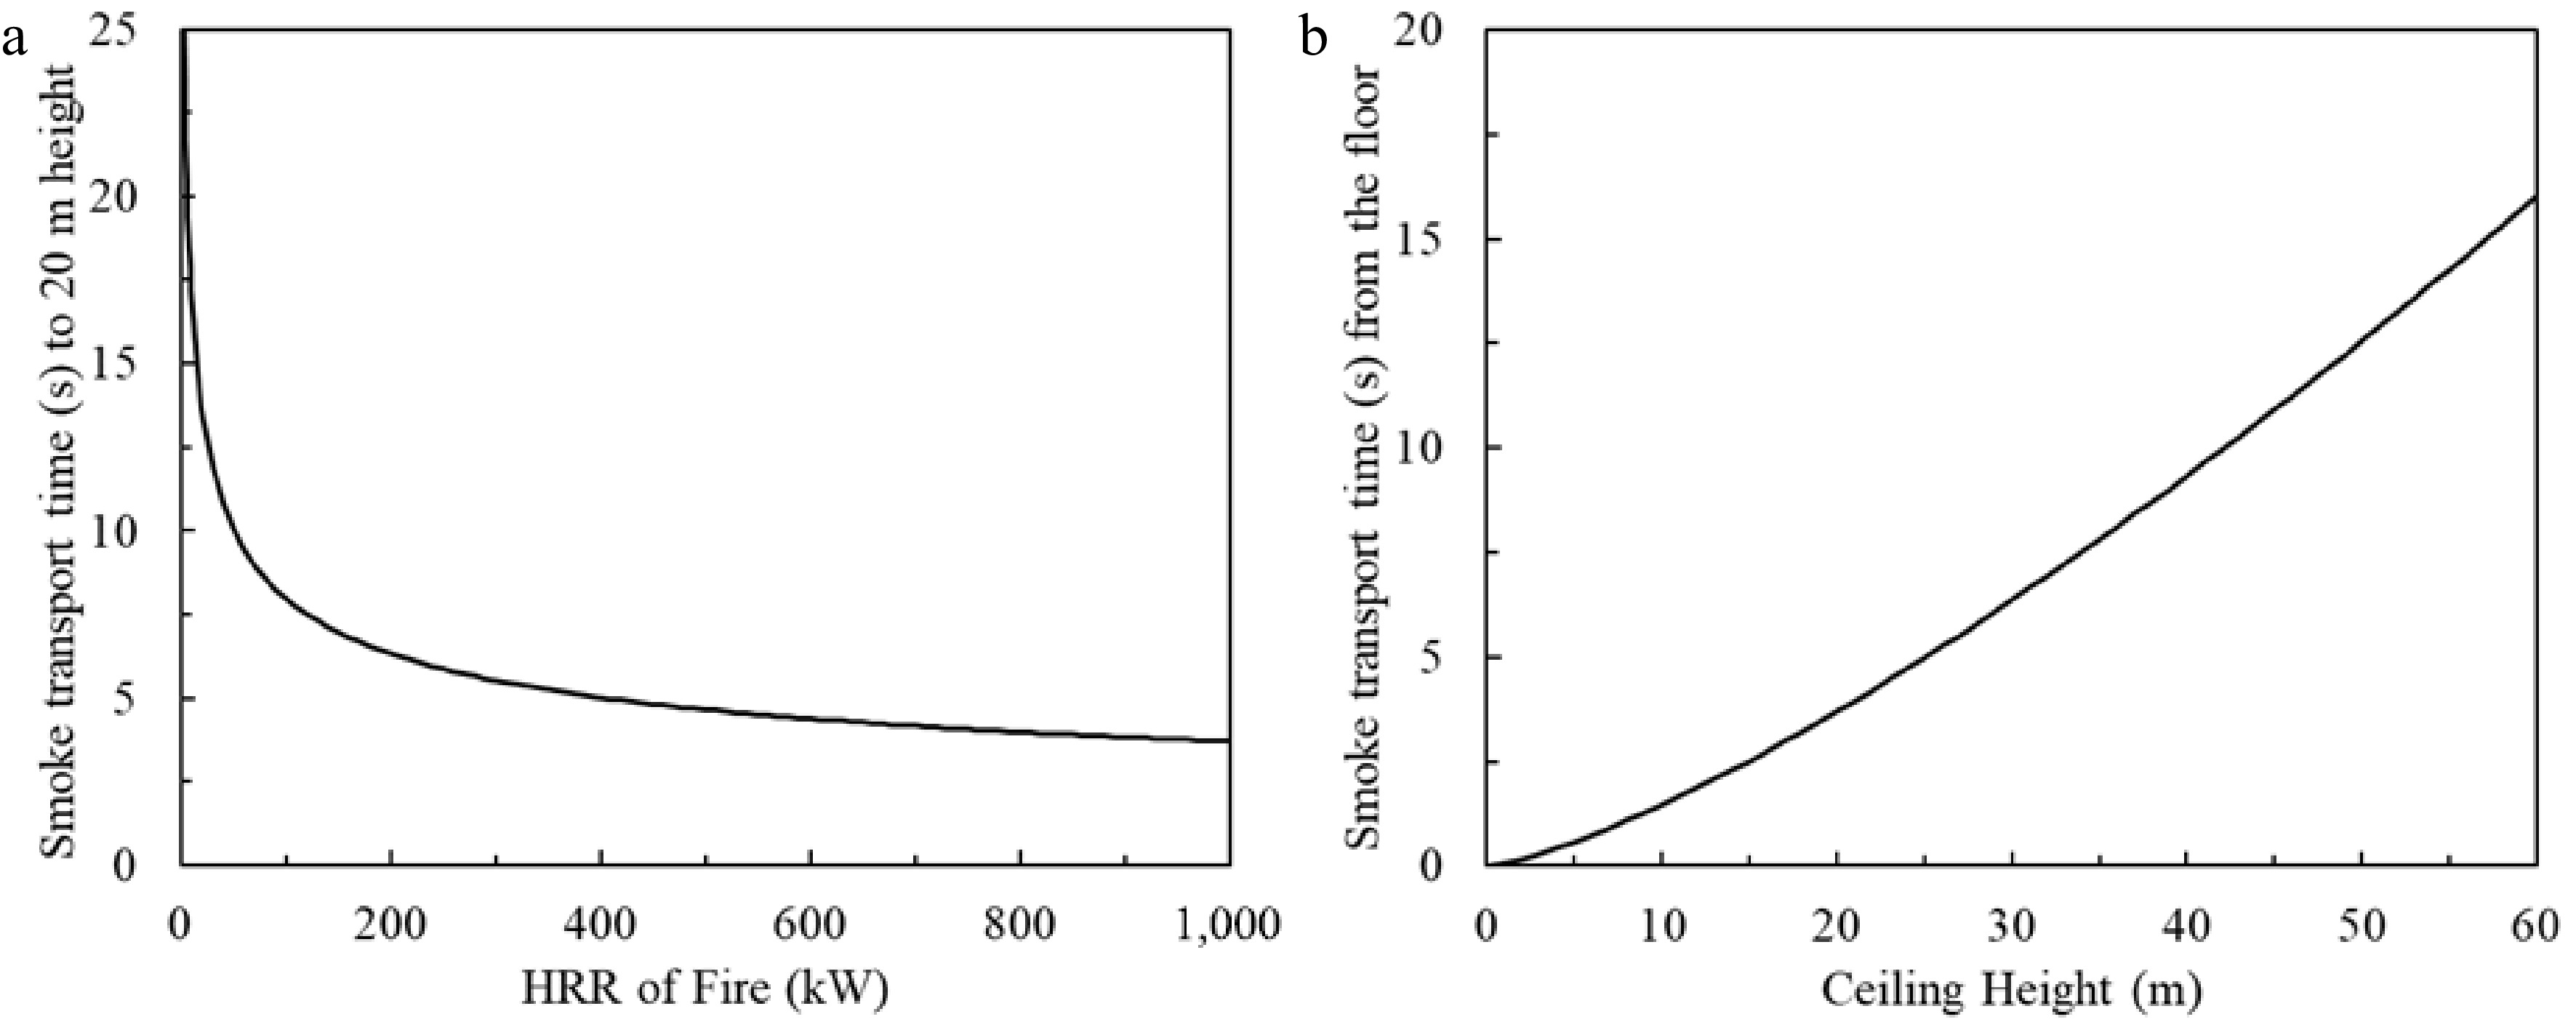
Figure 9.
Smoke transport time from fire source to ceiling. (a) Fixed 20 m ceiling height, smoke transport time varies with HRR of fire. (b) Fixed 1,000 kW fire, smoke transport time varies with height.
-
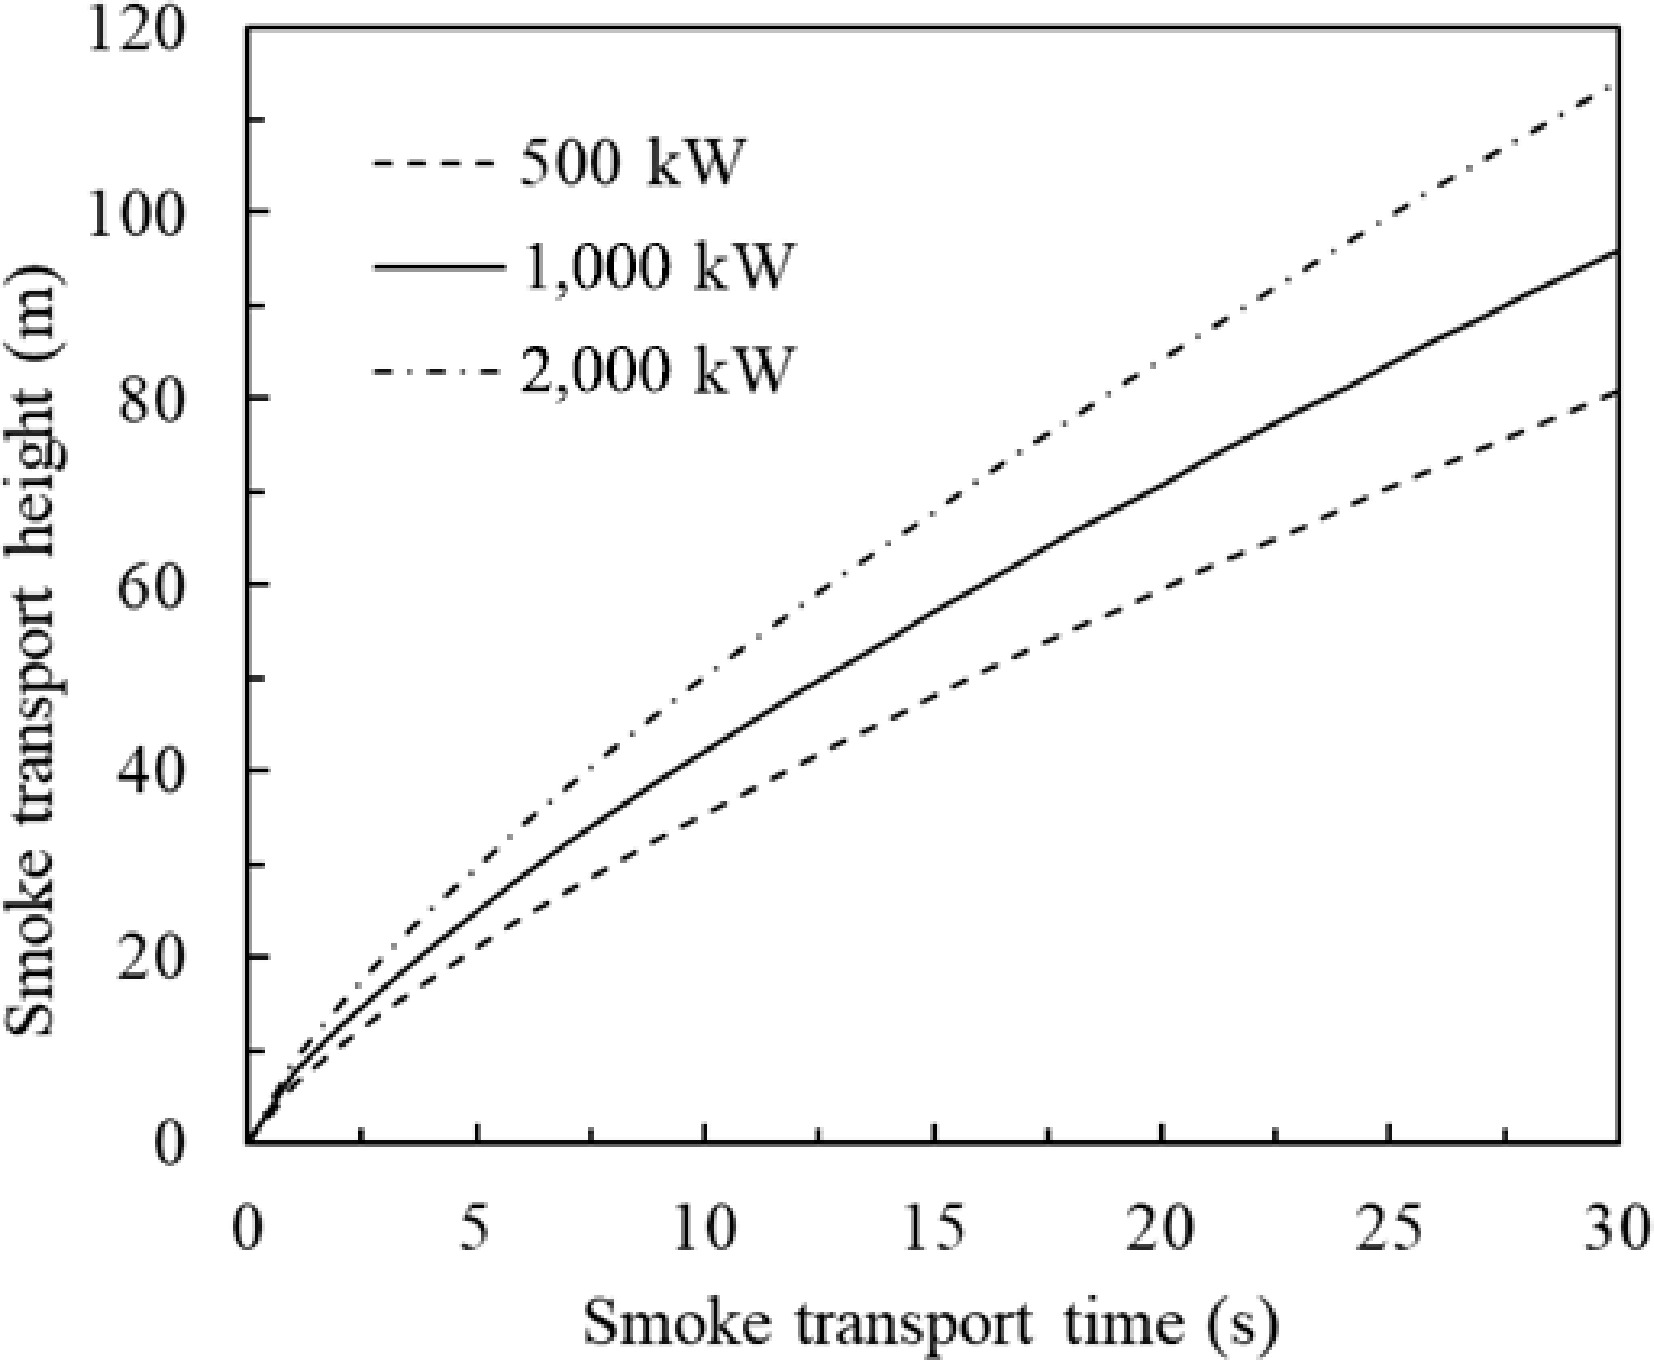
Figure 10.
Evolvement of smoke transport height.
-
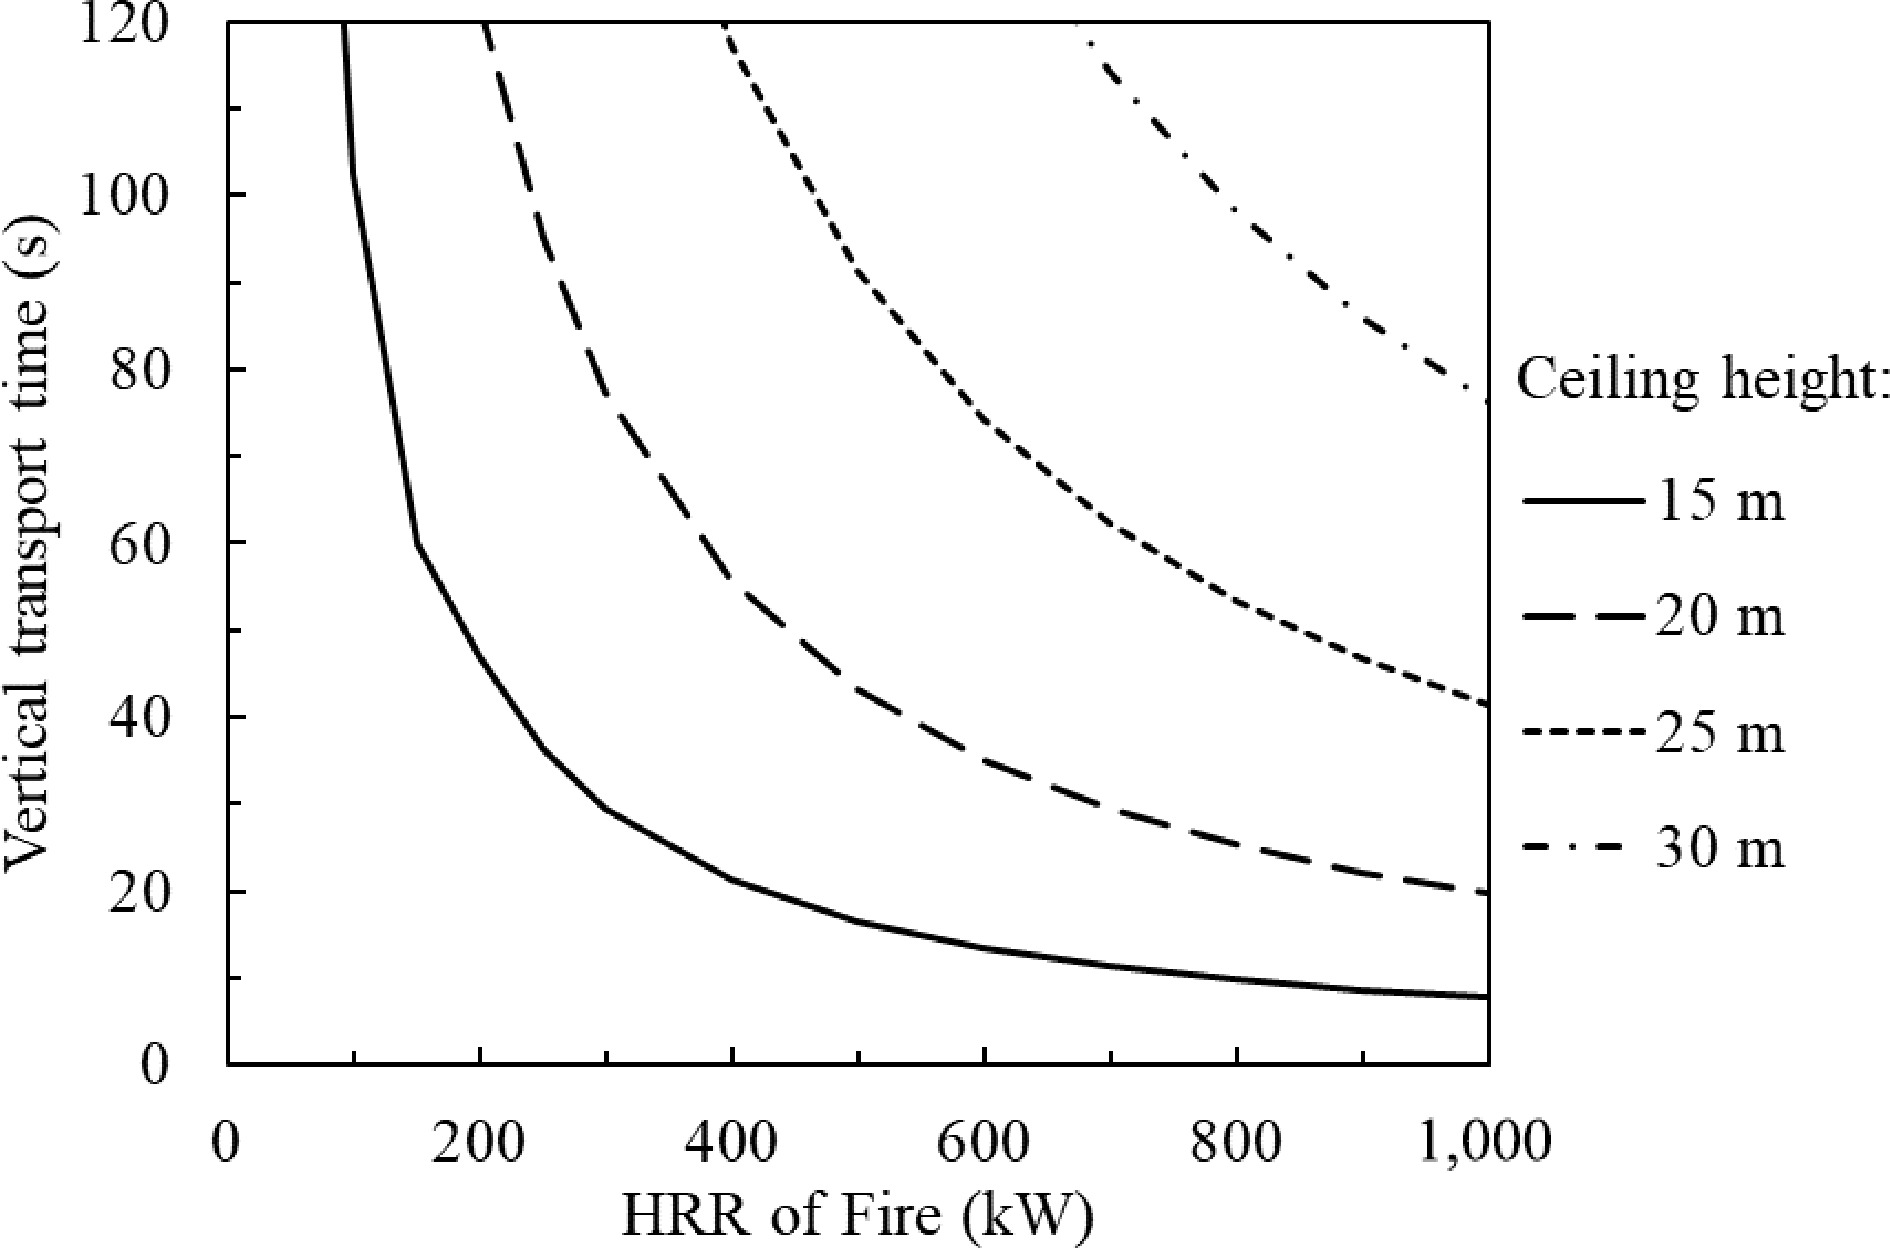
Figure 11.
Time of smoke transportation to the ceiling against HRR of fire, the environmental temperature varies linearly from 24 to 55 °C along the height.
-
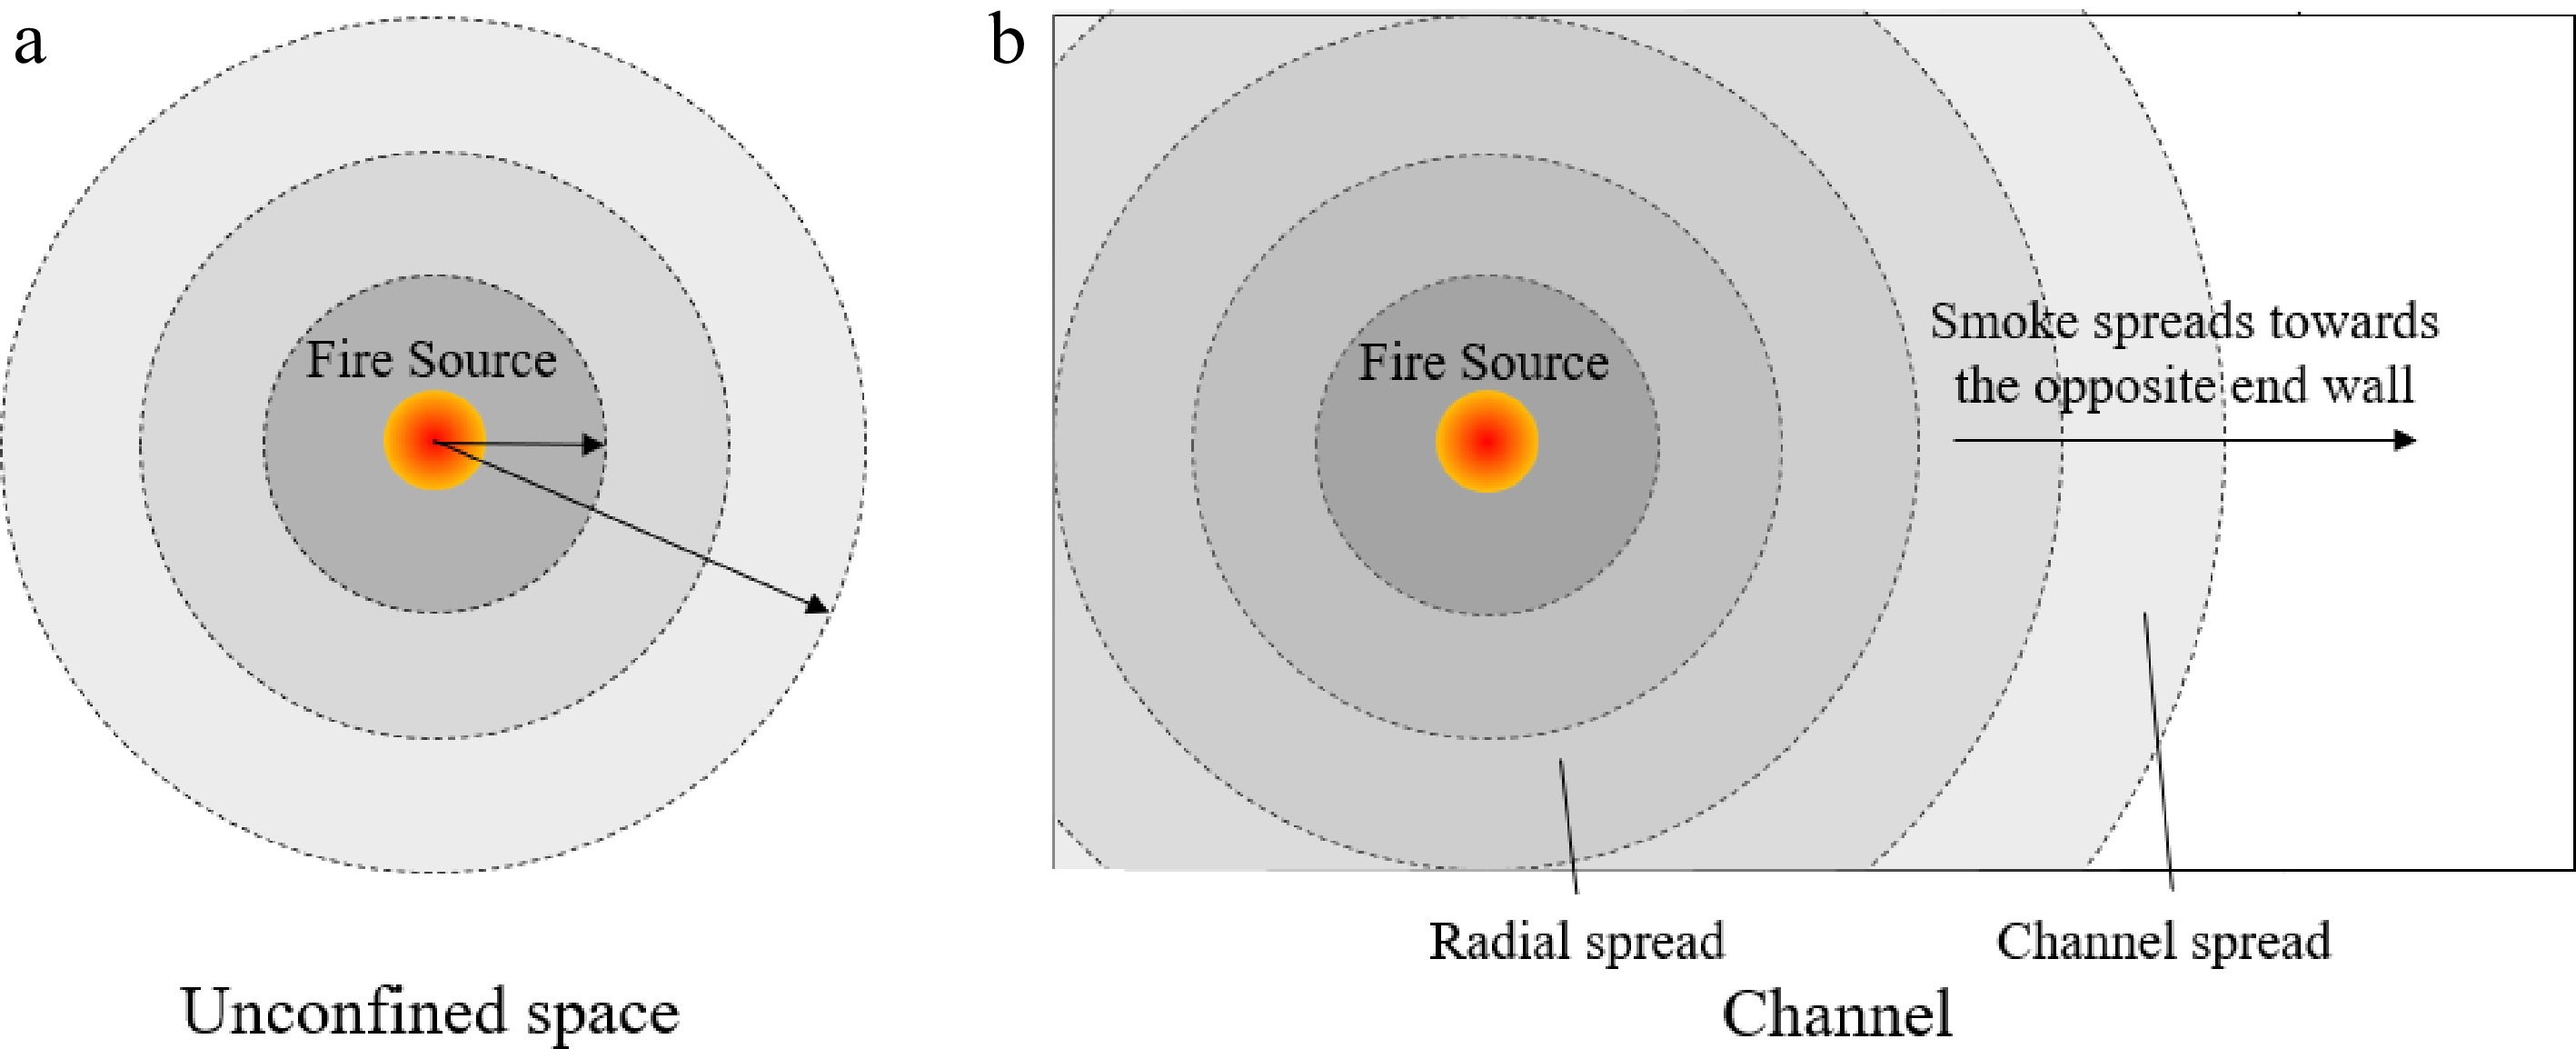
Figure 12.
(a) Illustration of smoke spreads radially under an unconfined and smooth ceiling.(b) Smoke spread pattern as fire starts at a distance from the end wall.
-
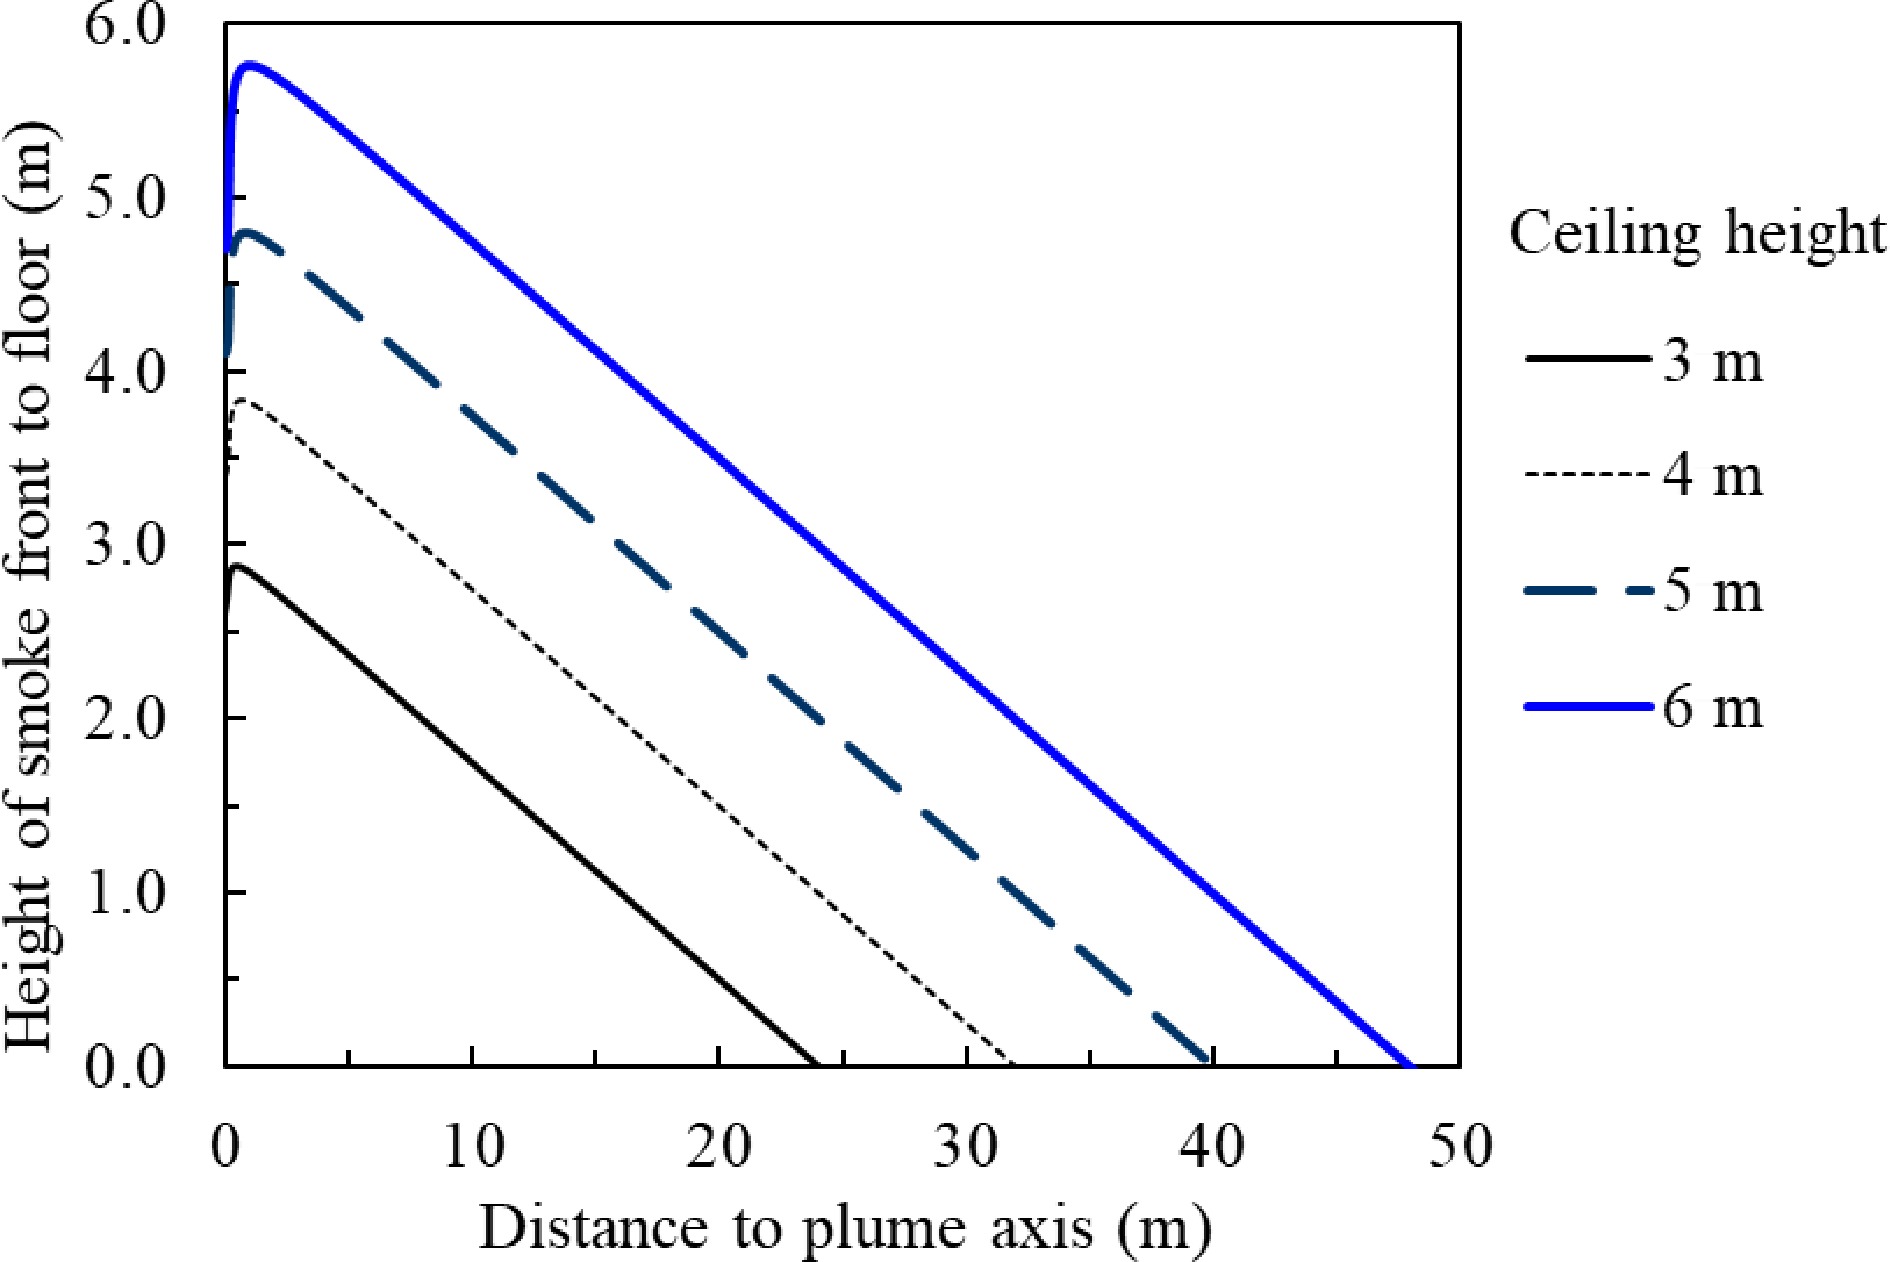
Figure 13.
Smoke clear height vs distance to the plume axis under different slab height for unconfined and smooth slab without smoke extraction.
-
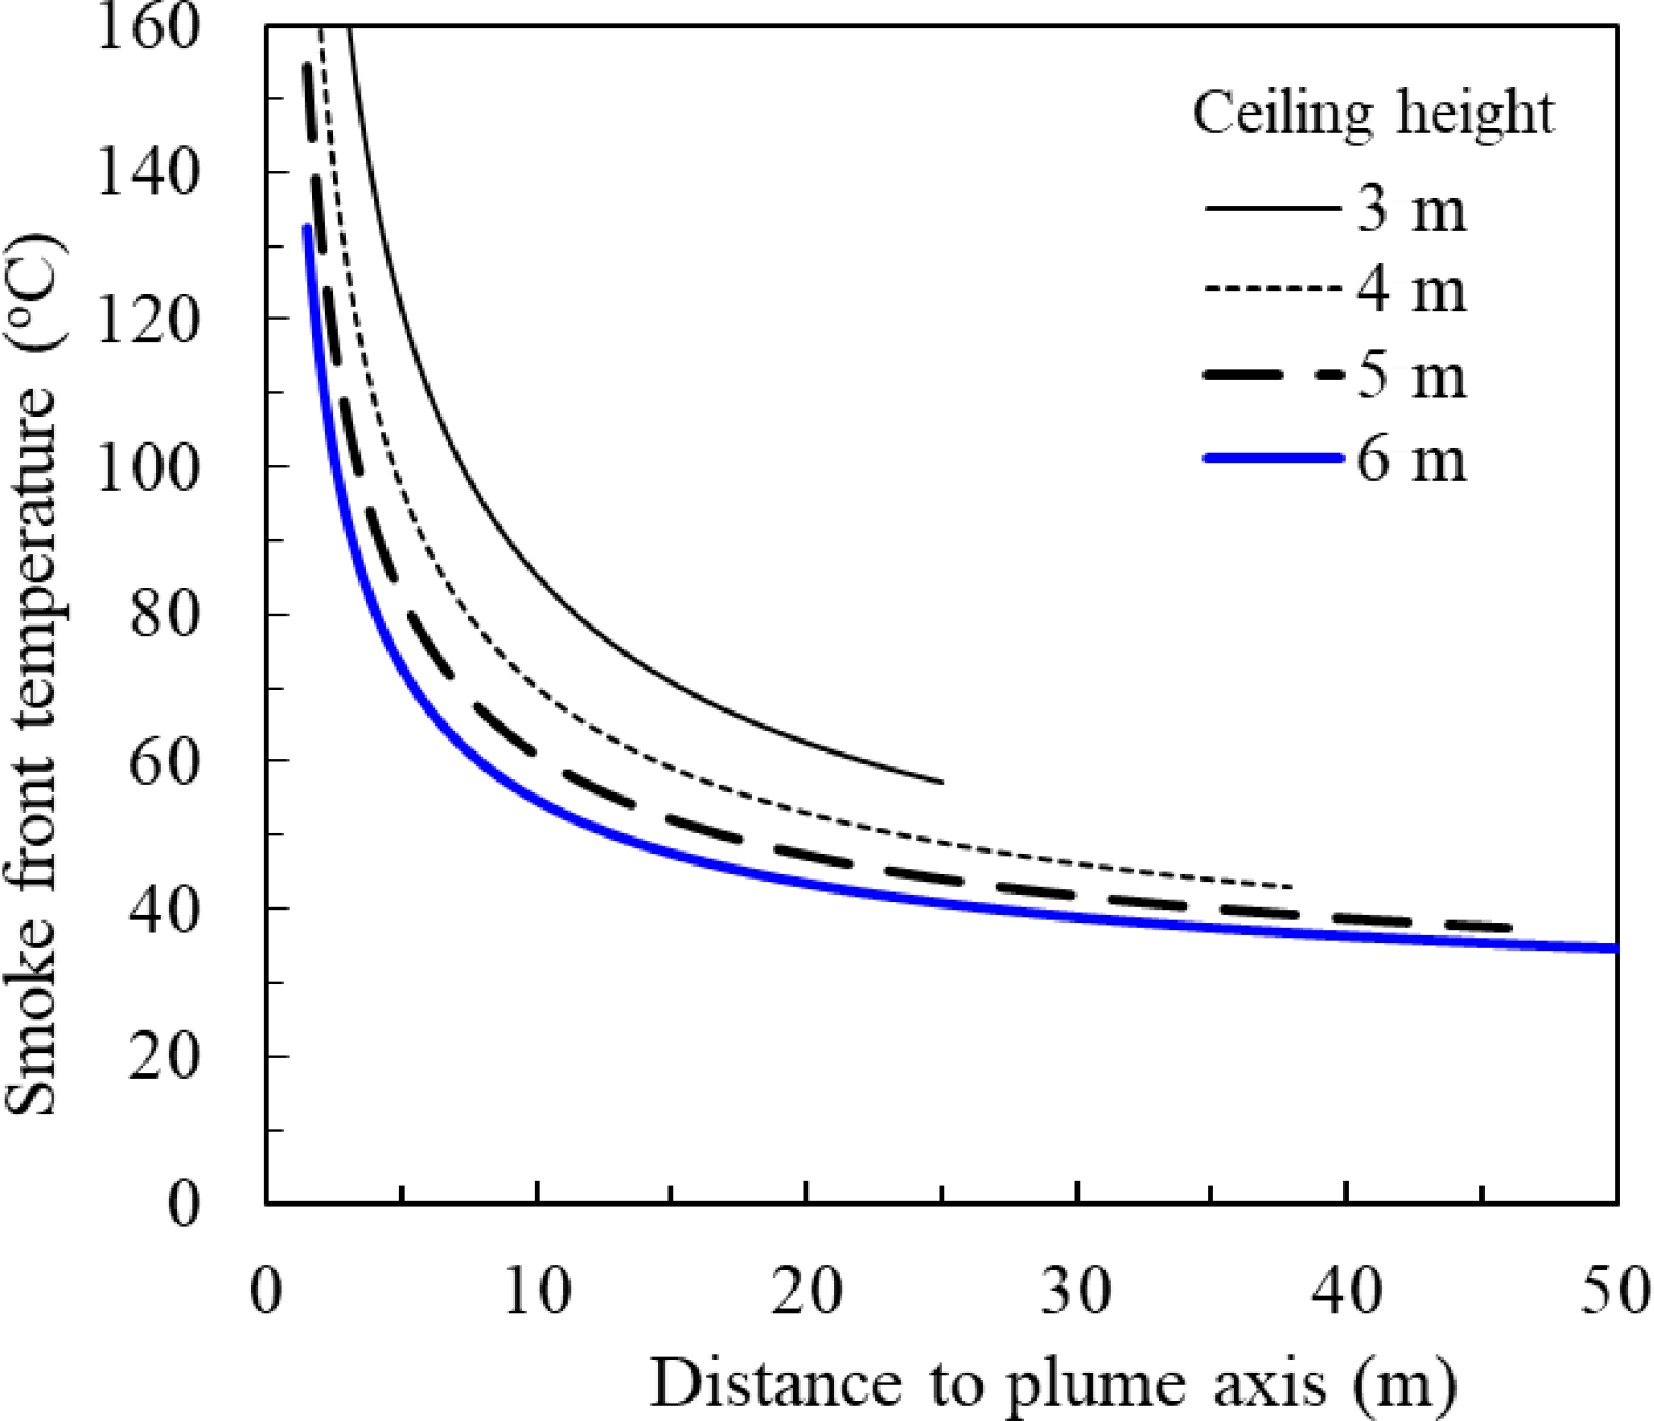
Figure 14.
Smoke temperature vs distance to the plume axis under different ceiling height for unconfined ceiling and 2 MW steady fire.
-
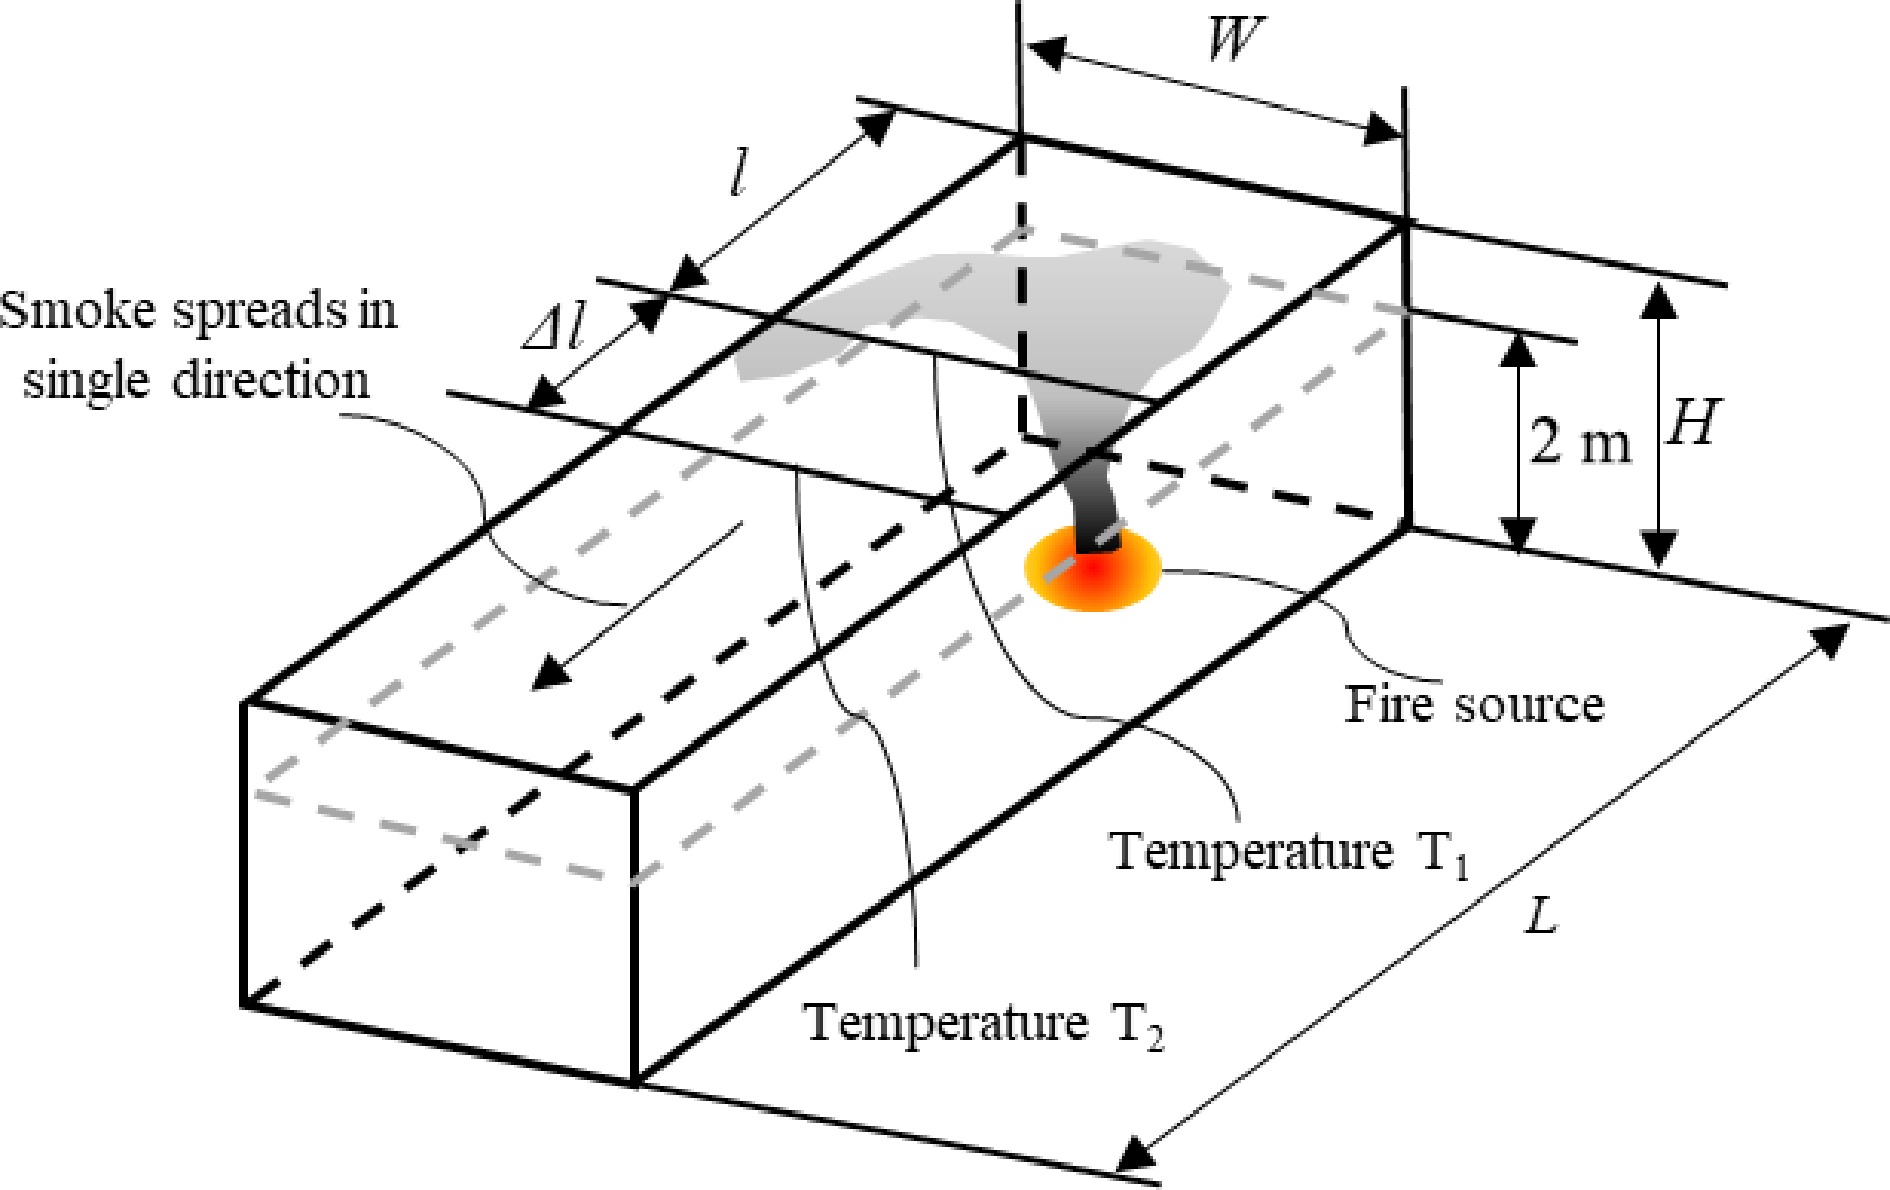
Figure 15.
Illustration of smoke spread under a confined ceiling.
-
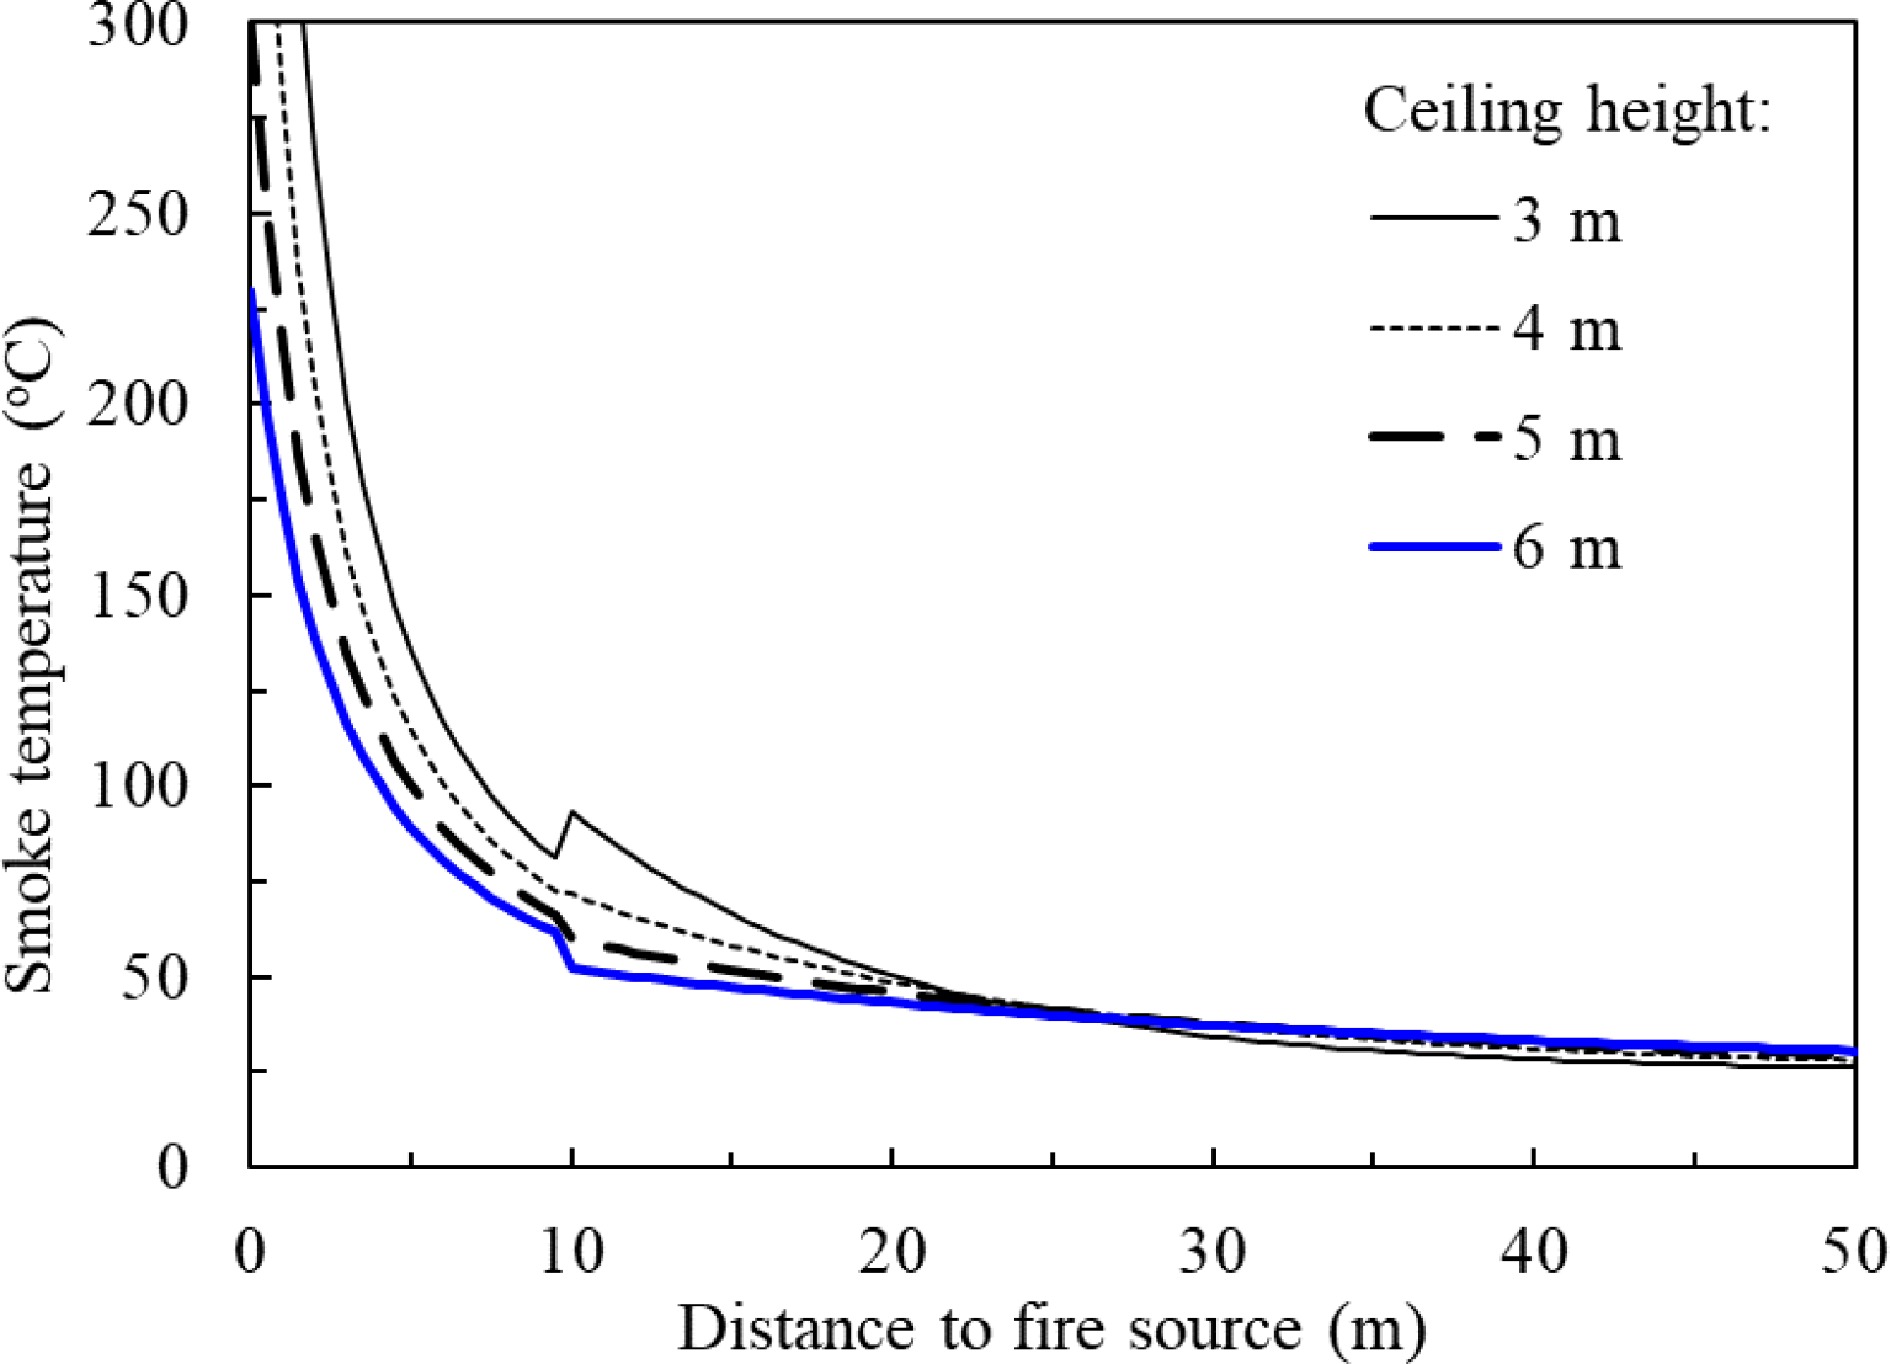
Figure 16.
Predicted smoke temperature vs smoke travel distance at different ceiling height in a 20vm width channel by Delichatsios model.
-
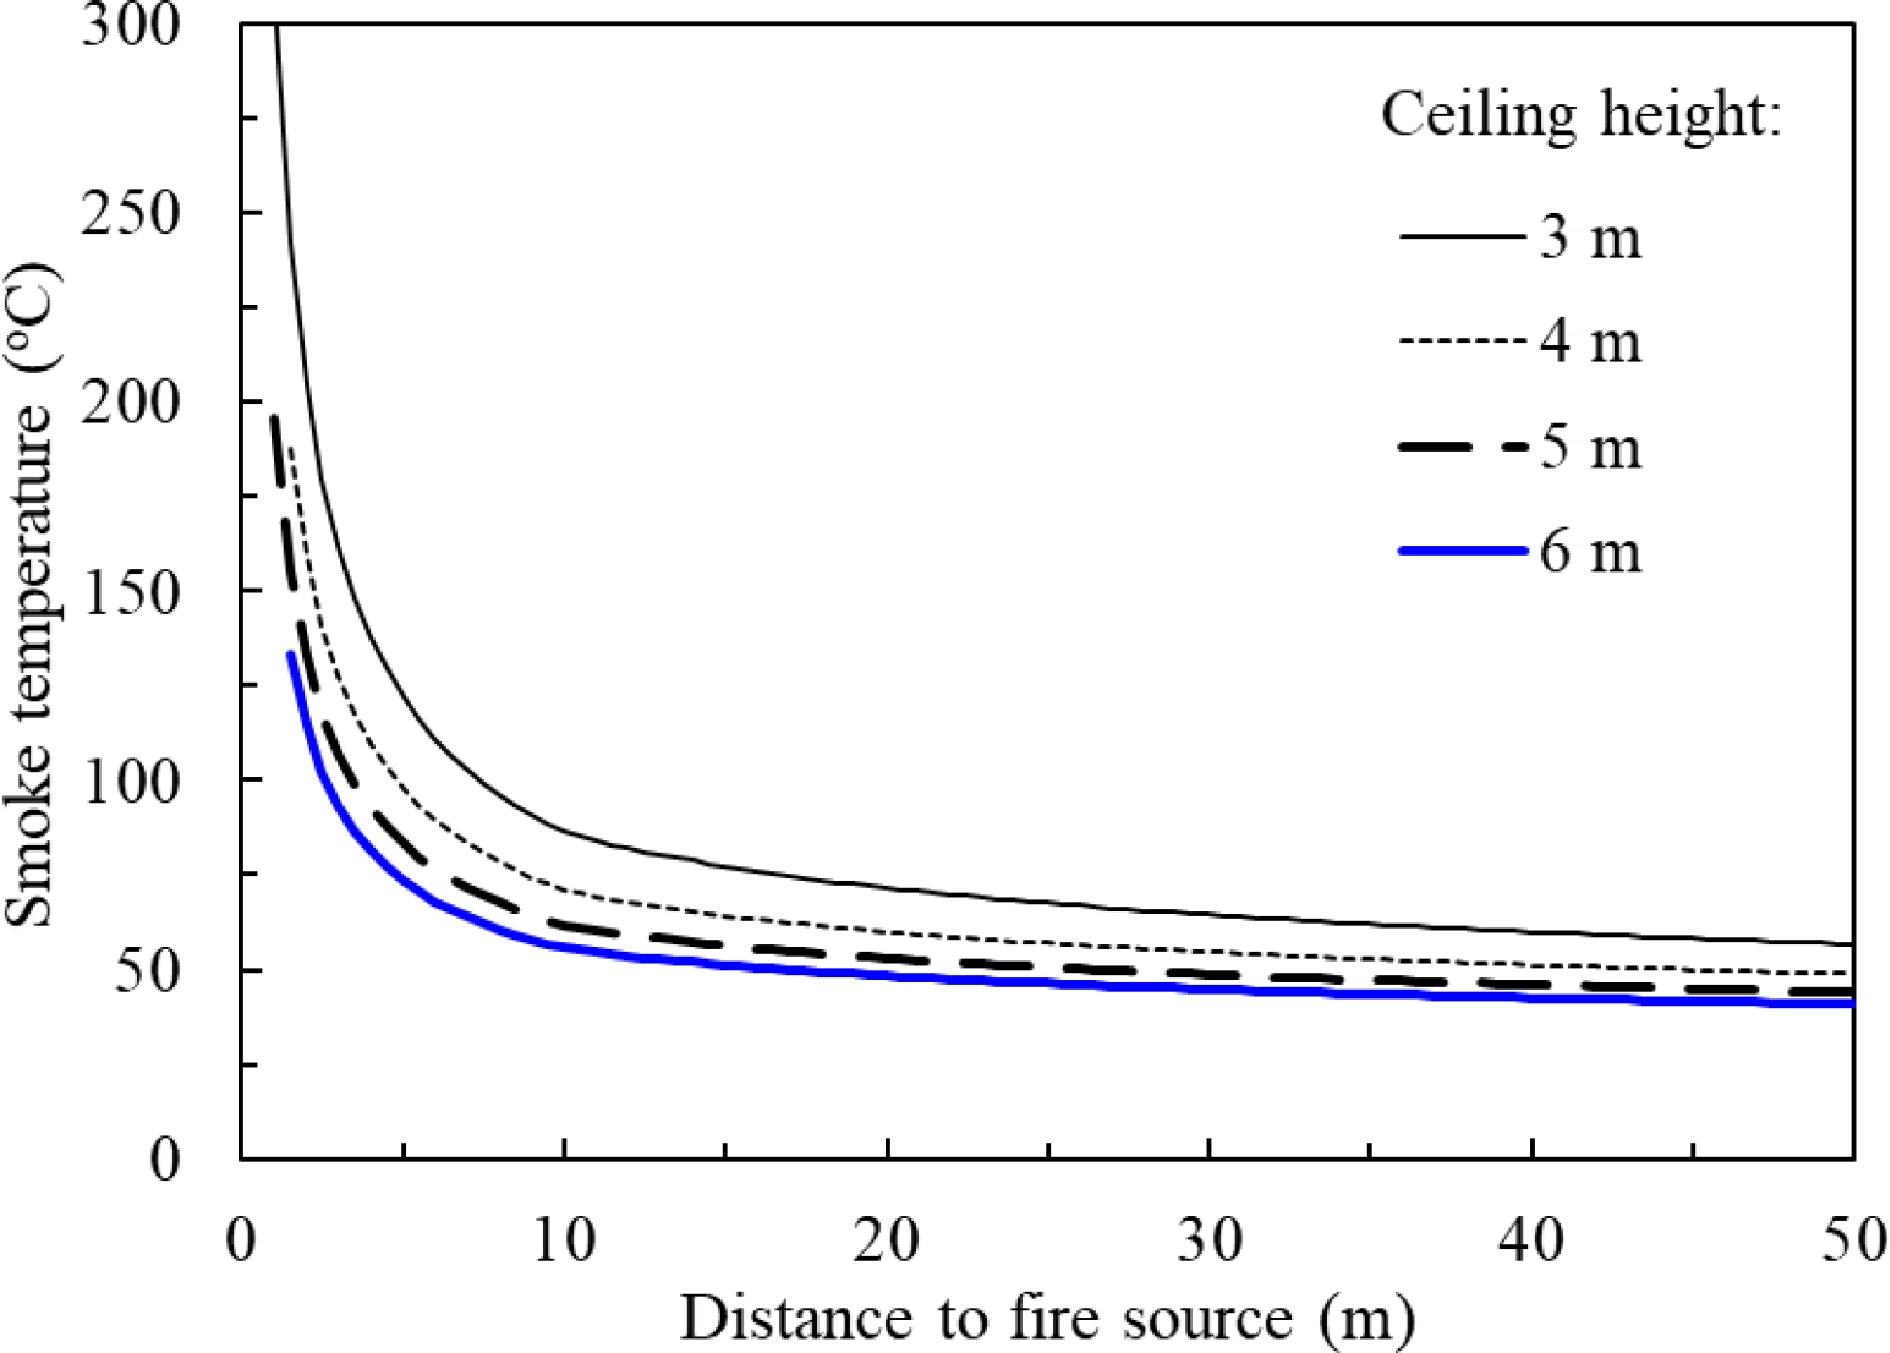
Figure 17.
Predicted smoke temperature vs smoke travel distance at different ceiling heights in a 20 m width ceiling smoke channel by Alpert model derived for confined ceiling.
-
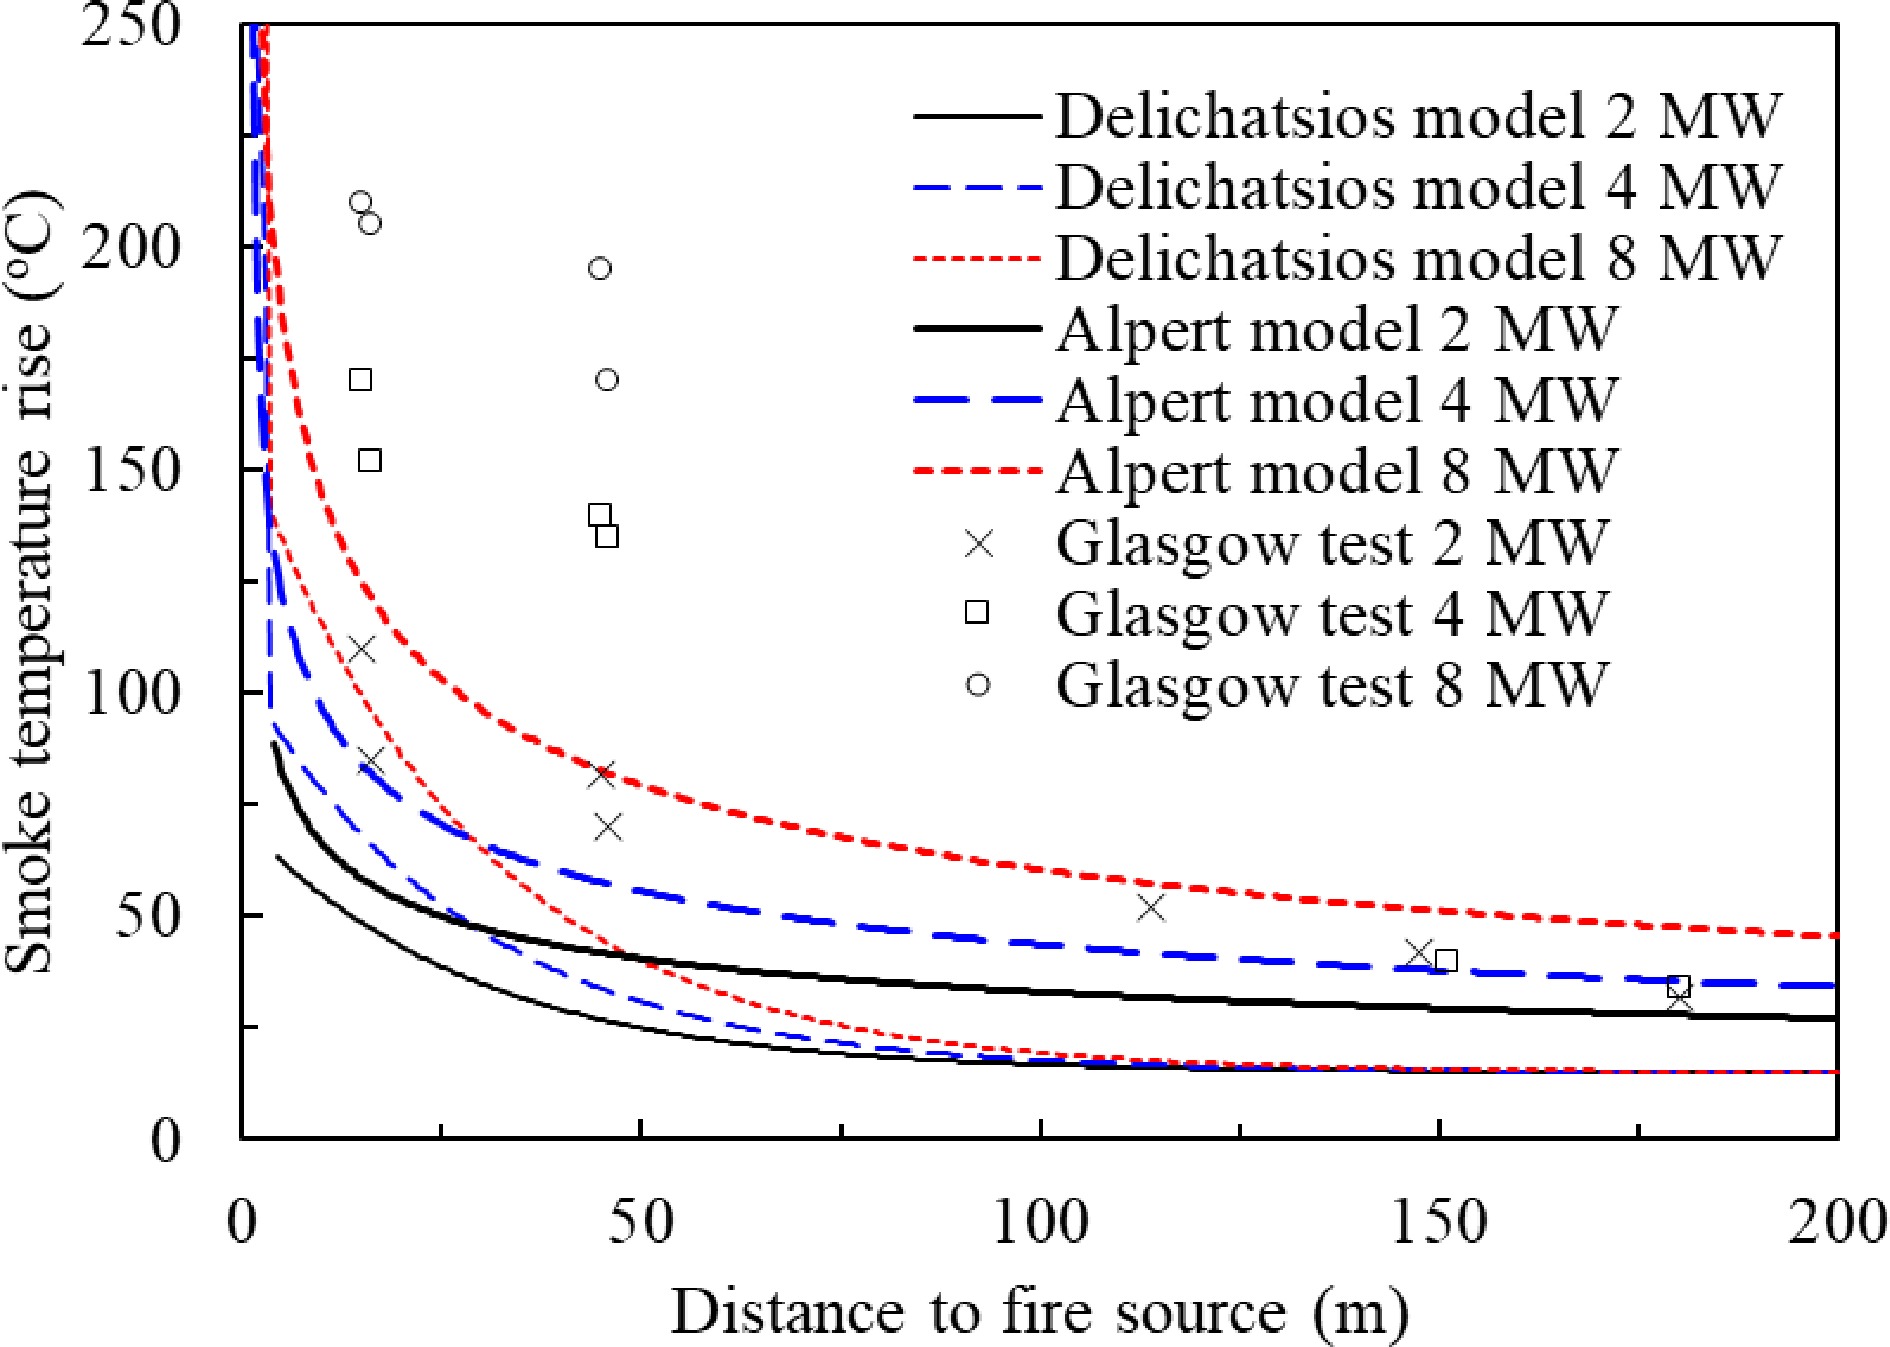
Figure 18.
Comparison of the Delichatsios model, Alpert model derived with the Glasgow tunnel test results.
-
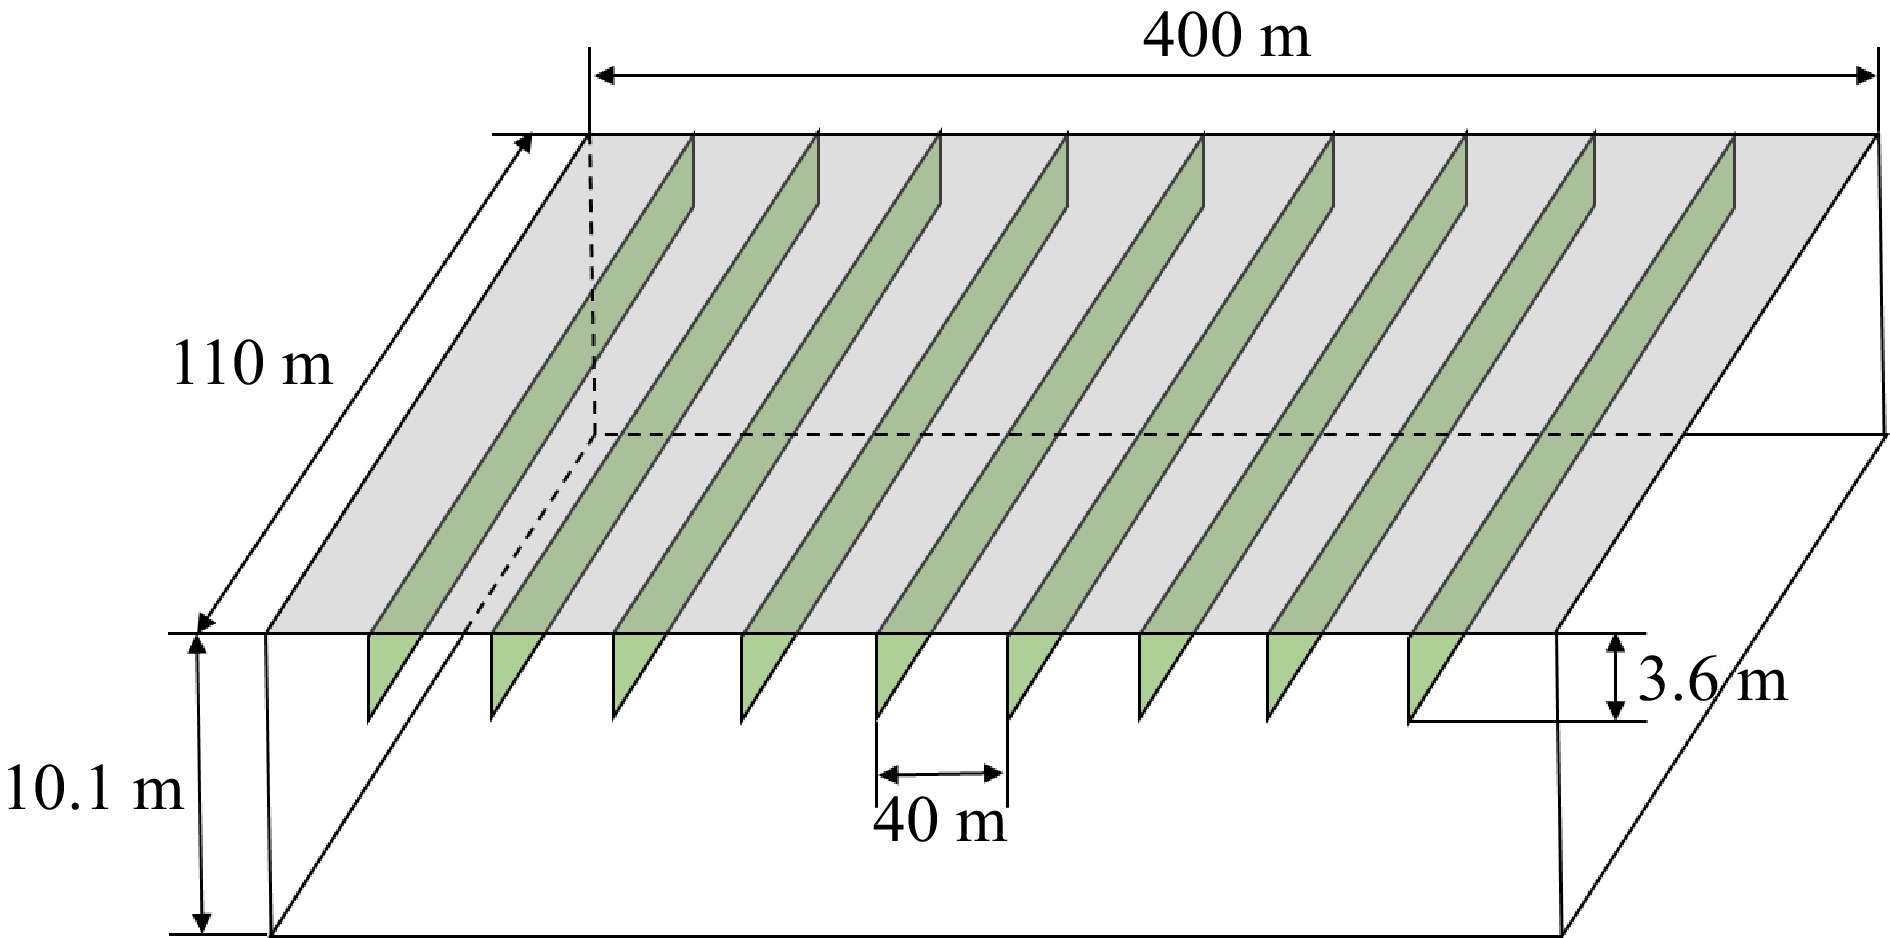
Figure 19.
Illustration of the smoke reservoirs in the depot.
-
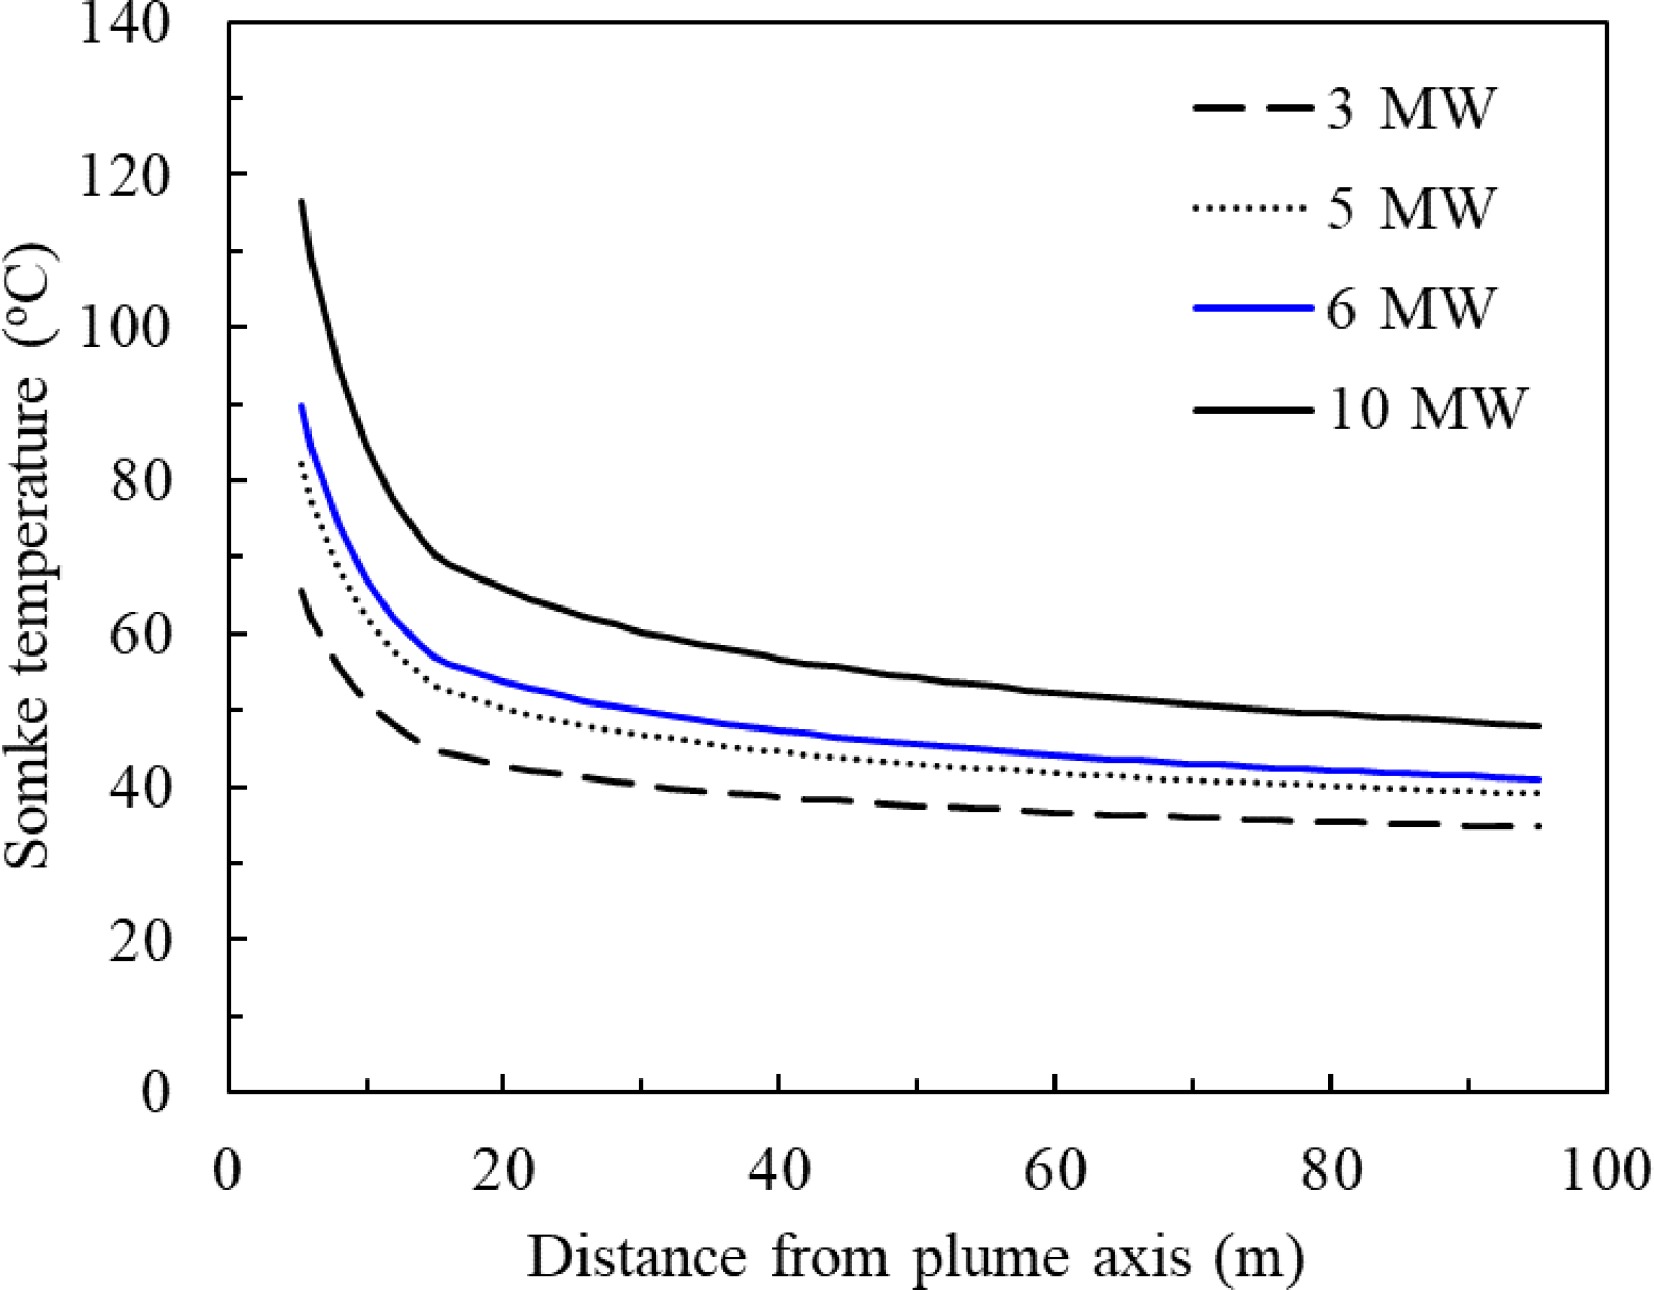
Figure 20.
Smoke temperature vs distance with smoke spreading in the reservoir.
-
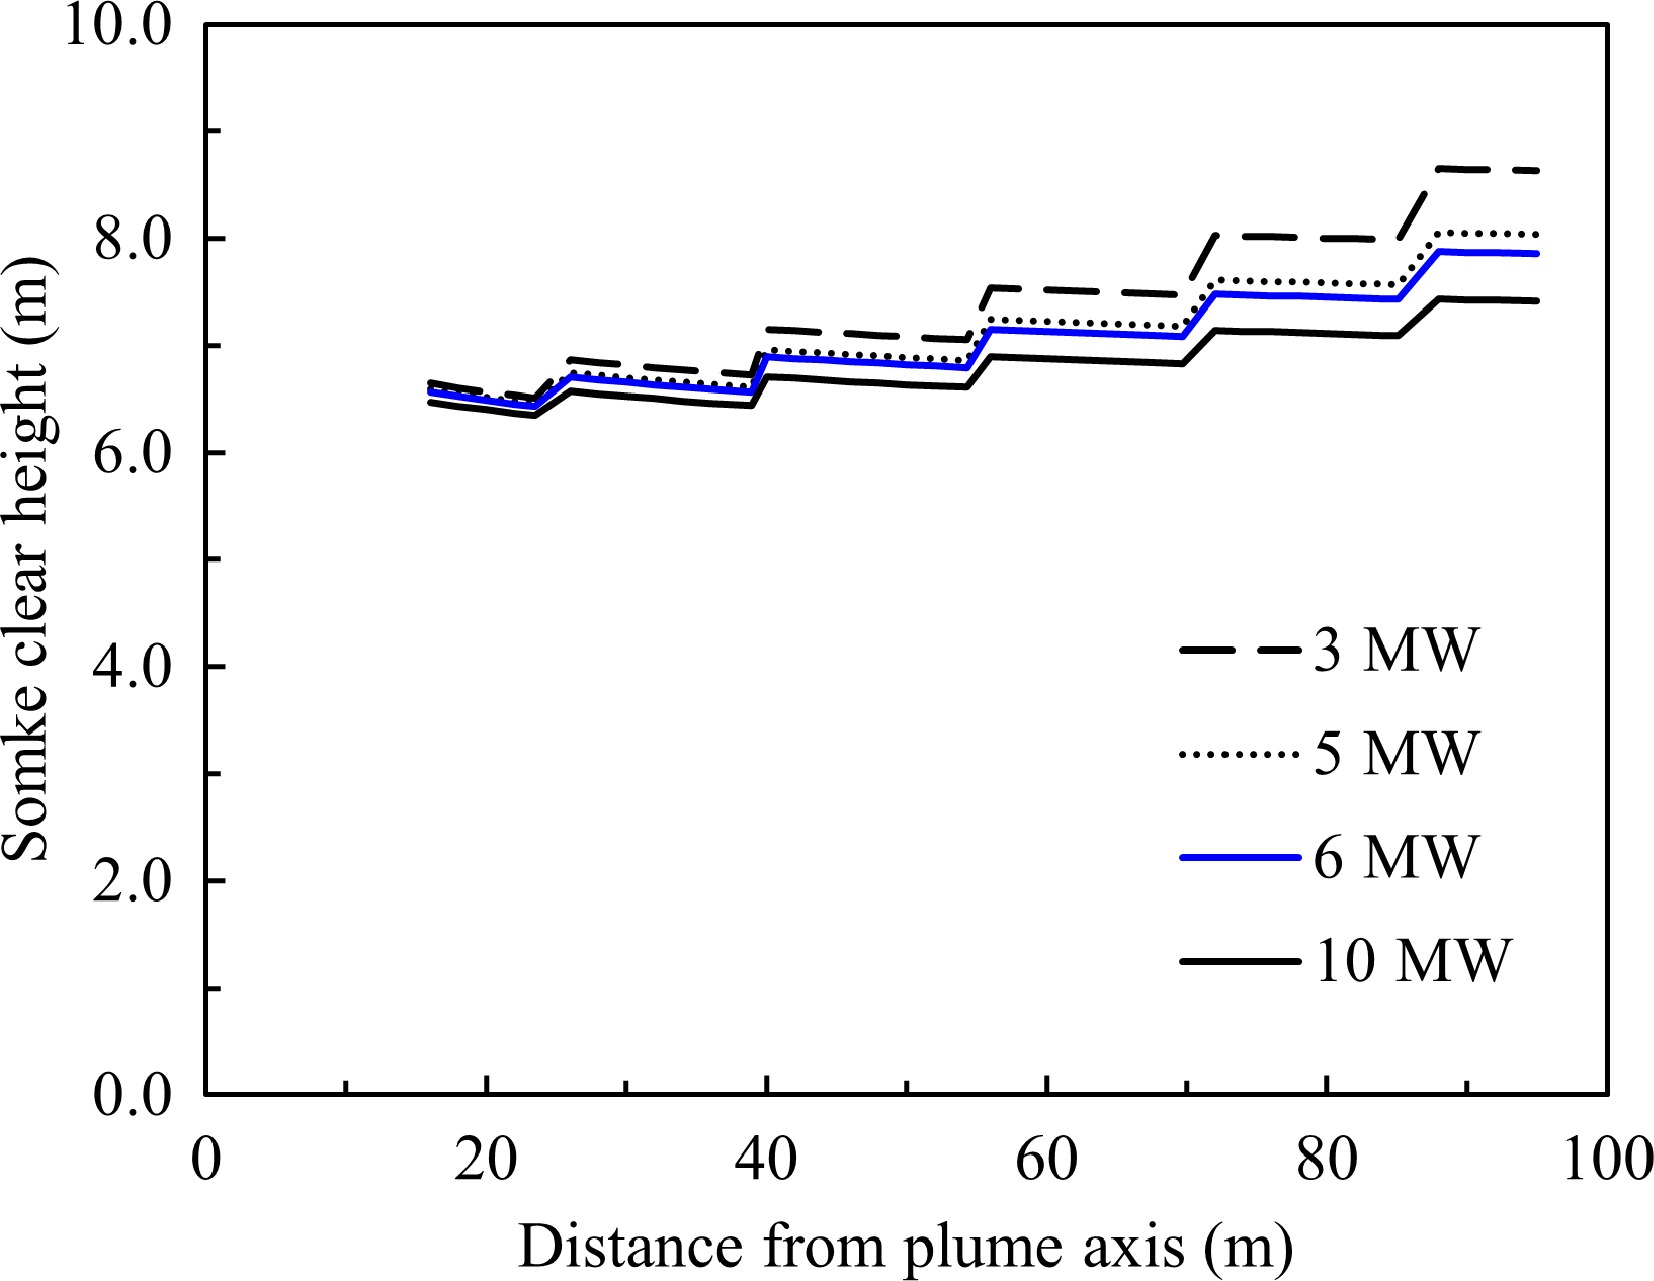
Figure 21.
Smoke clear height vs distance travelled with smoke spreading in the reservoir, the smoke extraction system is operating.
Figures
(21)
Tables
(0)