-
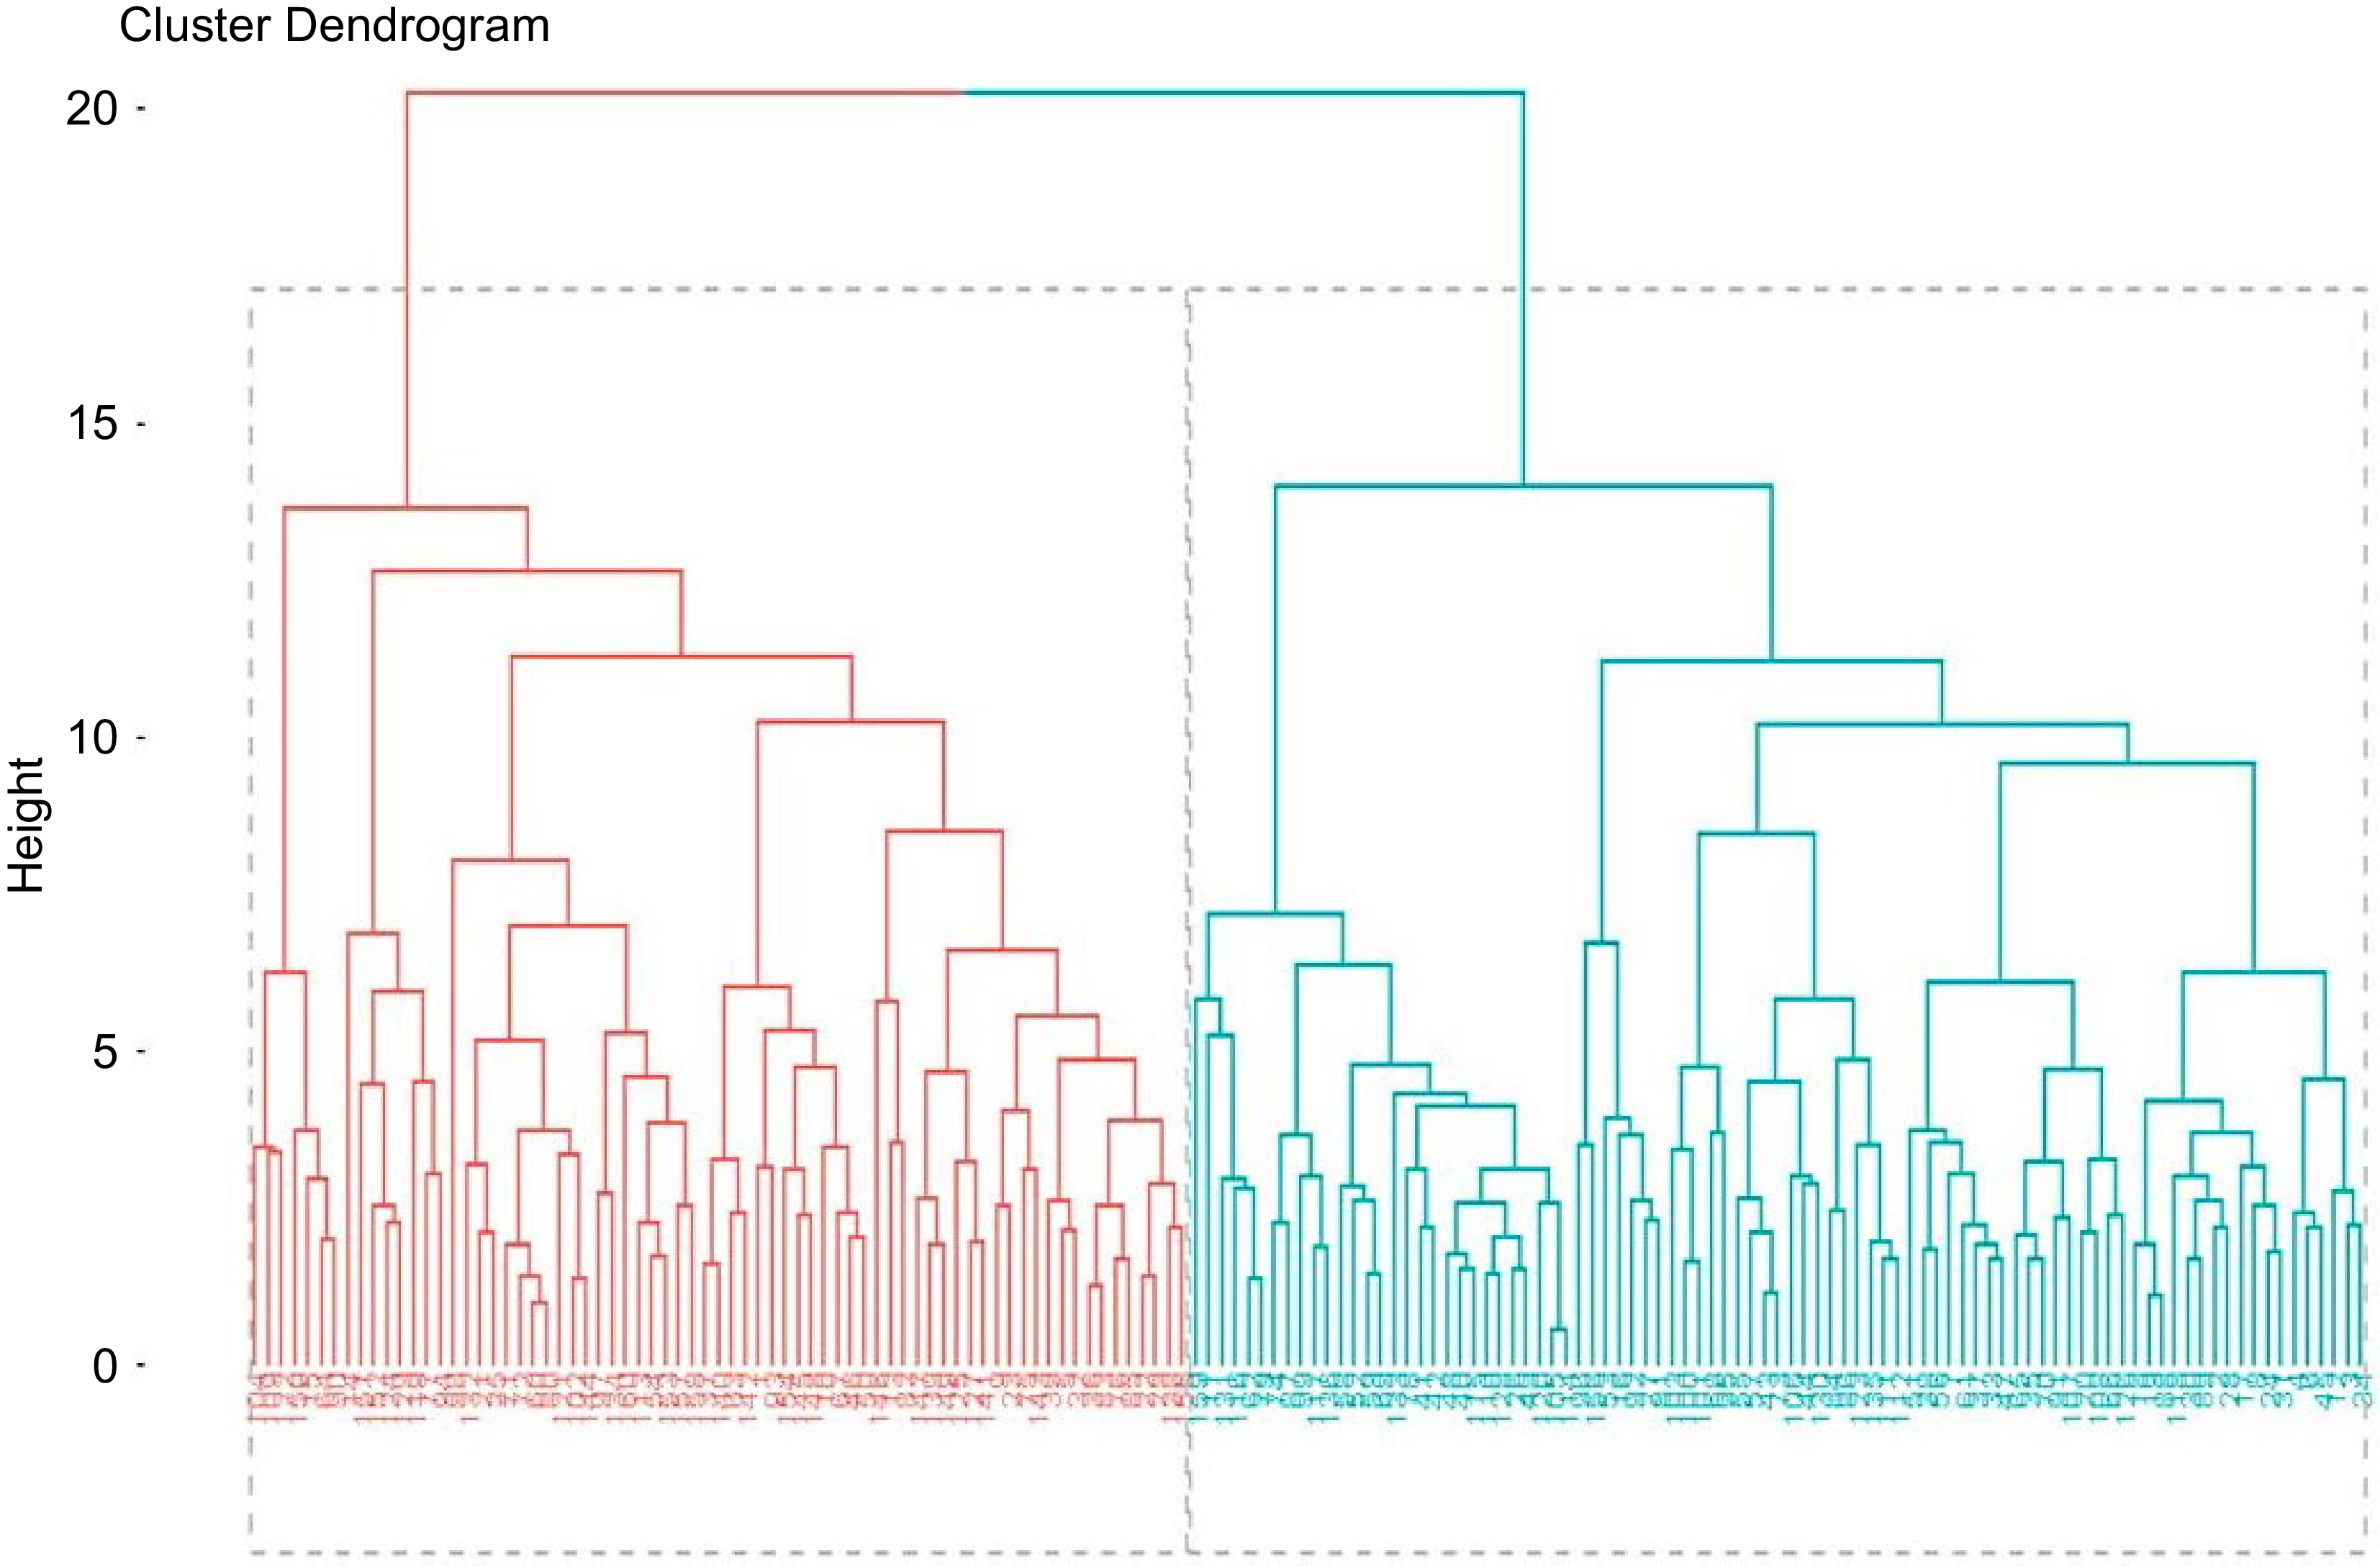
Figure 1.
Dendrogram from UPGMA of 160 fenugreek accession for 11 traits.
-
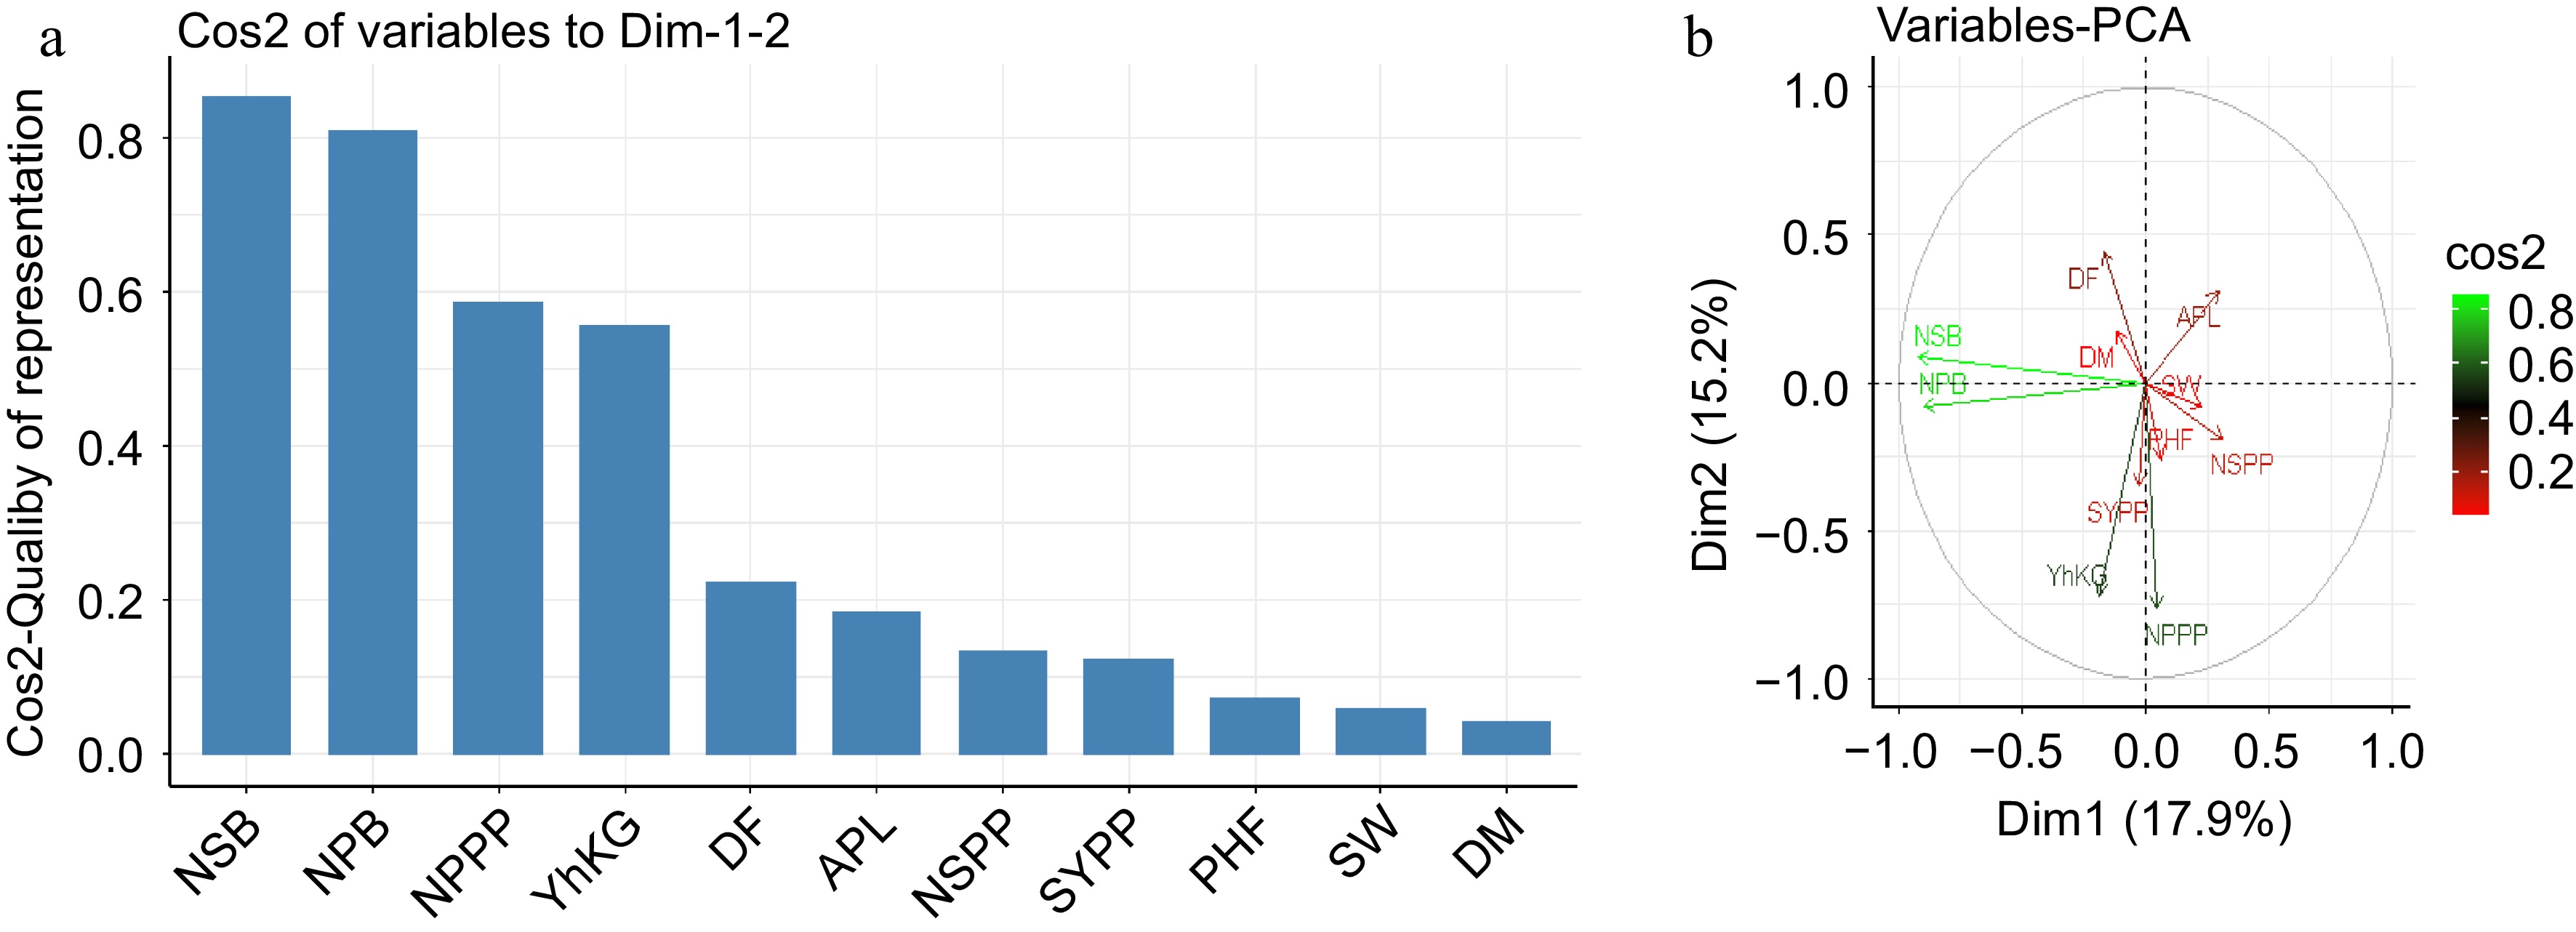
Figure 2.
Eigenvalues and vectors of the correlation matrix for 11 traits accession. (a) Trait's contribution. (b) Relationship of parameters.
-
No. Geographic region AZ NoA AL (m.a.s.l.) 1 Northern Ethiopia Different zones of Tigray 8 2,410 2 Northeastern Ethiopia North and South Wollo 16 1,910−2,880 3 Northwestern Ethiopia South and North Gondar, East and West Gojam, Metekel 96 2,330−2,700 4 Central Ethiopia Arsi and North Shewa 22 2,000−2,700 5 Western Ethiopia East and West Wellega 2 1,950 6 Southeastern Ethiopia Bale and Borena 4 1,730−2,560 7 Southwestern Ethiopia Gamogofa 2 Not known 8 Eastern Ethiopia East and West Hararghe 5 1,700 9 Released varieties 4 10 Local check cultivar 1 AL = Altitude range, NoA = Number of accessions, AZ= Administrative zone. Source: Ethiopian Biodiversity Institute (EBI). Table 1.
Accessions collected from different geographic regions of Ethiopia.
-
To calculate Formula Reference GDCG $\sqrt {\mathop\sum\limits ^{n}_{i=1}(Xij-Xik) }$ Sneath and Sokal (1973) GA GA (K )(σp)(h2 ),
GA(%) (GA) X100Fehr (1987) PCA To find characters account more for total variation SAS software version 9.1 (SAS, 2000) and Statistica basic–7 PCA = Principal component analysis, GA = Genetic advance as part of the mean, GDCG = Genetic divergence and clustering of genotypes, variations, (k = selection differential (at 5% selection intensity, k = 2.063). Table 2.
Genetic variation of accessions was estimated using formula described in the following table.
-
Trait Block (4) Treatment (159) Among checks (4) Among tests (154) Tests vs checks (1) Error (16) CV (%) DF 2.74ns 9.59** 9.38** 17.14** 11.1** 1.39 2.30 DM 48.90ns 78.17** 102.08** 68.38** 1489.92** 25.48 4.19 PHF (cm) 73.97** 58.46** 56.66** 47.44** 1763.13** 10.63 10.63 NPPP 282.34** 62.86** 7.41ns 60.57** 637.20** 3.65 13.80 NSPP 1.45ns 4.75** 2.93ns 4.76** 10.06** 1.14 8.17 NPB 0.04ns 1.47** 0.27** 1.05** 71.17** 0.05 9.56 NSB 0.78** 0.61** 0.10ns 0.62** 1.41** 0.11 19.67 APL (cm) 0.37ns 1.10* 1.50ns 1.08* 1.99ns 0.53 7.61 SYPP (g) 0.57ns 0.99* 0.77ns 1.00* 0.42ns 0.45 17.75 Yhkg 21,746.3ns 130778.6** 130256** 131178** 71357.6* 15973 12.46 TSW (g) 11.21ns 24.09** 16.68ns 24.20** 37.45* 6.56 13.65 ns = non-significant, * and ** = significant and highly significant at p < 0.05 and p < 0.01, respectively. Numbers in parenthesis represented degree of freedom. DF = Days to 50% flowering, DM = Days to 90% maturity, PHF (cm) = Plant height at flowering, NPPP = Number of pods per plant, NSPP = Number of seeds per pod, NPB = Number of primary branches, NSB = Number of secondary branches, APL (cm) = Average pod length, SYPP (g) = Seed yield per plant in gram, Yhkg = Yield in kg per hectare, TSW (g) = Thousand seed weight in gram and CV (%) = Coefficient of variation in percentage. Table 3.
Mean squares from analysis of variance for 11 traits of 160 fenugreek accessions.
-
No. Zone Geo. Reg. Altitude
(m.a.s.l.)No.
woredasNo.
accessionsDays to 50% flowering Days to 90% maturity Min Max Mean SD CV
(%)Min Max Mean SD CV
(%)1 Arsi CE 2,000−2,550 6 11 42.24 57.04 50.88 4.29 8.40 103.97 135.85 117.15 9.88 8.40 2 Shewa CE 2,110−2,700 7 11 49.04 54.64 52.67 1.70 3.20 111.85 133.21 122.09 5.96 4.80 3 Wellega WE 1,950 2 2 50.24 52.04 51.14 1.27 2.40 118.97 123.09 121.03 2.91 2.40 4 Bale SEE 1,850−2,560 2 3 44.24 53.24 47.34 5.10 10.70 106.97 120.07 112.06 7.02 6.20 5 Hararghe EE 1,700 4 5 52.24 57.04 55.00 1.72 3.10 109.67 125.39 121.48 6.63 5.40 6 Borena SEE 1,730 1 1 54.24 119.67 7 Gojam NWE 2,380−2,510 11 47 41.96 56.04 51.18 3.19 6.20 98.17 138.21 118.05 9.58 8.10 8 Wello NEE 1,910−2,880 7 16 41.14 56.24 49.34 4.31 8.70 100.71 132.21 118.89 9.44 7.90 9 Gondar NWE 2,330−2,700 10 48 42.04 56.24 51.17 2.38 4.60 97.67 133.15 119.03 8.53 7.10 10 Tigray NE 2410 6 8 46.04 56.64 52.06 3.44 6.60 105.85 131.21 120.57 9.11 7.50 11 Metekel NWE NA 1 1 52.96 126.15 12 Gamogofa SWE NA 2 2 53.04 53.04 53.04 0.00 0.00 122.95 127.35 125.15 3.11 2.40 13 Released 4 48.60 53.20 50.70 2.13 4.20 123.30 133.68 128.20 4.75 3.70 14 Local 1 50.40 124.06 Overall Minimum 41.14 97.67 Maximum 57.04 138.21 Mean 51.34 119.32 SD 3.06 8.52 CV (%) 2.30 4.19 Geo. Reg. = Geographic Region, Min = Minimum value, Max = Maximum value, SD = Standard deviation, CV (%) = Coefficient of Variation in percent, NA = Altitude not recorded, CE = Central Ethiopia, WE = Western Ethiopia, EE = Eastern Ethiopia, SEE = South-east Ethiopia, NEE = North-east Ethiopia, NWE, = Northwest Ethiopia, NE = Northern Ethiopia, SE = Southern Ethiopia. Table 4.
Mean performance for days to flowering and maturity in respect to 12 collection zones, 58 woredas of eight geographic regions.
-
No. Zone Geo. Reg. Altitude
(m.a.s.l.)No.
woredasNo.
accessionsPlant height at flowering (cm) No. of primary branches Min Max Mean SD CV (%) Min Max Mean SD CV (%) 1 Arsi CE 2,000−2,550 7 11 17.66 45.46 26.95 8.08 29.90 0.85 4.29 2.43 1.21 49.00 2 Shewa CE 2,110−2,700 8 11 18.46 32.94 26.55 4.35 16.40 1.05 4.25 2.48 1.02 41.00 3 Wellega WE 1,950 2 2 25.87 28.46 27.17 1.83 6.80 1.07 3.25 2.16 1.54 71.00 4 Bale SEE 1,850−2,560 2 3 26.06 34.46 30.13 4.21 14.00 1.35 3.60 2.80 1.26 45.00 5 Hararghe EE 1,700 4 5 17.27 39.16 25.52 8.45 33.10 0.85 4.18 2.95 1.35 45.00 6 Borena SEE 1,730 1 1 21.86 2.35 7 Gojam NWE 2,380−2,510 13 47 17.46 48.34 29.71 7.59 25.40 0.95 3.95 1.87 0.81 45.00 8 Wello NEE 1,910−2,880 7 16 10.86 46.16 26.36 7.57 28.70 0.85 3.35 2.03 0.95 46.00 9 Gondar NWE 2,330−2,700 11 48 15.87 52.14 31.86 7.83 24.60 0.86 4.49 2.04 1.13 55.00 10 Tigray NE 2,410 6 8 22.36 40.84 27.70 6.10 22.00 0.95 3.31 1.89 1.00 52.00 11 Metekel NWE NA 1 1 30.85 3.21 12 Gamogofa SWE NA 2 2 47.14 30.64 38.89 15.67 30.00 1.01 3.41 2.21 1.70 76.00 13 Released 4 34.92 43.74 38.98 3.65 9.30 3.68 4.24 3.99 0.24 6.00 14 Local 1 36.40 3.74 Overall Minimum 10.86 0.85 Maximum 52.14 4.49 Mean 30.67 2.37 SD 7.68 1.09 CV (%) 10.63 9.56 Geo. Reg. = Geographic Region, Min = Minimum value, Max = Maximum value, SD = Standard Deviation, CV (%) = Coefficient of variation in percent, NA = Altitude not recorded, CE = Central Ethiopia, WE = Western Ethiopia, EE = Eastern Ethiopia, SEE = Southeast Ethiopia, NEE = Northeast Ethiopia, NWE = Northwest Ethiopia, NE = Northern Ethiopia, SE = Southern Ethiopia. Table 5.
Mean performance of accessions for growth traits in respect to 12 collection zones, 58 woredas of eight geographic regions.
-
No. Zone Geo. Reg. Altitude
(m.a.s.l.)No.
woredasNo.
accessionsNo. of secondary branches Min Max Mean SD CV (%) 1 Arsi CE 2,000−2,550 7 11 1.08 3.18 2.10 0.79 37.00 2 Shewa CE 2,110−2,700 8 11 0.30 3.88 1.93 1.21 62.00 3 Wellega WE 1,950 2 2 1.08 2.78 1.93 1.20 62.00 4 Bale SEE 1,850−2,560 2 3 1.28 3.88 2.78 1.35 48.00 5 Hararghe EE 1,700 4 5 1.28 3.88 2.72 1.19 43.00 6 Borena SEE 1,730 1 1 1.68 7 Gojam NWE 2,380−2,510 13 47 0.30 3.48 1.40 0.81 57.00 8 Wello NEE 1,910−2,880 7 16 0.30 2.98 1.62 0.67 41.00 9 Gondar NWE 2,330−2,700 10 48 0.30 3.85 1.58 0.86 54.00 10 Tigray NE 2,410 6 8 0.30 2.95 1.20 0.83 69.00 11 Metekel NWE NA 1 1 2.15 12 Gamogofa SWE NA 2 2 1.15 2.48 1.81 0.94 51.00 13 Released 4 1.82 2.10 1.96 0.14 0.70 14 Local 1 1.78 Overall Minimum 0.30 Maximum 3.88 Mean 1.70 SD 0.91 CV (%) 19.67 Geo.Reg. = Geographic Region, Min = Minimum value, Max = Maximum value, SD = Standard Deviation, CV (%) = Coefficient of variation in percent, NA = Altitude not recorded, CE = Central Ethiopia, WE = Western Ethiopia, EE = Eastern Ethiopia, SEE = Southeast Ethiopia, NEE = Northeast Ethiopia, NWE = Northwest Ethiopia, NE = Northern Ethiopia, SE = Southern Ethiopia. Table 6.
Mean performance of accessions from 12 collection zones of eight geographic regions for number of secondary branches.
-
No. Zone Geo. Reg. Altitude
(m.a.s.l.)No.
woredasNo.
accessionsAverage pod length (cm) No. of pods per plant Min Max Mean SD CV (%) Min Max Mean SD CV (%) 1 Arsi CE 2,000−2,550 7 11 9.25 10.86 10.04 0.54 7.00 4.35 36.63 17.24 11.28 65.00 2 Shewa CE 2,110−2,700 8 11 7.82 10.60 9.41 0.71 8.00 2.65 38.73 13.53 12.28 90.00 3 Wellega WE 1,950 2 2 8.20 9.54 8.87 0.95 11.00 5.55 23.35 14.45 12.59 87.00 4 Bale SEE 1,850−2,560 2 3 8.35 9.45 9.08 0.64 7.00 13.05 21.05 16.05 4.36 27.00 5 Hararghe EE 1,700 4 5 8.85 10.85 9.63 0.78 8.00 5.15 24.25 11.02 7.83 71.00 6 Borena SEE 1,730 1 1 9.75 6.25 7 Gojam NWE 2,380−2,510 13 47 8.11 12.25 9.84 0.85 9.00 1.09 38.73 13.25 2.34 17.00 8 Wello NEE 1,910−2,880 7 16 8.57 12.32 10.00 0.97 10.00 1.95 26.83 11.01 8.66 78.00 9 Gondar NWE 2,330−2,700 10 48 4.32 11.92 9.31 1.22 13.00 0.95 39.23 13.20 10.13 76.00 10 Tigray NE 2,410 6 8 7.53 10.82 9.33 1.01 11.00 0.19 26.83 14.13 9.93 70.00 11 Metekel NWE NA 1 1 7.83 6.19 12 Gamogofa SWE NA 2 2 10.00 13.62 11.81 2.56 22.00 6.19 24.09 15.14 12.66 83.00 13 Released 4 8.80 10.10 9.35 0.63 6.70 16.72 19.78 18.40 1.36 7.40 14 Local 1 9.19 19.08 Overall Minimum 4.32 0.19 Maximum 12.3 39.23 Mean 9.58 13.85 SD 1.04 9.60 CV (%) 7.61 13.80 Geo. Reg. = Geographic Region, Min = Minimum value, Max = Maximum value, SD = Standard Deviation, CV (%) = Coefficient of variation in percent, NA = Altitude not recorded, CE = Central Ethiopia, WE = Western Ethiopia, EE = Eastern Ethiopia, SEE = Southeast Ethiopia, NEE = Northeast Ethiopia, NWE = Northwest Ethiopia, NE = Northern Ethiopia, SE = Southern Ethiopia. Table 7.
Mean performance of accessions for yield components in respect to 12 collection zones, 58 woredas of eight geographic regions.
-
No. Zone Geo. Reg. Altitude
(m.a.s.l.)No.
woredasNo.
accessionsNo. of seed per pod Seed yield per plant (g) Min Max Mean SD CV (%) Min Max Mean SD CV (%) 1 Arsi CE 2,000−2,550 7 11 9.19 14.50 12.98 1.51 13.00 1.20 4.86 3.94 1.12 28.00 2 Shewa CE 2,110−2,700 8 11 11.29 14.82 13.65 0.98 7.00 1.95 4.82 3.90 0.90 23.00 3 Wellega WE 1,950 2 2 7.49 14.00 10.75 4.60 43.00 3.46 3.92 3.69 0.33 8.90 4 Bale SEE 1,850−2,560 2 3 6.49 13.49 10.02 3.50 35.00 3.27 4.48 4.25 0.64 15.00 5 Hararghe EE 1,700 4 5 7.83 14.80 11.88 2.59 22.00 3.09 4.47 3.52 0.59 17.00 6 Borena SEE 1,730 1 1 14.59 1.09 7 Gojam NWE 2,380−2,510 13 47 4.20 16.75 13.25 2.34 43.00 1.24 5.33 3.76 0.96 25.00 8 Wello NEE 1,910−2,880 7 16 5.21 16.20 12.96 2.38 18.00 0.72 5.30 4.07 1.06 26.00 9 Gondar NWE 2,330−2,700 10 48 5.60 17.40 13.28 2.11 16.00 1.06 5.91 3.82 1.10 28.00 10 Tigray NE 2,410 6 8 5.59 15.70 11.99 3.05 25.00 1.98 4.34 3.54 0.88 24.00 11 Metekel NWE NA 1 1 11.35 3.97 12 Gamogofa SWE NA 2 2 12.43 12.56 12.49 0.09 1.00 0.89 4.25 2.57 2.38 92.00 13 Released 4 12.98 14.84 13.80 0.81 5.90 3.29 4.27 3.85 0.41 10.60 14 Local 1 13.12 4.23 Overall Minimum 4.20 0.72 Maximum 19.10 5.91 Mean 13.07 3.80 SD 2.23 1.02 CV (%) 8.17 17.75 Geo. Reg. = Geographic Region, Min = Minimum value, Max = Maximum value, SD = Standard Deviation, CV (%) = Coefficient of variation in percent, NA = Altitude not recorded, CE = Central Ethiopia, WE = Western Ethiopia, EE = Eastern Ethiopia, SEE = South-east Ethiopia, NEE = North-east Ethiopia, NWE = Northwest Ethiopia, NE = Northern Ethiopia, SE = Southern Ethiopia. Table 8.
Mean performance of accessions from 12 collection zones of eight geographic regions for yield component and yield.
-
No. Zone Geo. Reg. Altitude
(m.a.s.l.)No.
woredasNo.
accessionsThousand seed weight (g) Yield (kg/ha ) Min Max Mean SE CV (%) Min Max Mean SE CV (%) 1 Arsi CE 2,000−2,550 7 11 6.69 23.09 16.34 4.18 26.00 428.12 1,404.22 1,105.40 381.68 34.00 2 Shewa CE 2,110−2,700 8 11 15.45 35.59 21.56 5.75 27.00 633.57 1,318.85 914.64 249.46 27.00 3 Wellega WE 1,950 2 2 16.49 19.37 17.93 2.04 11.00 747.99 1,338.18 1,043.07 417.32 40.00 4 Bale SEE 1,850−2,560 2 3 11.79 33.69 20.12 11.85 59.00 1,213.53 1,971.22 1,499.49 411.59 27.00 5 Hararghe EE 1,700 4 5 10.69 33.89 18.57 9.49 51.00 534.32 1,422.98 949.41 361.71 38.00 6 Borena SEE 1,730 1 1 14.19 250.18 7 Gojam NWE 2,380−2,510 13 47 10.05 36.96 18.19 4.98 28.00 278.77 2,275.33 1,026.24 356.63 34.00 8 Wello NEE 1,910−2,880 7 16 10.51 23.47 18.39 4.10 22.00 327.52 1,285.65 871.08 367.16 40.00 9 Gondar NWE 2,330−2,700 10 48 10.51 34.27 19.75 4.65 24.00 401.59 2,101.63 1,007.89 396.48 39.00 10 Tigray NE 2,410 6 8 11.25 24.35 18.89 4.56 24.00 720.25 1,411.27 1,060.22 252.91 23.00 11 Metekel NWE NA 1 1 17.81 1,152.38 12 Gamogofa SWE NA 2 2 19.51 21.91 20.71 1.70 8.00 1,048.02 1,444.48 1,246.26 280.33 22.00 13 Released 4 17.24 19.60 18.32 1.09 5.94 888.33 1,272.12 1,078.58 182.44 16.90 14 Local 1 14.82 1,004.87 Overall Minimum 10.05 250.09 Maximum 36.97 2,275.33 Mean 18.75 1,035.53 SD 5.00 394.88 CV (%) 13.65 12.87 Geo. Reg. = Geographic Region, Min = Minimum value, Max = Maximum value, SD = Standard Deviation, Yield kg/ha = yield kg per hectare in, CV (%) = Coefficient of variation in percent, NA = Altitude not recorded, CE = Central Ethiopia, WE = Western Ethiopia, EE = Eastern Ethiopia, SEE = Southeast Ethiopia, NEE = Northeast Ethiopia, NWE = Northwest Ethiopia, NE = Northern Ethiopia, SE = Southern Ethiopia. Table 9.
Mean performance of accessions for yield in respect to 12 collection zones, 58 woredas of eight geographic regions.
-
No. Genotype Min Max Mean SD CV (%) 1 FgColl53006 2.71 7.23 4.58 0.9 19.01 2 FgColl53072 3.43 7.46 5.39 0.9 16.07 3 FgColl53075 2.41 6.46 4.38 0.9 19.74 4 FgColl216898 2.14 8.18 4.65 0.9 19.59 5 FgColl53079 1.52 7.57 3.72 1.1 28.8 6 FgColl230067 2.72 7.55 5.08 0.9 18.03 7 FgColl232194 1.63 7.78 4.63 1.1 24.29 8 FgColl232195 1.63 7.6 4.27 1.1 25.31 9 FgColl236992 1.67 7.05 4.08 1 23.83 10 FgColl216900 2.58 8.05 4.96 1 19.31 11 FgColl216899 2.88 7.68 5.26 1 19.8 12 FgColl53023 2.28 7.3 4.95 1.1 21.77 13 FgColl53086 1.87 7.1 4.13 1 24.87 14 FgColl239073 2.03 7.34 4.03 1 25.32 15 FgColl212549 2.58 7.89 5.14 1 20.18 16 FgColl212552 1.24 6.71 4.39 1 23.02 17 FgColl53106 2.09 7.51 4.29 1.1 25.27 18 FgColl229246 1.5 7.52 3.84 1.2 30.78 19 FgColl229244 1.93 8.05 4.67 1 20.51 20 FgColl237982 2.15 7.7 4.57 1 22.38 21 FgColl53088 1.86 7.49 4.12 1.1 25.55 22 FgColl53002 1.68 6.54 3.61 1 26.93 23 FgColl53085 2.94 7.89 4.84 0.9 18.48 24 FgColl212877 2.8 7.97 5.51 1 18.53 25 FgColl215406 3.83 8.64 6.12 0.9 14.87 26 FgColl53090 2.48 7.51 4.82 0.9 18.19 27 FgColl215820 1.68 7.34 3.63 1.1 31.44 28 FgColl208680 3.71 9.44 6.22 1 15.44 29 FgColl207378 2.66 7.75 5.27 1 19.52 30 FgColl230540 1.85 7.49 3.93 1 24.86 31 FgColl230882 2.2 7.39 4.57 1 21.97 32 FgColl216830 2.19 7.93 4.53 1.1 24.28 33 FgColl219343 2.21 8.01 5.03 1.1 21.92 34 FgColl215334 1.59 6.51 4.46 0.8 18.17 35 FgColl53027 1.62 7.53 4.42 1 22.43 36 FgColl53026 2.68 7.43 5.26 0.9 17.58 37 FgColl53035 1.71 6.91 3.88 0.9 23.36 38 FgColl53029 2.09 7.02 4.63 1 21.27 39 FgColl53028 2.46 8.54 4.77 1.2 24.21 40 FgColl53042 2.19 7.89 4.27 1.2 27.12 41 FgColl53043 1.13 7.47 3.82 1.11 29.19 42 FgColl53041 1.68 6.56 3.89 0.99 25.31 43 FgColl212775 1.24 6.65 4.1 1.03 25.03 44 FgColl53097 3.44 8.5 5.58 0.95 17.07 45 FgColl53098 1.66 7 3.77 1.05 27.9 46 FgColl53099 1.67 7.43 3.94 1.01 25.65 47 FgColl53081 1.21 7.12 3.83 1.11 29.14 48 FgColl53076 2.57 8.46 4.82 0.99 20.62 49 FgColl53078 2.3 7.98 4.59 1.03 22.36 50 FgColl2007369 0.07 7.55 5.35 1.04 19.41 51 FgColl53021 2.45 8.44 4.53 1.02 22.46 52 FgColl239062 2.17 9.67 5.93 1.02 17.22 53 FgColl239063 1.1 8.1 3.93 1.16 29.59 54 FgColl239064 2.35 7.78 4.98 1.02 20.41 55 FgColl212776 1.66 7.69 4.17 1.05 25.17 56 FgColl212777 1.88 6.73 3.87 0.9 23.35 57 FgColl53107 3.39 8.86 5.65 1.03 18.23 58 FgColl215335 1.13 7.5 4.12 1.1 26.59 59 FgColl53047 1.35 7.04 4 1.05 26.31 60 FgColl53048 1.75 7.45 4.18 1.05 25.03 61 FgColl53049 2.1 8.34 4.51 1.12 24.79 62 FgColl236621 3.37 8.44 5.84 0.91 15.52 63 FgColl236622 1.8 8.27 4.22 1.18 27.92 64 FgColl53054 2.7 7.72 5.11 0.95 18.57 65 FgColl53055 1.62 8.16 4.68 1.09 23.33 66 FgColl53056 2.3 7.64 4.84 1.04 21.56 67 FgColl53071 1.5 7.07 3.8 1.13 29.7 68 FgColl53063 2.29 7.48 4.86 1.05 21.5 69 FgColl53037 1.89 7.84 4.05 1.04 25.67 70 FgColl53039 1.81 7.91 4.2 1.1 26.12 71 FgColl53040 2.32 7.92 4.16 0.9 21.63 72 FgColl53057 2.31 7.48 4.63 0.94 20.31 73 FgColl53058 1.44 7.66 3.91 1.05 26.74 74 FgColl53059 2.09 8.18 3.97 1.06 26.64 75 FgColl53044 2.39 7.45 3.87 0.83 21.35 76 FgColl23045 1.59 6.27 4.2 0.82 19.54 77 FgColl53046 2.36 7.93 4.95 0.92 18.56 78 FgColl215261 2.27 7.76 4.33 1.09 25.05 79 FgColl213116 1.96 6.99 4.24 0.96 22.69 80 FgColl213115 2.25 7.24 4.96 0.94 18.93 81 FgColl213114 1.72 7.17 3.72 1 27.3 82 FgColl212657 1.78 7.38 4.47 1 22.22 83 FgColl215731 1.77 8.16 4.18 1.1 25.78 84 FgColl213111 1.71 6.64 4.06 0.9 21.75 85 FgColl213112 1.73 7.26 3.95 1.1 27.1 86 FgColl53013 1.99 6.98 3.78 0.9 24.84 87 FgColl53014 2.65 8.92 5.85 1 17.56 88 FgColl53102 4.4 10.3 6.52 0.9 14.48 89 FgColl53103 2.23 7.84 4.49 1.1 24.17 90 FgColl53104 2.23 7.65 4.24 1.1 25.96 91 FgColl53105 1.83 7.86 4.12 1.2 28.09 92 FgColl226090 0.55 7.6 4.03 1.2 29.61 93 FgColl53012 3.31 8.32 5.7 0.9 16.43 94 FgColl208463 2.34 8.04 4.71 0.9 19.12 95 FgColl207379 3.43 8.25 5.26 1 19.13 96 FgColl207370 2.57 8.01 4.51 0.9 20.74 97 FgColl207380 1.6 7.22 3.88 1.1 27.75 98 FgColl207395 2.37 8.73 5.01 1.1 21.2 99 FgColl207393 1.88 7.15 3.86 0.9 23.97 100 FgColl207394 1.98 8.3 5.18 10 18.56 101 FgColl207384 2.02 6.97 4.17 1 24.45 102 FgColl207385 1.44 6.61 3.86 1.1 27.26 103 FgColl207386 2.71 8.36 4.79 0.9 19.64 104 FgColl207369 0.07 7.55 5.35 1 19.39 105 FgColl207371 2.3 7.87 4.4 1 23.32 106 FgColl207381 2.17 7.69 4.54 1.1 24.5 107 FgColl207382 1.87 7.11 4.19 1 24.22 108 FgColl207383 1.68 7.44 3.87 1.1 28.83 109 FgColl207375 4.7 10.6 7.26 1 13.41 110 FgColl207376 2.48 7.19 4.38 1 23.61 111 FgColl207377 1.1 8.7 4.4 1.2 27.15 112 FgColl212779 2.39 9.24 4.82 1.2 23.94 113 FgColl208035 2.32 7.26 4.5 1 21.91 114 FgColl207396 1.77 7.43 4.02 1 25.75 115 FgColl207366 1.82 7.6 3.78 1 25.93 116 FgColl207367 1.99 7.27 4.59 1.1 23.07 117 FgColl228558 3.26 9.44 5.49 1 18.78 118 FgColl227227 2.5 8.85 5.33 1.1 19.92 119 FgColl205176 1.95 6.48 4 0.8 20.07 120 FgColl53108 4.08 9.67 6.15 1 16.73 121 FgColl53109 2.38 7.39 4.92 1.01 20.56 122 FgColl207354 1.47 6.36 3.71 0.9 24.16 123 FgColl207355 2.52 8.33 4.91 1.05 21.46 124 FgColl207356 0.55 7.56 4.19 1.2 28.74 125 FgColl207387 2.08 6.49 3.86 0.79 20.54 126 FgColl207388 2.74 7.29 4.76 0.93 19.47 127 FgColl207389 2.09 7.17 4.15 0.95 22.98 128 FgColl207390 2.17 6.85 4.36 0.86 19.83 129 FgColl07391 1.67 7.63 4.07 1.11 27.17 130 FgColl207392 2.94 8.6 5.13 0.95 18.41 131 FgColl207372 1.44 7.59 3.75 1.02 27.29 132 FgColl207373 1.99 6.98 3.85 0.88 22.89 133 FgColl207374 3.13 7.51 5.21 0.91 17.54 134 FgColl207361 1.67 7.35 3.98 1.08 27.17 135 FgColl207357 1.99 7.02 4.17 0.96 23.02 136 FgColl207358 2.87 7.92 5.36 1.06 19.7 137 FgColl207362 2.38 7.3 4.66 0.95 20.4 138 FgColl207364 1.44 6.97 3.79 1.09 28.77 139 FgColl207365 2.84 7.94 5.26 0.92 17.52 140 FgColl53008 2.47 8.96 4.57 1.04 22.67 141 FgColl53009 1.95 6.68 3.66 0.92 25.22 142 FgColl239065 2.58 7.65 4.88 1.08 22.06 143 FgColl229846 2.38 9.32 4.94 1.1 22.24 144 FgColl219509 1.35 7.02 4.07 1.08 26.57 145 FgColl53092 1.93 7.18 4.07 0.91 22.27 146 FgColl53093 3.6 10.6 5.79 1.02 17.57 147 FgColl53094 2.57 8.06 4.95 0.82 16.66 148 FgColl238247 1.71 7 4.02 0.96 23.96 149 FgColl220026 2.11 7.44 4.92 0.98 19.91 150 FgColl220027 1.74 7.58 4.33 1.08 24.99 151 FgColl235133 1.93 7.18 3.91 0.92 23.53 152 FgColl207368 1.98 8.56 5.25 1.06 20.15 153 FgColl9562 2.26 6.7 4.29 0.87 20.27 154 FgColl215585 1.21 7.47 3.8 1.11 29.09 155 FgColl207599 2.45 8.81 5.13 1.15 22.45 156 Chala 0.98 6.72 4.08 0.92 22.65 157 Ebbisa 1.37 7.36 4.39 0.97 22.01 158 Hunda,ola 1.37 7.14 4.54 0.95 20.82 159 FGP# = 1 0.98 6.07 3.77 0.88 23.3 160 Local 1.1 5.97 3.85 0.9 23.29 Overall 0.07 10.6 4.54 1 22.19 Min = Minimum, Max = Maximum, SD = Standard deviation, CV (%) = Coefficient of Variation in percent. Table 10.
Mean Euclidian distances of accessions estimated from 11 agromorphological traits.
Figures
(2)
Tables
(10)