


-
Fenugreek (Trigonella foenum-graecum L.) is a dicotyledonous, annual aoutogamouse self-polinating and diploid (2n = 16) legume belonging to the Fabaceae family[1]. Trigonella foenum-graecum L. is probably indigenous to the eastern Mediterranean region, western Asia, and India, but its natural distribution is hard to ascertain, as it has been widely cultivated since antiquity, the first written record dating back as far as 400 BC. Its cultivation spread to China, Ethiopia, Europe and the southern part of the former Soviet Union and throughout the Arab world[2,3].
Ethiopia is an original homeland of a fenugreek subspecies known as the Mediterranean ecotype, which has a distribution extending from Eritrea to Somalia[4]. In Ethiopia, fenugreek growing regions are located at 1,800−2,300 m.a.s.l. and are characterized by a subtropical climate, including wet and dry seasons[5]. Ethiopia is one of the countries in the world where fenugreek is most widely cultivated[3,6]. The production and distribution of fenugreek is similar to those of other cool season food legumes such as faba bean, field pea, lentil, chickpea, and grass pea[7]. During the 2014 cropping season, fenugreek covered 20,524.39 hectares in the country with an average yield of 1.224 t/ha. Fenugreek ranks 9th among highland pulses in terms of production in Ethiopia.
Fenugreek is a multi-purpose crop which is utilized as food, feed, spices and medicinal plant, and the oil is used in perfumery in France[8]. Fenugreek is one of oldest medicinal plants; its leaves, seeds and sometimes even the whole plant have been used as medicine[9]. Extracts from fenugreek seed powders are used for treating disease and a variety of ailments, including wounds, skin irritations, head lice, and high blood sugar[2]. Fenugreek seed extract can be used as an anti-diabetic to lower blood sugar and cholesterol levels[10]. Extracts from fenugreek seeds can be used to make teas to reduce fever and menstrual pains, or as ointments to treat skin infections and irritation[11]. Ground seeds are often used to give a maple flavor to sweets and candy. Taken internally, fenugreek is used to treat bronchitis, coughs, respiratory problems and sinus conditions[12]. Fenugreek, as most of the species of the genus Trigonella, is strongly anti-fungal and can be used as an insect repellent[11].
Both ripened and unripened seeds, as well as green leaves, have been used as a food in south and central Asian countries[13]. The protein content of Fenugreek is high (43.8 g/100 g) and most of the time it is used to supplement low-protein foods such as cereal crops[14]. The leaf of fenugreek contains 86.1% moisture, 4.4% protein, 0.9% fats, 1.5% minerals, 1.1% fiber and 6.0% carbohydrates. Its mineral and vitamin contents are calcium, phosphorus, iron, carotene, riboflavin, niacin and vitamin C[15]. The seed contains 13.7% moisture, 26.2% protein, 5.8% fat, 3.0% mineral, 7.2% fiber and 44.1% carbohydrate[16].
It enriches soil through symbiosis with micro-organisms, which fix atmospheric nitrogen[17]. It is rich in protein (25.5%), fats (5%−10%), available carbohydrate (45%−60%), mucilaginous matter (20%) and saponins (4.8%)[18]. Fenugreek stands as a major legume crop for generating cash, it may also create a good opportunity for the country to increase its currency reserves and generate income for poor farmers, and it could play an important role in enhancing the food and nutrition security of the country[19]. However, this important crop is neglected and underutilized that will inadvertently entail the risk of losing some important germ-plasm that has been maintained by farmers over hundreds or thousands of years. Limited information is available about the variability of fenugreek accessions and production systems in Ethiopia[20].
Land-races or farmer varieties are important sources of genetic diversity and potential materials that could be used to enhance genetic variability and therefore serve as the basis for a formal plant breeding program[21]. Land-races are traditional varieties with distinct identities that have been locally adapted and cultivated by farmers over centuries, without assistance from formal crop improvement programs; such varieties are a major source of genes for the development of new varieties[22]. Land-races often exhibit a high capacity to tolerate biotic and a biotic stresses, resulting in high yield stability (consistence productivity from year-to-year) under low input agricultural systems[23].
In Ethiopia, farmers are producing the crop from seed stocks of land-races that are adapted to specific agroecological conditions and only six improved varieties have been released for cultivation, all from Sinana, Sirinka and Debreziet Agricultural Research Centres[24]. This indicates that the national agricultural research has little information on genetic variability of fenugreek in agroecological and morpho agronomic traits as compared to other highland pulse crops. It is necessary to assess the genetic variability of the fenugreek accessions across diverse agroecological conditions that could help to improve fenugreek. Therefore, the study under taken on genetic variability of fenugreek accessions from different agroecological and morpho-agronomic traits has a paramount importance for improvement of the crop and to design appropriate breeding methods.
-
The study was conducted at Raare Haramaya University's experimental site in Ethiopia during the 2016 cropping season, at a latitude of 9°26′ N, a longitude of 42°3′ E, and an altitude of 1,980 m.a.s.l. Haramaya University is roughly 520 kilometres east of Addis Ababa. The location is in a bimodal rainfall sub-humid mid-altitude agro-climatic zone. The long rainy season lasts from July to September, while the short rainy season lasts from October to December. In 2016, 377.7 mm of precipitation fell and temperatures ranged from 11.3 to 23.7 °C. The soil at the test site is fuvisols with a sandy clay loam texture. In the experiment, 155 accessions from Ethiopian Biodiversity institute national gene bank and four standard checks, as well as one local accession were used. Table 1 provides a summary of the accessions.
Table 1. Accessions collected from different geographic regions of Ethiopia.
No. Geographic region AZ NoA AL (m.a.s.l.) 1 Northern Ethiopia Different zones of Tigray 8 2,410 2 Northeastern Ethiopia North and South Wollo 16 1,910−2,880 3 Northwestern Ethiopia South and North Gondar, East and West Gojam, Metekel 96 2,330−2,700 4 Central Ethiopia Arsi and North Shewa 22 2,000−2,700 5 Western Ethiopia East and West Wellega 2 1,950 6 Southeastern Ethiopia Bale and Borena 4 1,730−2,560 7 Southwestern Ethiopia Gamogofa 2 Not known 8 Eastern Ethiopia East and West Hararghe 5 1,700 9 Released varieties 4 10 Local check cultivar 1 AL = Altitude range, NoA = Number of accessions, AZ= Administrative zone. Source: Ethiopian Biodiversity Institute (EBI). Table 2. Genetic variation of accessions was estimated using formula described in the following table.
To calculate Formula Reference GDCG $\sqrt {\mathop\sum\limits ^{n}_{i=1}(Xij-Xik) }$ Sneath and Sokal (1973) GA GA (K )(σp)(h2 ),
GA(%) (GA) X100Fehr (1987) PCA To find characters account more for total variation SAS software version 9.1 (SAS, 2000) and Statistica basic–7 PCA = Principal component analysis, GA = Genetic advance as part of the mean, GDCG = Genetic divergence and clustering of genotypes, variations, (k = selection differential (at 5% selection intensity, k = 2.063). Due to the 160 accessions used, the experiment used an augmented block design. Replications were not possible due to the small number of seeds, but checks were replicated in each block. The experiment has five blocks which contain 36 entries, including four standard checks (the 'Chala', 'Hunda'ol', 'Eibbsa', 'FGP# = 1', and local checks). While each accession was assigned only once during the experiment, the checks were distributed randomly within each block and replicated once in each block. A plot was divided into two rows, each measuring 2 m in length, with each row 0.25 m, making each plot 2 m × 2 m × 0.25 m, or 1 m2. There were 40 plants total in each plot (2 m × 2 rows × 10 cm) due to the 10 cm space between plants.
Data collection was conducted using plants that were cultivated in both rows. All other agronomic procedures were followed as per the recommendation for fenugreek. Five plants were chosen at random from each plot, and data collected include their days to flowering, days to maturity, seed yield (kg/ha), thousand seed weight (g), the number of primary branches, plant height at flowering (cm), the number of pods per plant, the number of secondary branches, average pod length (cm), the number of seeds per pod, and seed yield per plant (g/plant). All data sets were subjected to analysis of variance (ANOVA) using the Statistical Package for Augmented Design (SPAD) softwareware[25].
-
The analysis of variance (ANOVA) results are shown in (Table 3). The ANOVA results revealed highly significant (p < 0.01) differences among entries for days to 50% flowering, days to 90% maturity, number of pods per plant, number of seeds per pod, number of primary branches, number of secondary branches, thousand seed weight, plant height at flowering, and seed yield kg per hectare, as well as significant (p < 0.05) differences for average pod length and seed yield per plant.
Table 3. Mean squares from analysis of variance for 11 traits of 160 fenugreek accessions.
Trait Block (4) Treatment (159) Among checks (4) Among tests (154) Tests vs checks (1) Error (16) CV (%) DF 2.74ns 9.59** 9.38** 17.14** 11.1** 1.39 2.30 DM 48.90ns 78.17** 102.08** 68.38** 1489.92** 25.48 4.19 PHF (cm) 73.97** 58.46** 56.66** 47.44** 1763.13** 10.63 10.63 NPPP 282.34** 62.86** 7.41ns 60.57** 637.20** 3.65 13.80 NSPP 1.45ns 4.75** 2.93ns 4.76** 10.06** 1.14 8.17 NPB 0.04ns 1.47** 0.27** 1.05** 71.17** 0.05 9.56 NSB 0.78** 0.61** 0.10ns 0.62** 1.41** 0.11 19.67 APL (cm) 0.37ns 1.10* 1.50ns 1.08* 1.99ns 0.53 7.61 SYPP (g) 0.57ns 0.99* 0.77ns 1.00* 0.42ns 0.45 17.75 Yhkg 21,746.3ns 130778.6** 130256** 131178** 71357.6* 15973 12.46 TSW (g) 11.21ns 24.09** 16.68ns 24.20** 37.45* 6.56 13.65 ns = non-significant, * and ** = significant and highly significant at p < 0.05 and p < 0.01, respectively. Numbers in parenthesis represented degree of freedom. DF = Days to 50% flowering, DM = Days to 90% maturity, PHF (cm) = Plant height at flowering, NPPP = Number of pods per plant, NSPP = Number of seeds per pod, NPB = Number of primary branches, NSB = Number of secondary branches, APL (cm) = Average pod length, SYPP (g) = Seed yield per plant in gram, Yhkg = Yield in kg per hectare, TSW (g) = Thousand seed weight in gram and CV (%) = Coefficient of variation in percentage. The four released varieties and one local land-race used as standard checks revealed highly significant differences (p < 0.01) in the number of primary branches, days to 50% flowering, days to 90% maturity, seed yield kg per hectare, and plant height at flowering, while the standard checks revealed non-significant differences in the other traits. The ANOVA also revealed highly significant (p < 0.01) differences in days to 50% flowering, days to 90% maturity, plant height at flowering, number of pods per plant, number of seeds per pod, number of primary branches, and number of secondary branches between check varieties and entries/tests, as well as a significant (p < 0.05) difference in thousand seed weight and seed yield kg per hectare. The mean squares for seed yield per plant and average pod length for check varieties vs test entries were non-significant.
The presence of adequate variations was demonstrated by the presence of significant differences among test genotypes for all traits. The observed results indicated that the selected genotypes had a higher chance of improving the traits of interest. Other researchers found significant differences in days to flowering, days to maturity, plant height at 90% maturity, number of primary branches, number of secondary branches, number of pods per plant, number of seed per plant, thousand seed weight, and seed yield among fenugreek accessions[24,26]. Scholar reported existence of significant differences for number of primary branches, number of secondary branches, plant height, and number of seeds per pod[27]. Study conducted among 50 fenugreek genotypes significant variation observed in grain yield, number of pods per plant, seed yield per plant, and eight other traits[28]. Other investigators reported among 40 fenugreek accessions and found significant differences in plant height, primary branches, days of flowering, pods per plant, days to maturity, seed yield per plant, and thousand seed weight[29].
Mean performance of accessions
-
In all traits, there was a wide range of mean performance differences among 160 fenugreek accessions. Days to 50% flowering ranged from 41.14 to 57.04 d, with an overall mean of 51.34 days, while days to 90% maturity ranged from 97.67 to 138.21 d, with an overall mean of 119.32 d (Table 4). Among the four released varieties, 'FGP#1 = 1' was the earliest to attain 50% flowering (48.6 d) and days to 90% maturity (123.3 d) with a low seed yield 888.33 kg/ha while variety 'Ebbisa' was the late to reach 50% flowering (53 d) and days to 90% maturity 133.68 d with a high yield 1,272.12 kg/ha. Accessions flowered and matured 3.125% and 61.875% earlier than the earliest released varieties, respectively.
Table 4. Mean performance for days to flowering and maturity in respect to 12 collection zones, 58 woredas of eight geographic regions.
No. Zone Geo. Reg. Altitude
(m.a.s.l.)No.
woredasNo.
accessionsDays to 50% flowering Days to 90% maturity Min Max Mean SD CV
(%)Min Max Mean SD CV
(%)1 Arsi CE 2,000−2,550 6 11 42.24 57.04 50.88 4.29 8.40 103.97 135.85 117.15 9.88 8.40 2 Shewa CE 2,110−2,700 7 11 49.04 54.64 52.67 1.70 3.20 111.85 133.21 122.09 5.96 4.80 3 Wellega WE 1,950 2 2 50.24 52.04 51.14 1.27 2.40 118.97 123.09 121.03 2.91 2.40 4 Bale SEE 1,850−2,560 2 3 44.24 53.24 47.34 5.10 10.70 106.97 120.07 112.06 7.02 6.20 5 Hararghe EE 1,700 4 5 52.24 57.04 55.00 1.72 3.10 109.67 125.39 121.48 6.63 5.40 6 Borena SEE 1,730 1 1 54.24 119.67 7 Gojam NWE 2,380−2,510 11 47 41.96 56.04 51.18 3.19 6.20 98.17 138.21 118.05 9.58 8.10 8 Wello NEE 1,910−2,880 7 16 41.14 56.24 49.34 4.31 8.70 100.71 132.21 118.89 9.44 7.90 9 Gondar NWE 2,330−2,700 10 48 42.04 56.24 51.17 2.38 4.60 97.67 133.15 119.03 8.53 7.10 10 Tigray NE 2410 6 8 46.04 56.64 52.06 3.44 6.60 105.85 131.21 120.57 9.11 7.50 11 Metekel NWE NA 1 1 52.96 126.15 12 Gamogofa SWE NA 2 2 53.04 53.04 53.04 0.00 0.00 122.95 127.35 125.15 3.11 2.40 13 Released 4 48.60 53.20 50.70 2.13 4.20 123.30 133.68 128.20 4.75 3.70 14 Local 1 50.40 124.06 Overall Minimum 41.14 97.67 Maximum 57.04 138.21 Mean 51.34 119.32 SD 3.06 8.52 CV (%) 2.30 4.19 Geo. Reg. = Geographic Region, Min = Minimum value, Max = Maximum value, SD = Standard deviation, CV (%) = Coefficient of Variation in percent, NA = Altitude not recorded, CE = Central Ethiopia, WE = Western Ethiopia, EE = Eastern Ethiopia, SEE = South-east Ethiopia, NEE = North-east Ethiopia, NWE, = Northwest Ethiopia, NE = Northern Ethiopia, SE = Southern Ethiopia. Bale 47.34, 112.06 and Wello 49.34, 118.89 accessions were early for flowering and maturity, whereas Gamogofa, Arsi, Shewa, Wellega, Hararghe, Borena, Gojam, Gondar, Tigray, and Metekele accessions were late (Table 4). Early maturity accessions were obtained from moist woyna dega (mid altitude), wet dega (high land), and dry woyna dega (mid altitude) agroecologies. The variation in days to flowering and days to maturity observed among accessions provides a great opportunity for breeders to develop varieties for various agroecologies in Ethiopia. Early maturing accessions may be better suited to agroecologies with low rainfall and short duration, whereas late types may be better suited to highland areas with consistent rainfall. The current study results are consistent with those reported previously[7,24] , who found significant differences in days to flowering and days to maturity among 36 and 144 fenugreek accessions, respectively. Another study reported on 36 geographically diverse Ethiopian fenugreek accessions and found 42.5 to 52.5 d to flowering with a mean of 47.1 d and 123.5 to 162 d to maturity with a mean of 141.8 d[30].
Tables 5 & 6 show the mean performance of 12 groups of accessions in relation to the administrative zones where they were collected. The accessions displayed a wide range of variation in plant height at flowering, ranging from 10.86 to 52.14 cm, with a mean height of 30.67 cm. Hunda.ol, the tallest check variety, had a mean plant height of 43.74 cm, and 12.9% of the accessions were taller. The number of primary and secondary branches of accessions ranged from 0.85 to 4.49 and 0.3 to 3.88, respectively, with an overall mean of 2.37 and 1.70. Hundao.la had the highest mean number of primary and secondary branches among the check varieties 4.24 and 2.05, respectively. All accessions had lower mean performance, numbers of primary branches, and plant height than the check variety with the highest mean value (Table 5). Hararghe, Bale, Metekel, and Arsi accessions had a higher mean number of secondary branches than the check variety with the highest mean value. Accessions from Tigray, Gamogofa, Gondar, Borena, Wello, Shewa, Wellega, and Gojam zones, on the other hand, had a lower mean number of secondary branches than the check variety with the highest mean value (Table 6).
Table 5. Mean performance of accessions for growth traits in respect to 12 collection zones, 58 woredas of eight geographic regions.
No. Zone Geo. Reg. Altitude
(m.a.s.l.)No.
woredasNo.
accessionsPlant height at flowering (cm) No. of primary branches Min Max Mean SD CV (%) Min Max Mean SD CV (%) 1 Arsi CE 2,000−2,550 7 11 17.66 45.46 26.95 8.08 29.90 0.85 4.29 2.43 1.21 49.00 2 Shewa CE 2,110−2,700 8 11 18.46 32.94 26.55 4.35 16.40 1.05 4.25 2.48 1.02 41.00 3 Wellega WE 1,950 2 2 25.87 28.46 27.17 1.83 6.80 1.07 3.25 2.16 1.54 71.00 4 Bale SEE 1,850−2,560 2 3 26.06 34.46 30.13 4.21 14.00 1.35 3.60 2.80 1.26 45.00 5 Hararghe EE 1,700 4 5 17.27 39.16 25.52 8.45 33.10 0.85 4.18 2.95 1.35 45.00 6 Borena SEE 1,730 1 1 21.86 2.35 7 Gojam NWE 2,380−2,510 13 47 17.46 48.34 29.71 7.59 25.40 0.95 3.95 1.87 0.81 45.00 8 Wello NEE 1,910−2,880 7 16 10.86 46.16 26.36 7.57 28.70 0.85 3.35 2.03 0.95 46.00 9 Gondar NWE 2,330−2,700 11 48 15.87 52.14 31.86 7.83 24.60 0.86 4.49 2.04 1.13 55.00 10 Tigray NE 2,410 6 8 22.36 40.84 27.70 6.10 22.00 0.95 3.31 1.89 1.00 52.00 11 Metekel NWE NA 1 1 30.85 3.21 12 Gamogofa SWE NA 2 2 47.14 30.64 38.89 15.67 30.00 1.01 3.41 2.21 1.70 76.00 13 Released 4 34.92 43.74 38.98 3.65 9.30 3.68 4.24 3.99 0.24 6.00 14 Local 1 36.40 3.74 Overall Minimum 10.86 0.85 Maximum 52.14 4.49 Mean 30.67 2.37 SD 7.68 1.09 CV (%) 10.63 9.56 Geo. Reg. = Geographic Region, Min = Minimum value, Max = Maximum value, SD = Standard Deviation, CV (%) = Coefficient of variation in percent, NA = Altitude not recorded, CE = Central Ethiopia, WE = Western Ethiopia, EE = Eastern Ethiopia, SEE = Southeast Ethiopia, NEE = Northeast Ethiopia, NWE = Northwest Ethiopia, NE = Northern Ethiopia, SE = Southern Ethiopia. Table 6. Mean performance of accessions from 12 collection zones of eight geographic regions for number of secondary branches.
No. Zone Geo. Reg. Altitude
(m.a.s.l.)No.
woredasNo.
accessionsNo. of secondary branches Min Max Mean SD CV (%) 1 Arsi CE 2,000−2,550 7 11 1.08 3.18 2.10 0.79 37.00 2 Shewa CE 2,110−2,700 8 11 0.30 3.88 1.93 1.21 62.00 3 Wellega WE 1,950 2 2 1.08 2.78 1.93 1.20 62.00 4 Bale SEE 1,850−2,560 2 3 1.28 3.88 2.78 1.35 48.00 5 Hararghe EE 1,700 4 5 1.28 3.88 2.72 1.19 43.00 6 Borena SEE 1,730 1 1 1.68 7 Gojam NWE 2,380−2,510 13 47 0.30 3.48 1.40 0.81 57.00 8 Wello NEE 1,910−2,880 7 16 0.30 2.98 1.62 0.67 41.00 9 Gondar NWE 2,330−2,700 10 48 0.30 3.85 1.58 0.86 54.00 10 Tigray NE 2,410 6 8 0.30 2.95 1.20 0.83 69.00 11 Metekel NWE NA 1 1 2.15 12 Gamogofa SWE NA 2 2 1.15 2.48 1.81 0.94 51.00 13 Released 4 1.82 2.10 1.96 0.14 0.70 14 Local 1 1.78 Overall Minimum 0.30 Maximum 3.88 Mean 1.70 SD 0.91 CV (%) 19.67 Geo.Reg. = Geographic Region, Min = Minimum value, Max = Maximum value, SD = Standard Deviation, CV (%) = Coefficient of variation in percent, NA = Altitude not recorded, CE = Central Ethiopia, WE = Western Ethiopia, EE = Eastern Ethiopia, SEE = Southeast Ethiopia, NEE = Northeast Ethiopia, NWE = Northwest Ethiopia, NE = Northern Ethiopia, SE = Southern Ethiopia. Researchers reported the presence of variation among fenugreek genotypes for growth traits, which agreed with the current study findings. In line with this finding reported existence of significant differences in plant height, number of primary and secondary branches among 36 fenugreek accessions, respectively[30] . Research conducted on 15 and 40 fenugreek accessions collected from various geographic regions indicates significant differences in plant height and number of primary branches[31,29] respectively.
The average pod length (cm) ranged from 4.32 to 12.3 cm, with a mean of 9.58 cm, and the number of pods per plant ranged from 0.19 to 39.23 pods, with a mean of 13.85 pods. The accessions obtained from the Arsi, Hararghe, Gojam, Wello, Gamogofa, and Shewa zones had mean pod lengths greater than the check varieties, but none of the groups of accessions had mean values greater than the check varieties for number of pods per plant (Table 7). Accessions had seed yields per plant ranging from 4.21 to 19.1 g with a mean of 13.07 g and seed yields per pod ranging from 0.72 to 5.91 g with a mean of 3.80 g, respectively. The accessions obtained from Wello, Metekel, Arsi, Shewa, and Bale zones had higher mean seed yield per plant than the check varieties, while only Borena accessions had higher mean values for number of seed per pod than the check varieties (Table 8). The weights of 1,000 seeds ranged from 10.05 to 36.97 g, with a mean weight of 18.75 g. The mean thousand seed weight of accessions obtained from Gamogofa, Tigray, Gondar, Wello, Hararghe, Bale, Borena, and Shewa was higher than that of released check varieties (Table 9). The observed differences in yield components among accessions suggested a higher chance of obtaining accessions with higher mean values than commercial varieties to be developed as improved varieties.
Table 7. Mean performance of accessions for yield components in respect to 12 collection zones, 58 woredas of eight geographic regions.
No. Zone Geo. Reg. Altitude
(m.a.s.l.)No.
woredasNo.
accessionsAverage pod length (cm) No. of pods per plant Min Max Mean SD CV (%) Min Max Mean SD CV (%) 1 Arsi CE 2,000−2,550 7 11 9.25 10.86 10.04 0.54 7.00 4.35 36.63 17.24 11.28 65.00 2 Shewa CE 2,110−2,700 8 11 7.82 10.60 9.41 0.71 8.00 2.65 38.73 13.53 12.28 90.00 3 Wellega WE 1,950 2 2 8.20 9.54 8.87 0.95 11.00 5.55 23.35 14.45 12.59 87.00 4 Bale SEE 1,850−2,560 2 3 8.35 9.45 9.08 0.64 7.00 13.05 21.05 16.05 4.36 27.00 5 Hararghe EE 1,700 4 5 8.85 10.85 9.63 0.78 8.00 5.15 24.25 11.02 7.83 71.00 6 Borena SEE 1,730 1 1 9.75 6.25 7 Gojam NWE 2,380−2,510 13 47 8.11 12.25 9.84 0.85 9.00 1.09 38.73 13.25 2.34 17.00 8 Wello NEE 1,910−2,880 7 16 8.57 12.32 10.00 0.97 10.00 1.95 26.83 11.01 8.66 78.00 9 Gondar NWE 2,330−2,700 10 48 4.32 11.92 9.31 1.22 13.00 0.95 39.23 13.20 10.13 76.00 10 Tigray NE 2,410 6 8 7.53 10.82 9.33 1.01 11.00 0.19 26.83 14.13 9.93 70.00 11 Metekel NWE NA 1 1 7.83 6.19 12 Gamogofa SWE NA 2 2 10.00 13.62 11.81 2.56 22.00 6.19 24.09 15.14 12.66 83.00 13 Released 4 8.80 10.10 9.35 0.63 6.70 16.72 19.78 18.40 1.36 7.40 14 Local 1 9.19 19.08 Overall Minimum 4.32 0.19 Maximum 12.3 39.23 Mean 9.58 13.85 SD 1.04 9.60 CV (%) 7.61 13.80 Geo. Reg. = Geographic Region, Min = Minimum value, Max = Maximum value, SD = Standard Deviation, CV (%) = Coefficient of variation in percent, NA = Altitude not recorded, CE = Central Ethiopia, WE = Western Ethiopia, EE = Eastern Ethiopia, SEE = Southeast Ethiopia, NEE = Northeast Ethiopia, NWE = Northwest Ethiopia, NE = Northern Ethiopia, SE = Southern Ethiopia. Table 8. Mean performance of accessions from 12 collection zones of eight geographic regions for yield component and yield.
No. Zone Geo. Reg. Altitude
(m.a.s.l.)No.
woredasNo.
accessionsNo. of seed per pod Seed yield per plant (g) Min Max Mean SD CV (%) Min Max Mean SD CV (%) 1 Arsi CE 2,000−2,550 7 11 9.19 14.50 12.98 1.51 13.00 1.20 4.86 3.94 1.12 28.00 2 Shewa CE 2,110−2,700 8 11 11.29 14.82 13.65 0.98 7.00 1.95 4.82 3.90 0.90 23.00 3 Wellega WE 1,950 2 2 7.49 14.00 10.75 4.60 43.00 3.46 3.92 3.69 0.33 8.90 4 Bale SEE 1,850−2,560 2 3 6.49 13.49 10.02 3.50 35.00 3.27 4.48 4.25 0.64 15.00 5 Hararghe EE 1,700 4 5 7.83 14.80 11.88 2.59 22.00 3.09 4.47 3.52 0.59 17.00 6 Borena SEE 1,730 1 1 14.59 1.09 7 Gojam NWE 2,380−2,510 13 47 4.20 16.75 13.25 2.34 43.00 1.24 5.33 3.76 0.96 25.00 8 Wello NEE 1,910−2,880 7 16 5.21 16.20 12.96 2.38 18.00 0.72 5.30 4.07 1.06 26.00 9 Gondar NWE 2,330−2,700 10 48 5.60 17.40 13.28 2.11 16.00 1.06 5.91 3.82 1.10 28.00 10 Tigray NE 2,410 6 8 5.59 15.70 11.99 3.05 25.00 1.98 4.34 3.54 0.88 24.00 11 Metekel NWE NA 1 1 11.35 3.97 12 Gamogofa SWE NA 2 2 12.43 12.56 12.49 0.09 1.00 0.89 4.25 2.57 2.38 92.00 13 Released 4 12.98 14.84 13.80 0.81 5.90 3.29 4.27 3.85 0.41 10.60 14 Local 1 13.12 4.23 Overall Minimum 4.20 0.72 Maximum 19.10 5.91 Mean 13.07 3.80 SD 2.23 1.02 CV (%) 8.17 17.75 Geo. Reg. = Geographic Region, Min = Minimum value, Max = Maximum value, SD = Standard Deviation, CV (%) = Coefficient of variation in percent, NA = Altitude not recorded, CE = Central Ethiopia, WE = Western Ethiopia, EE = Eastern Ethiopia, SEE = South-east Ethiopia, NEE = North-east Ethiopia, NWE = Northwest Ethiopia, NE = Northern Ethiopia, SE = Southern Ethiopia. Table 9. Mean performance of accessions for yield in respect to 12 collection zones, 58 woredas of eight geographic regions.
No. Zone Geo. Reg. Altitude
(m.a.s.l.)No.
woredasNo.
accessionsThousand seed weight (g) Yield (kg/ha ) Min Max Mean SE CV (%) Min Max Mean SE CV (%) 1 Arsi CE 2,000−2,550 7 11 6.69 23.09 16.34 4.18 26.00 428.12 1,404.22 1,105.40 381.68 34.00 2 Shewa CE 2,110−2,700 8 11 15.45 35.59 21.56 5.75 27.00 633.57 1,318.85 914.64 249.46 27.00 3 Wellega WE 1,950 2 2 16.49 19.37 17.93 2.04 11.00 747.99 1,338.18 1,043.07 417.32 40.00 4 Bale SEE 1,850−2,560 2 3 11.79 33.69 20.12 11.85 59.00 1,213.53 1,971.22 1,499.49 411.59 27.00 5 Hararghe EE 1,700 4 5 10.69 33.89 18.57 9.49 51.00 534.32 1,422.98 949.41 361.71 38.00 6 Borena SEE 1,730 1 1 14.19 250.18 7 Gojam NWE 2,380−2,510 13 47 10.05 36.96 18.19 4.98 28.00 278.77 2,275.33 1,026.24 356.63 34.00 8 Wello NEE 1,910−2,880 7 16 10.51 23.47 18.39 4.10 22.00 327.52 1,285.65 871.08 367.16 40.00 9 Gondar NWE 2,330−2,700 10 48 10.51 34.27 19.75 4.65 24.00 401.59 2,101.63 1,007.89 396.48 39.00 10 Tigray NE 2,410 6 8 11.25 24.35 18.89 4.56 24.00 720.25 1,411.27 1,060.22 252.91 23.00 11 Metekel NWE NA 1 1 17.81 1,152.38 12 Gamogofa SWE NA 2 2 19.51 21.91 20.71 1.70 8.00 1,048.02 1,444.48 1,246.26 280.33 22.00 13 Released 4 17.24 19.60 18.32 1.09 5.94 888.33 1,272.12 1,078.58 182.44 16.90 14 Local 1 14.82 1,004.87 Overall Minimum 10.05 250.09 Maximum 36.97 2,275.33 Mean 18.75 1,035.53 SD 5.00 394.88 CV (%) 13.65 12.87 Geo. Reg. = Geographic Region, Min = Minimum value, Max = Maximum value, SD = Standard Deviation, Yield kg/ha = yield kg per hectare in, CV (%) = Coefficient of variation in percent, NA = Altitude not recorded, CE = Central Ethiopia, WE = Western Ethiopia, EE = Eastern Ethiopia, SEE = Southeast Ethiopia, NEE = Northeast Ethiopia, NWE = Northwest Ethiopia, NE = Northern Ethiopia, SE = Southern Ethiopia. The current study results are also consistent with those reported by Feysal[24], who found significant differences in number of pods per plant, number of seeds per pod, and thousand seed weight among 36 fenugreek accessions. A wide range of differences in the number of pods per plant, thousand seed weight, and seed yield per plant among 144 fenugreek accessions was reported[7]. There are significant differences in number of pods per plant and seed yield per pod among 36 fenugreek accessions collected from different parts of Ethiopia[30] and significant differences in number of pods per plant among 16 accessions.
The minimum and maximum yields of fenugreek accessions were 250.09 and 2,275.33 kg/ha, respectively, with a mean yield of 1,035.33 kg/ha (Table 9). A total of 40 accessions outperformed the high yielding check variety, Ebbisa (1,272.12 kg/ha) by 25%. The mean yield of accessions obtained from the Bale, Arsi, Metekele, and Gamogofa zones was higher than the mean yield of check varieties, whereas accessions obtained from Tigray, Wello, Gondar, Gojam, Wellega, Borena, Shewa, and Hararghe zones had a lower mean yield than the mean yield of check varieties (Table 9).
Accessions obtained from moist wet dega (high land), moist woyna dega (mid altitude), dry woyna dega (mid altitude), and dry kola (low land) had higher mean yield per plant and per hectare, whereas accessions obtained from wet woyna dega (mid altitude) had lower yields. The observed mean yield variations among accessions, as well as the significant number of accessions that outperformed released varieties for yield, suggested that the success of yield improvement is high through selection of high performing accessions and further evaluation. Scholars reported among 16 and 36 genotypes of fenugreek accessions for yield 1,259 to 2,222 kg/ha and 763.55 to 2,076.44 kg/ha[24,32] respectively.
Estimate of genetic distances and clustering of accessions
-
Euclidean distances (ED) were calculated for pairs of accessions as an estimate of genetic distances among 160 fenugreek accessions. Table 10 compares the mean ED of each accession to the other 159 accessions. The ED between 12,720 accession pairs ranged from between Fgcoll2007369 and Fgcoll207375 to 10.6 between Fgcoll207375 and Fgcoll53093. The overall mean ED was 4.54, with a standard deviation of 1.00 and a coefficient of variation of 22.19, respectively (Table 10).
Table 10. Mean Euclidian distances of accessions estimated from 11 agromorphological traits.
No. Genotype Min Max Mean SD CV (%) 1 FgColl53006 2.71 7.23 4.58 0.9 19.01 2 FgColl53072 3.43 7.46 5.39 0.9 16.07 3 FgColl53075 2.41 6.46 4.38 0.9 19.74 4 FgColl216898 2.14 8.18 4.65 0.9 19.59 5 FgColl53079 1.52 7.57 3.72 1.1 28.8 6 FgColl230067 2.72 7.55 5.08 0.9 18.03 7 FgColl232194 1.63 7.78 4.63 1.1 24.29 8 FgColl232195 1.63 7.6 4.27 1.1 25.31 9 FgColl236992 1.67 7.05 4.08 1 23.83 10 FgColl216900 2.58 8.05 4.96 1 19.31 11 FgColl216899 2.88 7.68 5.26 1 19.8 12 FgColl53023 2.28 7.3 4.95 1.1 21.77 13 FgColl53086 1.87 7.1 4.13 1 24.87 14 FgColl239073 2.03 7.34 4.03 1 25.32 15 FgColl212549 2.58 7.89 5.14 1 20.18 16 FgColl212552 1.24 6.71 4.39 1 23.02 17 FgColl53106 2.09 7.51 4.29 1.1 25.27 18 FgColl229246 1.5 7.52 3.84 1.2 30.78 19 FgColl229244 1.93 8.05 4.67 1 20.51 20 FgColl237982 2.15 7.7 4.57 1 22.38 21 FgColl53088 1.86 7.49 4.12 1.1 25.55 22 FgColl53002 1.68 6.54 3.61 1 26.93 23 FgColl53085 2.94 7.89 4.84 0.9 18.48 24 FgColl212877 2.8 7.97 5.51 1 18.53 25 FgColl215406 3.83 8.64 6.12 0.9 14.87 26 FgColl53090 2.48 7.51 4.82 0.9 18.19 27 FgColl215820 1.68 7.34 3.63 1.1 31.44 28 FgColl208680 3.71 9.44 6.22 1 15.44 29 FgColl207378 2.66 7.75 5.27 1 19.52 30 FgColl230540 1.85 7.49 3.93 1 24.86 31 FgColl230882 2.2 7.39 4.57 1 21.97 32 FgColl216830 2.19 7.93 4.53 1.1 24.28 33 FgColl219343 2.21 8.01 5.03 1.1 21.92 34 FgColl215334 1.59 6.51 4.46 0.8 18.17 35 FgColl53027 1.62 7.53 4.42 1 22.43 36 FgColl53026 2.68 7.43 5.26 0.9 17.58 37 FgColl53035 1.71 6.91 3.88 0.9 23.36 38 FgColl53029 2.09 7.02 4.63 1 21.27 39 FgColl53028 2.46 8.54 4.77 1.2 24.21 40 FgColl53042 2.19 7.89 4.27 1.2 27.12 41 FgColl53043 1.13 7.47 3.82 1.11 29.19 42 FgColl53041 1.68 6.56 3.89 0.99 25.31 43 FgColl212775 1.24 6.65 4.1 1.03 25.03 44 FgColl53097 3.44 8.5 5.58 0.95 17.07 45 FgColl53098 1.66 7 3.77 1.05 27.9 46 FgColl53099 1.67 7.43 3.94 1.01 25.65 47 FgColl53081 1.21 7.12 3.83 1.11 29.14 48 FgColl53076 2.57 8.46 4.82 0.99 20.62 49 FgColl53078 2.3 7.98 4.59 1.03 22.36 50 FgColl2007369 0.07 7.55 5.35 1.04 19.41 51 FgColl53021 2.45 8.44 4.53 1.02 22.46 52 FgColl239062 2.17 9.67 5.93 1.02 17.22 53 FgColl239063 1.1 8.1 3.93 1.16 29.59 54 FgColl239064 2.35 7.78 4.98 1.02 20.41 55 FgColl212776 1.66 7.69 4.17 1.05 25.17 56 FgColl212777 1.88 6.73 3.87 0.9 23.35 57 FgColl53107 3.39 8.86 5.65 1.03 18.23 58 FgColl215335 1.13 7.5 4.12 1.1 26.59 59 FgColl53047 1.35 7.04 4 1.05 26.31 60 FgColl53048 1.75 7.45 4.18 1.05 25.03 61 FgColl53049 2.1 8.34 4.51 1.12 24.79 62 FgColl236621 3.37 8.44 5.84 0.91 15.52 63 FgColl236622 1.8 8.27 4.22 1.18 27.92 64 FgColl53054 2.7 7.72 5.11 0.95 18.57 65 FgColl53055 1.62 8.16 4.68 1.09 23.33 66 FgColl53056 2.3 7.64 4.84 1.04 21.56 67 FgColl53071 1.5 7.07 3.8 1.13 29.7 68 FgColl53063 2.29 7.48 4.86 1.05 21.5 69 FgColl53037 1.89 7.84 4.05 1.04 25.67 70 FgColl53039 1.81 7.91 4.2 1.1 26.12 71 FgColl53040 2.32 7.92 4.16 0.9 21.63 72 FgColl53057 2.31 7.48 4.63 0.94 20.31 73 FgColl53058 1.44 7.66 3.91 1.05 26.74 74 FgColl53059 2.09 8.18 3.97 1.06 26.64 75 FgColl53044 2.39 7.45 3.87 0.83 21.35 76 FgColl23045 1.59 6.27 4.2 0.82 19.54 77 FgColl53046 2.36 7.93 4.95 0.92 18.56 78 FgColl215261 2.27 7.76 4.33 1.09 25.05 79 FgColl213116 1.96 6.99 4.24 0.96 22.69 80 FgColl213115 2.25 7.24 4.96 0.94 18.93 81 FgColl213114 1.72 7.17 3.72 1 27.3 82 FgColl212657 1.78 7.38 4.47 1 22.22 83 FgColl215731 1.77 8.16 4.18 1.1 25.78 84 FgColl213111 1.71 6.64 4.06 0.9 21.75 85 FgColl213112 1.73 7.26 3.95 1.1 27.1 86 FgColl53013 1.99 6.98 3.78 0.9 24.84 87 FgColl53014 2.65 8.92 5.85 1 17.56 88 FgColl53102 4.4 10.3 6.52 0.9 14.48 89 FgColl53103 2.23 7.84 4.49 1.1 24.17 90 FgColl53104 2.23 7.65 4.24 1.1 25.96 91 FgColl53105 1.83 7.86 4.12 1.2 28.09 92 FgColl226090 0.55 7.6 4.03 1.2 29.61 93 FgColl53012 3.31 8.32 5.7 0.9 16.43 94 FgColl208463 2.34 8.04 4.71 0.9 19.12 95 FgColl207379 3.43 8.25 5.26 1 19.13 96 FgColl207370 2.57 8.01 4.51 0.9 20.74 97 FgColl207380 1.6 7.22 3.88 1.1 27.75 98 FgColl207395 2.37 8.73 5.01 1.1 21.2 99 FgColl207393 1.88 7.15 3.86 0.9 23.97 100 FgColl207394 1.98 8.3 5.18 10 18.56 101 FgColl207384 2.02 6.97 4.17 1 24.45 102 FgColl207385 1.44 6.61 3.86 1.1 27.26 103 FgColl207386 2.71 8.36 4.79 0.9 19.64 104 FgColl207369 0.07 7.55 5.35 1 19.39 105 FgColl207371 2.3 7.87 4.4 1 23.32 106 FgColl207381 2.17 7.69 4.54 1.1 24.5 107 FgColl207382 1.87 7.11 4.19 1 24.22 108 FgColl207383 1.68 7.44 3.87 1.1 28.83 109 FgColl207375 4.7 10.6 7.26 1 13.41 110 FgColl207376 2.48 7.19 4.38 1 23.61 111 FgColl207377 1.1 8.7 4.4 1.2 27.15 112 FgColl212779 2.39 9.24 4.82 1.2 23.94 113 FgColl208035 2.32 7.26 4.5 1 21.91 114 FgColl207396 1.77 7.43 4.02 1 25.75 115 FgColl207366 1.82 7.6 3.78 1 25.93 116 FgColl207367 1.99 7.27 4.59 1.1 23.07 117 FgColl228558 3.26 9.44 5.49 1 18.78 118 FgColl227227 2.5 8.85 5.33 1.1 19.92 119 FgColl205176 1.95 6.48 4 0.8 20.07 120 FgColl53108 4.08 9.67 6.15 1 16.73 121 FgColl53109 2.38 7.39 4.92 1.01 20.56 122 FgColl207354 1.47 6.36 3.71 0.9 24.16 123 FgColl207355 2.52 8.33 4.91 1.05 21.46 124 FgColl207356 0.55 7.56 4.19 1.2 28.74 125 FgColl207387 2.08 6.49 3.86 0.79 20.54 126 FgColl207388 2.74 7.29 4.76 0.93 19.47 127 FgColl207389 2.09 7.17 4.15 0.95 22.98 128 FgColl207390 2.17 6.85 4.36 0.86 19.83 129 FgColl07391 1.67 7.63 4.07 1.11 27.17 130 FgColl207392 2.94 8.6 5.13 0.95 18.41 131 FgColl207372 1.44 7.59 3.75 1.02 27.29 132 FgColl207373 1.99 6.98 3.85 0.88 22.89 133 FgColl207374 3.13 7.51 5.21 0.91 17.54 134 FgColl207361 1.67 7.35 3.98 1.08 27.17 135 FgColl207357 1.99 7.02 4.17 0.96 23.02 136 FgColl207358 2.87 7.92 5.36 1.06 19.7 137 FgColl207362 2.38 7.3 4.66 0.95 20.4 138 FgColl207364 1.44 6.97 3.79 1.09 28.77 139 FgColl207365 2.84 7.94 5.26 0.92 17.52 140 FgColl53008 2.47 8.96 4.57 1.04 22.67 141 FgColl53009 1.95 6.68 3.66 0.92 25.22 142 FgColl239065 2.58 7.65 4.88 1.08 22.06 143 FgColl229846 2.38 9.32 4.94 1.1 22.24 144 FgColl219509 1.35 7.02 4.07 1.08 26.57 145 FgColl53092 1.93 7.18 4.07 0.91 22.27 146 FgColl53093 3.6 10.6 5.79 1.02 17.57 147 FgColl53094 2.57 8.06 4.95 0.82 16.66 148 FgColl238247 1.71 7 4.02 0.96 23.96 149 FgColl220026 2.11 7.44 4.92 0.98 19.91 150 FgColl220027 1.74 7.58 4.33 1.08 24.99 151 FgColl235133 1.93 7.18 3.91 0.92 23.53 152 FgColl207368 1.98 8.56 5.25 1.06 20.15 153 FgColl9562 2.26 6.7 4.29 0.87 20.27 154 FgColl215585 1.21 7.47 3.8 1.11 29.09 155 FgColl207599 2.45 8.81 5.13 1.15 22.45 156 Chala 0.98 6.72 4.08 0.92 22.65 157 Ebbisa 1.37 7.36 4.39 0.97 22.01 158 Hunda,ola 1.37 7.14 4.54 0.95 20.82 159 FGP# = 1 0.98 6.07 3.77 0.88 23.3 160 Local 1.1 5.97 3.85 0.9 23.29 Overall 0.07 10.6 4.54 1 22.19 Min = Minimum, Max = Maximum, SD = Standard deviation, CV (%) = Coefficient of Variation in percent. Unweighted Pair-Group Method with Arithmetic Means (UPGMA) methods based on the Euclidean distance (ED) matrix were used to cluster accessions. The dendograms constructed at cut point 3.54 (ED of accessions minus standard deviation) resulted in the grouping of 160 fenugreek accession into two different clusters, indicating a high level of genetic diversity among the accessions (Fig. 1). The clustering of accession in the current study is useful to breeders. A representative accession from a specific cluster may be chosen for genetic base enhancement. Individual or group differences in phenotypic diversity are caused by differences in genetic composition and the environment in which they are grown[33]. Cluster analysis is used to individuals belonging based on the characteristics they share. Individuals are mathematically grouped together in the same cluster because their descriptions are similar. If the classification is successful, individuals within a cluster will be closer when plotted geometrically, while individuals from different clusters will be farther apart[34]. Genotypes within a cluster are considered to be relatively similar, whereas genotypes between clusters are more dissimilar, and estimates the extent of diversity among accessions[35].
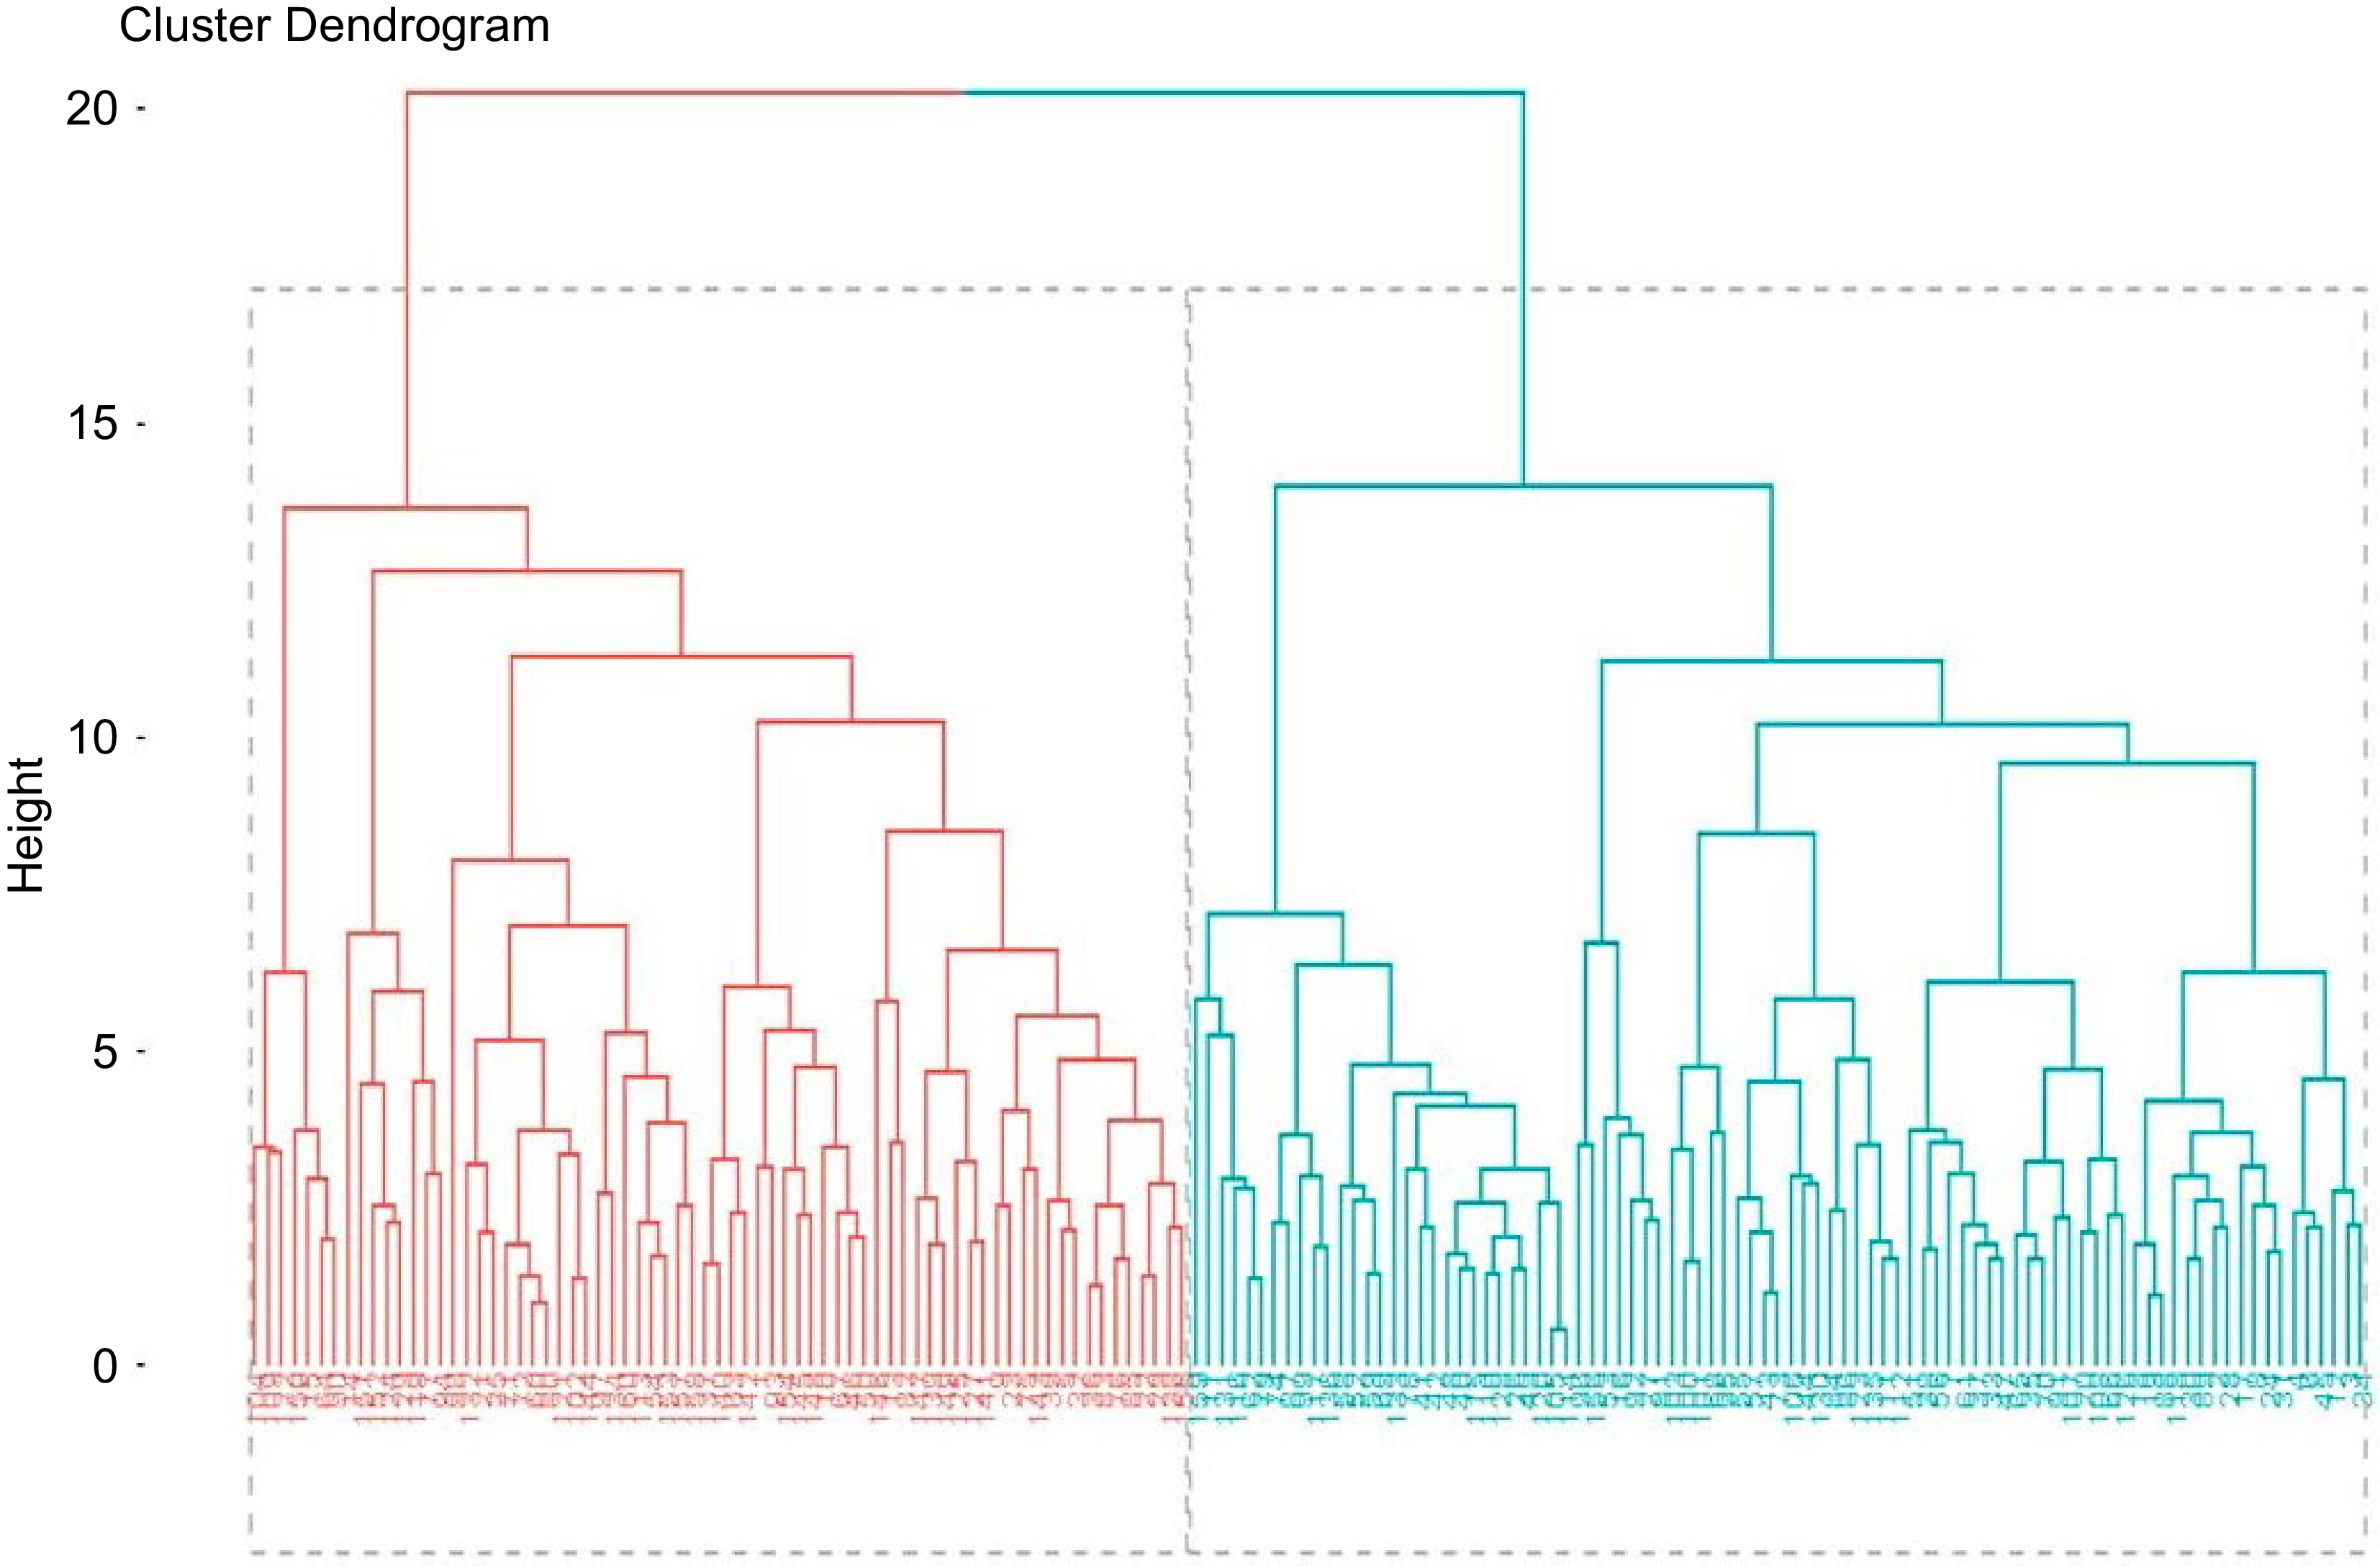
Figure 1.
Dendrogram from UPGMA of 160 fenugreek accession for 11 traits.
In the current study, the wide range of genetic distances 0.07 to 10.6 among pairs of accession was observed and accession were grouped into two distinct clusters indicated the presence of genetic diversity among 160 fenugreek accessions. In cluster analysis, one of the important aspects is constructing the optimal number of clusters or number of acceptable clusters which involves deciding where to 'cut' a dendrogram to find the true or natural groups. In this study, the cut point was less than the overall mean Euclidean distances by the standard deviation of accession distances. Therefore, the two major groups could be considered as true groups based on the clustering method used. A group consisted of more accession and an acceptable cluster is when the within-cluster genetic distance is less than the overall mean genetic distance and between cluster distances greater than within cluster distance of the two clusters involved[36].
Research conducted among 30 fenugreek genotypes indicated that genotypes are grouped into nine clusters, whereas 167 fenugreek genotypes clustered into four major groups based on morphological traits such as plant height, days to flowering, branches per plant, pods per plant, pod length, seeds per pod, test weight, seed yield per plant[31,37]. The 144 fenugreek accessions were grouped into nine clusters based on Mahalanobis' D2 statistic. Researchers evaluated and reported 36 fenugreek accessions for 17 agro-morphological traits and grouped the accessions into eight distinct clusters[24].
Table 10 shows the mean ED calculated for each accession by averaging a specific accession to the other 159 accession. The average distance (ED) was calculated to determine which accession (s) were closest or farthest away from others. As a result, 149 had mean ED values ranging from 3.61 to 5.51, with the overall mean ED minus and plus standard deviation values of 3.54 and 5.54 indicating that the accession had average genetic distances. In contrast, nine accessions had mean ED ranging from 5.58 to 6.22, which was between 5.54 (overall mean ED + SD) and 6.54 (overall mean ED + 2SD), and the other two had mean ED > 6.54. This indicated that these accessions had significantly higher mean ED than the overall mean ED and that they were distant from other accessions. Accession with values between mean SD may be considered to have average distances to others, while those with values (mean-SD) and (mean-2SD) may be considered to have lower mean distances to others than the average distance of accessions.
These findings indicate that these additions may be considered desirable for inclusion in the crossing program[38]. FgColl207375 was the most distant from other fenugreek accessions, followed by FgColl53102, with mean EDs of 7.26 and 6.52, respectively. FgColl53002 (3.61) and FgColl215820 (3.63), on the other hand, were the closest to other fenugreek accessions. Greater distances were found to be more important for improving desirable traits than closer proximity. According to Rahim[39], who demonstrated that hybrids of genotypes with the greatest distance resulted in the highest yield, crosses between these accessions can be used in breeding programs to achieve maximum heterosis.
The 11 traits distant accessions were distinguished by high mean values for FgColl207375, FgColl53102, FgColl53108, FgColl208680, and FgColl215406 and low mean values for FgColl53002, FgColl215820, FgColl53009, and FgColl207354. That suggested that this accession could be used in crossing programs and/or further evaluated to obtain hybrids or improved varieties with higher mean values for Chala, Ebbisa, Hundao'la, and FGP# = 1 than the fenugreek population studied. that the high level of diversity and genetic distance in fennel land-races is beneficial for breeding[40]. According to Ghaderi et al.[41], increasing parental distance implies a large number of contrasting alleles at the desired loci, followed by recombination of these loci in the F2 and F3 generation. As recombination is expected from crosses involving parents from the distance clusters, the greater the opportunities for effective selection for yield factors will be following a cross of distantly related parents.
Some of the clusters may contain accession with high mean values for some traits, but the clusters also contained accession with lower mean values for yield and other desirable traits, making them difficult to consider in future breeding programs. Therefore, the consideration of accession for fenugreek breeding programs from these clusters needs to be evaluation and selection of individual accession for higher mean values for some desirable traits and without having lower mean values for other desirable traits. Low mean performance of clusters implies difficulty to select traits for direct selection and further improvement.
The results of genetic distances and cluster analyses revealed that geographical location was one of the isolation factors that contributed to accessions variability, either by enhancing free exchange of genotypes among nearby geographic regions or by hindering exchange due to geographic distance. The current study findings are consistent with those of Balai et al.[42] in fenugreek, who found significant diversity among genotypes from different geographical origins and a good opportunity for improvement through hybridization and selection by crossing from different clusters. In contrast scholars that conduct research reported that no genetic differentiation among fenugreek genotypes due to geographic origins[43,44].
Principal component analysis
-
The principal component analysis revealed that five principal components with Eigenvalues of 17.9, 15.2, 12.3, 11.1, and 9.4 accounted for 65.9% of the total variation (Fig. 2a). The first two principal components, PC1 and PC2 contributed the most to total variability, with proportion values of 17.9 and 15.2 respectively as shown in Fig. 2b. Characters with the highest absolute value are closer to zero, according to Chahal & Gosal[45]. As a result, the differentiation of genotypes into different clusters in the current study was due to the cumulative effect of a number of traits rather than a small contribution from each trait.
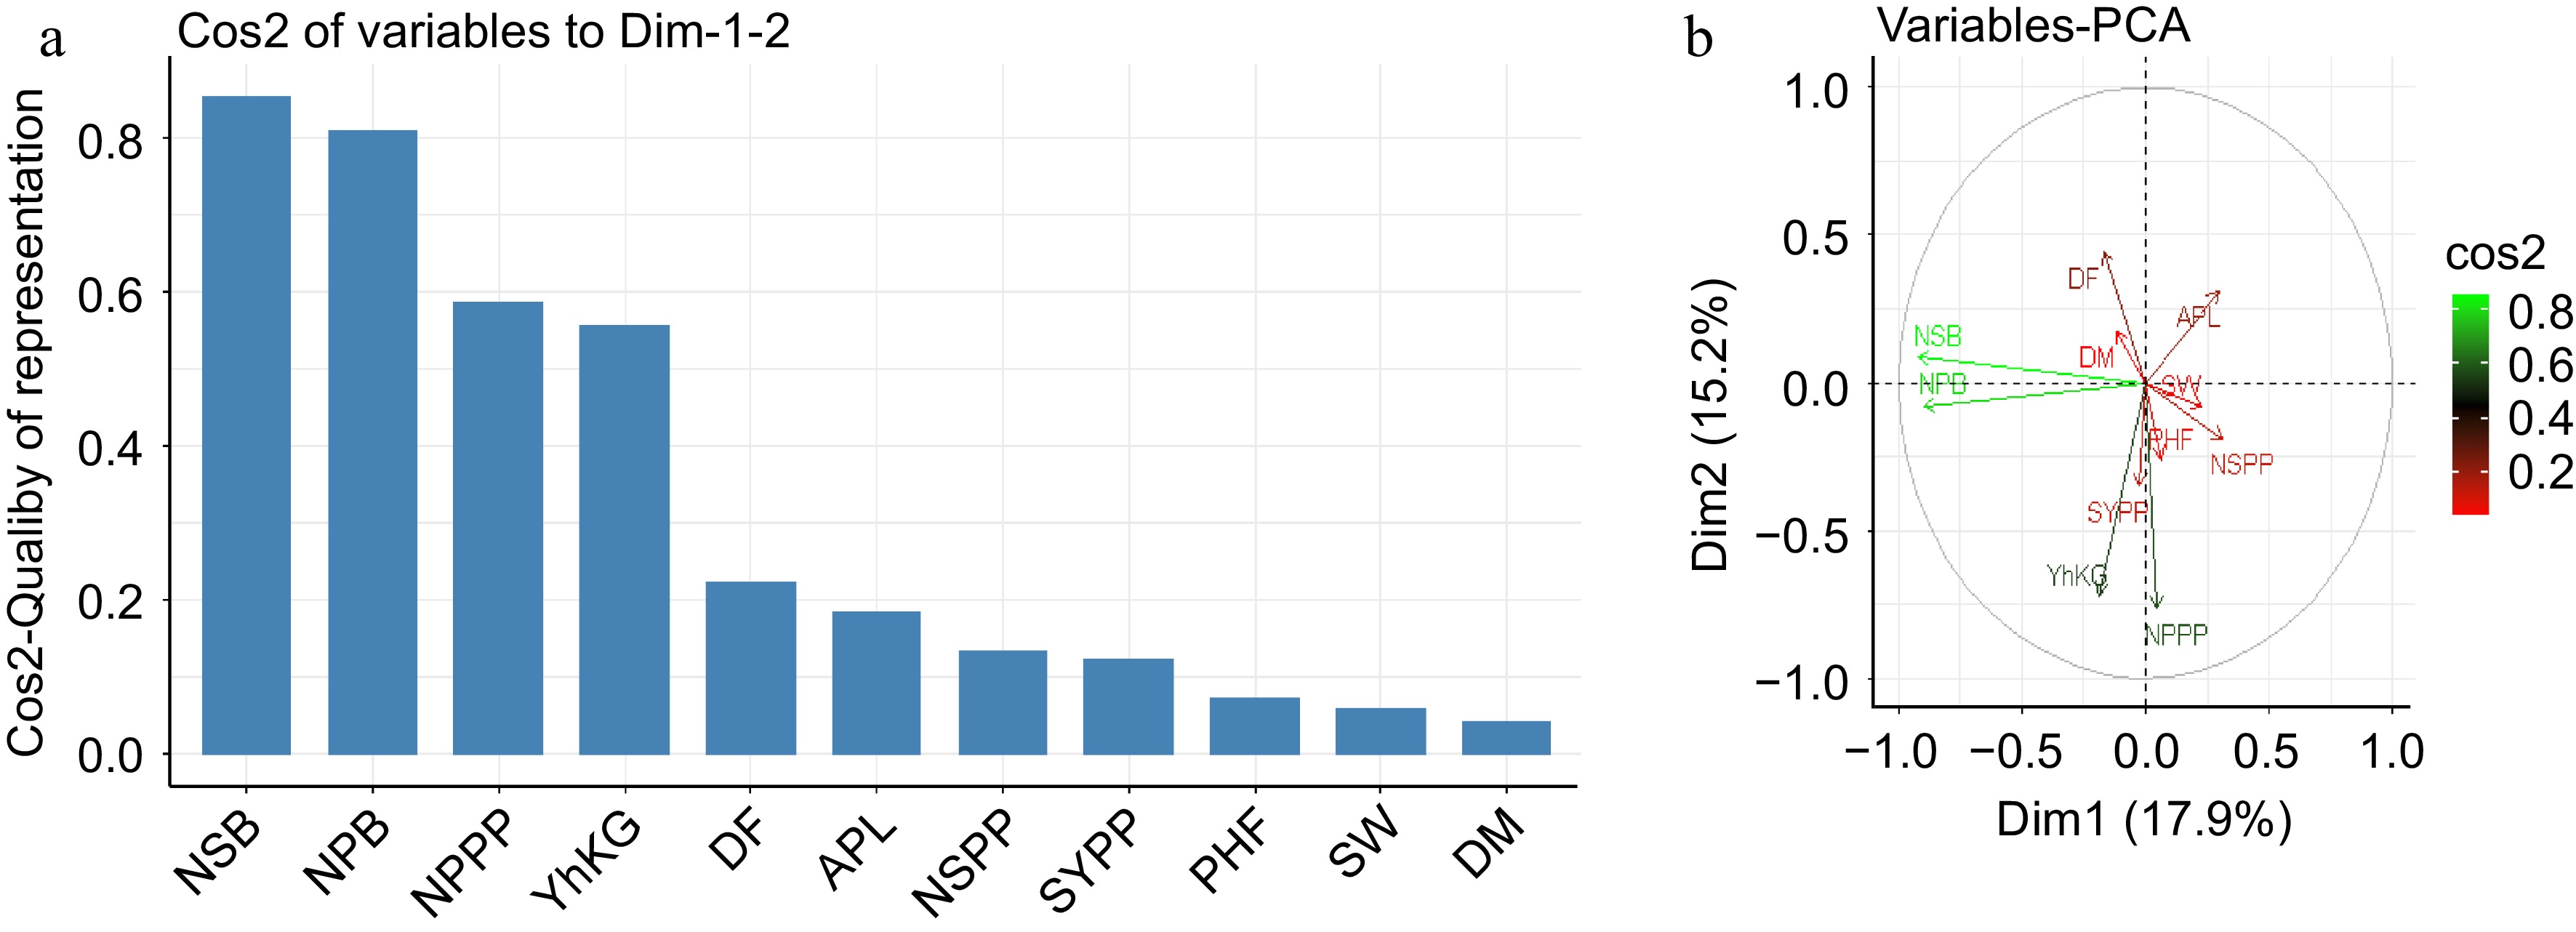
Figure 2.
Eigenvalues and vectors of the correlation matrix for 11 traits accession. (a) Trait's contribution. (b) Relationship of parameters.
Thus, traits with relatively higher values in the first principal component (PC1), such as the number of seeds per pod and number of pods per plant contributed more to total variability and, ultimately, differentiated the accession clusters. The second principal component included the number of secondary branches, number of primary branches and seed yield kg per hectare as indicated in Fig. 2b.
According to the principal component analysis, the first three PCA explained 33.1% of the total variation among the accession. Positive contributors to the PCA included number of seeds per pod and number of pods per plant. When compared to other components, the first principal component contributes the most variability in the data as shown in Fig. 2b & c. The results showed that the PCA can be used to understand potential traits for breeding material selection and evaluation. Research reported in fenugreek accessions shows that, the first PCA contributes more variability than the other components of PCA[37]. Days to flowering, days to maturity, and thousand seed weight were also linked to second PCA in chickpea, according to Malik[46]. Findings reported in other investigation shows that the first PCA was associated with number of pods per plant, seed yield per plant, plant height at flowering and number of secondary branches while second PCA with days to flowering and days to maturity in chickpea[47].
-
Evidence on the extent and pattern of genetic variability in a crop population is required to design crop improvement breeding strategies. For all traits, analysis of variance revealed significant differences between test accessions. This suggested that there were significant variations among accessions that could be used in breeding programs to develop varieties. The findings also support further genetic analysis of all of the studied characters. As a result, for number traits, higher values of genotypic (GCV) and phenotypic (PCV) coefficients of variation were estimated. This indicates that these traits were highly heritable, and that improvement of these traits could be accomplished through the selection of high performing genotypes. The large genetic distances between accessions were evident when measured in terms of Euclidean distances.
Based on the Euclidean distance (ED) matrix and dendogram constructed using the Unweighted Pair-Group Method with Arithmetic Means, the 160 fenugreek land-races were divided into two different clusters (UPGMA). The accession from south western Ethiopia had the greatest genetic distance to all groups of accessions and check varieties, ranging from 3.01 to 3.88, with the highest mean ED of 3.44. This demonstrated that geographical location was one isolation factor that contributed to diversity in accessions and can enhance or hinder the possibility of free exchange of breeding materials nearby. In general, the results of diversity analyses indicated that fenugreek accessions were diverse, implying a higher chance of crop improvement through crossing of distant genotypes through selection of accessions for high mean performance of traits of interest.
The principal component analysis revealed that five principal components (PC1 through PC5, with eigenvalues of 17.9, 15.2, 12.3, 11.1, and 9.4, respectively) accounted for 65.9% of the total variation. As a result, the differentiation of the accessions into different clusters in the current study was due to the cumulative effect of a number of traits rather than the contribution of a few major traits. The current study suggested that the accessions stored at the Ethiopian Biodiversity Institute had significant genetic variability. Thus, there is an excellent opportunity to contribute to farmers' food security and livelihoods by improving fenugreek through selection and hybridization, which involves crossing distant accessions from different clusters with various combinations of advantageous traits.
-
The authors confirm contribution to the paper as follows: conceptualization and writing of manuscript, data collection, structural arrangement of manuscript: Roba R; proof reading and technical advice, advice on the design of the manuscript: Mohammed W. Both authors reviewed the results and approved the final version of the manuscript.
-
The data are not included due to third party rights but analysed data during the study are available from the corresponding author on reasonable request.
This research was supported by the McKnight Foundation's Legume Diversity Project, Ethiopia, by providing financial support for the research.
-
The authors declare that they have no conflict of interest.
- Copyright: © 2024 by the author(s). Published by Maximum Academic Press, Fayetteville, GA. This article is an open access article distributed under Creative Commons Attribution License (CC BY 4.0), visit https://creativecommons.org/licenses/by/4.0/.
-
About this article
Cite this article
Roba R, Mohammed W. 2024. Genetic variability of fenugreek (Trigonella foenum-graecum L.) accessions from agroecological and morphoagronomic traits, Ethiopia. Beverage Plant Research 4: e014 doi: 10.48130/bpr-0024-0003 

Genetic variability of fenugreek (Trigonella foenum-graecum L.) accessions from agroecological and morphoagronomic traits, Ethiopia
- Received: 27 September 2023
- Revised: 11 January 2024
- Accepted: 16 January 2024
- Published online: 23 April 2024
Abstract: To develop crops through selection or hybridization, evidence of accession variability is required. The purpose of this study was to collect information on the variability of Trigonella foenum-graecum L. accessions based on agroecological and morpho-agronomic traits. Data on 11 quantitative characteristics of 160 accessions were collected. The analysis of variance results showed that there were significant differences between accessions for all traits. The first five principal components accounted for 65.9% of the total variation due to the number of seeds per pod, number of pods per plant and number of primary, secondary branches, seed yield (kg), with the first and second principal component accounting for approximately 17.9% and 15.2%, respectively. The Euclidean distance between genotypes ranged from 0.07 to 10.6, and the dendrogram created using the Unweighted Pair Group Method with Arithmetic Means (UPGMA) classified genotypes into two major clusters, indicating a higher possibility of developing varieties through direct selection or genotype crossing.
-
Key words:
- Cluster /
- Genetic gain /
- Genotypic coefficient of variation /
- PCA /
- Trigonella foenum-graecum L.