-
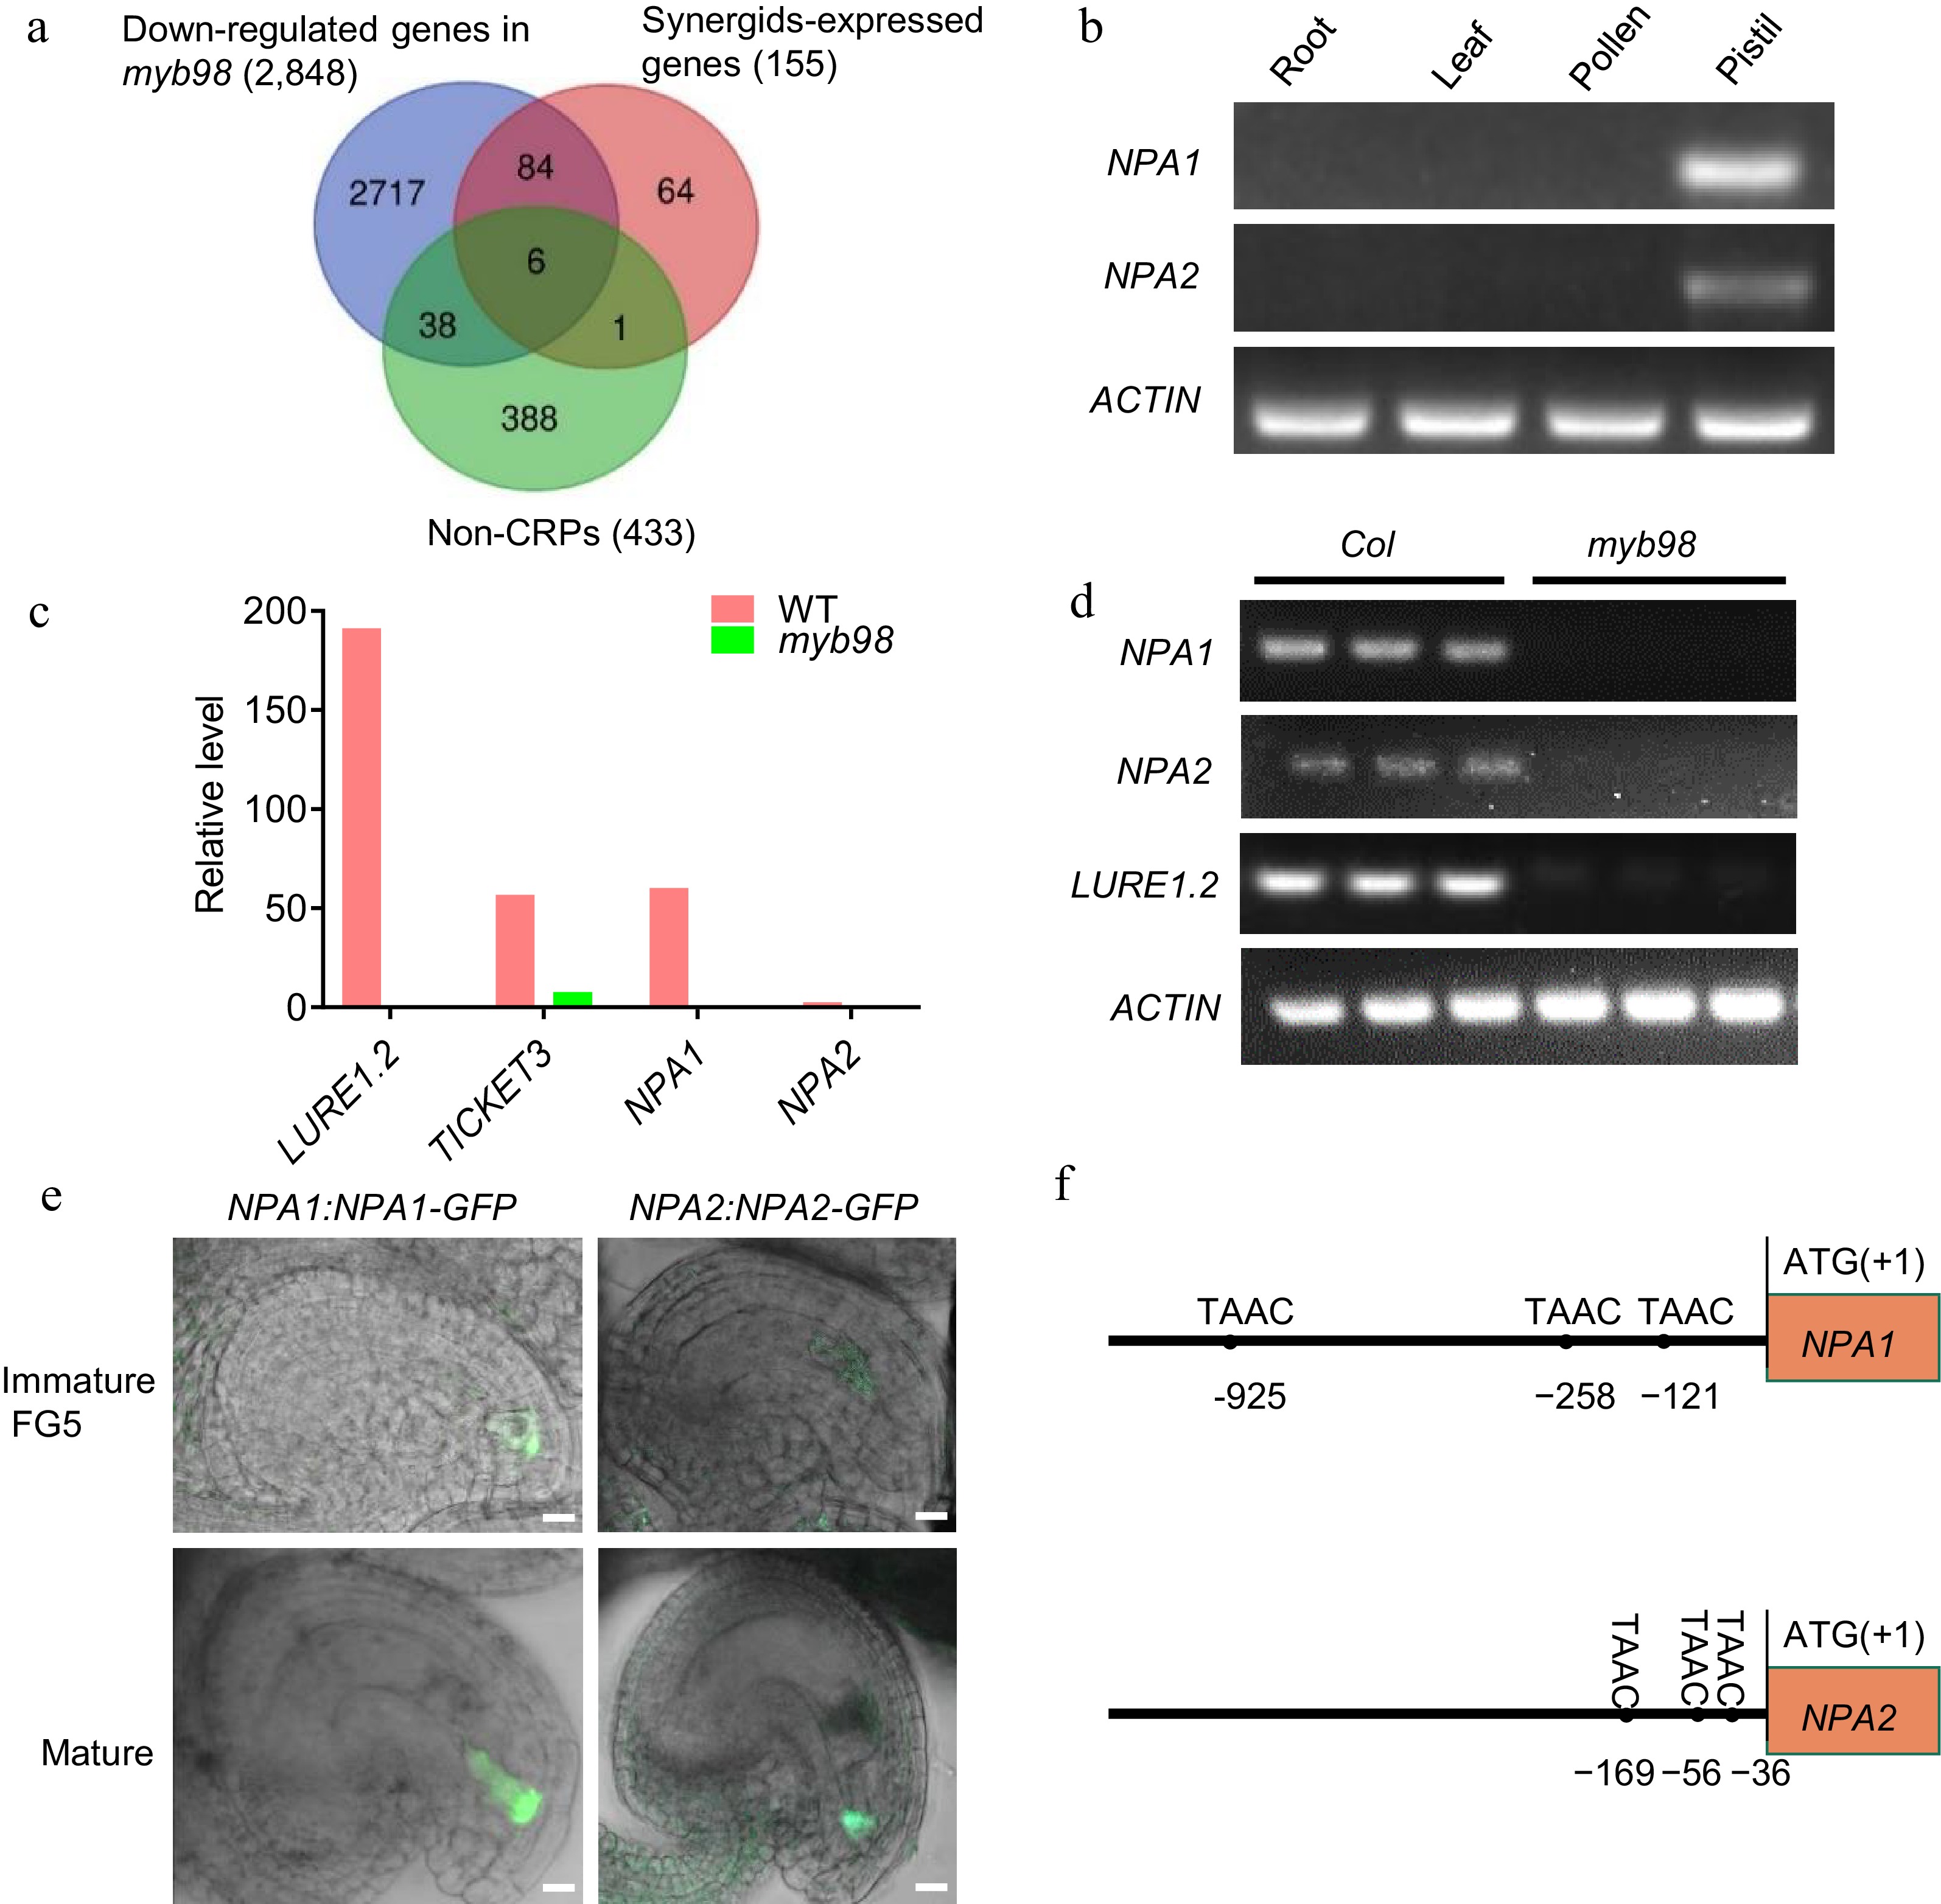
Figure 1.
(a) Venn diagram of the down-regulated genes in myb98, synergids-expressed genes, and non-CRPs. (b) RT-PCR showing the expression patterns of NPA1 and NPA2 in different tissues of Arabidopsis thaliana. ACTIN, internal control. (c) Relative level of transcripts of LURE1.2, TICKET3, NPA1 and NPA2 from the reported transcriptome data. (d) RT-PCR showing the mRNA level of LURE1.2, ACTIN, NPA1 and NPA2 in the WT and myb98 mature ovules. (e) Expression of NPA1 and NPA2 in the synergids of immature and mature ovules. (f) The sites of TAAC element in the promoters of NPA1 and NPA2.
-
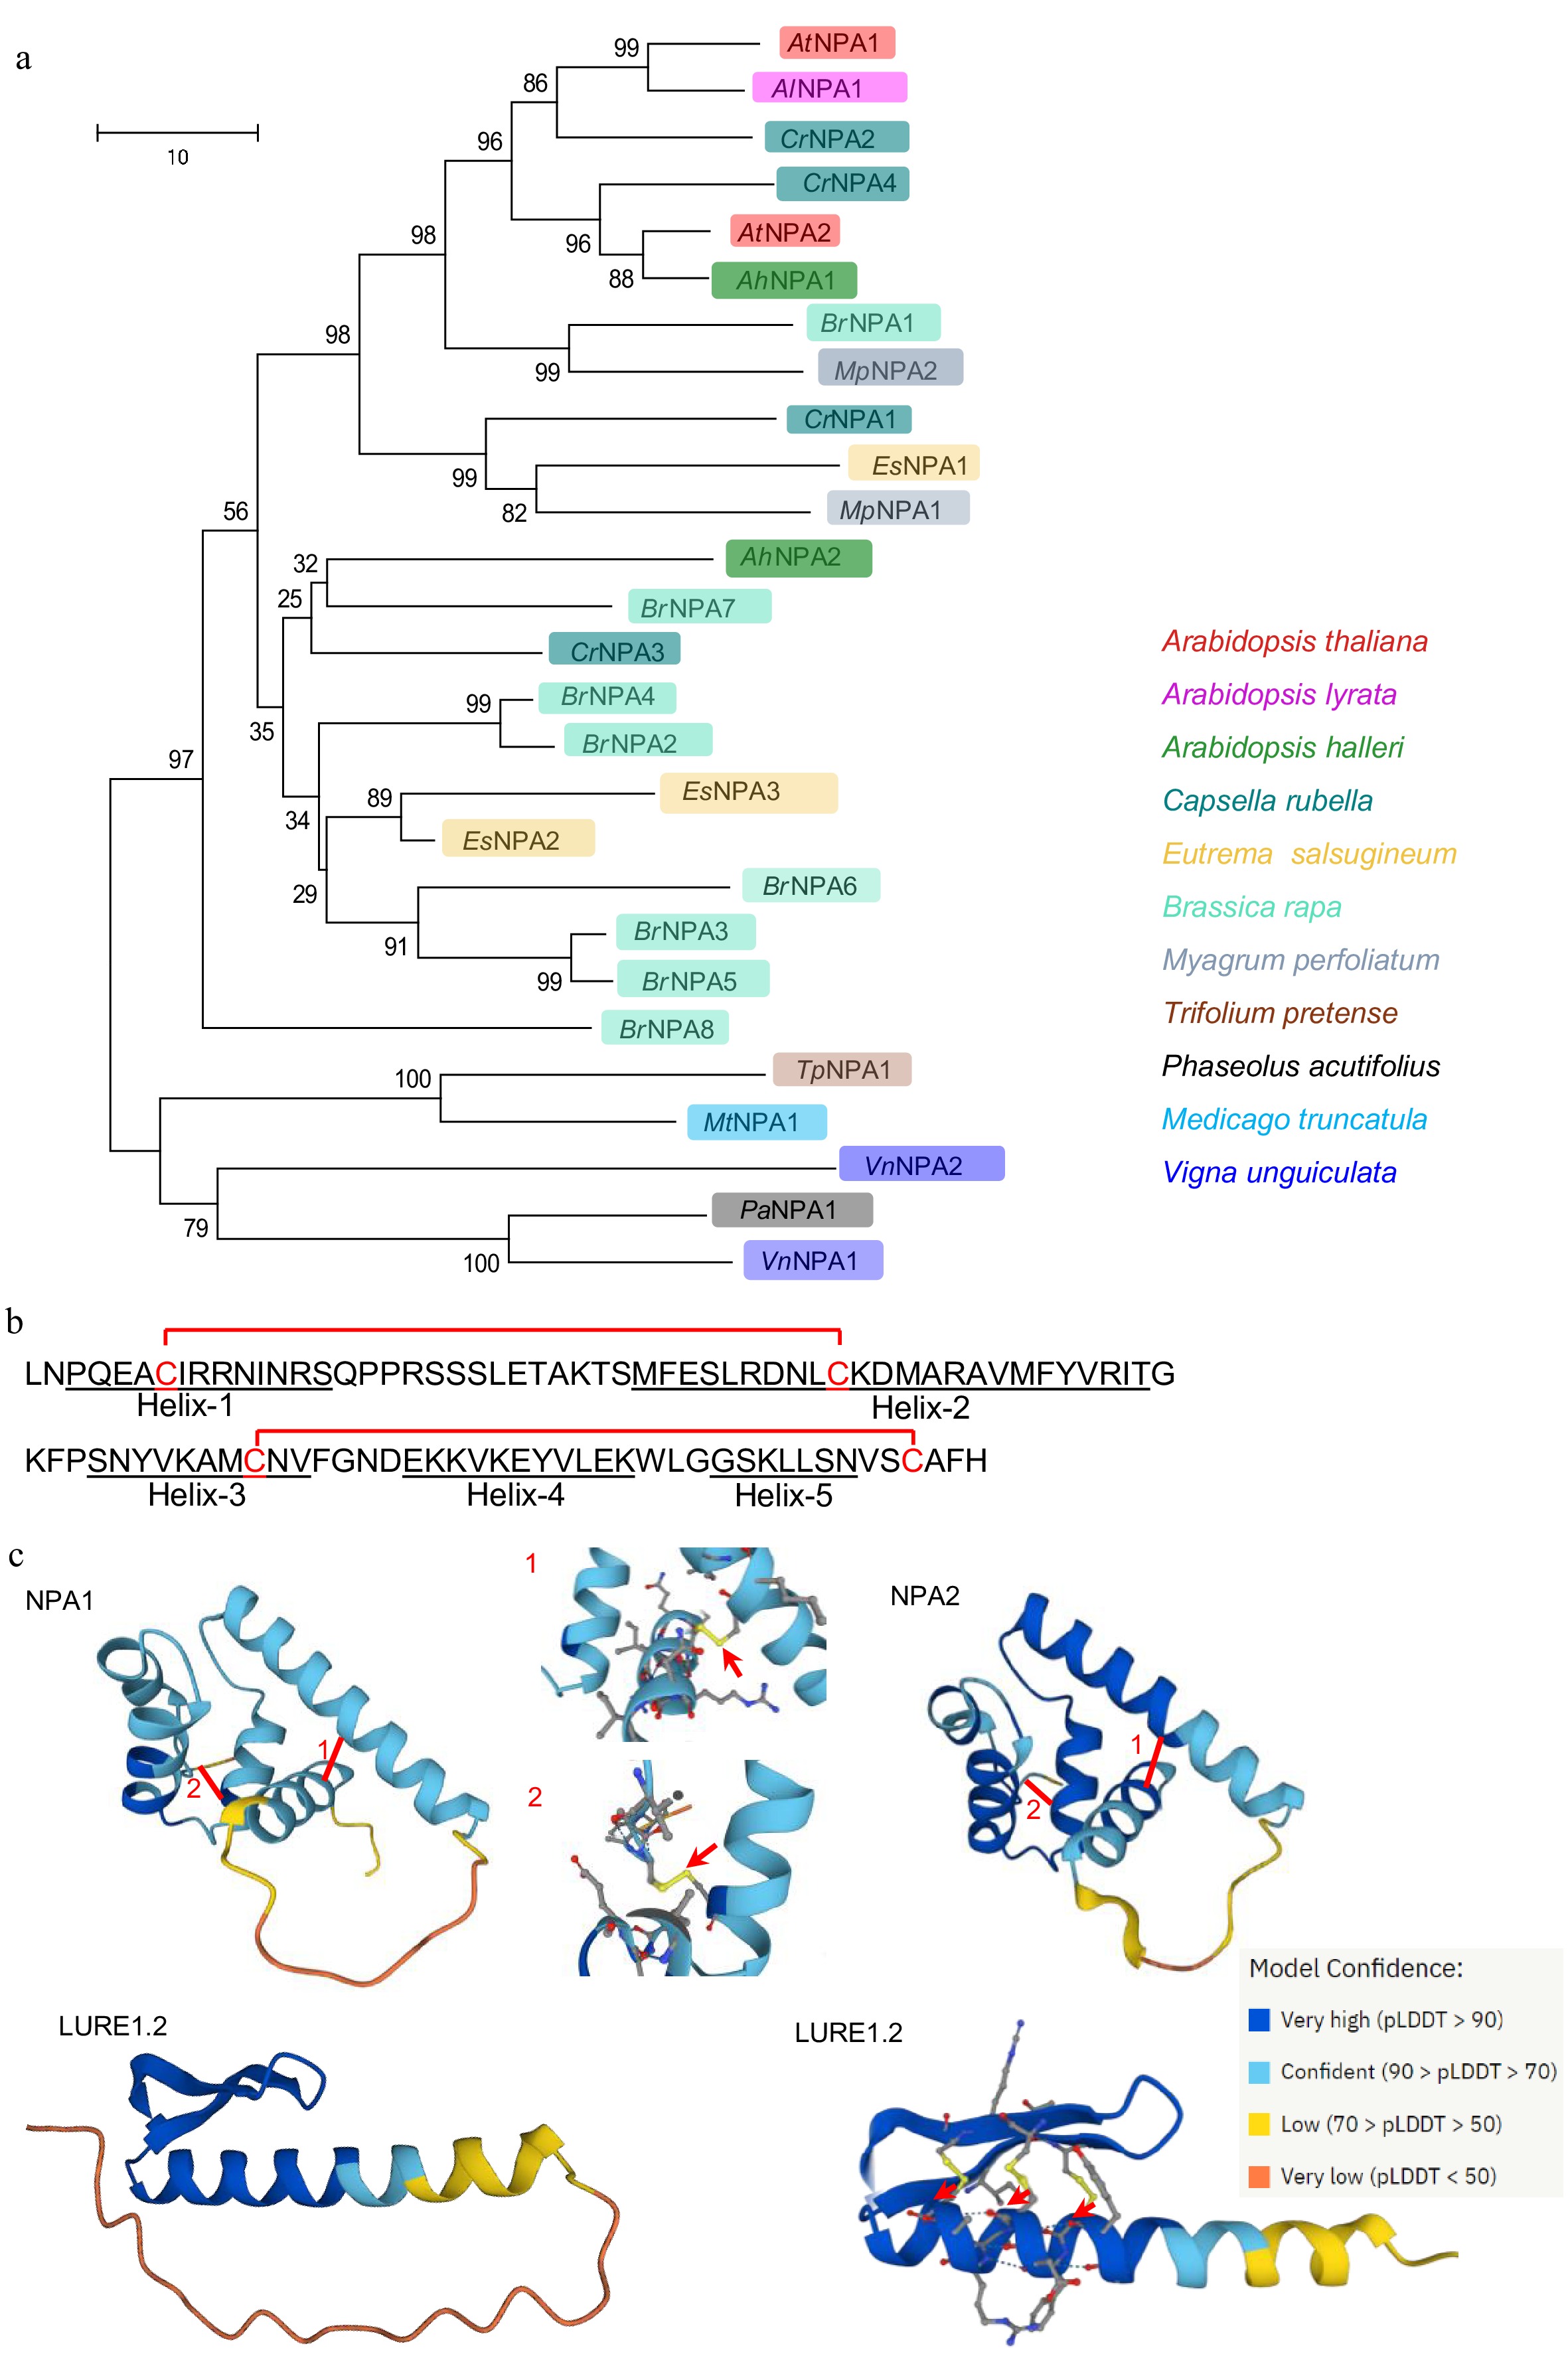
Figure 2.
The phylogeny and protein structure of NPAs. (a) Phylogenetic tree constructed with the protein sequences of NPA1 and NPA2 and their homologs. (b) Mature peptide sequence of NPA1 with five predicted helices and two disulfide bonds. (c) The structural modeling of NPA1, NPA2 and LURE1.2 by AlfaFold. Arrows indicate disulfide bonds.
-
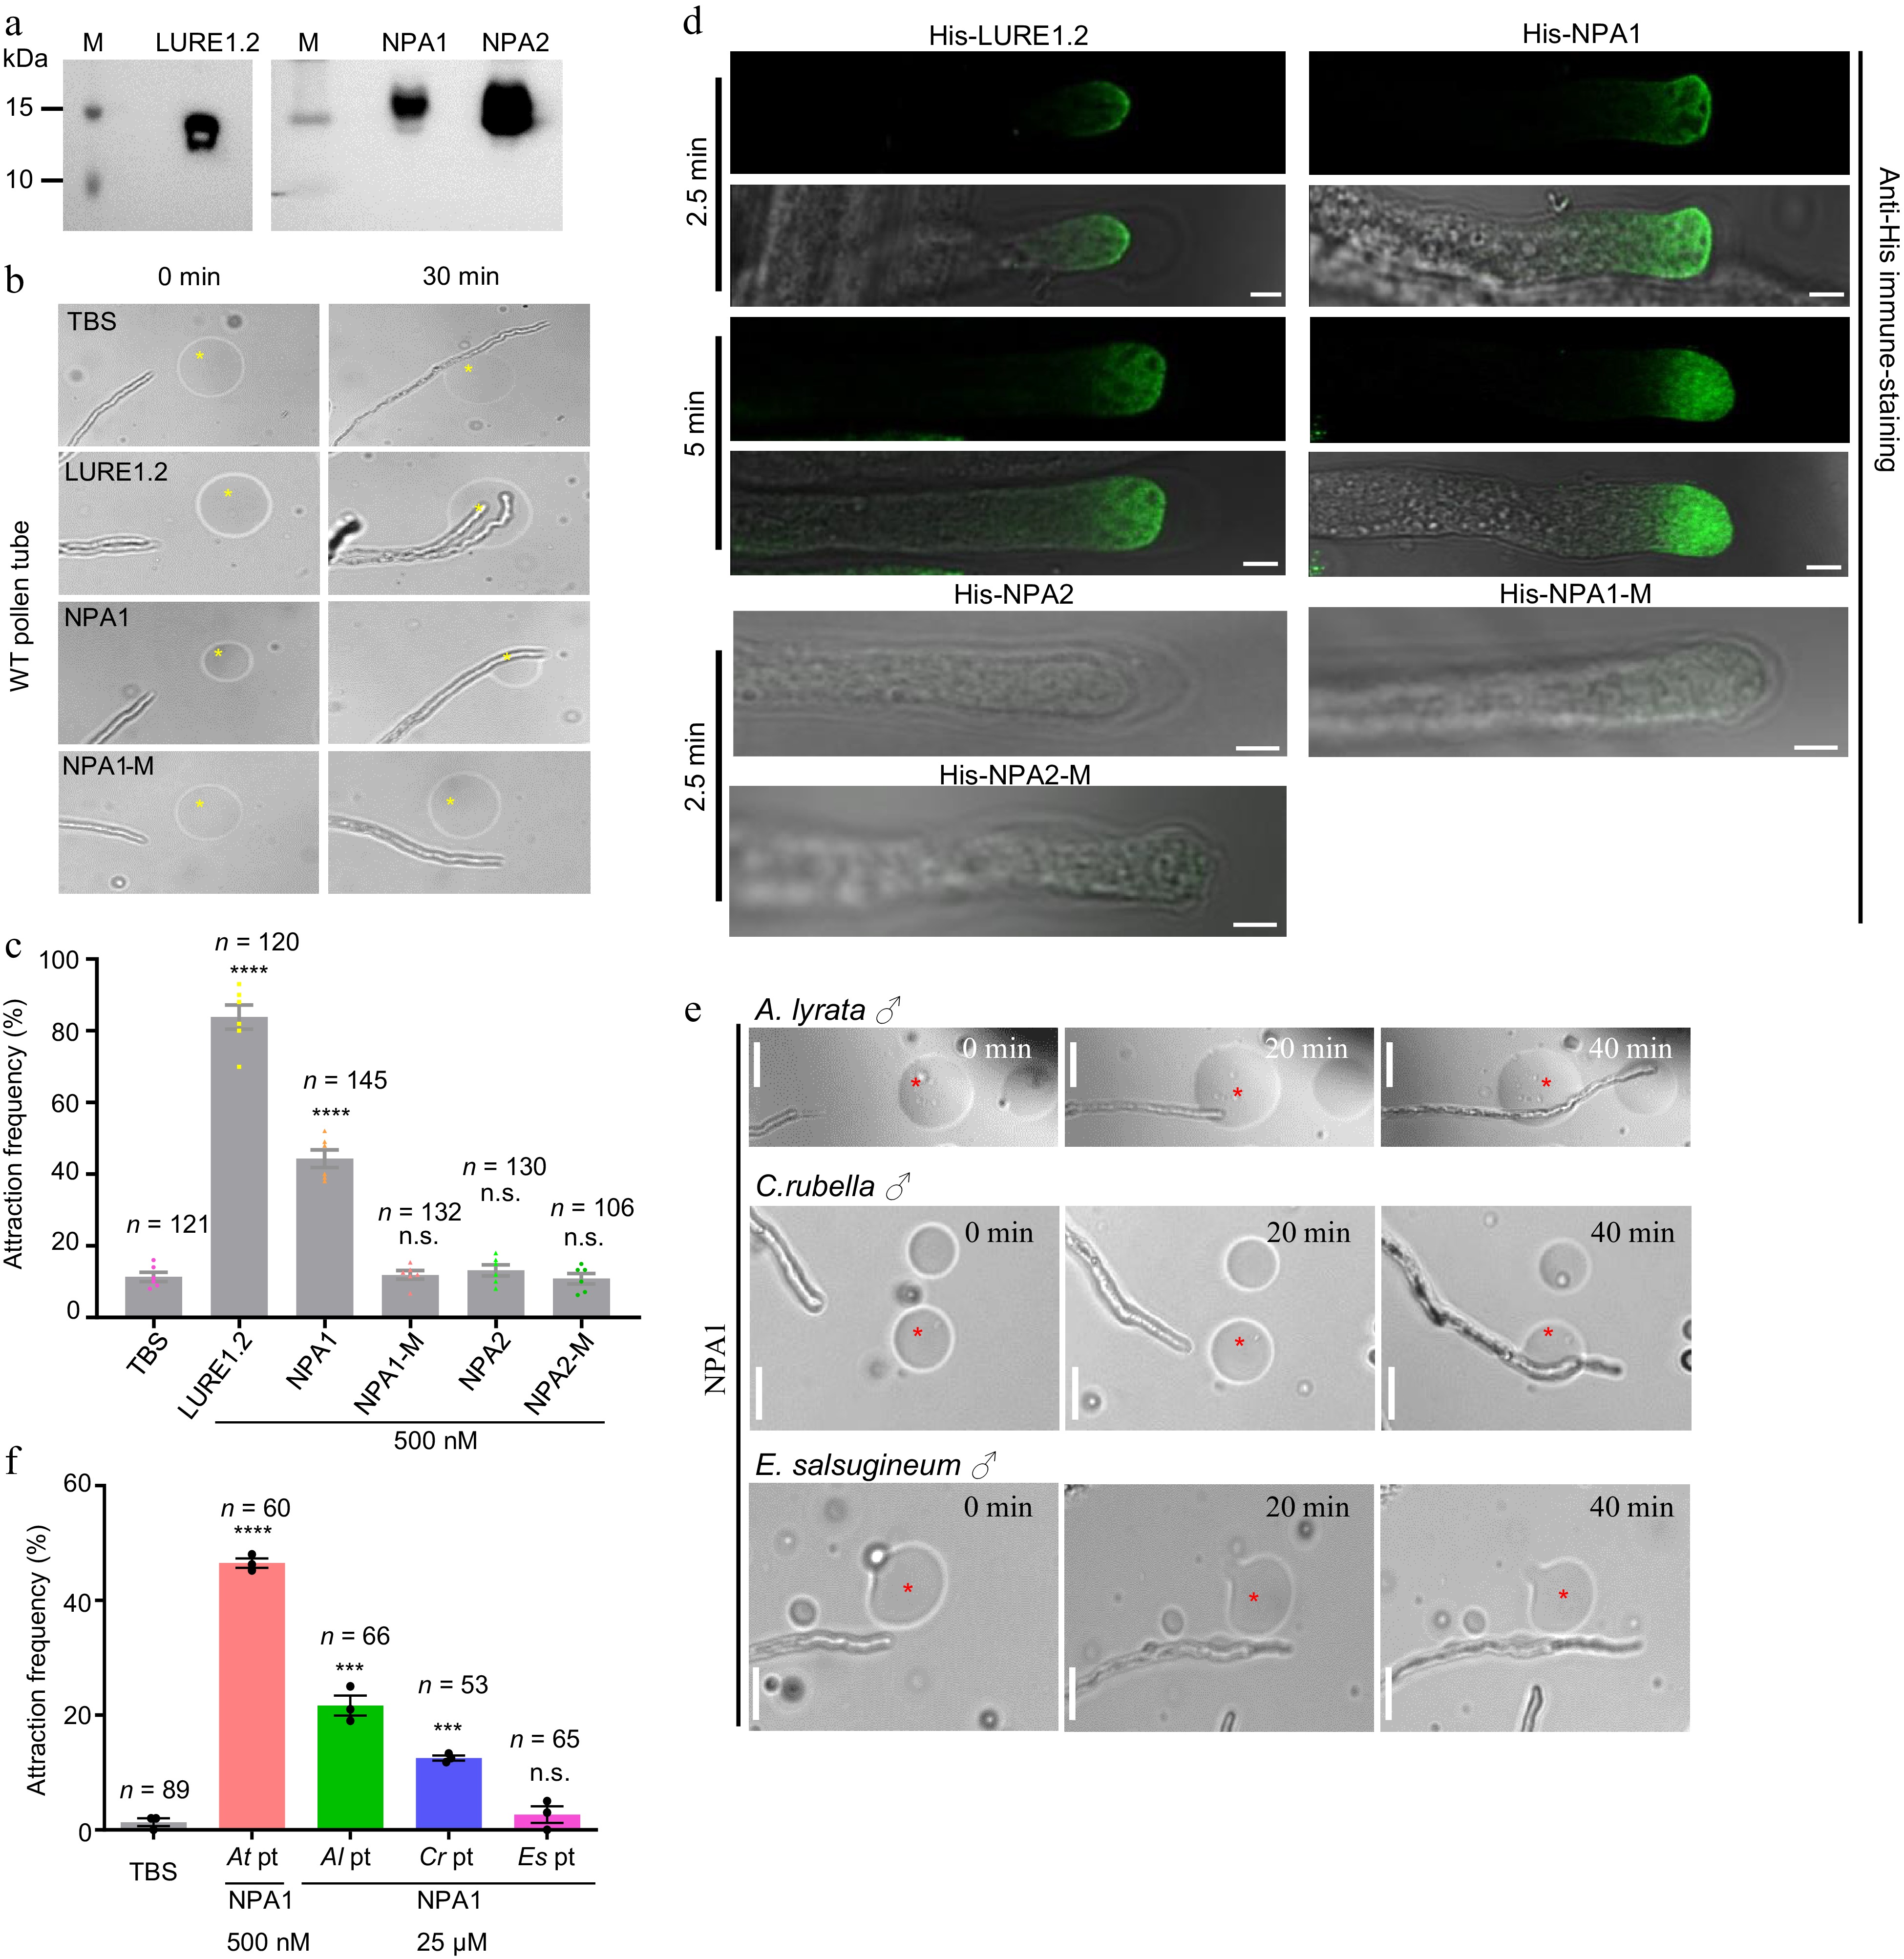
Figure 3.
NPA1 has pollen tube attraction activity. (a) Western blot of the purified His-tagged LURE1.2, NPA1 and NPA2 stained by His antibody. (b) Pollen tube attraction assay with gelatin beads containing the purified peptides, bar = 10 μm. (c) Statistics of (b), n = 121, 120, 145, 132, 130, 106 for each sample. The concentration for each assay is 500 nM. Two-tailed Student's t-test, **** p < 0.0001. Three independent biological experiments were repeated. (d) His-NPA1 binds to the pollen tube tip membrane. The LURE1.2 and NPA1 were incubated with the WT pollen tubes for 2.5 and 5 min, respectively. Endocytosis was observed at 5 min, n = 370 and 96 for each sample. NPA2, NPA1-M and NPA2-M were incubated with the WT pollen tubes for 2.5 min, n = 23, 19, 35, Bar = 5 μm. Three independent biological experiments were repeated. (e) Pollen tube attraction assay with gelatin beads containing the purified peptides. Pollen tubes of A. lyrata, C. rubella and E. salsugineum were used, bar = 10 μm. (f) Statistics of (e), n = 89, 60, 66, 53 and 65 for each sample. Two-tailed Student's t-test, **** p < 0.0001, *** p < 0.001. All data shown are the mean ± s.e.m. Three independent biological experiments were repeated.
-
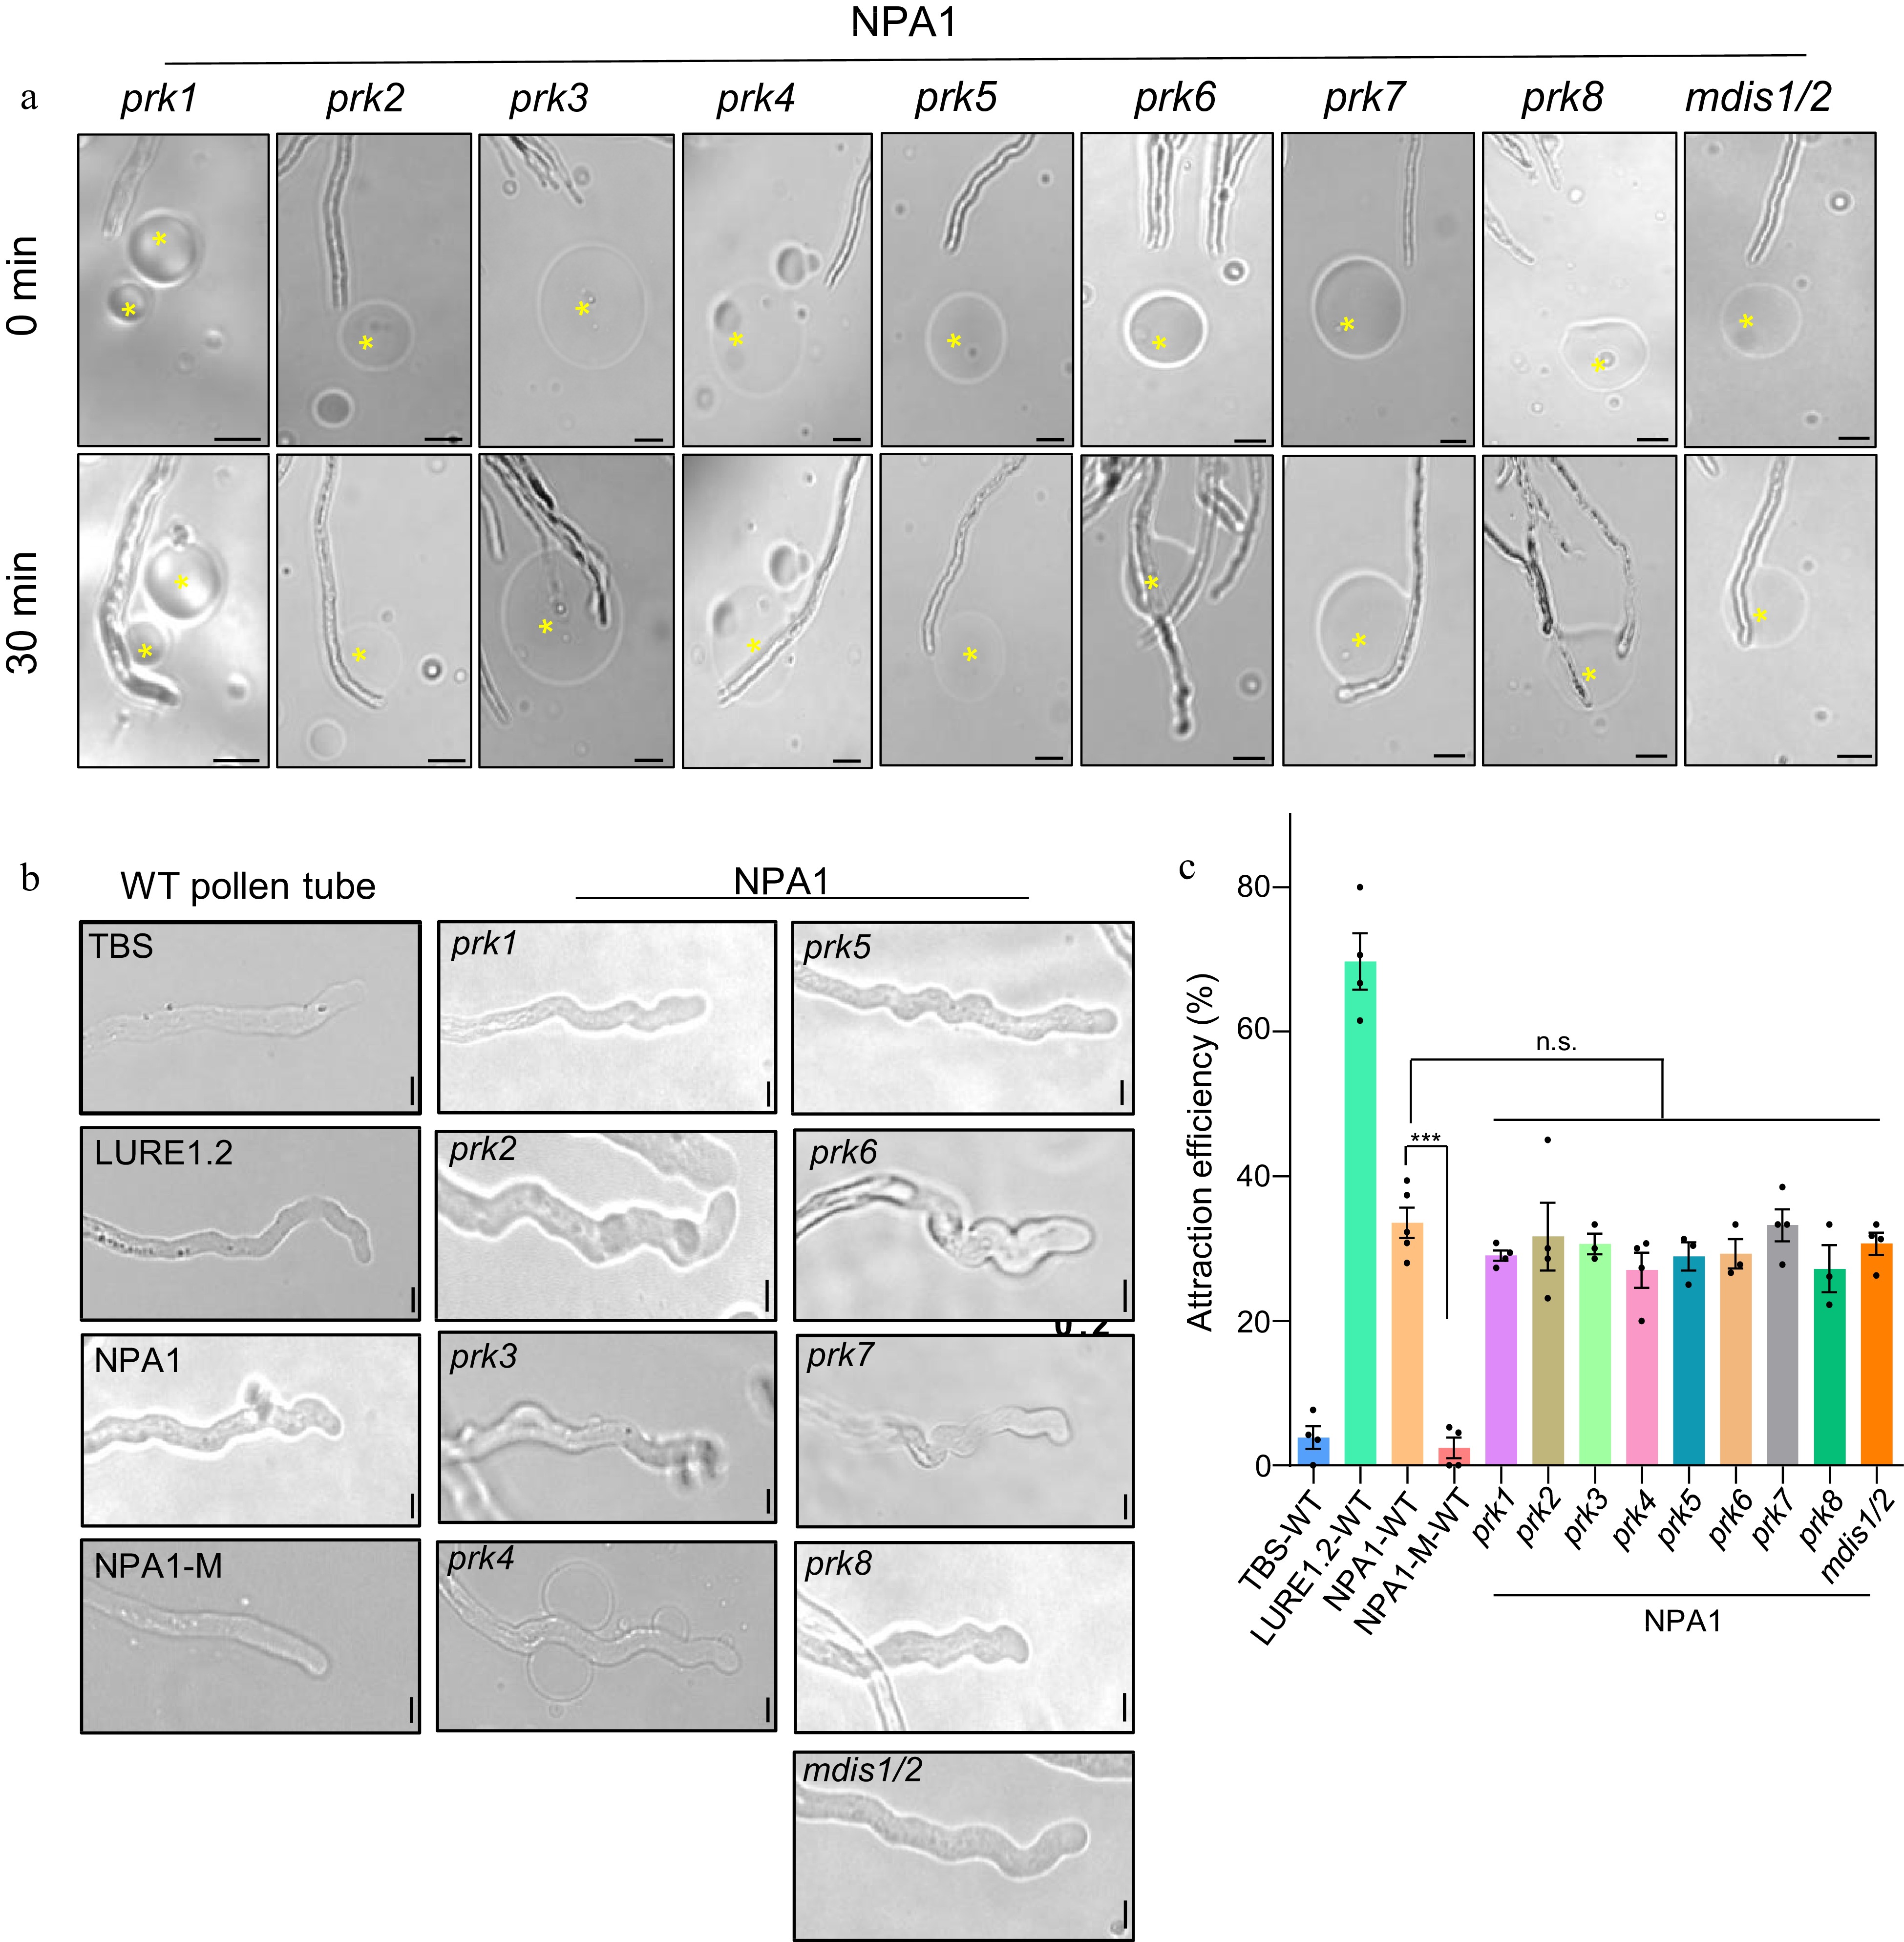
Figure 4.
NPA1 attracts the mutant pollen tubes of PRK family members and mdis1/2. (a) NPA1 attracted pollen tubes of different mutants, bar = 20 μm. (b) NPA1 induced wavy growth patterns of pollen tubes. The concentration of LURE1.2, NPA1 and NPA1-M was 500 nM, bar = 5 μm. (c) Statistics of (a), n = 82, 64, 145, 70, 55, 62, 48, 54, 51, 45, 55, 53, 69. Two-tailed Student's t-test, *** p < 0.001, n.s., no significance. The concentration of LURE1.2 was 500 nM, NPA1 and NPA1-M 500 nM. All data shown are the mean ± s.e.m.
-
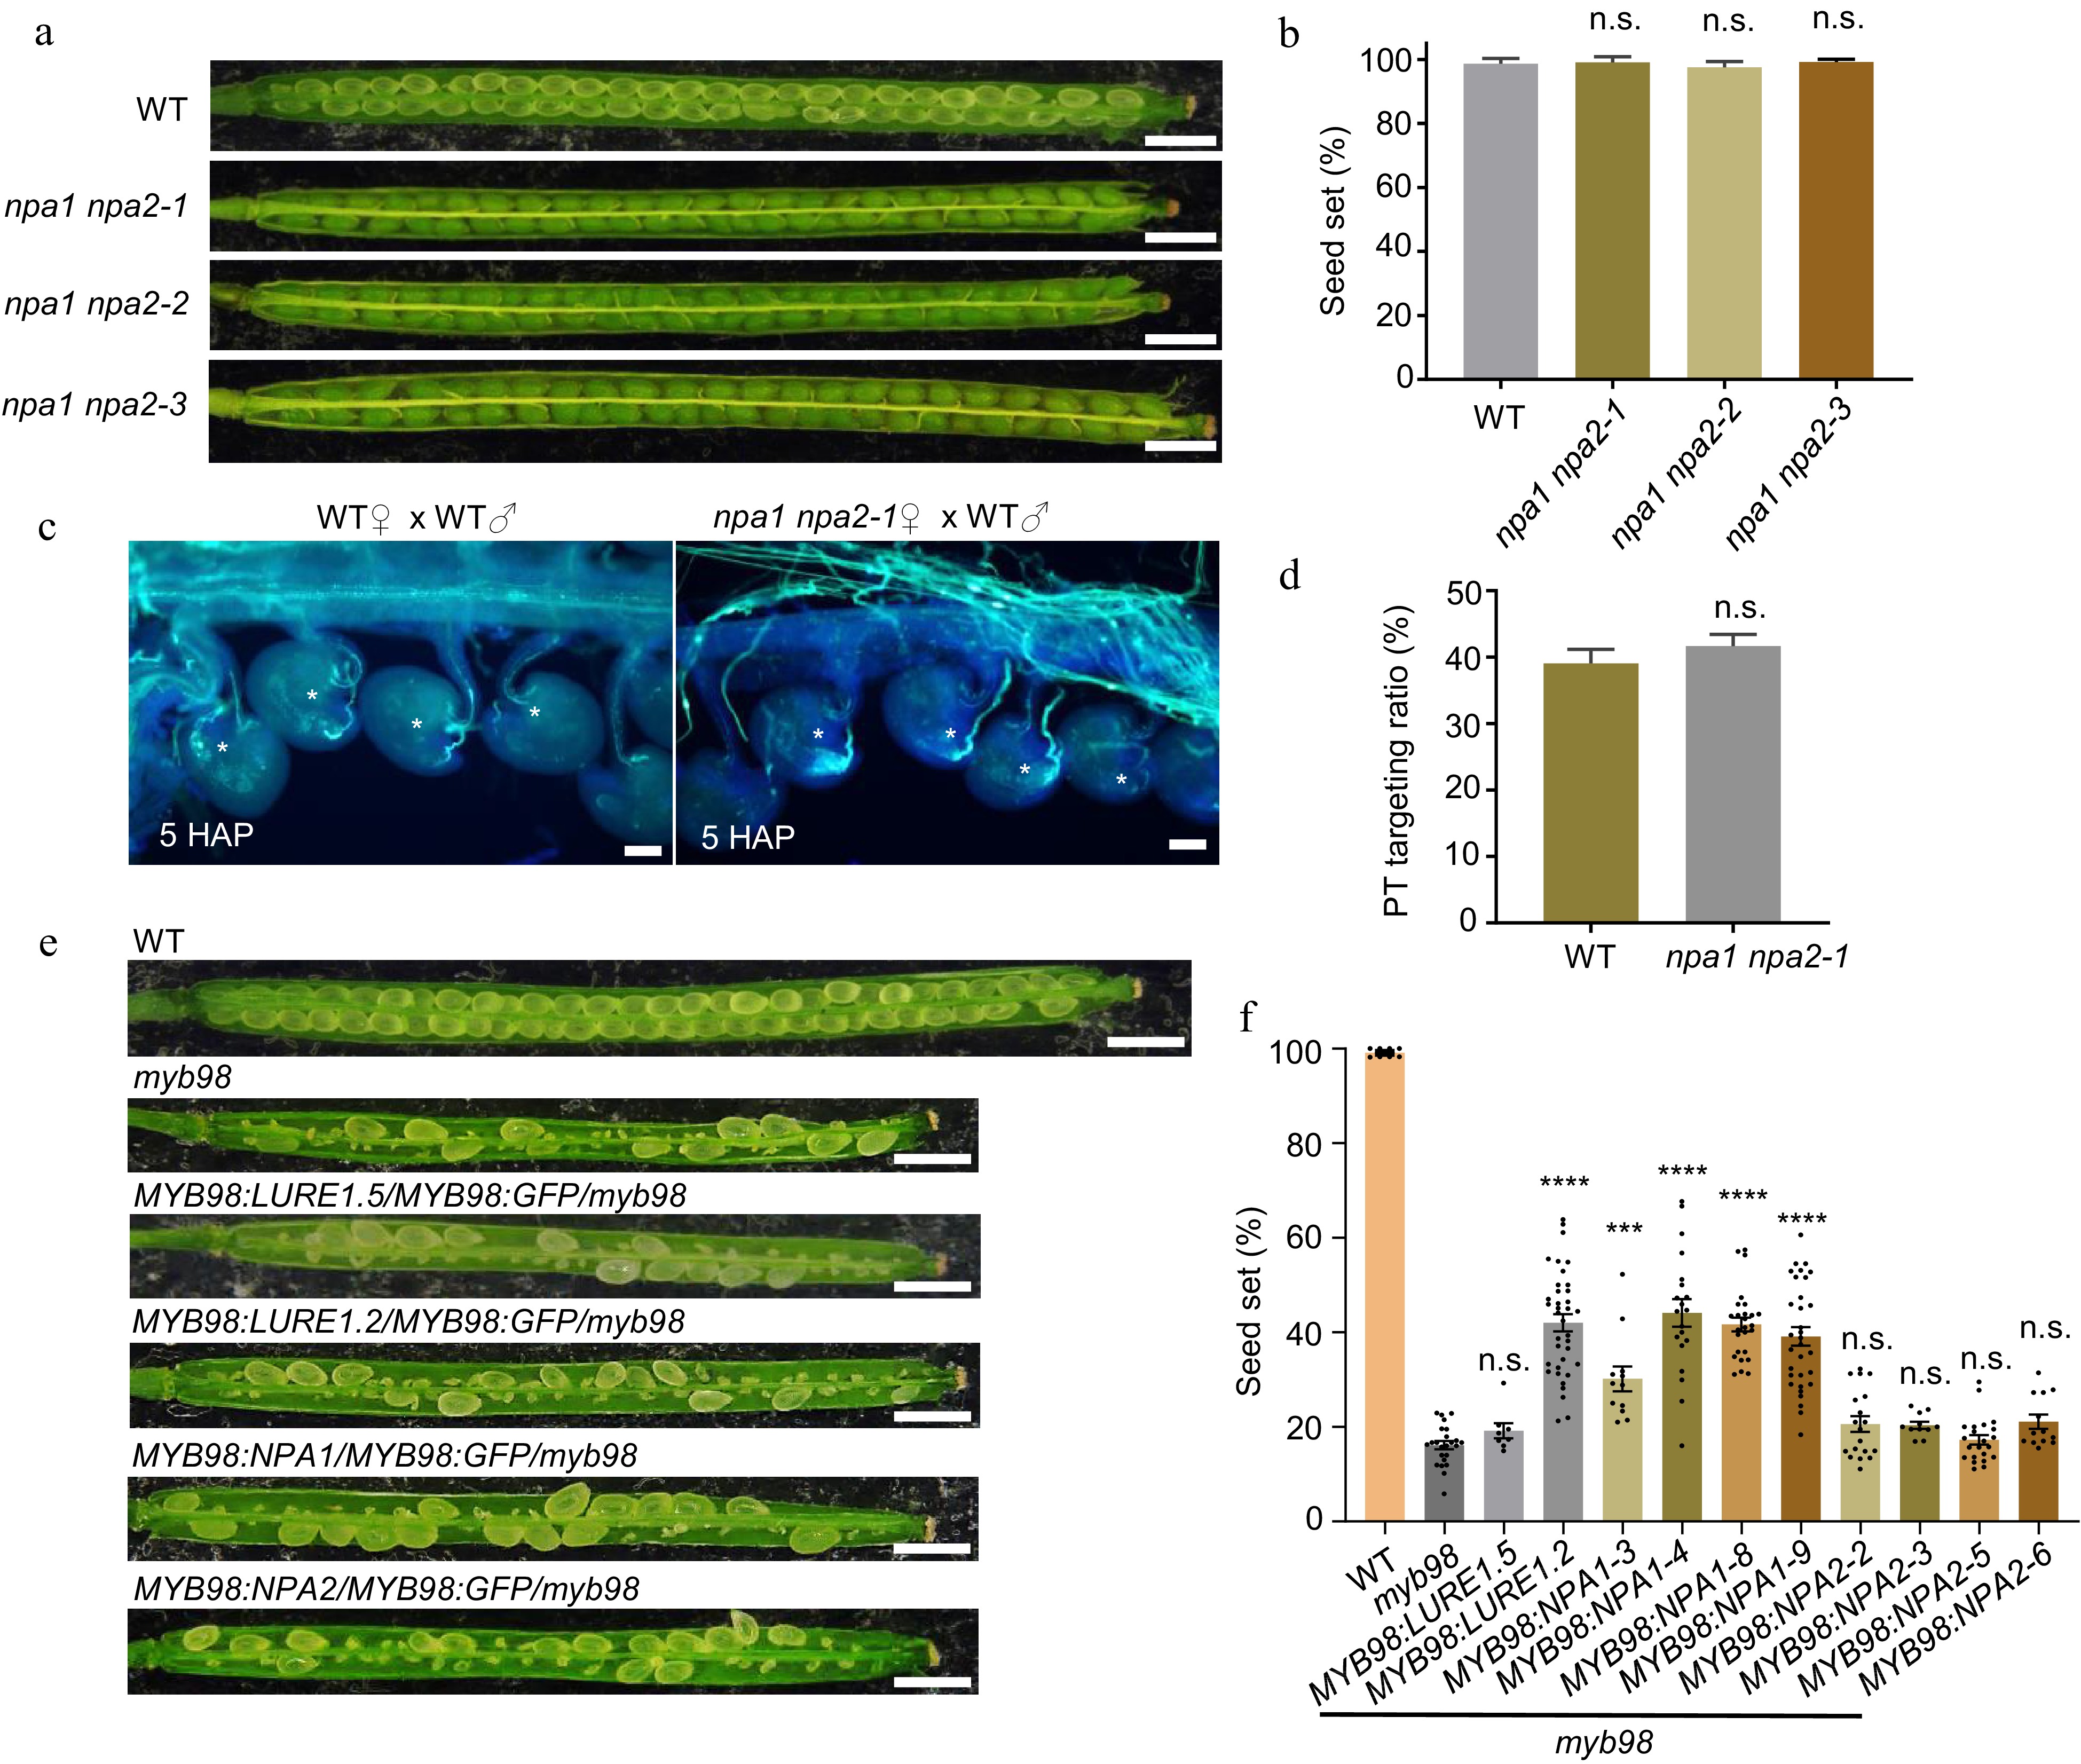
Figure 5.
The function of NPA1 in seed production. (a) npa1 npa2 null mutant shows full seed set, bar = 1 mm. (b) Statistics of (a), n = 1,190, 865, 907, 905 for each sample. Two-tailed Student's t-test. (c) The pollen tube attraction efficiency at 5 HAP, bar = 50 μm. (d) Statistics of (c), n = 736, 1007 for each sample. Two-tailed Student's t-test. (e) Seed set of myb98 was increased by the expression of NPA1 in the synergids, bar = 1 mm. (f) Statistics of (e), n = 1,068, 1,294, 1,401, 587, 832, 1,043, 1,264, 927, 606, 942, 971 for each sample. Two-tailed Student's t-test, **** p < 0.0001. All data shown are the mean ± s.e.m. Three independent biological experiments were repeated.
-
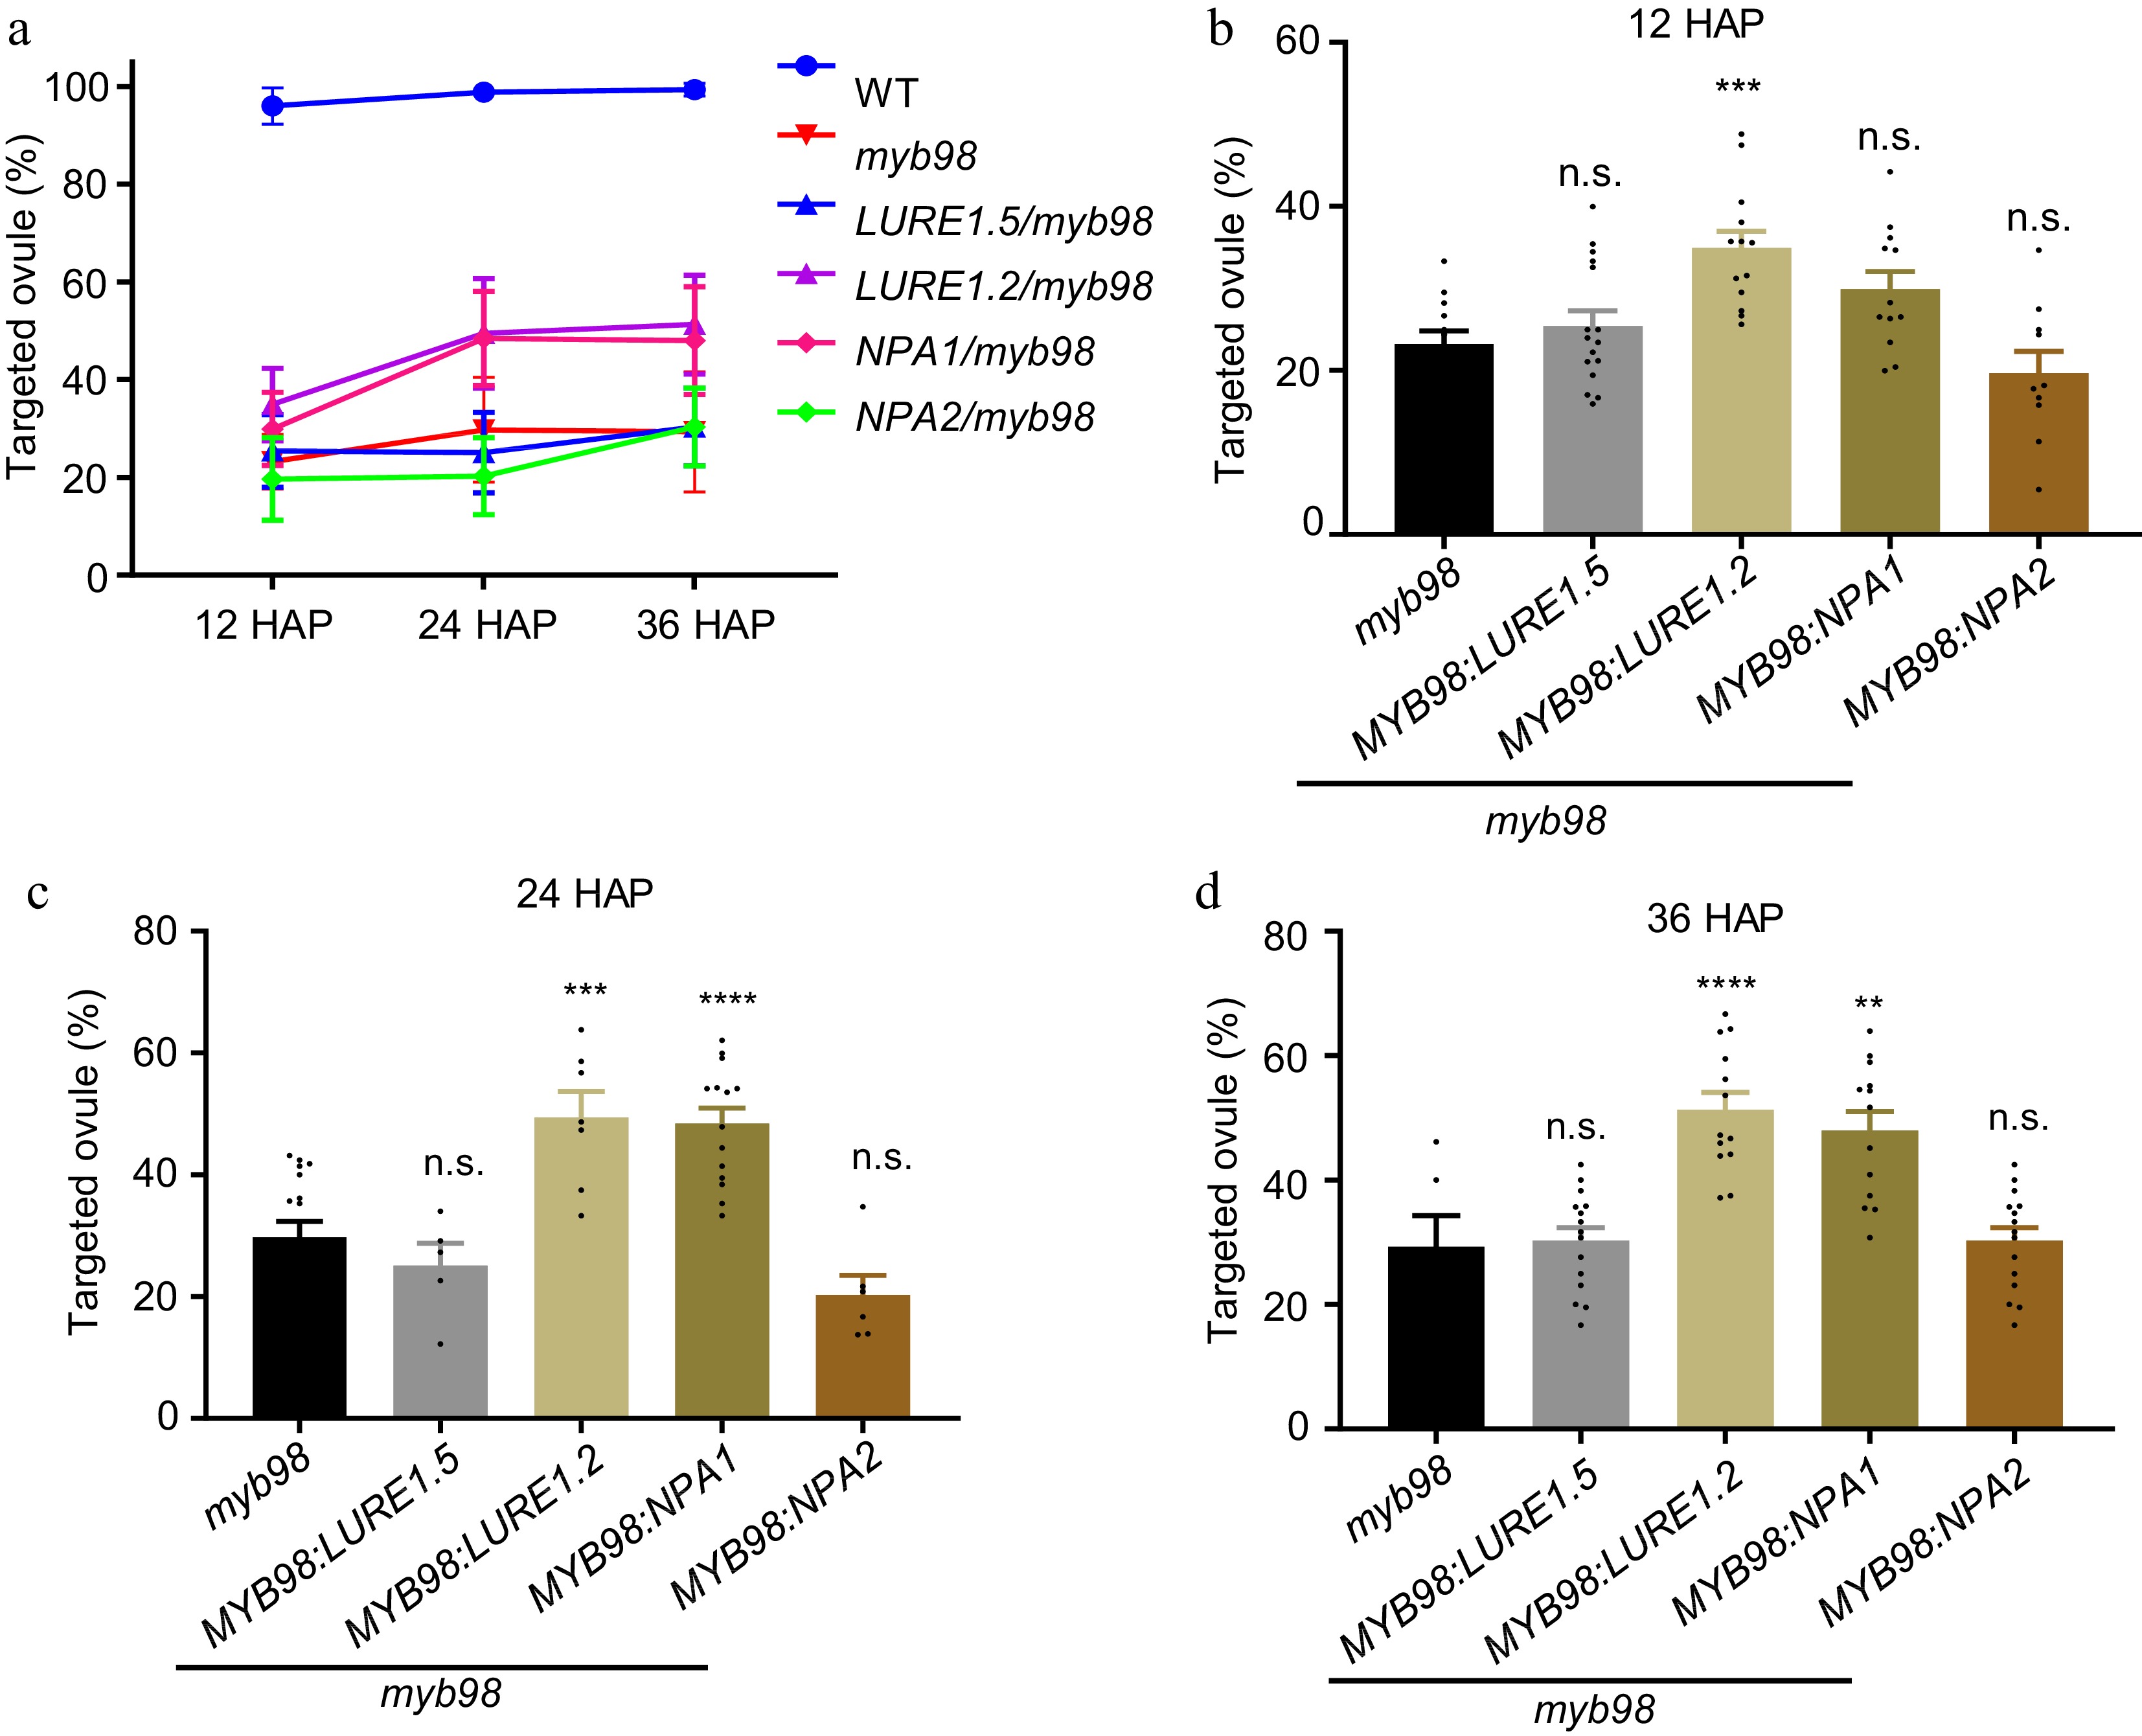
Figure 6.
Expression of NPA1 in the synergids alleviates the defective pollen tube attraction of myb98 mutant. (a) The percentage of targeted ovules. Statistics of the pollen tube attraction efficiency at (b) 12, (c) 24, (d) 36 HAP. Data in (b), n = 604, 595, 794, 477 for each sample. Two-tailed Student's t-test, *** p = 0.0002. Data in (c), n = 723, 241, 406, 660, 361 for each sample. Two-tailed Student's t-test, *** p = 0.0005, **** p < 0.0001. Data in (d), n = 249, 699, 544, 495, 701 for each sample. Two-tailed Student's t-test, **** p < 0.0001, ** p = 0.0040. All data shown are the mean ± s.e.m. Three independent biological experiments were repeated.
-
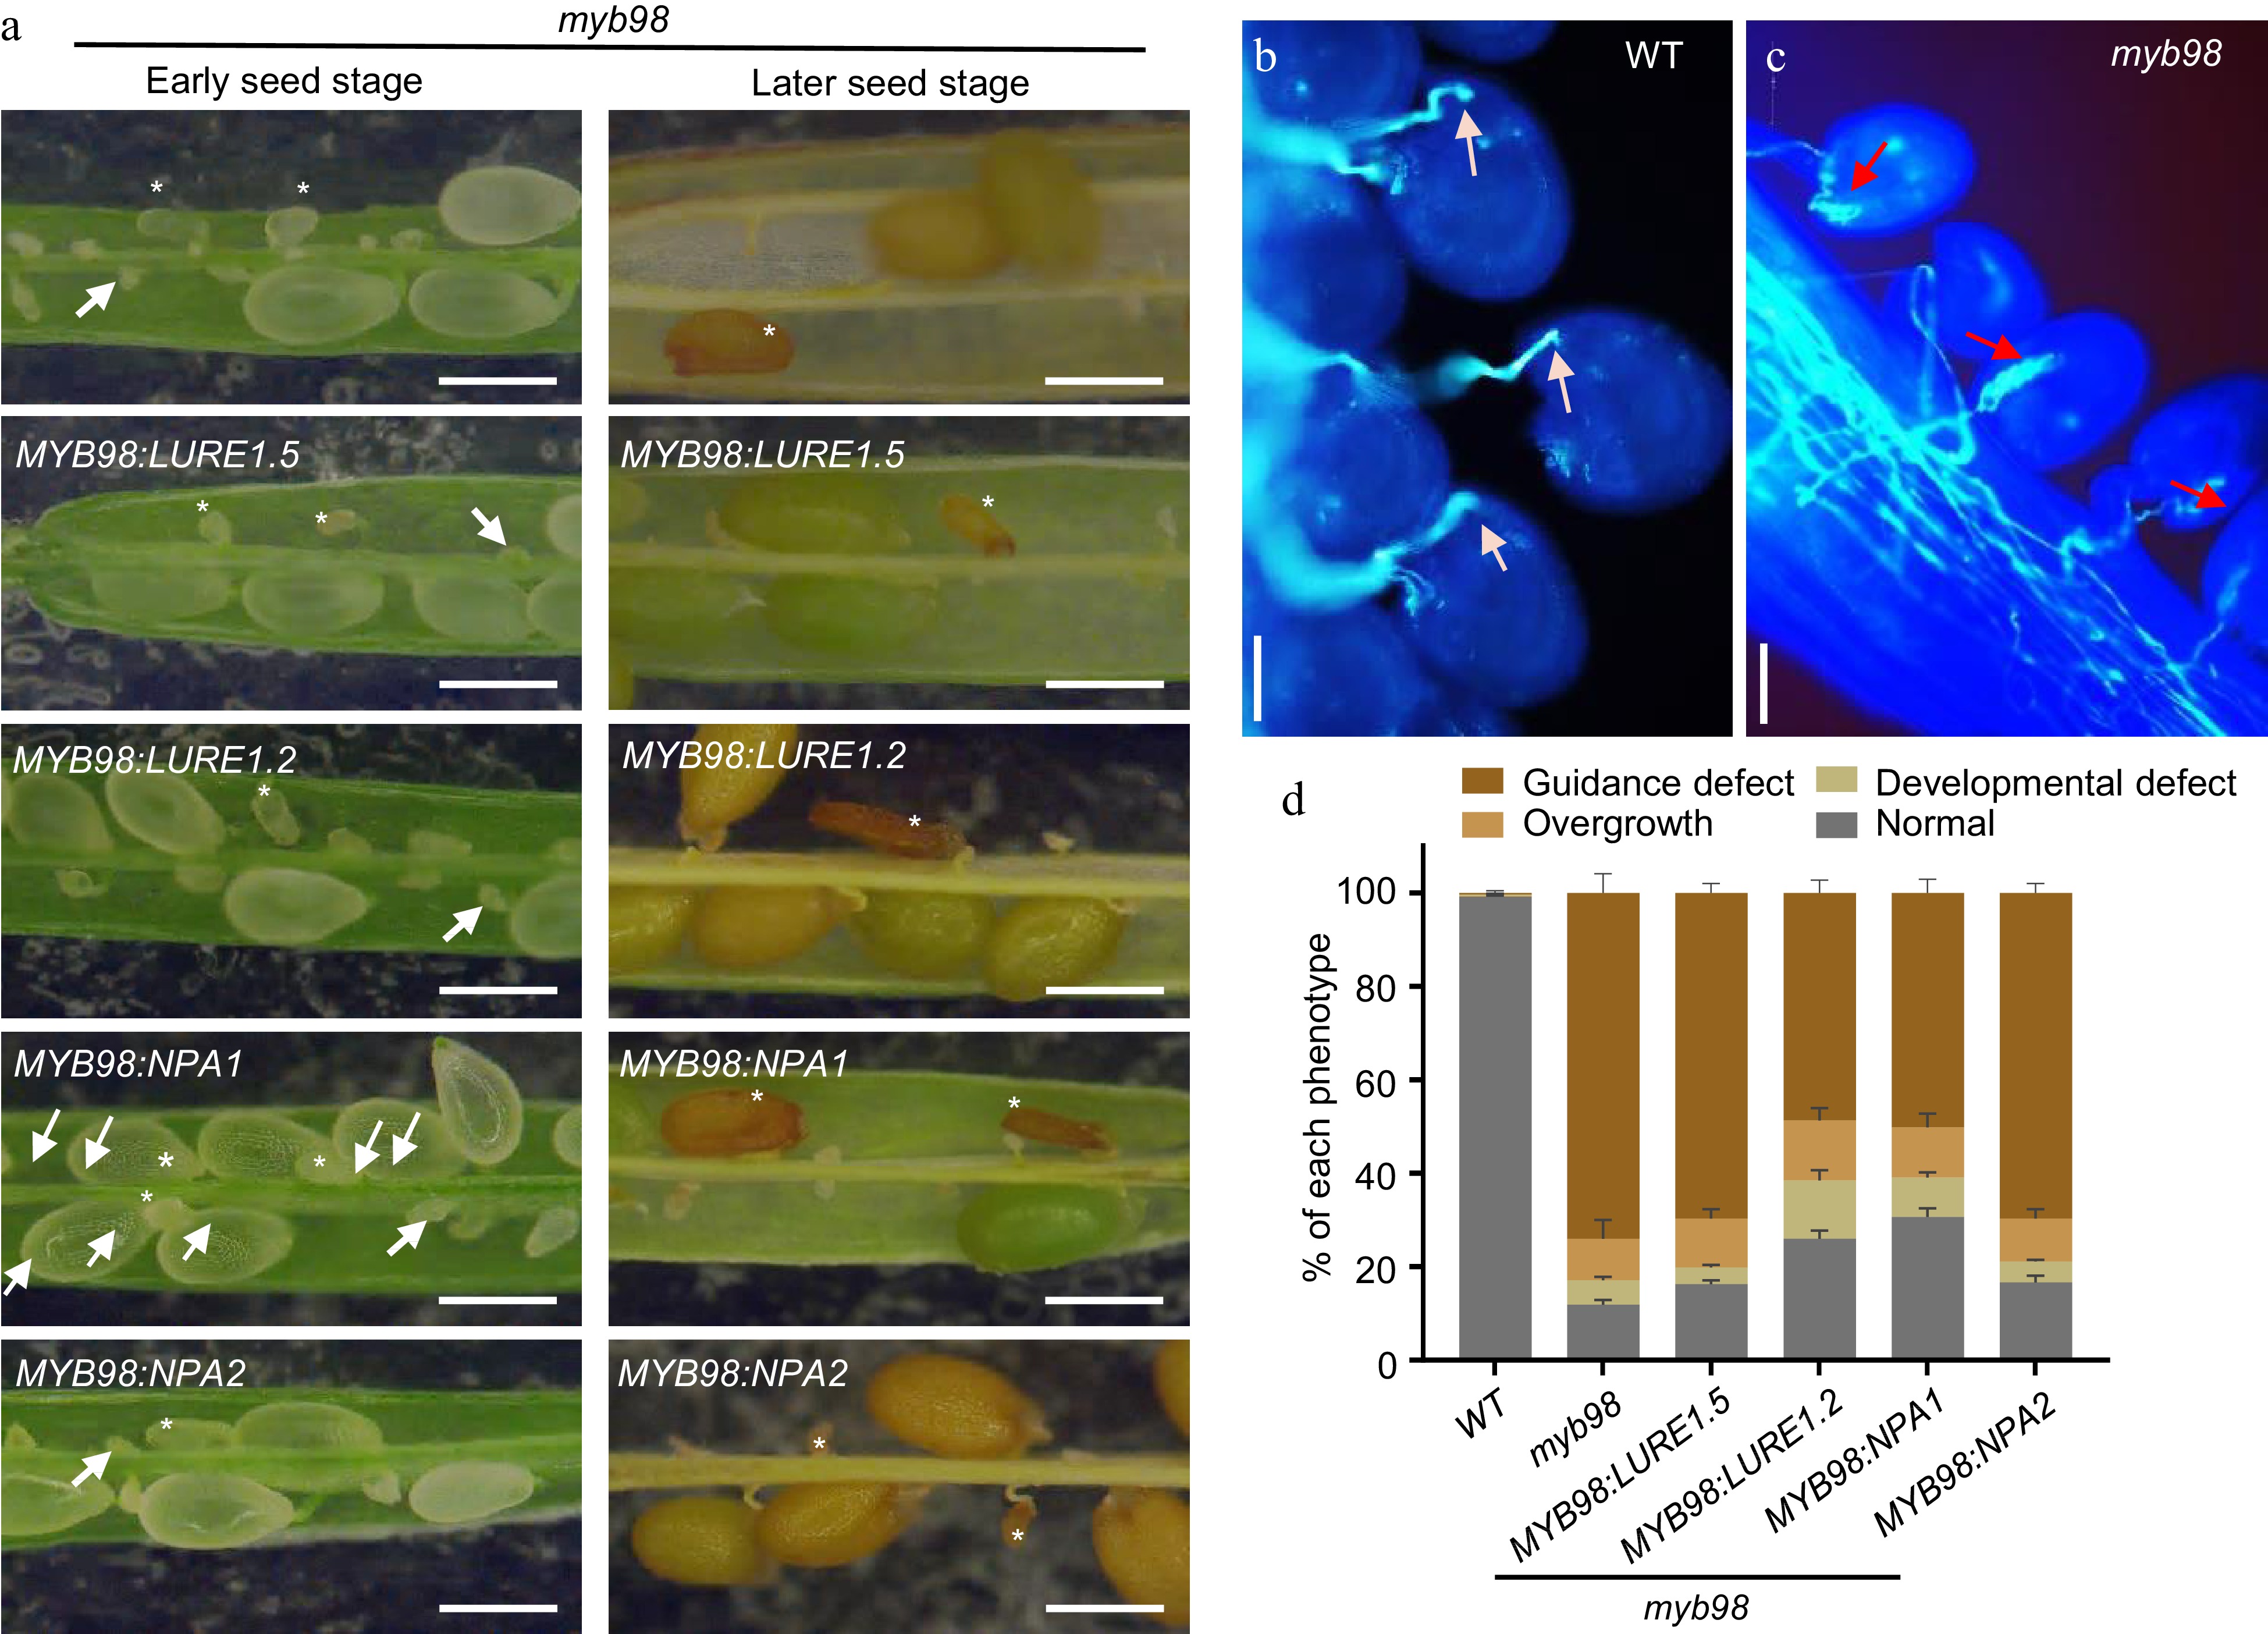
Figure 7.
NPA1 does not rescue the defective pollen tube reception and seed development of myb98 mutant. (a) The seed set of myb98 and the rescued plants at the early and late developmental stages. Asterisks, aborted seeds. Arrow, aborted ovules, bar = 1 mm. (b) and (c) Pollen tube overgrowth in myb98 ovules, bar = 20 μm. White arrow, normal pollen tubes. Red arrow, overgrowing pollen tubes. (d) Statistics of pollen tube guidance defect, pollen tube overgrowth, seed development defect, and normal seeds. Data shown are the mean ± s.e.m. Three independent biological experiments were repeated.
Figures
(7)
Tables
(0)