-
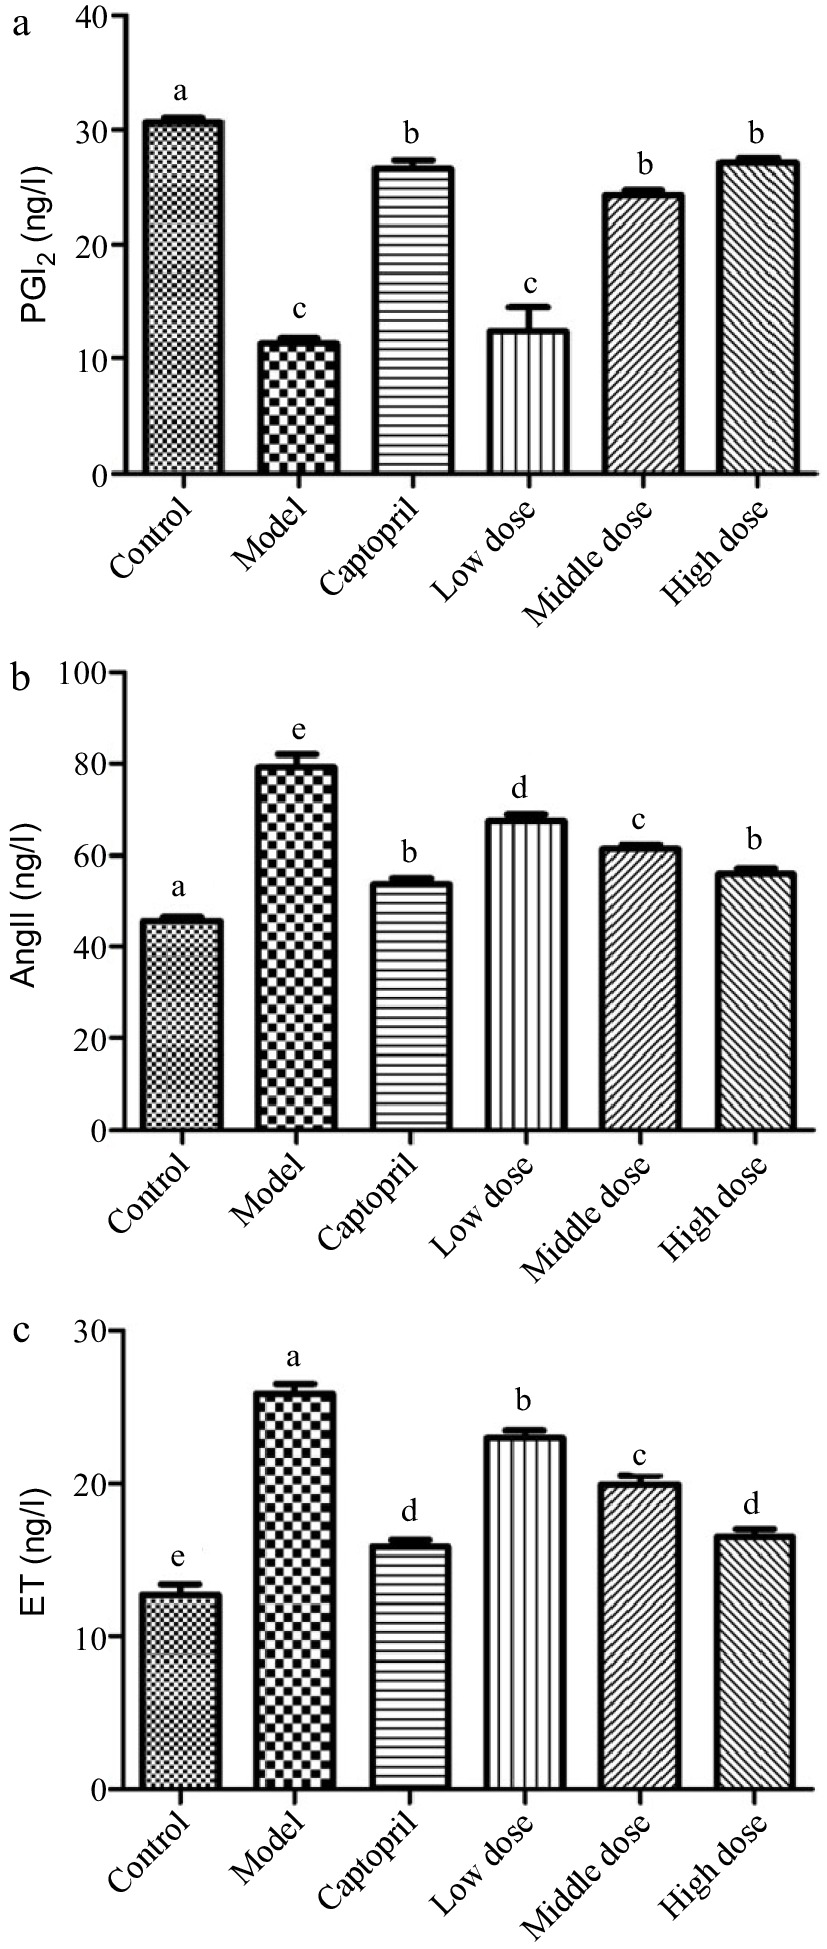
Figure 1.
The serum PGI2, AngII and ET levels in normal and spontaneously hypertensive rats treated with different Gaocha extract doses. (a) Serum PGI2 level, (b) Serum AngII level, and (c) Serum ET level. Different letters represent significant difference at a significant level of 0.05.
-
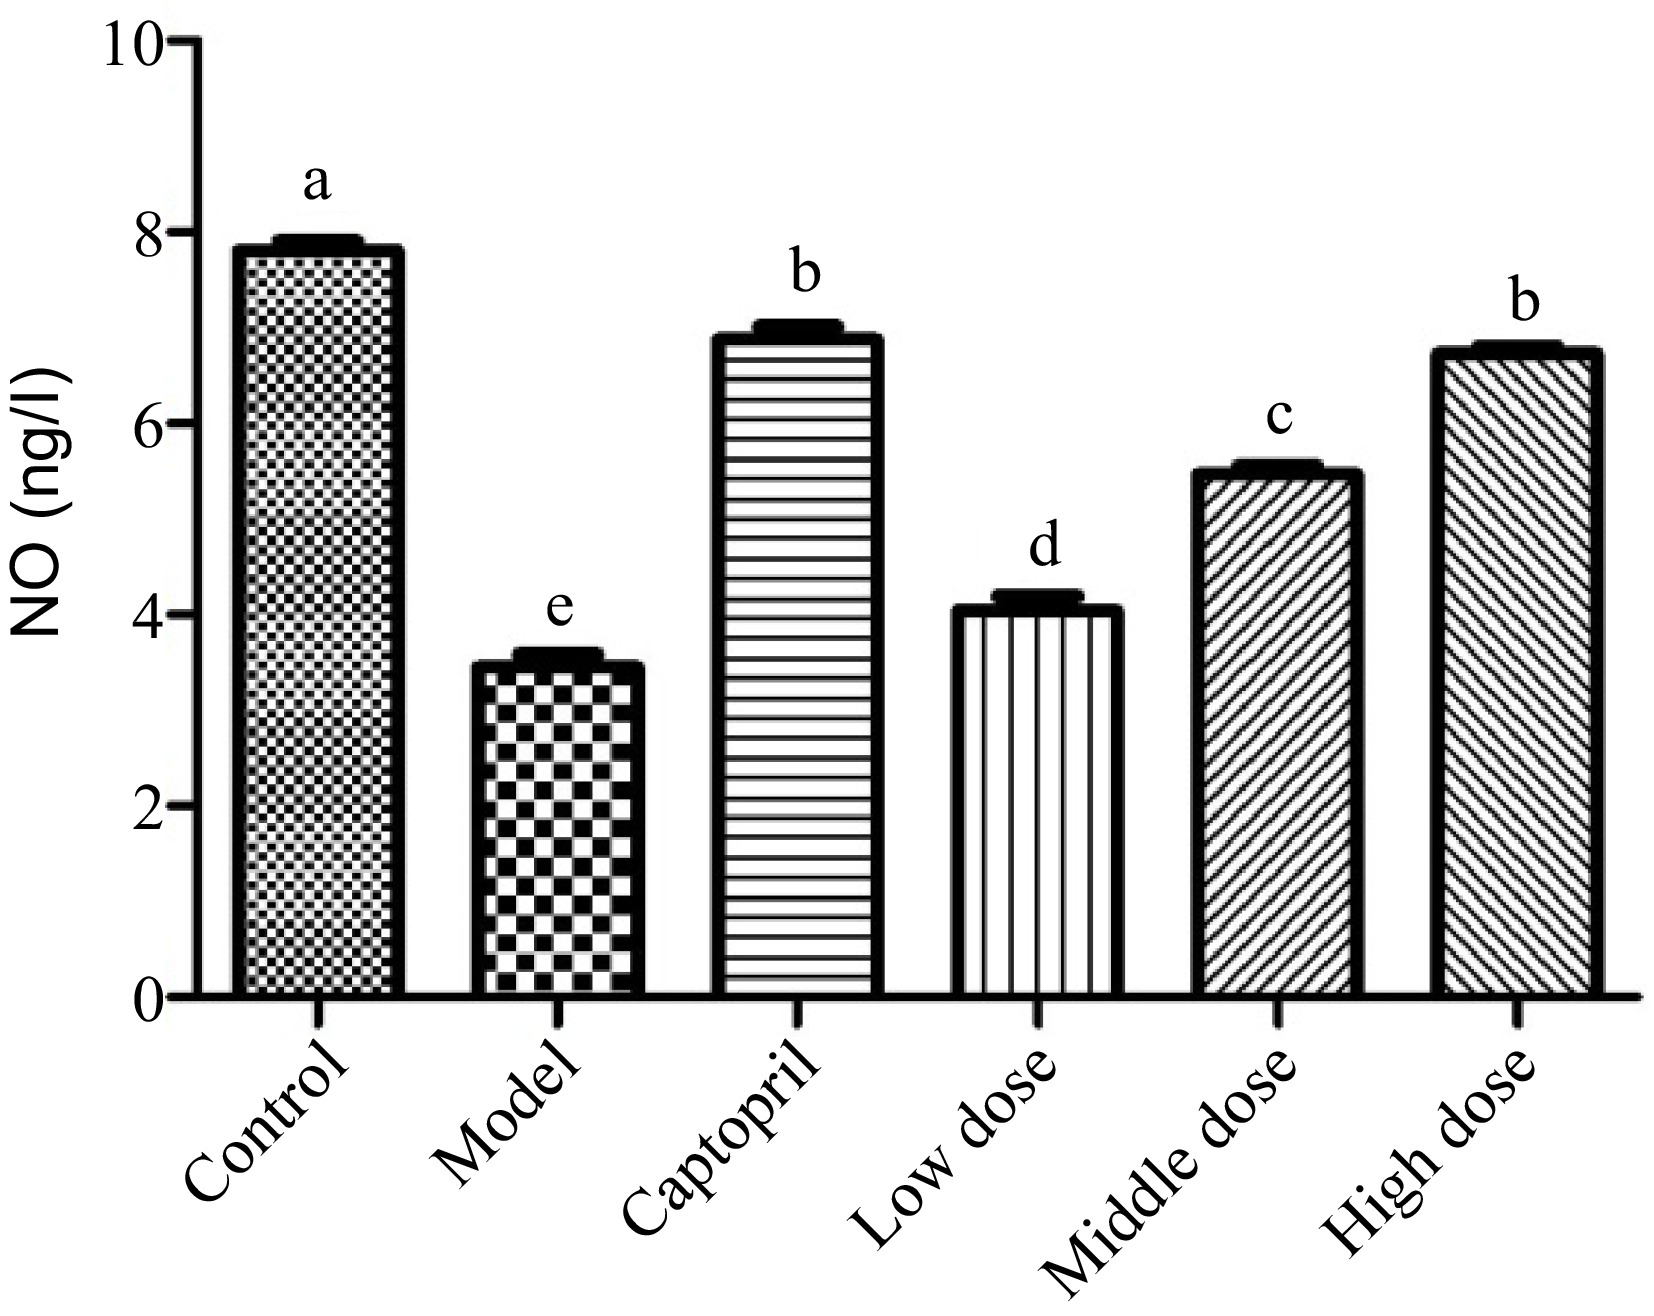
Figure 2.
The serum nitric acid (NO) levels in normal and spontaneously hypertensive rats treated with different Gaocha extract doses. Different letters represent significant difference at a significant level of 0.05.
-
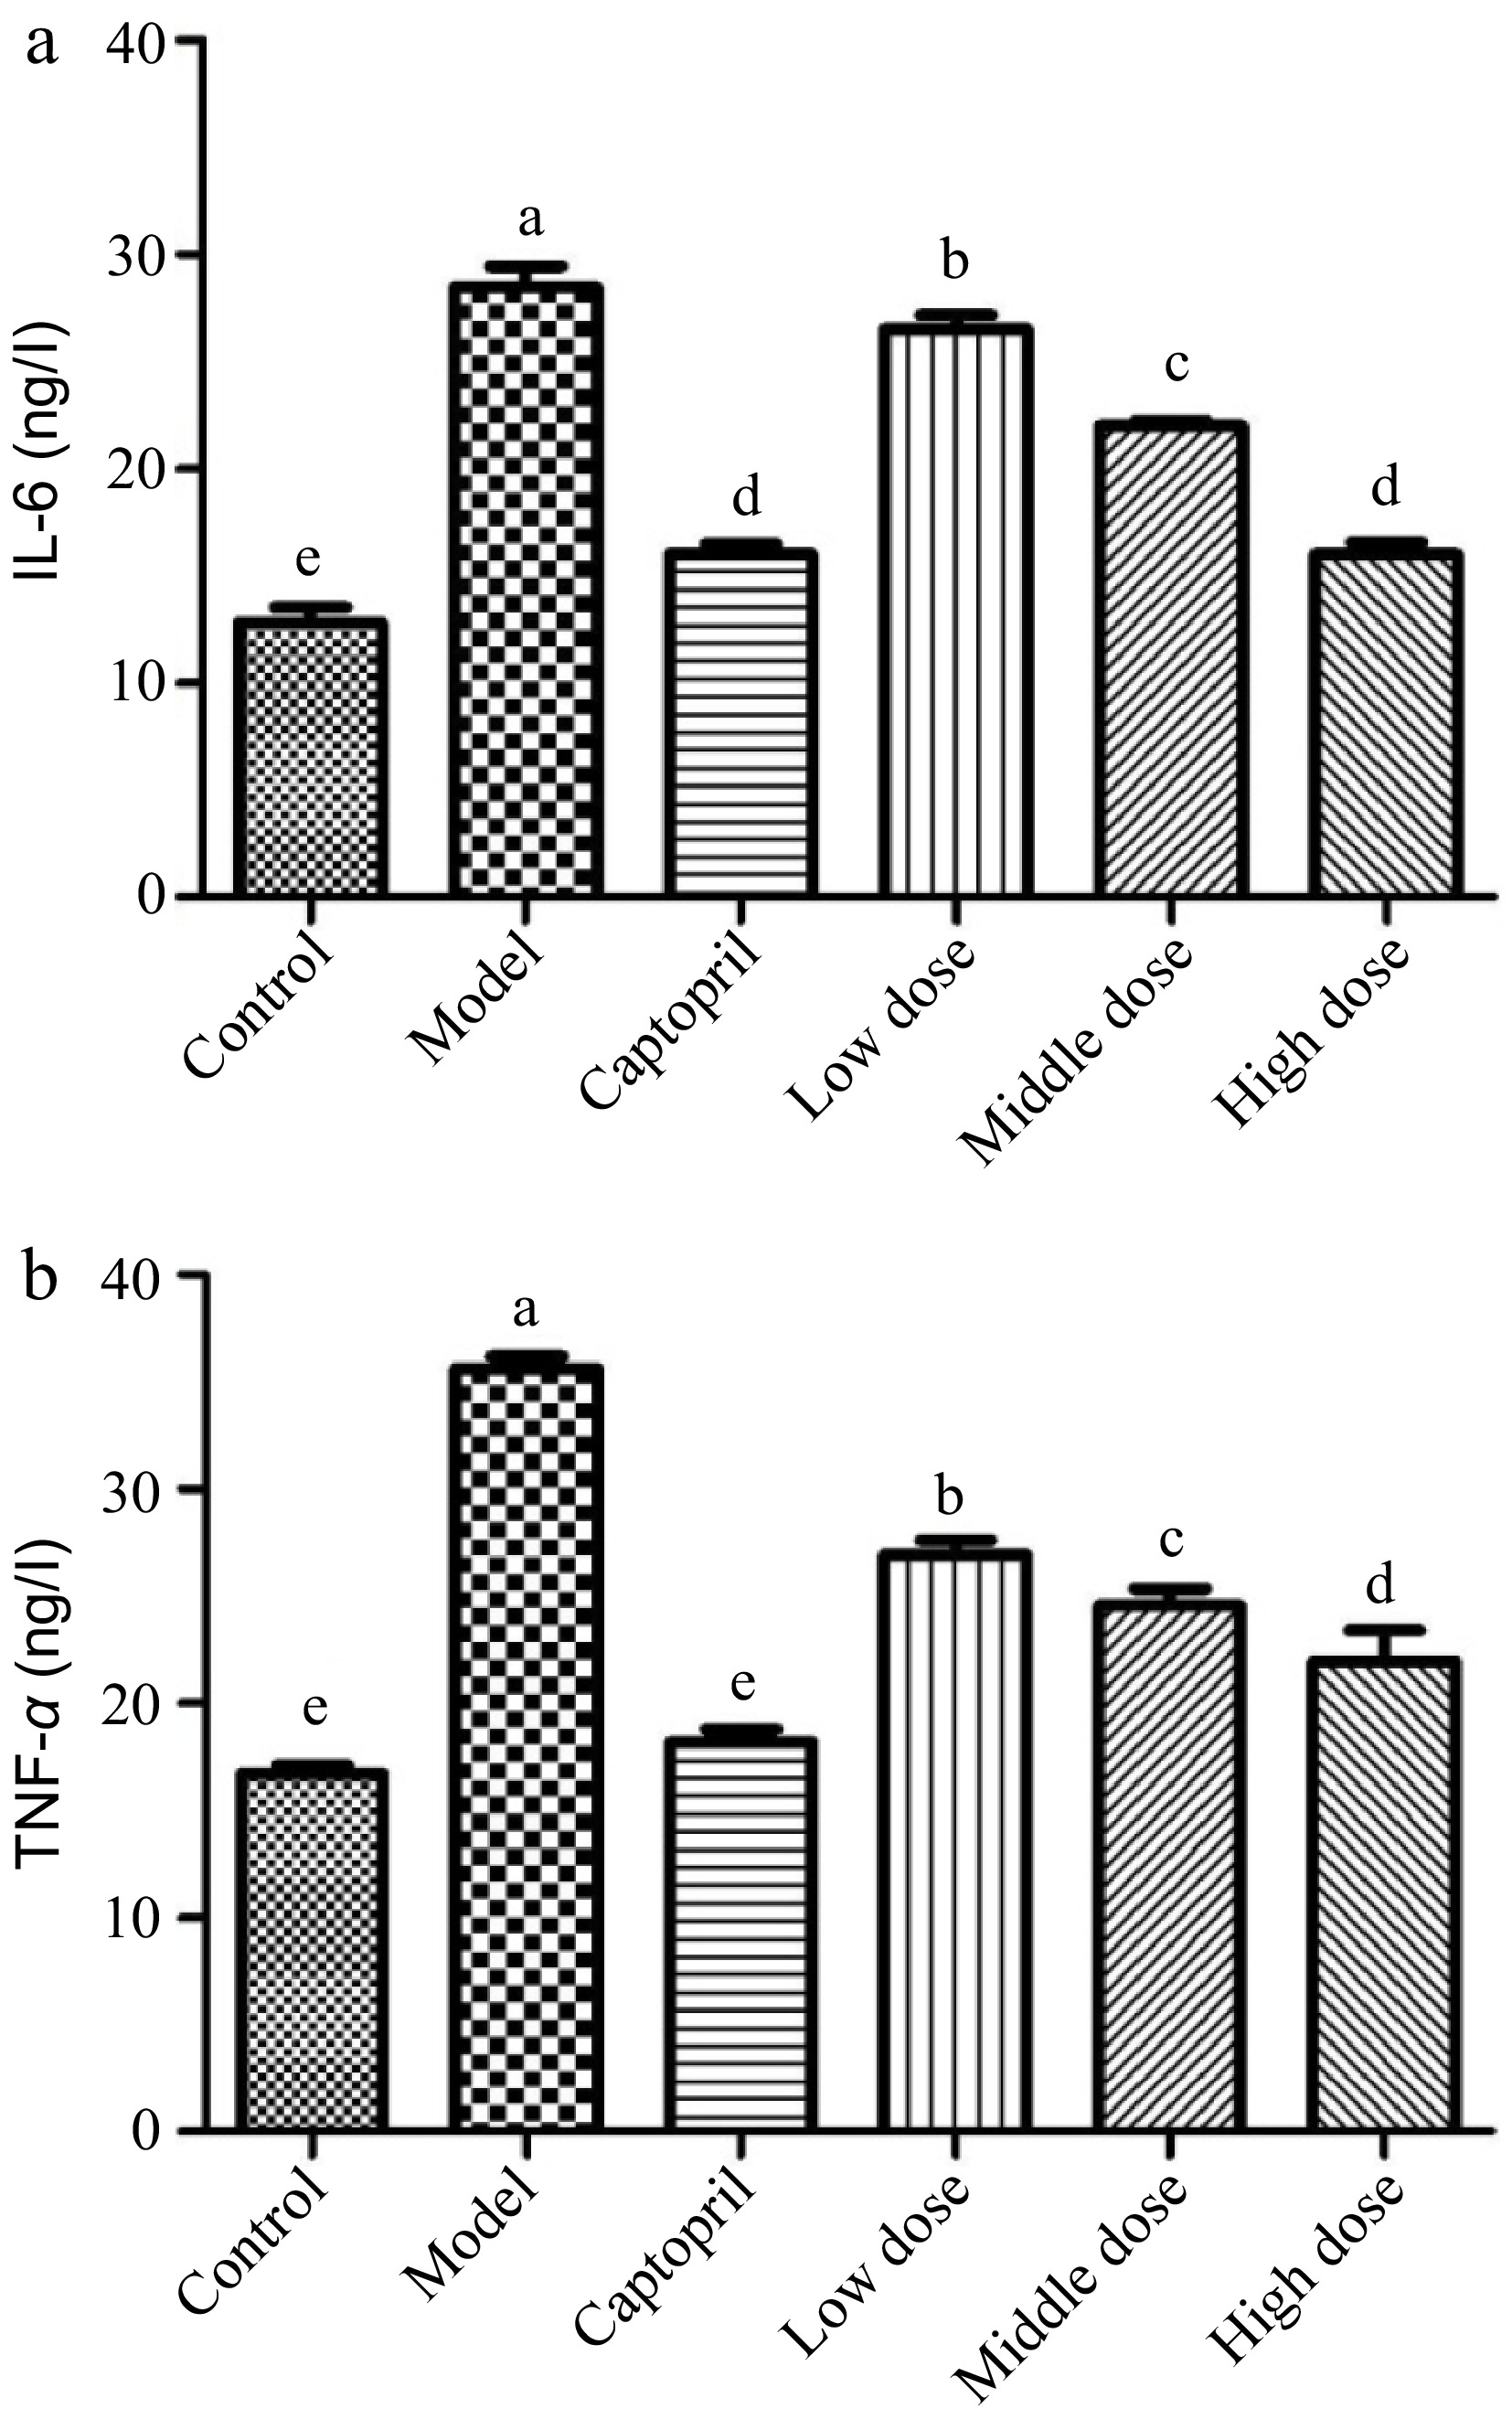
Figure 3.
The serum IL-6 and TNF-α levels in normal and spontaneously hypertensive rats treated with different Gaocha extract doses. (a) Serum IL-6 level and (b) Serum TNF-α level. Different letters represent significant difference at a significant level of 0.05.
-
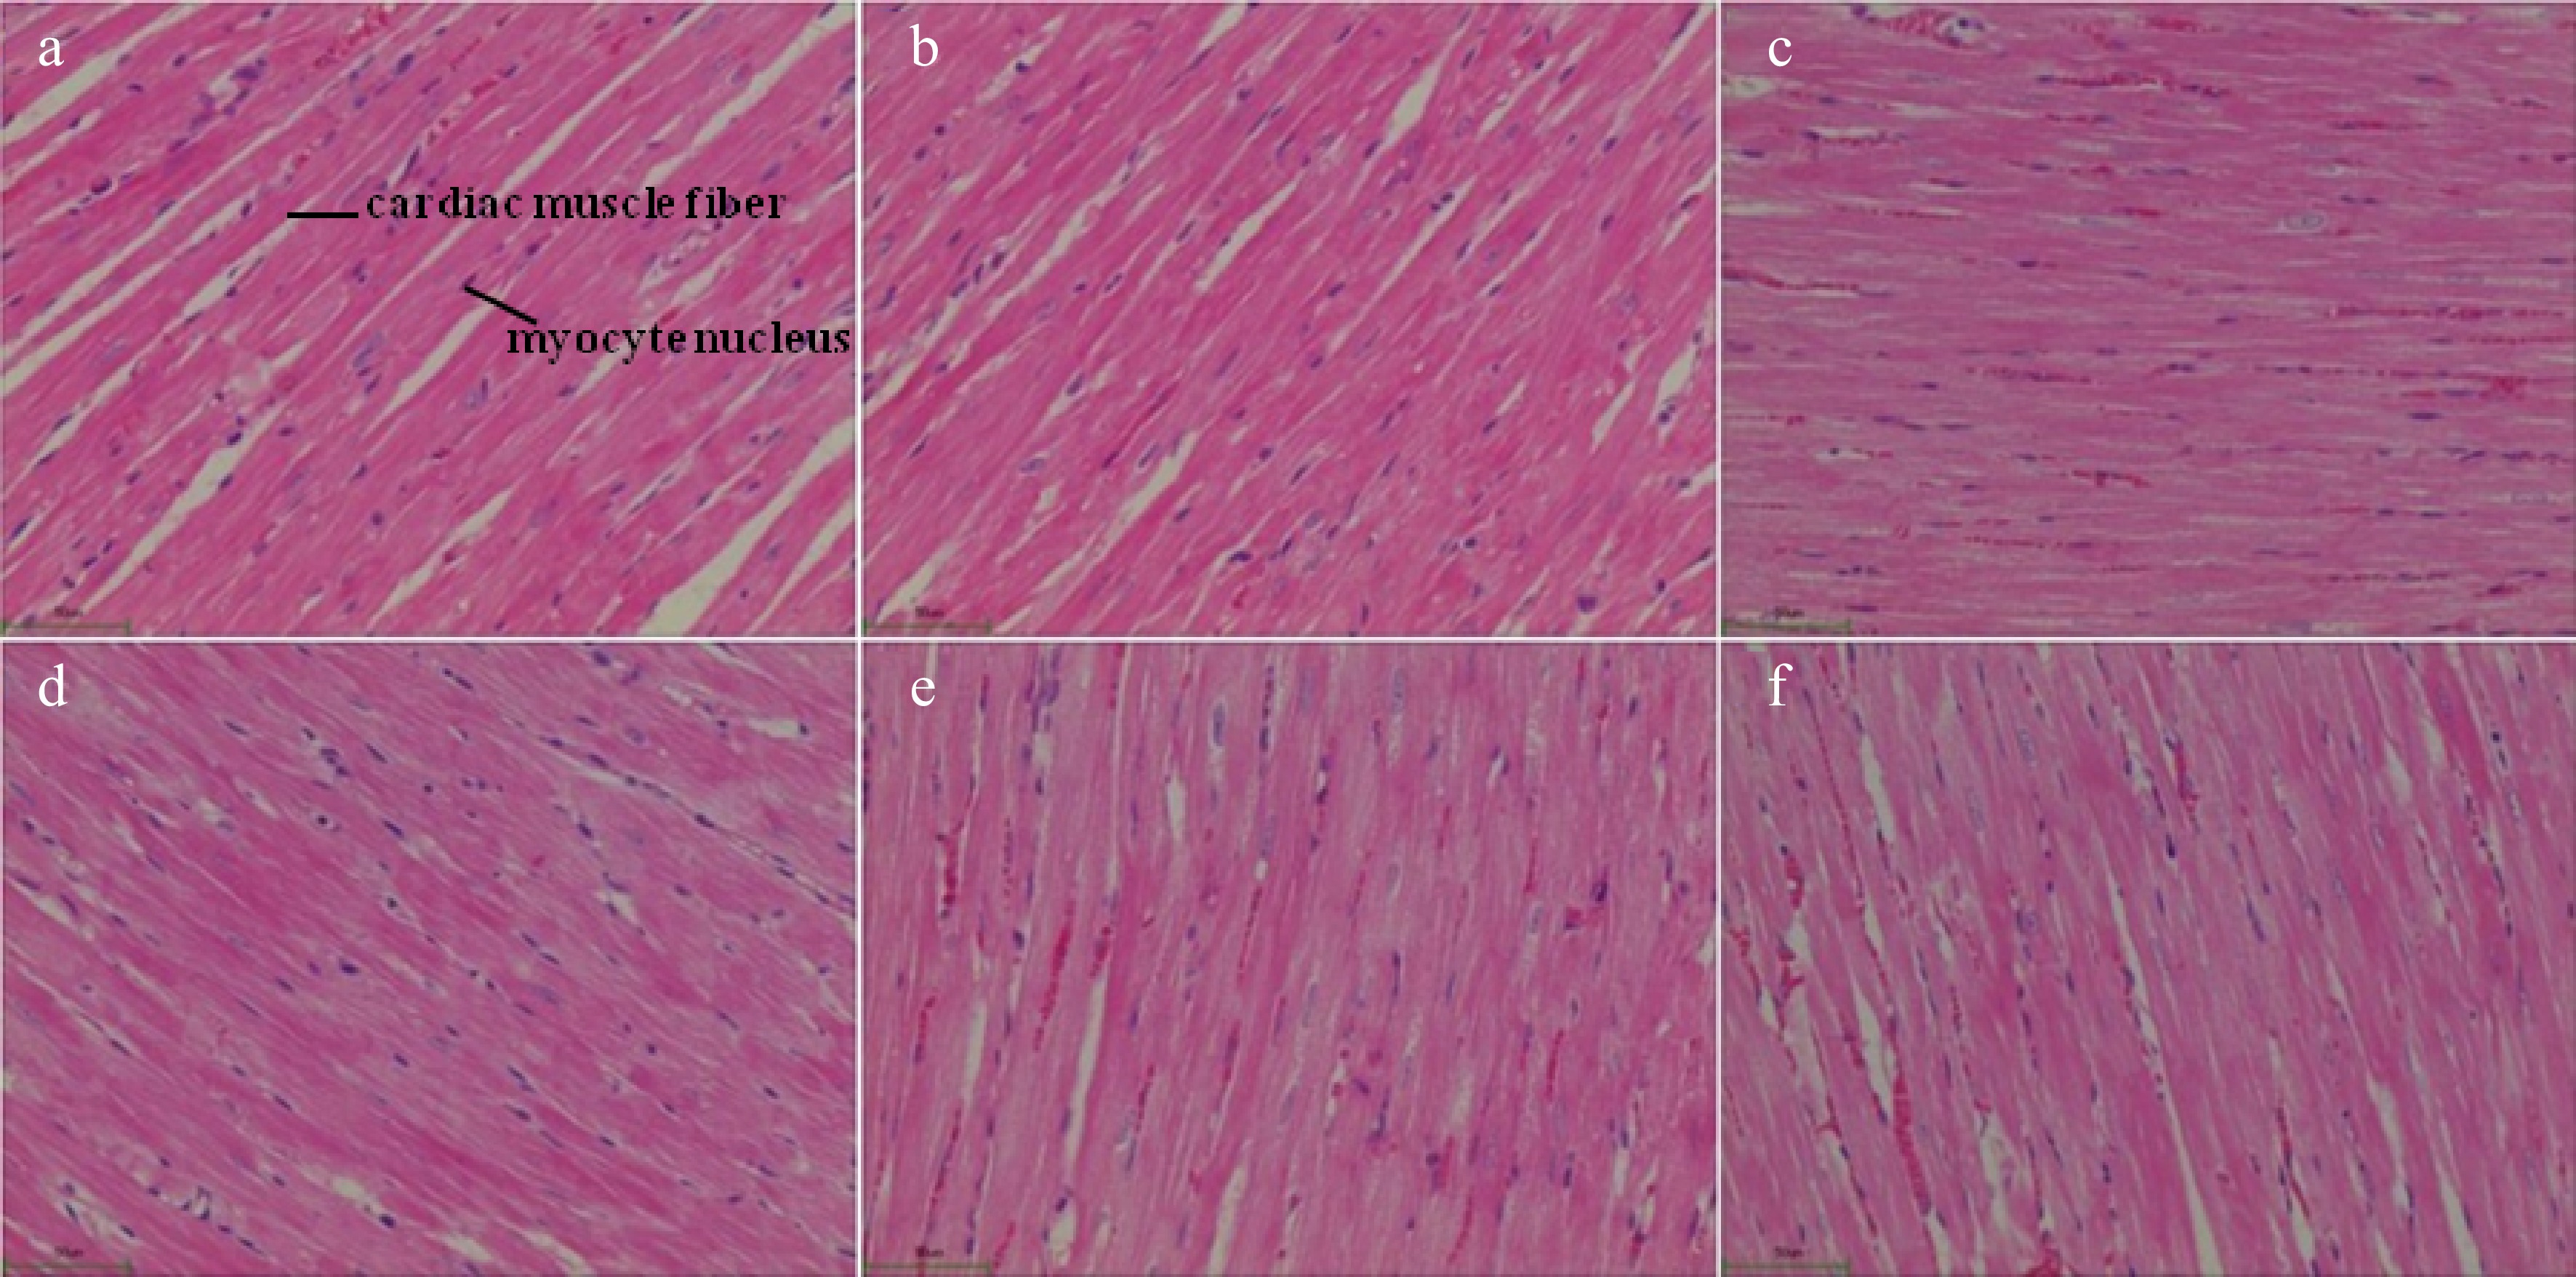
Figure 4.
Morphological feature of cardiac tissue in normal and spontaneously hypertensive rats treated with different Gaocha extract doses. (a) Normal rats in healthy control group.(b) Captopril treated spontaneously hypertensive rats. (c) Spontaneously hypertensive rats in disease control group. (d) Low Gaocha extract dose treated spontaneously hypertensive rats. (e) Mid Gaocha extract dose treated spontaneously hypertensive rats. (f) High Gaocha extract dose treated spontaneously hypertensive rats.
-
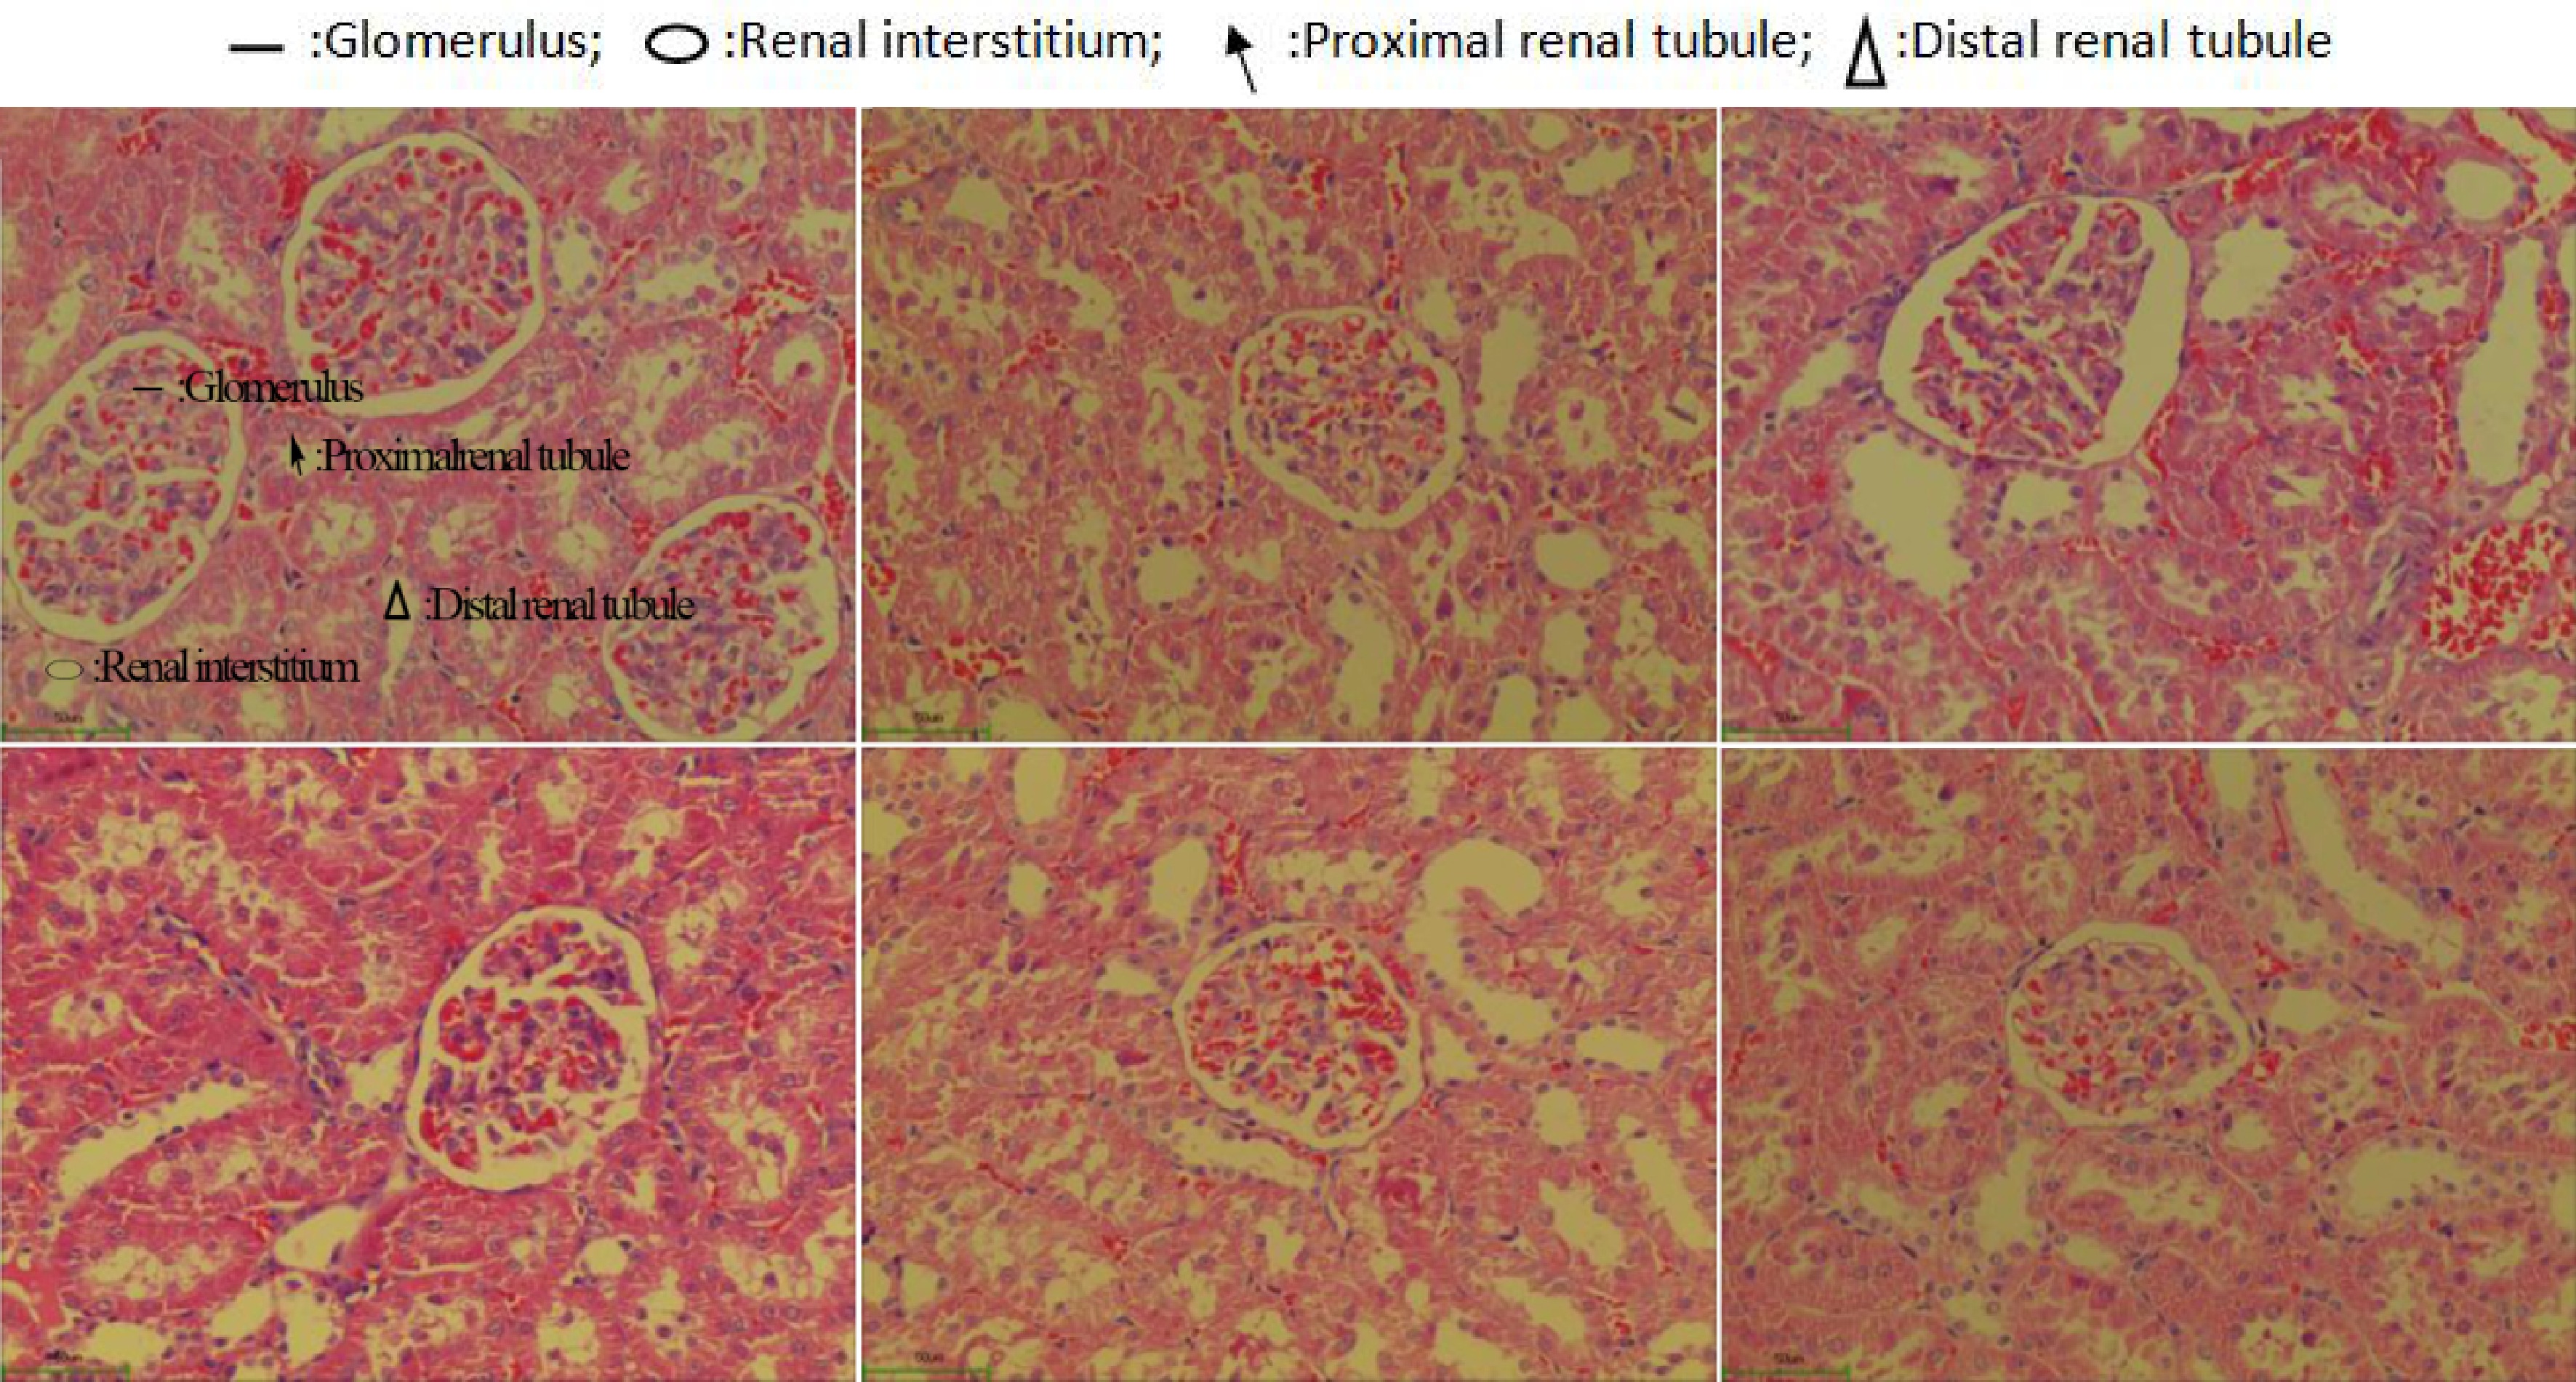
Figure 5.
Morphological feature of renal tissue in normal and spontaneously hypertensive rats treated with different Gaocha extract doses. (a) Normal rats in healthy control group.(b) Captopril treated spontaneously hypertensive rats. (c) Spontaneously hypertensive rats in disease control group. (d) Low Gaocha extract dose treated spontaneously hypertensive rats. (e) Mid Gaocha extract dose treated spontaneously hypertensive rats. (f) High Gaocha extract dose treated spontaneously hypertensive rats.
-
Phenolic compound Content (mg/g) Percentage (%) β-Glucogallin 0.50 ± 0.00 0.67 ± 0.00 Galloyl acid 0.74 ± 0.01 0.99 ± 0.02 Gallocatechin 3.11 ± 0.07 4.13 ± 0.14 Epigallocatechin 5.69 ± 0.08 7.55 ± 0.15 Catechin 1.95 ± 0.06 2.59 ± 0.05 Epicatechin 32.68 ± 0.76 43.35 ± 1.09 Polyphenol 75.40 ± 0.71 Polyphenol content was analysed using Folin-Cioalteu and expressed as mg galloyl acid/g dried Gaocha extract. Individual phenolic compounds were quantified using their corresponding standard and expressed as mg/g dried Gaocha extract. Data are the mean ± standard deviation of triplicate tests. Table 1.
Concentration of phenolic compounds in dried Gaocha extract.
-
Group Blood pressure during administration period (BP/mm Hg) 0 day 3 day 7 day 10 day 15 day Normal rats (healthy control) 114.48 ± 2.47e 109.92 ± 5.75e 112.23 ± 2.40e 116.49 ± 6.43d 115.87 ± 3.56d SHRs (disease control) 166.78 ± 2.71b 167.69 ± 2.46a 166.81 ± 2.71a 167.52 ± 2.56a 166.34 ± 2.99a SHRs with captopril (6.25 mg/kg) 165.36 ± 3.23b 123.92 ± 7.29cd 114.65 ± 2.71de 116.86 ± 4.62d 109.72 ± 3.51e SHRs with high Gaocha dose (12 mg/kg) 171.77 ± 5.13a 122.18 ± 4.67b 117.77 ± 3.53b 122.75 ± 1.72b 121.82 ± 3.41b SHRs with mid Gaocha dose (6 mg/kg) 161.72 ± 3.77c 127.99 ± 4.67c 125.37 ± 2.25c 125.48 ± 3.07c 123.91 ± 2.12c SHRs with low Gaocha dose (3 mg/kg) 169.17 ± 9.12ab 139.46 ± 1.69d 134.41 ± 3.85d 134.25 ± 3.49c 133.09 ± 3.76c Data are the mean ± standard error. Different letters in each column represent significant difference at a 0.05 significant level. Table 2.
Tail artery systolic blood pressure of normal and spontaneously hypertensive rats treated with different Gaocha extract levels during the administration period.
Figures
(5)
Tables
(2)