2024 Volume 4
Article Contents
About this article
ARTICLE   Open Access    

Chemical constitutes and anti-hypertension potential of Gaocha (Acer ginnala Maxim) in spontaneously hypertensive rat

  • # These authors contributed equally: Wenzhao Wang, Jing Ma

More Information
  • Gaocha is a kind of succedaneous tea beverage made by the tender shoots of Acer ginnala Maxim, widely distributed in China and Korea, which is used as a functional tea beverage with a long history dating back to 2000 BC. It has been used as folk medicine to depress blood pressure, however, little study has been reported on its antihypertensive mechanism. Thus, the present paper aimed at elucidating the bioactive constitutes in Gaocha extract and its effect of anti-hypertension on spontaneously hypertensive (SHR) rats. In this study, the phenolic compounds composition analysis showed that the total polyphenol content can reach 75.4 mg/g in dried Gaocha extract, and the content of epicatechin was 32.68 mg/g, indicating Gaocha may have many bioactivities. Therefore, in order to evaluate the anti-hypertension potential value of Gaocha extract, its effect on spontaneously hypertensive (SHR) rats was examined. Male SHR rats were randomly divided into the model (saline), positive control (captopril), low-dose Gaocha, medium-dose Gaocha and high-dose Gaocha groups. Every group was administered for 16 d. The results of tail artery systolic blood pressure (SBP) showed the Gaocha-treated groups had significantly lower SBP than the model group. Post-treatment abdominal aorta blood samples showed that the serum PGI2, Angiotensin II, ET, and NO levels in Gaocha-treated groups were significantly higher than these in the model group. After treating with Gaocha extract, the serum IL-6 and TNF-αlevels were significantly lower than these in the model group. The histomorphological examination of the heart and kidney also showed that Gaocha extract had a protective effect. Gaocha extract contained high levels of polyphenols with epicatechin as the predominant individual phenolic compound and has a significant improvement of anti-hypertension on spontaneously hypertensive (SHR) rats. The findings indicate that supplementation with Gaocha may contribute to preventing hypertension.
  • Columnar cacti are plants of the Cactaceae family distributed across arid and semi-arid regions of America, with ecological, economic, and cultural value[1]. One trait that makes it possible for the columnar cactus to survive in the desert ecosystem is its thick epidermis covered by a hydrophobic cuticle, which limits water loss in dry conditions[1]. The cuticle is the external layer that covers the non-woody aerial organs of land plants. The careful control of cuticle biosynthesis could produce drought stress tolerance in relevant crop plants[2]. In fleshy fruits, the cuticle maintains adequate water content during fruit development on the plant and reduces water loss in fruit during postharvest[3]. Efforts to elucidate the molecular pathway of cuticle biosynthesis have been carried out for fleshy fruits such as tomato (Solanum lycopersicum)[4], apple (Malus domestica)[5], sweet cherry (Prunus avium)[6], mango (Mangifera indica)[7], and pear (Pyrus 'Yuluxiang')[8].

    The plant cuticle is formed by the two main layers cutin and cuticular waxes[3]. Cutin is composed mainly of oxygenated long-chain (LC) fatty acids (FA), which are synthesized by cytochrome p450 (CYP) enzymes. CYP family 86 subfamily A (CYP86A) enzymes carry out the terminal (ω) oxidation of LC-FA[9]. Then, CYP77A carries out the mid-chain oxidation to synthesize the main cutin monomers. In Arabidopsis, AtCYP77A4 and AtCYP77A6 carry out the synthesis of mid-chain epoxy and mid-chain dihydroxy LC-FA, respectively[10,11]. AtCYP77A6 is required for the cutin biosynthesis and the correct formation of floral surfaces[10]. The expression of CYP77A19 (KF410855) and CYP77A20 (KF410856) from potato (Solanum tuberosum) restored the petal cuticular impermeability in Arabidopsis null mutant cyp77a6-1, tentatively by the synthesis of cutin monomers[12]. In eggplant (Solanum torvum), the over-expression of StoCYP77A2 leads to resistance to Verticillium dahlia infection in tobacco plants[13]. Although the function of CYP77A2 in cutin biosynthesis has not yet been tested, gene expression analysis suggests that CaCYP77A2 (A0A1U8GYB0) could play a role in cutin biosynthesis during pepper fruit development[14].

    It has been hypothesized that the export of cuticle precursors is carried out by ATP binding cassette subfamily G (ABCG) transporters. ABCG11/WBC11, ABCG12, and ABCG13 are required for the load of cuticle lipids in Arabidopsis[1517], but ABCG13 function appears to be specific to the flower epidermis[18]. The overexpression of TsABCG11 (JQ389853) from Thellungiella salsugineum increases cuticle amounts and promotes tolerance to different abiotic stresses in Arabidopsis[19].

    Once exported, the cutin monomers are polymerized on the surface of epidermal cells. CD1 code for a Gly-Asp-Ser-Leu motif lipase/esterase (GDSL) from tomato required for the cutin formation through 2-mono(10,16-dihydroxyhexadecanoyl)glycerol esterification[20]. GDSL1 from tomato carries out the ester bond cross-links of cutin monomers located at the cuticle layers and is required for cuticle deposition in tomato fruits[21]. It has been shown that the transcription factor MIXTA-like reduces water loss in tomato fruits through the positive regulation of the expression of CYP77A2, ABCG11, and GDSL1[22]. Despite the relevant role of cuticles in maintaining cactus homeostasis in desert environments[1], the molecular mechanism of cuticle biosynthesis has yet to be described for cactus fruits.

    Stenocereus thurberi is a columnar cactus endemic from the Sonoran desert (Mexico), which produces an ovoid-globose fleshy fruit named sweet pitaya[23]. In its mature state, the pulp of sweet pitaya contains around 86% water with a high content of antioxidants and natural pigments such as betalains and phenolic compounds, which have nutraceutical and industrial relevance[23]. Due to the arid environment in which pitaya fruit grows, studying its molecular mechanism of cuticle biosynthesis can generate new insights into understanding species' adaptation mechanisms to arid environments. Nevertheless, sequences of transcripts from S. thurberi in public databases are scarce.

    RNA-sequencing technology (RNA-seq) allows the massive generation of almost all the transcripts from non-model plants, even if no complete assembled genome is available[24]. Recent advances in bioinformatic tools has improved our capacity to identify long non-coding RNA (lncRNA), which have been showed to play regulatory roles in relevant biological processes, such as the regulation of drought stress tolerance in plants[25], fruit development, and ripening[2629].

    In this study, RNA-seq data were obtained for the de novo assembly and characterization of the S. thurberi fruit peel transcriptome. As a first approach, three transcripts, StCYP77A, StABCG11, and StGDSL1, tentatively involved in cuticle biosynthesis, were identified and quantified during sweet pitaya fruit development. Due to no gene expression analysis having been carried out yet for S. thurberi, stably expressed constitutive genes were identified for the first time.

    Sweet pitaya fruits (S. thurberi) without physical damage were hand harvested from plants in a native conditions field located at Carbó, Sonora, México. They were collocated in a cooler containing dry ice and transported immediately to the laboratory. The superficial part of the peels (~1 mm deep) was removed carefully from the fruits using a scalpel. Peel samples from three fruits were pooled according to their tentative stage of development defined by their visual characteristics, frozen in liquid nitrogen, and pulverized to create a single biological replicate. Four samples belonging to four different plants were analyzed. All fruits harvested were close to the ripening stage. Samples named M1 and M2 were turning from green to ripe [~35−40 Days After Flowering (DAF)], whereas samples M3 and M4 were turning from ripe to overripe (~40−45 DAF).

    Total RNA was isolated from the peels through the Hot Borate method[30]. The concentration and purity of RNA were determined in a spectrophotometer Nanodrop 2000 (Thermo Fisher) by measuring the 260/280 and 260/230 absorbance ratios. RNA integrity was evaluated through electrophoresis in agarose gel 1% and a Bioanalyzer 2100 (Agilent). Pure RNA was sequenced in the paired-end mode in an Illumina NextSeq 500 platform at the University of Arizona Genetics Core Facility. Four RNA-seq libraries, each of them from each sample, were obtained, which include a total of 288,199,704 short reads with a length of 150 base pairs (bp). The resulting sequence data can be accessed at the Sequence Read Archive (SRA) repository of the NCBI through the BioProject ID PRJNA1030439. Libraries are named corresponding to the names of samples M1, M2, M3, and M4.

    FastQC software (www.bioinformatics.babraham.ac.uk/projects/fastqc) was used for short reads quality analysis. Short reads with poor quality were trimmed or eliminated by Trimmomatic (www.usadellab.org/cms/?page=trimmomatic) with a trailing and leading of 25, a sliding window of 4:25, and a minimum read length of 80 bp. A total of 243,194,888 reads with at least a 25 quality score on the Phred scale were used to carry out the de novo assembly by Trinity (https://github.com/trinityrnaseq/trinityrnaseq/wiki) with the following parameters: minimal k-mer coverage of 1, normalization of 50, and minimal transcript length of 200 bp.

    Removal of contaminating sequences and ribosomal RNA (rRNA) was carried out through SeqClean. To remove redundancy, transcripts with equal or more than 90% of identity were merged through CD-hit (www.bioinformatics.org/cd-hit/). Alignment and quantification in terms of transcripts per million (TPM) were carried out through Bowtie (https://bowtie-bio.sourceforge.net/index.shtml) and RSEM (https://github.com/deweylab/RSEM), respectively. Transcripts showing a low expression (TPM < 0.01) were discarded. Assembly quality was evaluated by calculating the parameters N50 value, mean transcript length, TransRate score, and completeness. The statistics of the transcriptome were determined by TrinityStats and TransRate (https://hibberdlab.com/transrate/). The transcriptome completeness was determined through a BLASTn alignment (E value < 1 × 10⁻³) by BUSCO (https://busco.ezlab.org/) against the database of conserved orthologous genes from Embryophyte.

    To predict the proteins tentatively coded in the S. thurberi transcriptome, the best homology match of the assembled transcripts was found by alignment to the Swiss-Prot, RefSeq, nr-NCBI, PlantTFDB, iTAK, TAIR, and ITAG databases using the BLAST algorithm with an E value threshold of 1 × 10⁻¹⁰ for the nr-NCBI database and of 1 × 10⁻⁵ for the others[3134]. An additional alignment was carried out to the protein databases of commercial fruits Persea americana, Prunus persica, Fragaria vesca, Citrus cinensis, and Vitis vinifera to proteins of the cactus Opuntia streptacantha, and the transcriptomes of the cactus Hylocereus polyrhizus, Pachycereus pringlei, and Selenicereus undatus. The list of all databases and the database websites of commercial fruits and cactus are provided in Supplementary Tables S1 & S2. The open reading frame (ORF) of the transcripts and the protein sequences tentative coded from the sweet pitaya transcriptome was predicted by TransDecoder (https://github.com/TransDecoder/TransDecoder/wiki), considering a minimal ORF length of 75 amino acids (aa). The search for protein domains was carried out by the InterPro database (www.ebi.ac.uk/interpro). Functional categorization was carried out by Blast2GO based on GO terms and KEGG metabolic pathways[35].

    LncRNA were identified based on the methods reported in previous studies[25,29,36]. Transcripts without homology to any protein from Swiss-Prot, RefSeq, nr-NCBI, PlantTFDB, iTAK, TAIR, ITAG, P. americana, P. persica, F. vesca, C. cinensis, V. vinifera, and O. streptacantha databases, without a predicted ORF longer than 75 aa, and without protein domains in the InterPro database were selected to identify tentative lncRNA.

    Transcripts coding for signal peptide or transmembrane helices were identified by SignalP (https://services.healthtech.dtu.dk/services/SignalP-6.0/) and TMHMM (https://services.healthtech.dtu.dk/services/TMHMM-2.0/), respectively, and discarded. Further, transcripts corresponding to other non-coding RNAs (ribosomal RNA and transfer RNA) were identified through Infernal by using the Rfam database[37] and discarded. The remaining transcripts were analyzed by CPC[38], and CPC2[39] to calculate their coding potential. Transcripts with a coding potential score lower than −1 for CPC and a coding probability lower than 0.1 for CPC2 were considered lncRNA. To characterize the identified lncRNA, the length and abundance of coding and lncRNA were calculated. Bowtie and RSEM were used to align and quantify raw counts, respectively. The edgeR package[40] was used to normalize raw count data in terms of counts per million (CPM) for both coding and lncRNA.

    To obtain the transcript's expression, the aligning of short reads and quantifying of transcripts were carried out through Bowtie and RSEM software, respectively. A differential expression analysis was carried out between the four libraries by edgeR package in R Studio. Only the transcripts with a count equal to or higher than 0.5 in at least one sample were retained for the analysis. Transcripts with log2 Fold Change (log2FC) between +1 and −1 and with a False Discovery Rate (FDR) lower than 0.05 were taken as not differentially expressed (NDE).

    For the identification of the tentative reference genes two strategies were carried out as described below: i) The NDE transcripts were aligned by BLASTn (E value < 1 × 10⁻⁵) to 43 constitutive genes previously reported in fruits from the cactus H. polyrhizus, S. monacanthus, and S. undatus[4143] to identify possible homologous constitutive genes in S. thurberi. Then, the homologous transcripts with the minimal coefficient of variation (CV) were selected; ii) For all the NDE transcripts, the percentile 95 value of the mean CPM and the percentile 5 value of the CV were used as filters to recover the most stably expressed transcripts, based on previous studies[44]. Finally, transcripts to be tested by quantitative reverse transcription polymerase chain reaction (qRT-PCR) were selected based on their homology and tentative biological function.

    The fruit harvesting was carried out as described above. Sweet pitaya fruit takes about 43 d to ripen, therefore, open flowers were tagged, and fruits with 10, 20, 30, 35, and 40 DAF were collected to cover the pitaya fruit development process (Supplementary Fig. S1). The superficial part of the peels (~1 mm deep) was removed carefully from the fruits using a scalpel. Peel samples from three fruits were pooled according to their stage of development defined by their DAF, frozen in liquid nitrogen, and pulverized to create a single biological replicate. One biological replicate consisted of peels from three fruits belonging to the same plant. Two to three biological replicates were evaluated for each developmental stage. Two technical replicates were analyzed for each biological replicate. RNA extraction, quantification, RNA purity, and RNA integrity analysis were carried out as described above.

    cDNA was synthesized from 100 ng of RNA by QuantiTect Reverse Transcription Kit (QIAGEN). Primers were designed using the PrimerQuest™, UNAFold, and OligoAnalyzer™ tools from Integrated DNA Technologies (www.idtdna.com/pages) and following the method proposed by Thornton & Basu[45]. Transcripts quantification was carried out in a QIAquant 96 5 plex according to the PowerUp™ SYBR™ Green Master Mix protocol (Applied Biosystems), with a first denaturation step for 2 min at 95 °C, followed by 40 cycles of denaturation step at 95 °C for 15 s, annealing and extension steps for 30 s at 60 °C.

    The Cycle threshold (Ct) values obtained from the qRT-PCR were analyzed through the algorithms BestKeeper, geNorm, NormFinder, and the delta Ct method[46]. RefFinder (www.ciidirsinaloa.com.mx/RefFinder-master/) was used to integrate the stability results and to find the most stable expressed transcripts in sweet pitaya fruit peel during development. The pairwise variation value (Vn/Vn + 1) was calculated through the geNorm algorithm in R Studio software[47].

    An alignment of 17 reported cuticle biosynthesis genes from model plants were carried out by BLASTx against the predicted proteins from sweet pitaya. Two additional alignments of 17 charaterized cuticle biosynthesis proteins from model plants against the transcripts and predicted proteins of sweet pitaya were carried out by tBLASTn and BLASTp, respectively. An E value threshold of 1 × 10⁻⁵ was used, and the unique best hits were recovered for all three alignments. The sequences of the 17 characterized cuticle biosynthesis genes and proteins from model plants are showed in Supplementary Table S3. The specific parameters and the unique best hits for all the alignments carried out are shown in Supplementary Tables S4S8.

    Cuticle biosynthesis-related transcripts tentatively coding for a cytochrome p450 family 77 subfamily A (CYP77A), a Gly-Asp-Ser-Leu motif lipase/esterase 1 (GDSL1), and an ATP binding cassette transporter subfamily G member 11 (ABCG11) were identified by best bi-directional hit according to the functional annotation described above. Protein-conserved domains, signal peptide, and transmembrane helix were predicted through InterProScan, SignalP 6.0, and TMHMM, respectively. Alignment of the protein sequences to tentative orthologous of other plant species was carried out by the MUSCLE algorithm[48]. A neighbor-joining (NJ) phylogenetic tree with a bootstrap of 1,000 replications was constructed by MEGA11[49].

    Fruit sampling, primer design, RNA extraction, cDNA synthesis, and transcript quantification were performed as described above. Relative expression was calculated according to the 2−ΔΔCᴛ method[50]. The sample corresponding to 10 DAF was used as the calibrator. The transcripts StEF1a, StTUA, StUBQ3, and StEF1a + StTUA were used as normalizer genes.

    Normality was assessed according to the Shapiro-Wilk test. Significant differences in the expression of the cuticle biosynthesis-related transcripts between fruit developmental stages were determined by one-way ANOVA based on a completely randomized sampling design and a Tukey honestly significant difference (HSD) test, considering a p-value < 0.05 as significant. Statistical analysis was carried out through the stats package in R Studio.

    RNA was extracted from the peels of ripe sweet pitaya fruits (S. thurberi) from plants located in the Sonoran Desert, Mexico. Four cDNA libraries were sequenced in an Illumina NextSeq 500 platform at the University of Arizona Genetics Core Facility. A total of 288,199,704 reads with 150 base pairs (bp) in length were sequenced in paired-end mode. After trimming, 243,194,888 (84.38%) cleaned short reads with at least 29 mean quality scores per read in the Phred scale and between 80 to 150 bp in length were obtained to carry out the assembly. After removing contaminating sequences, redundancy, and low-expressed transcripts, the assembly included 174,449 transcripts with an N50 value of 2,110 bp. Table 1 shows the different quality variables of the S. thurberi fruit peel transcriptome. BUSCO score showed that 85.4% are completed transcripts, although out of these, 37.2% were found to be duplicated. The resulting sequence data can be accessed at the SRA repository of the NCBI through the BioProject ID PRJNA1030439.

    Table 1.  Quality metrics of the Stenocereus thurberi fruit peel transcriptome.
    Metric Data
    Total transcripts 174,449
    N50 2,110
    Smallest transcript length (bp) 200
    Largest transcript length (bp) 19,114
    Mean transcript length (bp) 1,198.69
    GC (%) 41.33
    Total assembled bases 209,110,524
    TransRate score 0.05
    BUSCO score (%) C: 85.38 (S:48.22, D:37.16),
    F: 10.69, M: 3.93.
    Values were calculated through the TrinityStats function of Trinity and TransRate software. Completeness analysis was carried out through BUSCO by aligning the transcriptome to the Embryophyte database through BLAST with an E value threshold of 1 × 10⁻³. Complete (C), single (S), duplicated (D), fragmented (F), missing (M).
     | Show Table
    DownLoad: CSV

    A summary of the homology search in the main public protein database for the S. thurberi transcriptome is shown in Supplementary Table S1. From these databases, the higher homologous transcripts were found in RefSeq with 93,993 (53.87 %). Based on the E value distribution, for 41,685 (44%) and 68,853 (49%) of the hits, it was found a strong homology (E value lower than 1 × 10−50) to proteins in the Swiss-Prot and RefSeq databases, respectively (Supplementary Fig. S2a & b). On the other hand, 56,539 (52.34%) and 99,599 (71.11%) of the matches showed a percentage of identity higher than 60% in the Swiss-Prot and RefSeq databases, respectively (Supplementary Fig. S2c & d).

    Figure 1 shows the homology between transcripts from S. thurberi and proteins of commercial fruits, as well as proteins and transcripts of cacti. Transcripts from S. thurberi homologous to proteins from fruits of commercial interest avocado (P. americana), peach (P. persica), strawberry (F. vesca), orange (C. sinensis), and grapefruit (V. vinifera) ranged from 77,285 (44.30%) to 85,421 (48.96%), with 70,802 transcripts homologous to all the five fruit protein databases (Fig. 1a).

    Transcripts homologous to transcripts or proteins from the cactus dragon fruit (H. polyrhizus), prickly pear cactus (O. streptacantha), Mexican giant cardon (P. pringlei), and pitahaya (S. undatus) ranged from 76,238 (43.70%) to 114,933 (65.88%), with 64,009 transcripts homologous to all the four cactus databases (Fig. 1b). Further, out of the total of transcripts, 44,040 transcripts (25.25%) showed homology only to sequences from cactus, but not for model plants Arabidopsis, tomato, or the commercial fruits included in this study (Fig. 1c).

    Figure 1.  Venn diagram of the homology search results against model plants databases, commercial fruits, and cactus. The number in the diagram corresponds to the number of transcripts from S. thurberi homologous to sequences from that plant species. (a) Homologous to sequences from Fragaria vesca (Fa), Persea americana (Pa), Prunus persica (Pp), Vitis vinifera (Vv), and Citrus sinensis (Cs). (b) Homologous to sequences from Opuntia streptacantha (Of), Selenicereus undatus (Su), Hylocereus polyrhizus (Hp), and Pachycereus pringlei (Pap). (c) Homologous to sequences from Solanum lycopersicum (Sl), Arabidopsis thaliana (At), from the commercial fruits (Fa, Pa, Pp, Vv, and Cs), or the cactus included in this study (Of, Su, Hp, and Pap). Homologous searching was carried out by BLAST alignment (E value < 1 × 10⁻⁵). The Venn diagrams were drawn by ggVennDiagram in R Studio.

    A total of 45,970 (26.35%), 58,704 (33.65%), and 48,186 (27.65%) transcripts showed homology to transcription factors, transcriptional regulators, and protein kinases in the PlantTFDB, iTAK-TR, and iTAK-PK databases, respectively (Supplementary Tables S1, S9S11). For the PlantTFDB, the homologous transcripts belong to 57 transcriptional factors (TF) families (Fig. 2 & Supplementary Table S9), from which, the most frequent were the basic-helix-loop-helix (bHLH), myeloblastosis-related (MYB-related), NAM, ATAF, and CUC (NAC), ethylene responsive factor (ERF), and the WRKY domain families (WRKY) (Fig. 2).

    Figure 2.  Transcription factor (TF) families distribution of S. thurberi fruit peel transcriptome. The X-axis indicates the number of transcripts with hits to each TF family. Alignment to the PlantTFDB database by BLASTx was carried out with an E value threshold of 1 × 10⁻⁵. The bar graph was drawn by ggplot2 in R Studio.

    Based on the homology found and the functional domain searches, gene ontology terms (GO) were assigned to 68,559 transcripts (Supplementary Table S12). Figure 3 shows the top 20 GO terms assigned to the S. thurberi transcriptome, corresponding to the Biological Processes (BP) and Molecular Function (MF) categories. For BP, organic substance metabolic processes, primary metabolic processes, and cellular metabolic processes showed a higher number of transcripts (Supplementary Table S13). Further, for MF, organic cyclic compound binding, heterocyclic compound binding, and ion binding were the processes with the higher number of transcripts. S. thurberi transcripts were classified into 142 metabolic pathways from the KEGG database (Supplementary Table S14). The pathways with the higher number of transcripts recorded were pyruvate metabolism, glycerophospholipid metabolism, glycolysis/gluconeogenesis, and citrate cycle. Further, among the top 20 KEEG pathways, the cutin, suberin, and wax biosynthesis include more than 30 transcripts (Fig. 4).

    Figure 3.  Top 20 Gene Ontology (GO) terms assigned to the S. thurberi fruit peel transcriptome. Bars indicate the number of transcripts assigned to each GO term. Assignment of GO terms was carried out by Blast2GO with default parameters. BP and MF mean Biological Processes and Molecular Functions GO categories, respectively. The graph was drawn by ggplot2 in R Studio.
    Figure 4.  Top 20 KEGG metabolic pathways distribution in the S. thurberi fruit peel transcriptome. Bars indicate the number of transcripts assigned to each KEGG pathway. Assignment of KEGG pathways was carried out in the Blast2GO suite. The bar graph was drawn by ggplot2 in R Studio.

    Out of the total of transcripts, 43,391 (24.87%) were classified as lncRNA (Supplementary Tables S15 & S16). Figure 5 shows a comparison of the length (Fig. 5a) and expression (Fig. 5b) of lncRNA and coding RNA. Both length and expression values were higher in coding RNA than in lncRNA. In general, coding RNA ranged from 201 to 18,629 bp with a mean length of 1,507.18, whereas lncRNA ranged from 200 to 5,198 bp with a mean length of 481.51 (Fig. 5a). The higher expression values recorded from coding RNA and lncRNA were 12.83 and 9.45 log2(CPM), respectively (Fig. 5b).

    Figure 5.  Comparison of coding RNA and long non-coding RNA (lncRNA) from S. thurberi transcriptome. (a) Box plot of transcript length distribution. The Y-axis indicates the length of each transcript in base pairs. (b) Box plot of expression levels. The Y-axis indicates the log2 of the count per million of reads (log2(CPM)) recorded for each transcript. Expression levels were calculated by the edgeR package in R studio. (a), (b) The lines inside the boxes indicate the median. The higher and lower box limits represent the 75th and 25th percentiles, respectively. The box plots were drawn by ggplot2 in R Studio.

    To identify the transcripts without significant changes in expression between the four RNA-seq libraries, a differential expression analysis was carried out. Of the total of transcripts, 4,980 were not differentially expressed (NDE) at least in one paired comparison between the libraries (Supplementary Tables S17S20). Mean counts per million of reads (CPM) and coefficient of variation (CV)[44] were calculated for these NDE transcripts. Transcripts with a CV value lower than 0.113, corresponding with the percentile 5 of the CV, and a mean CPM higher than 1,138.06, corresponding with the percentile 95 of the mean CPM were used as filters to identify the most stably expressed transcripts (Supplementary Table S21). Based on its homology and its tentative biological function, five transcripts were selected to be tested as tentative reference genes. Besides, three NDE transcripts homologous to previously identified stable expressed reference genes in other species of cactus fruit[4143] were selected (Supplementary Table S22). Homology metrics for the eight tentative reference genes selected are shown in Supplementary Table S23. The primer sequences used to amplify the transcripts by qRT-PCR and their nucleotide sequence are shown in Supplementary Tables S24 & S25, respectively.

    The amplification specificity of the eight candidate reference genes determined by melting curves analysis is shown in Supplementary Fig. S3. For the eight tentative reference transcripts selected, the cycle threshold (Ct) values were recorded during sweet pitaya fruit development by qRT-PCR (Supplementary Table S26). The Ct values obtained ranged from 16.85 to 30.26 (Fig. 6a). Plastidic ATP/ADP-transporter (StTLC1) showed the highest Ct values with a mean of 27.34 (Supplementary Table S26). Polyubiquitin 3 (StUBQ3) showed the lowest Ct values in all five sweet pitaya fruit developmental stages (Fig. 6a).

    Figure 6.  Expression stability analysis of tentative reference genes. (a) Box plot of cycle threshold (Ct) distribution of candidate reference genes during sweet pitaya fruit development (10, 20, 30, 35, and 40 d after flowering). The black line inside the box indicates the median. The higher and lower box limits represent the 75th and 25th percentiles, respectively. (b) Bar chart of the geometric mean (geomean) of ranking values calculated by RefFinder for each tentative reference gene (X-axis). The lowest values indicate the best reference genes. (c) Bar chart of the pairwise variation analysis and determination of the optimal number of reference genes by the geNorm algorithm. A pairwise variation value lower than 0.15 indicates that the use of Vn/Vn + 1 reference genes is reliable for the accurate normalization of qRT-PCR data. The Ct data used in the analysis were calculated by qRT-PCR in a QIAquant 96 5 plex (QIAGEN) according to the manufacturer's protocol. The box plot and the bar graphs were drawn by ggplot2 and Excel programs, respectively. Abbreviations: Actin 7 (StACT7), alpha-tubulin (StTUA), elongation factor 1-alpha (StEF1a), COP1-interactive protein 1 (StCIP1), plasma membrane ATPase 4 (StPMA4), BEL1-like homeodomain protein 1 (StBLH1), polyubiquitin 3 (StUBQ3), and plastidic ATP/ADP-transporter (StTLC1).

    The best stability values calculated by NormFinder were 0.45, 0.51, 0.97, and 0.99, corresponding to the transcripts elongation factor 1-alpha (StEF1a), alpha-tubulin (StTUA), plastidic ATP/ADP-transporter (StTLC1), and actin 7 (StACT7), respectively (Supplementary Table S27). For BestKeeper, the most stable expressed transcripts were StUBQ3, StTUA, and StEF1a, with values of 0.72, 0.75, and 0.87, respectively. In the case of the delta Ct method[51], the transcripts StEF1a, StTUA, and StTLC1 showed the best stability.

    According to geNorm analysis, the most stable expressed transcripts were StTUA, StEF1a, StUBQ3, and StACT7, with values of 0.74, 0.74, 0.82, and 0.96, respectively. All the pairwise variation values (Vn/Vn + 1) were lower than 0.15, ranging from 0.019 for V2/V3 to 0.01 for V6/V7 (Fig. 6c). The V value of 0.019 obtained for V2/V3 indicates that the use of the best two reference genes StTUA and StEF1a is reliable enough for the accurate normalization of qRT-PCR data, therefore no third reference gene is required[47]. Except for BestKeeper analysis, StEF1a and StTUA were the most stable transcripts for all of the methods carried out in this study (Supplementary Table S27). The comprehensive ranking analysis indicates that StEF1a, followed by StTUA and StUBQ3, are the most stable expressed genes and are stable enough to be used as reference genes in qRT-PCR analysis during sweet pitaya fruit development (Fig. 6b).

    Three cuticle biosynthesis-related transcripts TRINITY_DN17030_c0_g1_i2, TRINITY_DN15394_c0_g1_i1, and TRINITY_DN23528_c1_g1_i1 tentatively coding for the enzymes cytochrome p450 family 77 subfamily A (CYP77A), Gly-Asp-Ser-Leu motif lipase/esterase 1 (GDSL1), and an ATP binding cassette transporter subfamily G member 11 (ABCG11/WBC11), respectively, were identified and quantified. The nucleotide sequence and predicted amino acid sequences of the three transcripts are shown in Supplementary File 1. The best homology match for StCYP77A (TRINITY_DN17030_c0_g1_i2) was for AtCYP77A4 (AT5G04660) from Arabidopsis and SmCYP77A2 (P37124) from eggplant (Solanum melongena) in the TAIR and Swiss-Prot databases, respectively (Supplementary Table S23).

    TransDecoder, InterPro, and TMHMM analysis showed that StCYP77A codes a polypeptide of 518 amino acids (aa) in length that comprises a cytochrome P450 E-class domain (IPR002401) and a transmembrane region (residues 10 to 32). The phylogenetic tree constructed showed that StCYP77A is grouped in a cluster with all the CYP77A2 proteins included in this analysis, being closer to CYP77A2 (XP_010694692) from B. vulgaris and Cgig2_012892 (KAJ8441854) from Carnegiea gigantean (Supplementary Fig. S4).

    StGDSL1 (TRINITY_DN15394_c0_g1_i1) alignment showed that it is homologous to a GDSL esterase/lipase from Arabidopsis (Q9LU14) and tomato (Solyc03g121180) (Supplementary Table S23). TransDecoder, InterPro, and SignalP analysis showed that StGDSL1 codes a polypeptide of 354 aa in length that comprises a GDSL lipase/esterase domain IPR001087 and a signal peptide with a cleavage site between position 25 and 26 (Supplementary Fig. S5).

    Supplementary Figure S6 shows the analysis carried out on the predicted amino acid sequence of StABCG11 (TRINITY_DN23528_c1_g1_i1). The phylogenetic tree constructed shows three clades corresponding to the ABCG13, ABCG12, and ABCG11 protein classes with bootstrap support ranging from 40% to 100% (Supplementary Fig. S6a). StABCG11 is grouped with all the ABCG11 transporters included in this study in a well-separated clade, being closely related to its tentative ortholog from C. gigantean Cgig2_004465 (KAJ8441854). InterPro and TMHMM results showed that the StABCG11 sequence contains an ABC-2 type transporter transmembrane domain (IPR013525; PF01061.27) with six transmembrane helices (Supplementary Fig. S6b).

    The predicted protein sequence of StABCG11 is 710 aa in length, holding the ATP binding domain (IPR003439; PF00005.30) and the P-loop containing nucleoside triphosphate hydrolase domain (IPR043926; PF19055.3) of the ABC transporters of the G family. Multiple sequence alignment shows that the Walker A and B motif sequence and the ABC signature[15] are conserved between the ABCG11 transporters from Arabidopsis, tomato, S. thurberi, and C. gigantean (Supplementary Fig. S6c).

    According to the results of the expression stability analysis (Fig. 6), four normalization strategies were tested to quantify the three cuticle biosynthesis-related transcripts during sweet pitaya fruit development. The four strategies consist of normalizing by StEF1a, StTUA, StUBQ3, or StEF1a+StTUA. Primer sequences used to quantify the transcripts StCYP77A (TRINITY_DN17030_c0_g1_i2), StGDSL1 (TRINITY_DN15394_c0_g1_i1), and StABCG11 (TRINITY_DN23528_c1_g1_i1) by qRT-PCR during sweet pitaya fruit development are shown in Supplementary Table S24.

    The three cuticle biosynthesis-related transcripts showed differences in expression during sweet pitaya fruit development (Supplementary Table S28). The same expression pattern was recorded for the three cuticle biosynthesis transcripts when normalization was carried out by StEF1a, StTUA, StUBQ3, or StEF1a + StTUA (Fig. 7). A higher expression of StCYP77A and StGDSL1 are shown at the 10 and 20 DAF, showing a decrease at 30, 35, and 40 DAF. StABCG11 showed a similar behavior, with a higher expression at 10 and 20 DAF and a reduction at 30 and 35 DAF. Nevertheless, unlike StCYP77A and StGDSL1, a significant increase at 40 DAF, reaching the same expression as compared with 10 DAF, is shown for StABCG11 (Fig. 7).

    Figure 7.  Expression analysis of cuticle biosynthesis-related transcripts StCYP77A, StGDSL1, and StABCG11 during sweet pitaya (Stenocereus thurberi) fruit development. Relative expression was calculated through the 2−ΔΔCᴛ method using elongation factor 1-alpha (StEF1a), alpha-tubulin (StTUA), polyubiquitin 3 (StUBQ3), or StEF1a + StTUA as normalizing genes at 10, 20, 30, 35, and 40 d after flowering (DAF). The Y-axis and error bars represent the mean of the relative expression ± standard error (n = 4−6) for each developmental stage in DAF. The Ct data for the analysis was recorded by qRT-PCR in a QIAquant 96 5 plex (QIAGEN) according to the manufacturer's protocol. The graph line was drawn by ggplot2 in R Studio. Abbreviations: cytochrome p450 family 77 subfamily A (StCYP77A), Gly-Asp-Ser-Leu motif lipase/esterase 1 (StGDSL1), and ATP binding cassette transporter subfamily G member 11 (StABCG11).

    Characteristics of a well-assembled transcriptome include an N50 value closer to 2,000 bp, a high percentage of conserved transcripts completely assembled (> 80%), and a high proportion of reads mapping back to the assembled transcripts[52]. In the present study, the first collection of 174,449 transcripts from S. thurberi fruit peel are reported. The generated transcriptome showed an N50 value of 2,110 bp, a TransRate score of 0.05, and a GC percentage of 41.33 (Table 1), similar to that reported for other de novo plant transcriptome assemblies[53]. According to BUSCO, 85.4% of the orthologous genes from the Embryophyta databases completely matched the S. thurberi transcriptome, and only 3.9% were missing (Table 1). These results show that the S. thurberi transcriptome generated is not fragmented, and it is helpful in predicting the sequence of almost all the transcripts expressed in sweet pitaya fruit peel[24].

    The percentage of transcripts homologous found, E values, and identity distribution (Supplementary Tables S1 & S2; Supplementary Fig. S2) were similar to that reported in the de novo transcriptome assembly for non-model plants and other cactus fruits[4143,54] and further suggests that the transcriptome assembled of S. thurberi peel is robust[52]. Of the total of transcripts, 70,802 were common to all the five commercial fruit protein databases included in this study, which is helpful for the search for conserved orthologous involved in fruit development and ripening (Fig. 2a). A total of 34,513 transcripts (20%) show homology only to sequences in the cactus's databases, but not in the others (Supplementary Tables S1 & S2; Fig. 1c). This could suggest that a significant conservation of sequences among plants of the Cactaceae family exists which most likely are to have a function in this species adaptation to desert ecosystems.

    To infer the biological functionality represented by the S. thurberi fruit peel transcriptome, gene ontology (GO) terms and KEGG pathways were assigned. Of the main metabolic pathways assigned, 'glycerolipid metabolism' and 'cutin, suberine, and wax biosynthesis' suggests an active cuticle biosynthesis in pitaya fruit peel (Fig. 4). In agreement with the above, the main GO terms assigned for the molecular function (MF) category were 'organic cyclic compound binding', 'transmembrane transporter activity', and 'lipid binding' (Fig. 3). For the biological processes (BP) category, the critical GO terms for the present research are 'cellular response to stimulus', 'response to stress', 'anatomical structure development', and 'transmembrane transport', which could suggest the active development of the fruit epidermis and cuticle biosynthesis for protection to stress.

    The most frequent transcription factors (TF) families found in S. thurberi transcriptome were NAC, WRKY, bHLH, ERF, and MYB-related (Fig. 2), which had been reported to play a function in the tolerance to abiotic stress in plants[55,56]. Although the role of NAC, WRKY, bHLH, ERF, and MYB TF in improving drought tolerance in relevant crop plants has been widely documented[57,58], their contribution to the adaptation of cactus to arid ecosystems has not yet been elucidated and further experimental pieces of evidence are needed.

    It has been reported that the heterologous expression of ERF TF from Medicago truncatula induces drought tolerance and cuticle wax biosynthesis in Arabidopsis leaf[59]. In tomato fruits, the gene SlMIXTA-like which encodes a MYB transcription factor avoids water loss through the positive regulation of genes related to the biosynthesis and transport of cuticle compounds[22]. Despite the relevant role of cuticles in maintaining cactus physiology in desert environments, experimental evidence showing the role of the different TF-inducing cuticle biosynthesis has yet to be reported for cactus fruits.

    Out of the transcripts, 43,391 were classified as lncRNA (Supplementary Tables S15 & S16). This is the first report of lncRNA identification for the species S. thurberi. In fruits, 3,679 lncRNA has been identified from tomato[26], 3,330 from peach (P. persica)[29], 3,857 from melon (Cucumis melo)[28], 2,505 from hot pepper (Capsicum annuum)[27], and 3,194 from pomegranate (Punica granatum)[36]. Despite the stringent criteria to classify the lncRNA of sweet pitaya fruit (S. thurberi), a higher number of lncRNAs are shown when compared with previous reports. This finding is most likely due to the higher level of redundancy found during the transcriptome analysis. To reduce this redundancy, further efforts to achieve the complete genome assembly of S. thurberi are needed.

    Previous studies showed that lncRNA is shorter and has lower expression levels than coding RNA[6062]. In agreement with those findings, both the length and expression values of lncRNA from S. thurberi were lower than coding RNA (Fig. 5). It has been suggested that lncRNA could be involved in the biosynthesis of cuticle components in cabbage[61] and pomegranate[36] and that they could be involved in the tolerance to water deficit through the regulation of cuticle biosynthesis in wild banana[60]. Nevertheless, the molecular mechanism by which lncRNA may regulate the cuticle biosynthesis in S. thurberi fruits has not yet been elucidated.

    A relatively constant level of expression characterizes housekeeping genes because they are involved in essential cellular functions. These genes are not induced under specific conditions such as biotic or abiotic stress. Because of this, they are very useful as internal reference genes for qRT-PCR data normalization[63]. Nevertheless, their expression could change depending on plant species, developmental stages, and experimental conditions[64]. Reliable reference genes for a specific experiment in a given species must be identified to carry out an accurate qRT-PCR data normalization[63]. An initial screening of the transcript expression pattern through RNA-seq improves the identification of stably expressed transcripts by qRT-PCR[44,64].

    Identification of stable expressed reference transcripts during fruit development has been carried out in blueberry (Vaccinium bracteatum)[65], kiwifruit (Actinidia chinensis)[66], peach (P. persica)[67], apple (Malus domestica)[68], and soursop (Annona muricata)[69]. These studies include the expression stability analysis through geNorm, NormFinder, and BestKeeper algorithms[68,69], some of which are supported in RNA-seq data[65,66]. Improvement of expression stability analysis by RNA-seq had led to the identification of non-previously reported reference genes with a more stable expression during fruit development than commonly known housekeeping genes in grapevine (V. vinifera)[44], pear (Pyrus pyrifolia and P. calleryana)[64], and pepper (C. annuum)[70].

    For fruits of the Cactaceae family, only a few studies identifying reliable reference genes have been reported[4143]. Mainly because gene expression analysis has not been carried out previously for sweet pitaya (S. thurberi), the RNA-seq data generated in this work along with geNorm, NormFinder, BestKeeper, and RefFinder algorithms were used to identify reliable reference genes. The comprehensive ranking analysis showed that out of the eight candidate genes tested, StEF1a followed by StTUA and StUBQ3 were the most stable (Fig. 6b). All the pairwise variation values (Vn/Vn + 1) were lower than 0.15 (Fig. 6c), which indicates that StEF1a, StTUA, and StUBQ3 alone or the use of StEF1a and StTUA together are reliable enough to normalize the gene expression data generated by qRT-PCR.

    The genes StEF1a, StTUA, and StUBQ3 are homologous to transcripts found in the cactus species known as dragonfruit (Hylocereus monacanthus and H. undatus)[41], which have been tested as tentative reference genes during fruit development. EF1a has been proposed as a reliable reference gene in the analysis of changes in gene expression of dragon fruit (H. monacanthus and H. undatus)[41], peach (P. persica)[67], apple (M. domestica)[68], and soursop (A. muricata)[69]. According to the expression stability analysis carried out in the present study (Fig. 6) four normalization strategies were designed. The same gene expression pattern was recorded for the three target transcripts evaluated when normalization was carried out by the genes StEF1a, StTUA, StUBQ3, or StEF1a + StTUA (Fig. 7). Further, these data indicates that these reference genes are reliable enough to be used in qRT-PCR experiments during fruit development of S. thurberi.

    The plant cuticle is formed by two main layers: the cutin, composed mainly of mid-chain oxygenated LC fatty acids, and the cuticular wax, composed mainly of very long-chain (VLC) fatty acids, and their derivates VLC alkanes, VLC primary alcohols, VLC ketones, VLC aldehydes, and VLC esters[3]. In Arabidopsis CYP77A4 and CYP77A6 catalyze the synthesis of midchain epoxy and hydroxy ω-OH long-chain fatty acids, respectively[10,11], which are the main components of fleshy fruit cuticle[3].

    The functional domain search carried out in the present study showed that StCYP77A comprises a cytochrome P450 E-class domain (IPR002401) and a membrane-spanning region from residues 10 to 32 (Supplementary Fig. S4). This membrane-spanning region has been previously characterized in CYP77A enzymes from A. thaliana and Brassica napus[11,71]. It suggests that the protein coded by StCYP77A could catalyze the oxidation of fatty acids embedded in the endoplasmic reticulum membrane of the epidermal cells of S. thurberi fruit. Phylogenetic analysis showed that StCYP77A was closer to proteins from its phylogenetic-related species B. vulgaris (BvCYP772; XP_010694692) and C. gigantea (Cgig2_012892) (Supplementary Fig. S4). StCYP77A, BvCYP77A2, and Cgig2_012892 were closer to SlCYP77A2 and SmCYP77A2 than to CYP77A4 and CYP77A6 proteins, suggesting that StCYP77A (TRINITY_DN17030_c0_g1_i2) could correspond to a CYP77A2 protein.

    Five CYP77A are present in the Arabidopsis genome, named CYP77A4, CYP77A5, CYP77A6, CYP77A7, and CYP77A9, but their role in cuticle biosynthesis has only been reported for CYP77A4 and CYP77A6[72]. It has been suggested that CYP77A2 from eggplant (S. torvum) could contribute to the defense against fungal phytopathogen infection by the synthesis of specific compounds[13]. In pepper fruit (C. annuum), the expression pattern of CYP77A2 (A0A1U8GYB0) and ABCG11 (LOC107862760) suggests a role of CYP77A2 and ABCG11 in cutin biosynthesis at the early stages of pepper fruit development[14].

    In the case of the protein encoded by StGDSL1 (354 aa), the length found in this work is similar to the length of its homologous from Arabidopsis (AT3G16370) and tomato (Solyc03g121180) (Supplementary Fig. S5). A GDSL1 protein named CD1 polymerizes midchain oxygenated ω-OH long-chain fatty acids to form the cutin polyester in the extracellular space of tomato fruit peel[20,21]. It has been suggested that the 25-amino acid N-signal peptide found in StGDSL1 (Supplementary Fig. S5), previously reported in GDSL1 from Arabidopsis, B. napus, and tomato, plays a role during the protein exportation to the extracellular space[21,73].

    A higher expression of StCYP77A, StGDSL1, and StABCG11 is shown at the 10 and 20 DAF of sweet pitaya fruit development (Fig. 7), suggesting the active cuticle biosynthesis at the early stages of sweet pitaya fruit development. In agreement with that, two genes coding for GDSL lipase/hydrolases from tomato named SGN-U583101 and SGN-U579520 are highly expressed in the early stages and during the expansion stages of tomato fruit development, but their expression decreases in later stages[74]. It has been shown that the expression of GDSL genes, like CD1 from tomato, is higher in growing fruit[20,21]. Like tomato, the increase in expression of StCYP77A and StGDSL1 shown in pitaya fruit development could be due to an increase in cuticle deposition during the expansion of the fruit epidermis[20].

    The phylogenetic analysis, the functional domains, and the six transmembrane helices found in the StABCG11 predicted protein (Supplementary Fig. S6), suggests that it is an ABCG plasma membrane transporter of sweet pitaya[15]. Indeed, an increased expression of StABCG11 at 40 DAF was recorded in the present study (Fig. 7). Further, this data strongly suggests that it could be playing a relevant role in the transport of cuticle components at the beginning and during sweet pitaya fruit ripening.

    In Arabidopsis, ABCG11 (WBC11) exports cuticular wax and cutin compounds from the plasma membrane[15,75]. It has been reported that a high expression of the ABC plasma membrane transporter from mango MiWBC11 correlates with a higher cuticle deposition during fruit development[7]. The expression pattern for StABCG11, StCYP77A, and StGDSL1 suggests a role of StABCG11 as a cutin compound transporter in the earlier stages of sweet pitaya fruit development (Fig. 7). Further, its increase at 40 DAF suggests that it could be transporting cuticle compounds other than oxygenated long-chain fatty acids, or long-chain fatty acids that are not synthesized by StCYP77A and StGDSL1 in the later stages of fruit development.

    Like sweet pitaya, during sweet cherry fruit (Prunus avium) development, the expression of PaWCB11, homologous to AtABCG11 (AT1G17840), increases at the earlier stages of fruit development decreases at the intermediate stages, and increases again at the later stages[76]. PaWCB11 expression correlated with cuticle membrane deposition at the earlier and intermediate stages of sweet cherry fruit development but not at the later[76]. The increased expression of StABCG11 found in the present study could be due to the increased transport of cuticular wax compounds, such as VLC fatty acids and their derivates, in the later stages of sweet pitaya development[15,75].

    Cuticular waxes make up the smallest amount of the fruit cuticle. Even so, they mainly contribute to the impermeability of the fruit's epidermis[3]. An increase in the transport of cuticular waxes at the beginning of the ripening stage carried out by ABCG transporters could be due to a greater need to avoid water loss and to maintain an adequate amount of water during the ripening of the sweet pitaya fruit. Nevertheless, further expression analysis of cuticular wax biosynthesis-related genes, complemented with chemical composition analysis of cuticles could contribute to elucidating the molecular mechanism of cuticle biosynthesis in cacti and their physiological contribution during fruit development.

    In this study, the transcriptome of the sweet pitaya (S. thurberi) fruit peel was assembled for the first time. The reference genes found here are a helpful tool for further gene expression analysis in sweet pitaya fruit. Transcripts tentatively involved in cuticle compound biosynthesis and transport are reported for the first time in sweet pitaya. The results suggest a relevant role of cuticle compound biosynthesis and transport at the early and later stages of fruit development. The information generated will help to improve the elucidation of the molecular mechanism of cuticle biosynthesis in S. thurberi and other cactus species in the future. Understanding the cuticle's physiological function in the adaptation of the Cactaceae family to harsh environmental conditions could help design strategies to increase the resistance of other species to face the increase in water scarcity for agricultural production predicted for the following years.

    The authors confirm contribution to the paper as follows: study conception and design: Tiznado-Hernández ME, Tafolla-Arellano JC, García-Coronado H, Hernández-Oñate MÁ; data collection: Tiznado-Hernández ME, Tafolla-Arellano JC, García-Coronado H, Hernández-Oñate MÁ; analysis and interpretation of results: Tiznado-Hernández ME, García-Coronado H, Hernández-Oñate MÁ, Burgara-Estrella AJ; draft manuscript preparation: Tiznado-Hernández ME, García-Coronado H. All authors reviewed the results and approved the final version of the manuscript.

    All data generated or analyzed during this study are included in this published article and its supplementary information files. The sequence data can be accessed at the Sequence Read Archive (SRA) repository of the NCBI through the BioProject ID PRJNA1030439.

    The authors wish to acknowledge the financial support of Consejo Nacional de Humanidades, Ciencias y Tecnologías de México (CONAHCYT) through project number 579: Elucidación del Mecanismo Molecular de Biosíntesis de Cutícula Utilizando como Modelo Frutas Tropicales. We appreciate the University of Arizona Genetics Core and Illumina for providing reagents and equipment for library sequencing. The author, Heriberto García-Coronado (CVU 490952), thanks the CONAHCYT (acronym in Spanish) for the Ph.D. scholarship assigned (749341). The author, Heriberto García-Coronado, thanks Dr. Edmundo Domínguez-Rosas for the technical support in bioinformatics for identifying long non-coding RNA.

  • The authors declare that they have no conflict of interest.

  • [1]

    Matei Ș, Cutler SJ, Preda M, Dorobanțu M, Ilinca C, et al. 2018. The relationship between psychosocial status and hypertensive condition. Current Hypertension Reports 20(12):102

    doi: 10.1007/s11906-018-0902-y

    CrossRef   Google Scholar

    [2]

    Kondo T, Toyoshima H, Tsuzuki Y, Hori Y, Yatsuya H, et al. 2005. Familial aggregation and coaggregation of history of hypertension and stroke. Journal of Human Hypertension 19(2):119−25

    doi: 10.1038/sj.jhh.1001788

    CrossRef   Google Scholar

    [3]

    Rigaud AS, Forette B. 2001. Hypertension in older adults. The Journals of Gerontology Series A: Biological Sciences and Medical Sciences 56(4):M217−M225

    doi: 10.1093/gerona/56.4.M217

    CrossRef   Google Scholar

    [4]

    Chockalingam A, Campbell NR, George Fodor J. 2006. Worldwide epidemic of hypertension. Canadian Journal of Cardiology 22(7):553−55

    doi: 10.1016/S0828-282X(06)70275-6

    CrossRef   Google Scholar

    [5]

    Guilbert JJ. 2003. The World Health Report 2002 - reducing risks, promoting healthy life. Education for Health 16(2):230

    Google Scholar

    [6]

    Haldar RN. 2013. Global brief on hypertension: silent killer, global public health crisis. Indian Journal of Physical Medicine and Rehabilitation 24:2

    doi: 10.5005/ijopmr-24-1-2

    CrossRef   Google Scholar

    [7]

    Suematsu M, Suzuki H, Delano FA, Schmid-Schönbein GW, et al. 2002. The inflammatory aspect of the microcirculation in hypertension: oxidative stress, leukocytes/endothelial interaction, apoptosis. Microcirculation 9(4):259−76

    doi: 10.1038/sj.mn.7800141

    CrossRef   Google Scholar

    [8]

    Shere A, Eletta O, Goyal H. 2017. Circulating blood biomarkers in essential hypertension: a literature review. Journal of Laboratory and Precision Medicine 2(12):99

    doi: 10.21037/jlpm.2017.12.06

    CrossRef   Google Scholar

    [9]

    Tousoulis D, Papageorgiou N, Androulakis E, Paroutoglou K, Stefanadis C. 2010. Novel therapeutic strategies targeting vascular endothelium in essential hypertension. Expert Opinion on Investigational Drugs 19(11):1395−412

    doi: 10.1517/13543784.2010.522989

    CrossRef   Google Scholar

    [10]

    Nitenberg A. 2006. Hypertension, endothelial dysfunction and cardiovascular risk. Archives Des Maladies Du Coeur et Des Vaisseaux 99(10):915−21

    Google Scholar

    [11]

    Harvey A, Montezano AC, Touyz RM. 2015. Vascular biology of ageing-Implications in hypertension. Journal of Molecular and Cellular Cardiology 83:112−21

    doi: 10.1016/j.yjmcc.2015.04.011

    CrossRef   Google Scholar

    [12]

    Spescha RD, Glanzmann M, Simic B, Witassek F, Keller S, et al. 2014. Adaptor protein p66Shc mediates hypertension-associated, cyclic stretch-dependent, endothelial damage. Hypertension 64(2):347−53

    doi: 10.1161/HYPERTENSIONAHA.113.02129

    CrossRef   Google Scholar

    [13]

    Touyz RM, Briones AM. 2011. Reactive oxygen species and vascular biology: implications in human hypertension. Hypertension Research 34(1):5−14

    doi: 10.1038/hr.2010.201

    CrossRef   Google Scholar

    [14]

    Sinha N, Dabla PK. 2015. Oxidative stress and antioxidants in hypertension-a current review. Current Hypertension Reviews 11(2):132−42

    doi: 10.2174/1573402111666150529130922

    CrossRef   Google Scholar

    [15]

    Jasiewicz M, Knapp M, Waszkiewicz E, Ptaszynska-Kopczynska K, Szpakowicz A, et al. 2015. Enhanced IL-6 trans-signaling in pulmonary arterial hypertension and its potential role in disease-related systemic damage. Cytokine 76(2):187−92

    doi: 10.1016/j.cyto.2015.06.018

    CrossRef   Google Scholar

    [16]

    Montezano AC, Dulak-Lis M, Tsiropoulou S, Harvey A, Briones AM, et al. 2015. Oxidative stress and human hypertension: vascular mechanisms, biomarkers, and novel therapies. Canadian Journal of Cardiology 31(5):631−41

    doi: 10.1016/j.cjca.2015.02.008

    CrossRef   Google Scholar

    [17]

    Hirsch AT. 2003. Vascular disease, hypertension, and prevention: "from endothelium to clinical events". Journal of the American College of Cardiology 42(2):377−79

    doi: 10.1016/S0735-1097(03)00747-2

    CrossRef   Google Scholar

    [18]

    Nathan C. 2002. Points of control in inflammation. Nature 420:846−52

    doi: 10.1038/nature01320

    CrossRef   Google Scholar

    [19]

    Kacimi R, Karliner JS, Koudssi F, Long CS. 1998. Expression and regulation of adhesion molecules in cardiac cells by cytokines: response to acute hypoxia. Circulation Research 82(5):576−86

    doi: 10.1161/01.res.82.5.576

    CrossRef   Google Scholar

    [20]

    Qi G, Jia L, Li Y, Bian Y, Cheng J, et al. 2011. Angiotensin II infusion-induced inflammation, monocytic fibroblast precursor infiltration, and cardiac fibrosis are pressure dependent. Cardiovascular Toxicology 11(2):157−67

    doi: 10.1007/s12012-011-9109-z

    CrossRef   Google Scholar

    [21]

    Pereda J, Sabater L, Cassinello N, Gómez-Cambronero L, Closa D, et al. 2004. Effect of simultaneous inhibition of TNF-α production and xanthine oxidase in experimental acute pancreatitis: the role of mitogen activated protein kinases. Annals of Surgery 240(1):108−16

    doi: 10.1097/01.sla.0000129343.47774.89

    CrossRef   Google Scholar

    [22]

    Södergren A, Karp K, Boman K, Eriksson C, Lundström E, et al. 2010. Atherosclerosis in early rheumatoid arthritis: very early endothelial activation and rapid progression of intima media thickness. Arthritis Research & Therapy 12:R158

    doi: 10.1186/ar3116

    CrossRef   Google Scholar

    [23]

    Lu RL, Hu FL, Xia T. 2010. Activity-guided isolation and identification of radical scavenging components in Gao-Cha tea. Journal of Food Science 75(8):H239−H243

    doi: 10.1111/j.1750-3841.2010.01804.x

    CrossRef   Google Scholar

    [24]

    Bock K, Faurschou laCour N, Jensen SR, Nielsen BJ. 2010. The structure of acertannin. Phytochemistry 19(9):2033

    doi: 10.1016/0031-9422(80)83034-2

    CrossRef   Google Scholar

    [25]

    Hatano T, Hattori S, Ikeda Y, Shingu T, Okuda T. 1990. Gallotannins having a 1,5-anhydro-D-glucitol core and some ellagitannins from Acer species. Chemical & Pharmaceutical Bulletin 38(7):19025

    doi: 10.1248/CPB.38.1902

    CrossRef   Google Scholar

    [26]

    Bate-Smith EC. 1978. Systematic aspects of the astringent tannins of Acer species. Chemical & Pharmaceutical Bulletin 17(11):1945−48

    doi: 10.1016/S0031-9422(00)88739-7

    CrossRef   Google Scholar

    [27]

    Choi YH, Han SS, Lee HO, Baek SH. 2005. Biological Activity of Bioactive Components from Acer ginnala Max. Bulletin of the Korean Chemical Society 26(9):1450−52

    doi: 10.5012/bkcs.2005.26.9.1450

    CrossRef   Google Scholar

    [28]

    González-Sarrías A, Li L, Seeram NP. 2012. Effects of maple ( Acer) plant part extracts on proliferation, apoptosis and cell cycle arrest of human tumorigenic and non-tumorigenic colon cells. Phytotherapy Research 26(7):995−1002

    doi: 10.1002/ptr.3677

    CrossRef   Google Scholar

    [29]

    Ogawa A, Miyamae Y, Honma A, Koyama T, Yazawa K, et al. 2011. Pycnalin, a new α-glucosidase inhibitor from Acer pycnanthum. Chemical & Pharmaceutical Bulletin 59(5):672−75

    doi: 10.1248/cpb.59.672

    CrossRef   Google Scholar

    [30]

    Honma A, Koyama T, Yazawa K. 2011. Anti-hyperglycaemic effects of the Japanese red maple Acer pycnanthum and its constituents the ginnalins B and C. Journal of Enzyme Inhibition and Medicinal Chemistry 26(2):176−80

    doi: 10.3109/14756366.2010.486795

    CrossRef   Google Scholar

    [31]

    Song CQ, Zhang N, Xu RS, Song GQ, Sheng Y, et al. 1982. Studies on the antibacterial constituents of the leaves of Acer ginnala Maxim. II. isolation and identification of Ginnalin B, Ginnalin C and other six compounds. Acta Chimica Sinica 40(12):1142−47

    Google Scholar

    [32]

    Wang HY, Huang JZ. 2004. Gaocha: a new type of health drink. Journal of Tea Business 26(2):80−81

    Google Scholar

    [33]

    Kiss JP, Vizi ES. 2001. Nitric oxide: a novel link between synaptic and nonsynaptic transmission. Trends in Neurosciences 24(4):211−15

    doi: 10.1016/S0166-2236(00)01745-8

    CrossRef   Google Scholar

    [34]

    Moncada S, Higgs A. 1993. The L-arginine-nitric oxide pathway. The New England Journal of Medicine 329(27):2002−12

    doi: 10.1056/NEJM199312303292706

    CrossRef   Google Scholar

    [35]

    Bredt DS, Snyder SH. 1994. Nitric oxide: a physiologic messenger molecule. Annual Review of Biochemistry 63:175−95.

    doi: 10.1146/annurev.bi.63.070194.001135

    CrossRef   Google Scholar

    [36]

    Schulz JB, Matthews RT, Muqit MM, Browne SE, Beal MF, et al. 1995. Inhibition of neuronal nitric oxide synthase by 7-nitroindazole protects against MPTP-induced neurotoxicity in mice. Journal of Neurochemistry 64(2):936−39

    doi: 10.1046/j.1471-4159.1995.64020936.x

    CrossRef   Google Scholar

    [37]

    Mitchell GF. 2009. Arterial stiffness and wave reflection: Biomarkers of cardiovascular risk. Artery Research 3(2):56−64

    doi: 10.1016/j.artres.2009.02.002

    CrossRef   Google Scholar

    [38]

    Ahmed HMMS, Youssef M, Mosaad YM. 2010. Antibodies against oxidized low-density lipoprotein are associated with subclinical atherosclerosis in recent-onset rheumatoid arthritis. Clinical Rheumatology 29(11):1237−43

    doi: 10.1007/s10067-010-1436-0

    CrossRef   Google Scholar

    [39]

    Han SS, Lo SC, Choi YW, Baek SH. 2004. Antioxidant Activity of Crude Extract and Pure Compounds of Acer ginnala Max. Journal of Molecular & Cellular Cardiology 25(3):389−91

    doi: 10.5012/bkcs.2004.25.3.389

    CrossRef   Google Scholar

    [40]

    Chung JS, Lee MS, Chung JY. 2001. Antioxidative activity of the extracts from the leaves and fruits of Acer ginnala. Natural Product Sciences 7:45−48

    Google Scholar

    [41]

    Conway DE, Coon BG, Budatha M, Arsenovic PT, Orsenigo F, et al. 2017. VE-Cadherin Phosphorylation Regulates Endothelial Fluid Shear Stress Responses through the Polarity Protein LGN. Current Biology 27(14):2219−2225.E5

    doi: 10.1016/j.cub.2017.06.020

    CrossRef   Google Scholar

    [42]

    Clarke NE, Turner AJ. 2012. Angiotensin-converting enzyme 2: the first decade. International Journal of Hypertension 2012:307315

    doi: 10.1155/2012/307315

    CrossRef   Google Scholar

    [43]

    Ferrario CM, Jessup J, Chappell MC, Averill DB, Brosnihan KB, et al. 2005. Effect of angiotensin-converting enzyme inhibition and angiotensin II receptor blockers on cardiac angiotensin-converting enzyme 2. Circulation 111(20):2605−10

    doi: 10.1161/CIRCULATIONAHA.104.510461

    CrossRef   Google Scholar

    [44]

    Aldiwani H, Mahdai S, Alhatemi G, Bairey Merz CN, et al. 2021. Microvascular Angina: Diagnosis and Management. European Cardiology 16:e46

    doi: 10.15420/ecr.2021.15

    CrossRef   Google Scholar

    [45]

    Wu C, Decker ER, Blok N, Bui H, You TJ, et al. 2004. Discovery, modeling, and human pharmacokinetics of N-(2-acetyl-4,6-dimethylphenyl)-3-(3,4-dimethylisoxazol-5-ylsulfamoyl)thiophene-2-carboxamide (TBC3711), a second generation, ETA selective, and orally bioavailable endothelin antagonist. Journal of Medicinal Chemistry 47(8):1969−86

    doi: 10.1021/jm030528p

    CrossRef   Google Scholar

    [46]

    Loke WM, Hodgson JM, Proudfoot JM, McKinley AJ, Puddey IB, et al. 2008. Pure dietary flavonoids quercetin and (−)-epicatechin augment nitric oxide products and reduce endothelin-1 acutely in healthy men. The American Journal of Clinical Nutrition 88(4):1018−25

    doi: 10.1093/ajcn/88.4.1018

    CrossRef   Google Scholar

    [47]

    Gerritsen ME. 1987. Functional heterogeneity of vascular endothelial cells. Biochemical Pharmacology 36(17):2701−11

    doi: 10.1016/0006-2952(87)90252-8

    CrossRef   Google Scholar

    [48]

    Jelinic M, Jackson KL, O'Sullivan K, Singh J, Giddy T, et al. 2023. Endothelium-dependent relaxation is impaired in Schlager hypertensive (BPH/2J) mice by region-specific mechanisms in conductance and resistance arteries. Life Sciences 320:121542

    doi: 10.1016/j.lfs.2023.121542

    CrossRef   Google Scholar

    [49]

    Ulpiano Trillig A, Damianaki A, Hendriks-Balk M, Brito W, Garessus J, et al. 2023. Determinants of Renal Micro-Perfusion as Assessed with Contrast-Enhanced Ultrasound in Healthy Males and Females. Journal of Clinical Medicine 12(12):4141

    doi: 10.3390/jcm12124141

    CrossRef   Google Scholar

  • Cite this article

    Wang W, Ma J, Ma Y, Bao Y, Long Z, et al. 2024. Chemical constitutes and anti-hypertension potential of Gaocha (Acer ginnala Maxim) in spontaneously hypertensive rat. Beverage Plant Research 4: e011 doi: 10.48130/bpr-0024-0004
    Wang W, Ma J, Ma Y, Bao Y, Long Z, et al. 2024. Chemical constitutes and anti-hypertension potential of Gaocha (Acer ginnala Maxim) in spontaneously hypertensive rat. Beverage Plant Research 4: e011 doi: 10.48130/bpr-0024-0004

Figures(5)  /  Tables(2)

Article Metrics

Article views(2948) PDF downloads(426)

ARTICLE   Open Access    

Chemical constitutes and anti-hypertension potential of Gaocha (Acer ginnala Maxim) in spontaneously hypertensive rat

Beverage Plant Research  4 Article number: e011  (2024)  |  Cite this article

Abstract: Gaocha is a kind of succedaneous tea beverage made by the tender shoots of Acer ginnala Maxim, widely distributed in China and Korea, which is used as a functional tea beverage with a long history dating back to 2000 BC. It has been used as folk medicine to depress blood pressure, however, little study has been reported on its antihypertensive mechanism. Thus, the present paper aimed at elucidating the bioactive constitutes in Gaocha extract and its effect of anti-hypertension on spontaneously hypertensive (SHR) rats. In this study, the phenolic compounds composition analysis showed that the total polyphenol content can reach 75.4 mg/g in dried Gaocha extract, and the content of epicatechin was 32.68 mg/g, indicating Gaocha may have many bioactivities. Therefore, in order to evaluate the anti-hypertension potential value of Gaocha extract, its effect on spontaneously hypertensive (SHR) rats was examined. Male SHR rats were randomly divided into the model (saline), positive control (captopril), low-dose Gaocha, medium-dose Gaocha and high-dose Gaocha groups. Every group was administered for 16 d. The results of tail artery systolic blood pressure (SBP) showed the Gaocha-treated groups had significantly lower SBP than the model group. Post-treatment abdominal aorta blood samples showed that the serum PGI2, Angiotensin II, ET, and NO levels in Gaocha-treated groups were significantly higher than these in the model group. After treating with Gaocha extract, the serum IL-6 and TNF-αlevels were significantly lower than these in the model group. The histomorphological examination of the heart and kidney also showed that Gaocha extract had a protective effect. Gaocha extract contained high levels of polyphenols with epicatechin as the predominant individual phenolic compound and has a significant improvement of anti-hypertension on spontaneously hypertensive (SHR) rats. The findings indicate that supplementation with Gaocha may contribute to preventing hypertension.

    • Hypertension refers to a long-term elevated blood pressure that mainly results from either nonspecific lifestyle change, genetic factors, or an identifiable cause[1,2]. Hypertension is a common chronic medical problem worldwide and has been confirmed as a leading factor in the cause of cardiovascular mortality[35]. Globally, 17 million people die annually due to cardiovascular disease, which is nearly a third of all deaths. Annually, hypertension has been linked to an estimated 9.4 million fatalities worldwide. It is believed to have caused at least 45% of coronary heart disease deaths and the majority of stroke deaths (51%)[6]. Hypertension has also been reported as a major risk factor for many other chronic diseases, such as vision loss, chronic kidney disease, atrial fibrillation, and dementia[7]. During the initial phase of hypertension, certain biomarkers in the bloodstream can be beneficial in understanding the mechanism of hypertension and may be used as potential treatments, including Angiotensin A, Vasoconstruction Inhibiting Factor (VIF), EndoThelin 1,2, Leptin, IL-1, IL-6, Nitric Oxide (NO), CRP, Renin, BNP, Uric Acid, and VCAM-1[8]. It is well known that hypertension plays an essential role in vascular endothelial dysfunction. Moreover, prolonged high blood pressure can increase the shear stress on blood vessels, leading to structural and functional damage to the vascular endothelium[9,10]. Vascular endothelial cells take charge in secreting vasoconstrictive factors, including NO, Prostaglandin-I-2 (PGI2), endothelin (ET) and Angiotensin II (Ang II)[1113]. These vasoconstrictive factors regulate the vasoconstriction of vascular endothelium and they exist in an equilibrium state under a normal physiological condition[1416]. For example, NO, ET and Ang II have been confirmed to possess vasoconstrictive functions, whereas PGl2 is a key factor that could regulate vascular tone[17]. It has been reported that hypertension could alter the synthesis of these vasoconstrictive factors, which could result in the collapse of their equilibrium in vascular endothelium[16]. Additionally, hypertension could take place with systemic inflammation, and thus some inflammatory mediators could be used to indicate the vascular damage caused by high blood pressure[18]. For example, interleukin 6 (IL-6) and tumor necrosis factor-α (TNF-α) are two inflammatory mediators that can be secreted into vascular endothelium by vasoactive substances (adrenaline and Ang II). IL-6 could activate platelet activating factors to enhance platelet aggregation and produce blood clots, whereas TNF-α could damage the integrity of vascular endothelial cells and trigger the inflammation to the vascular wall[1922].

      Medicinal plants have gained more attention in the field of medical science due to their potential health beneficial features. Gaocha is one of the most traditional tea beverages in China and other Asian countries. Gaocha is made of the tender shoots of A.ginnala Maxim, and it has been reported to contain various health promoting nutrients, such as alkaloids, tannins, flavonoids, and organic acids[2326]. Previous studies have reported that Gaocha possesses antioxidant activity and the consumption of Gaocha could inhibit tumor activity[27,28], hypoglycemic effect[29,30] and bacteriostatic action[31]. Gaocha has been used as a folk medicine to alleviate blood pressure. However, to the best of our knowledge, its antihypertensive mechanism has not been well studied. To this end, we treated spontaneously hypertensive rats (SHRs) with Gaocha extract at different doses and assessed the alteration of their blood pressure. Meanwhile, the vascular endothelial function factors (NO, ET, PGl2 and Ang II) and inflammatory mediators (IL-6 and TNF-α) of these SHRs under different Gaocha dose treatments were analyzed and compared. The findings from this study could provide useful insight on elucidating the mechanism of Gaocha on the hypertension alleviation.

    • Catechin, epicatechin, gallocatechin, epigallocatechin, galloyl acid and β-glucogallin were purchased from Sigma-Aldrich (St. Louis, MO, USA) with a purity of 99%. Methanol, acetonitrile, and acetic acid were of HPLC grade and purchased from Tedia Co., Ltd. (Fairfield, OH, USA). Captopril tablets are a product of Changzhou Pharmaceutical Co., Ltd (Jiangsu, China). Normal saline and chloral hydrate were purchased from Kaiyuan Pharmaceutical Co., Ltd (Tianjin, China) and Shanghai Qiangshun Chemical Reagent Co., Ltd (Shanghai, China), respectively. Rat IL-6, ET-1, PGl2, Ang II, NO and TNF-α were all purchased from Sigma-Aldrich (St. Louis, MO, USA).

    • The raw materials used for the Gaocha samples are sourced from Shucheng County, Lu'an City, Anhui Province (China) in 2017, and are processed by Anhui Lvyuan Tea Company. The production process of Gaocha involves picking, light withering, fixation, and baking to yield the final product[32]. The Gaocha sample was extracted using hot water at 100 oC with a 1:10 w/w ratio for 30 min under sonication. Afterwards, the resultant mixture was centrifuged at 12,000 rpm for 10 min to collect Gaocha extract. The Gaocha extract was then freeze-dried to yield the dryness. The dried extract was diluted using distilled water to a concentration of 1 g/mL. The resultant extract was filtered through a 0.22 μm membrane and then directly injected to liquid chromatography.

    • An Agilent 1260 series UPLC (Palo Alto, Santa Clara, USA) was used to analyze the phenolic compounds composition in the Gaocha extract. The injection volume was set at 5 μL. An Agilent Eclipse PlusC18 column (Palo Alto, Santa Clara, CA, USA) was used to separate phenolic compounds under a flow rate of 1.0 mL/min. The mobile phase consisted of (A) water and (B) acetonitrile. A gradient elution program was as follows: 0−7 min, 10%B to 30%B; 7−10 min, 30%B isocratic; 10−11 min, 30%B to 13%B; 11−16 min, 13%B isocratic; 16−17 min, 13%B to 10%B; and 17−20 min, 10%B isocratic. The column was maintained at 40 °C during the elution program. The detection wavelength on the diode array detection was set at 280 nm. The detected individual phenolic compounds were quantified using their corresponding standard.

    • A total of 40 pathogen-free male spontaneously hypertensive rats (SHRs) were provided from Beijing Vital River Laboratory Animal Technology Co., Ltd with its laboratory animal production license of SCXK(Jing) 2012-0001 (Beijing, China). These SHRs were 12-weeks-old with a body weight of 250 ± 20 g. Meanwhile, 8-12-week-old pathogen-free normal male rats were also purchased from Beijing Vital River Laboratory Animal Technology Co. Ltd with the same body weight as the SHRs. Both SHRs and normal rats were acclimated on a AIN93 G diet at 24−26 °C in a 12 h light/dark cycle for 7 d before administration. The SHRs were randomly divided into five groups and eight rats in each group was placed into two cages with four rats per cage. The normal rats were also put into two cages with four rats per cage. The SHRs in the first group (disease control group) were fed with an equal volume of distilled water as the treated SHRs. The second SHRs group was fed with captopril (6.25 mg/kg of rat weight). The rats in the third, fourth, and fifth SHRs group were gavaged with the Gaocha extract with a dose of 12.0 mg/kg (high dose), 6.0 mg/kg (mid dose) and 3.0 mg/kg (low dose) per rat weight, respectively. The Gaocha dried extract was dissolved using distilled water to a concentration of 1.2, 0.6, and 0.3 mg/mL for oral gavage. The normal rats (healthy control group) were fed with an equal volume of distilled water as the treated SHRs. The drug/extract administration took place at 9:00 am once per day for 16 d. During the experiment these rats had access to the same diet and water, and hair color, growth and general behavior of the rats were monitored. All rats were penned individually and randomly assigned to the pens.

    • Tail artery blood pressure of all the rats were measured using the tail-cuff method at 0, 3, 7, 10, and 15 d under ALC-NIBP system (Shanghai Alcott Biotech. Co. Ltd., Shanghai, China). Each pressure measurement was conducted three times at 60 min intervals.

    • After the last oral gavage, all the rats were fasted for 12 h without any food or water. The rats were then intravenously administered with 0.01 ml/g 10% chloral hydrate to induce anesthesia and then 5 mL of blood was collected and sampled from their aorta abdominals. Subsequently, the blood sample was transferred to EDTA tubes and then to vacuum blood collection tubes. The blood samples were centrifuged at 3,000 r/min for 30 min to separate plasma and serum. The targets (Ang II, NO, ET, PGl2, IL-6 and TNF-α) were analyzed using ELISA on an RT-6000 ELISA analyzer (Rayto Life and Analytical Sciences Co. Ltd, Shenzhen, China) according to the manufacturer’s instructions.

    • After the blood was sampled, the corresponding organs were resected and soaked in 4% formaldehyde for 24 h. Afterwards, the organs (heart and kidneys) of the rats were placed in a Petri dish. The collected organ samples were washed with normal saline, dried using filter papers, and then fixed by 10% methanol. The fixed organs were dehydrated using a gradient series of ethanol and then passed through xylene solution to remove the ethanol and facilitate molten paraffin wax infiltration at 55 °C. Subsequently, the organs were embedded into a wax block and then cut into 4 mm thickness paraffin section. The paraffin sections were then stained with hematoxylin and eosin and visualized using a high-power microscope (OlympusBX51, Olympus Medical System Corp., Tokyo, Japan).

    • Data were expressed as the mean ± standard error. One-way analyses of variance (ANOVA) were used to compare the means using Duncan's range test on SPSS17.0 (Chicago, IL, USA). Homogeneity analysis was carried out using the least significant different test. A p ≤ 0.05 difference was considered significant.

    • Upon analysis of the functional component composition of Gaocha extract, it was found that the dried extract was affluent in phenolic compounds, with a total polyphenol content of 75.4 mg/g. Moreover, ultra-performance liquid chromatography revealed the presence of β-glucogallin, galloyl acid, gallocatechin, epigallocatechin, catechin, and epicatechin in the extract (Table 1). The predominant phenolic compound in the dried extract of Gaocha was revealed to be epicatechin, with a content of 32.68 mg/g, followed by epigallocatechin (5.69 mg/g) and gallocatechin (3.11 mg/g). Additionally, catechin was present in the extract at 1.95 mg/g. These findings demonstrate that Gaocha is rich in multiple polyphenols, potentially contributing to its beneficial effects.

      Table 1.  Concentration of phenolic compounds in dried Gaocha extract.

      Phenolic compound Content (mg/g) Percentage (%)
      β-Glucogallin 0.50 ± 0.00 0.67 ± 0.00
      Galloyl acid 0.74 ± 0.01 0.99 ± 0.02
      Gallocatechin 3.11 ± 0.07 4.13 ± 0.14
      Epigallocatechin 5.69 ± 0.08 7.55 ± 0.15
      Catechin 1.95 ± 0.06 2.59 ± 0.05
      Epicatechin 32.68 ± 0.76 43.35 ± 1.09
      Polyphenol 75.40 ± 0.71
      Polyphenol content was analysed using Folin-Cioalteu and expressed as mg galloyl acid/g dried Gaocha extract. Individual phenolic compounds were quantified using their corresponding standard and expressed as mg/g dried Gaocha extract. Data are the mean ± standard deviation of triplicate tests.
    • To gain insight into the general behavioral effects of Gaocha extract on SHRs, we conducted the experiments involving feeding them the extract and monitoring their behavior. The rats in the healthy control group exhibited glossy hair and gentle behavior (data not shown). In contrast, the SHRs in the disease control group showed an aggressive behavior and their hairs were thinner and fluffier. The SHRs treated with the Gaocha extract had more closely distributed and glossy hair, and those with the high Gaocha dose administration had similar hair growth and behavior as the SHRs treated with captopril (positive control). All the rats were kept in the same conditions with free access to water and food during the experiment.

    • In order to evaluate the potential of Gaocha extract in reducing blood pressure, we monitored the tail artery blood pressure of SHRs. The results in Table 2 showed the tail artery systolic blood pressure of these rats during the experimental period. It was observed that the rats in the healthy control group had a blood pressure ranging from 109.92 to 116.49 BP/mm Hg. The SHRs in the disease control group exhibited an elevated blood pressure compared to the normal rats during the whole experiment period and their blood pressure was about 166.34 to 167.69 BP/mm Hg. The SHRs in the positive control group (captopril) had a lower blood pressure during the study and their blood pressure remained around 110 BP/mm Hg. The Gaocha extract resulted in a significant decrease in the blood pressure of the SHRs, and such pressure alleviation relied on the administration dose of the extract (Table 2). For example, the SHRs orally gavaged with the low Gaocha extract dose reduced their pressure from 169 BP/mm Hg to about 134 BP/mm Hg. The Gaocha extract with the mid dose lowered the blood pressure of the SHRs to about 125 BP/mm Hg. It is noteworthy that the SHRs treated with the high Gaocha extract dose had a similar blood pressure as the normal control rats and the captopril treated SHRs, suggesting that the high Gaocha extract dose may be effective in reducing high blood pressure.

      Table 2.  Tail artery systolic blood pressure of normal and spontaneously hypertensive rats treated with different Gaocha extract levels during the administration period.

      Group Blood pressure during administration period (BP/mm Hg)
      0 day 3 day 7 day 10 day 15 day
      Normal rats (healthy control) 114.48 ± 2.47e 109.92 ± 5.75e 112.23 ± 2.40e 116.49 ± 6.43d 115.87 ± 3.56d
      SHRs (disease control) 166.78 ± 2.71b 167.69 ± 2.46a 166.81 ± 2.71a 167.52 ± 2.56a 166.34 ± 2.99a
      SHRs with captopril (6.25 mg/kg) 165.36 ± 3.23b 123.92 ± 7.29cd 114.65 ± 2.71de 116.86 ± 4.62d 109.72 ± 3.51e
      SHRs with high Gaocha dose (12 mg/kg) 171.77 ± 5.13a 122.18 ± 4.67b 117.77 ± 3.53b 122.75 ± 1.72b 121.82 ± 3.41b
      SHRs with mid Gaocha dose (6 mg/kg) 161.72 ± 3.77c 127.99 ± 4.67c 125.37 ± 2.25c 125.48 ± 3.07c 123.91 ± 2.12c
      SHRs with low Gaocha dose (3 mg/kg) 169.17 ± 9.12ab 139.46 ± 1.69d 134.41 ± 3.85d 134.25 ± 3.49c 133.09 ± 3.76c
      Data are the mean ± standard error. Different letters in each column represent significant difference at a 0.05 significant level.
    • To explore the potential mechanism of Gaocha extract in lowering blood pressure, we analyzed its effects on PGI2, AngII, and ET level of SHRs. The healthy rats (healthy control group) had a PGI2 level of 30 ng/L, whereas its level was only about 10 ng/L in the SHRs of disease control group (Fig. 1a). Administrating captopril (positive control) to the SHRs for 16 d resulted in a level increase of PGI2 in the SHRs. The SHRs treated with the low Gaocha extract dose exhibited a similar PGI2 level as the disease control group. However, the mid and high Gaocha extract dose significantly increased the PGl2 level in the SHRs, and the SHRs with the high extract dose administration had a similar PGl2 level as the positive control SHRs (captopril).
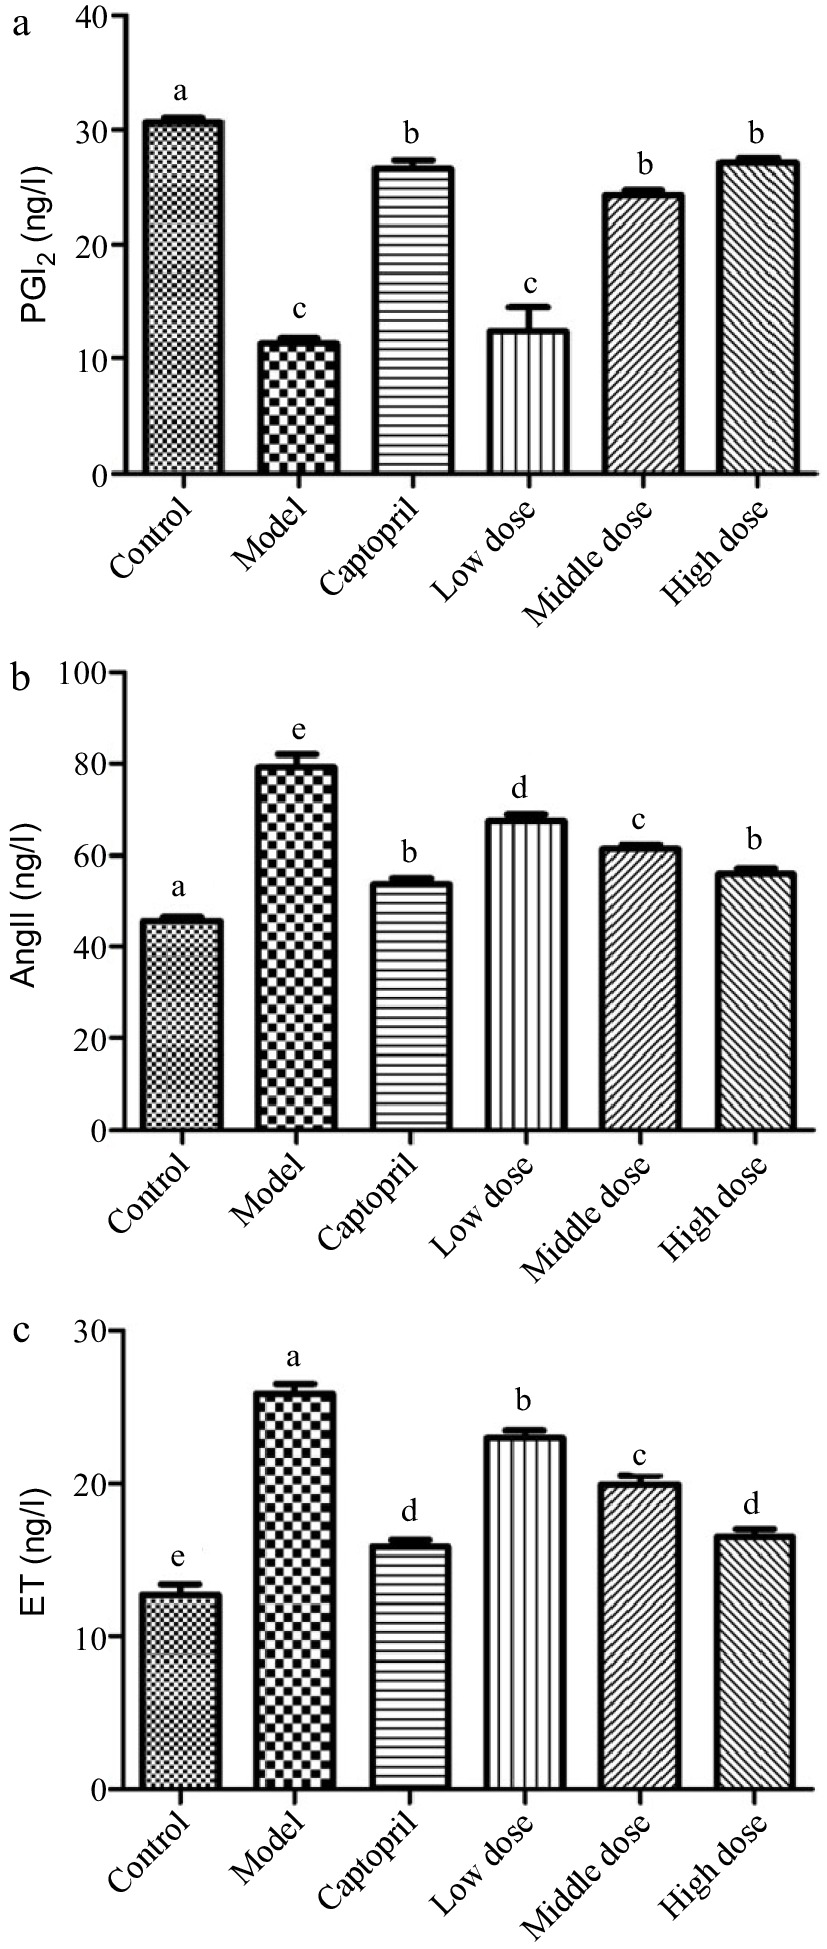
      Figure 1. 

      The serum PGI2, AngII and ET levels in normal and spontaneously hypertensive rats treated with different Gaocha extract doses. (a) Serum PGI2 level, (b) Serum AngII level, and (c) Serum ET level. Different letters represent significant difference at a significant level of 0.05.

      The Ang II level in the healthy control group rats was about 45 ng/L in this study, whereas the SHRs in the disease control group had an about 80 ng/L Ang II level (Fig. 1b). The captopril (positive control) administration significantly reduced the Ang II level to about 55 ng/L in the SHRs. Feeding the SHRs with the Gaocha extract resulted in a decrease on the Ang II level. Such a decrease was much more obvious with the higher dose administration.

      In addition, the SHRs in the disease control group exhibited the ET level two times higher than the healthy control group rats (Fig. 1c). The captopril treatment significantly lowered the ET level in the SHRs. The Gaocha extract administration with different doses also resulted in an ET level decrease in the SHRs after the experiment and the high Gaocha extract dose appeared to result in the SHRs with the similar ET level as the positive control (captopril).

    • Nitric oxide (NO) is a key signaling messenger that is biosynthesized from L-arginine, oxygen, NADPH through nitric oxide synthase enzymes[33,34]. It has been reported that NO could relax the smooth muscle in the endothelial cells to widening the blood vessel and increasing blood flow[35,36]. Figure 2 shows the NO level of these rats after the whole animal study. The normal rats (healthy control group) were found to have a NO level around 8 ng/L, whereas spontaneously hypertension caused the rats to have the NO level less than 4 ng/L. After treating the SHRs with the positive control captopril for 16 d, the NO level of the SHRs was elevated to about 7 ng/L. It should be noted that the administration of the Gaocha extract for 16 d did improve the NO levels in the SHRs. The NO level in the SHRs treated with the low, mid, and high dose of the Gaocha extract appeared to be about 4, 5, and 7 ng/L, respectively. These indicated that the Gaocha extract could stimulate the biosynthesis of NO in the SHRs, which could enhance the vasodilation and reduce the blood pressure.
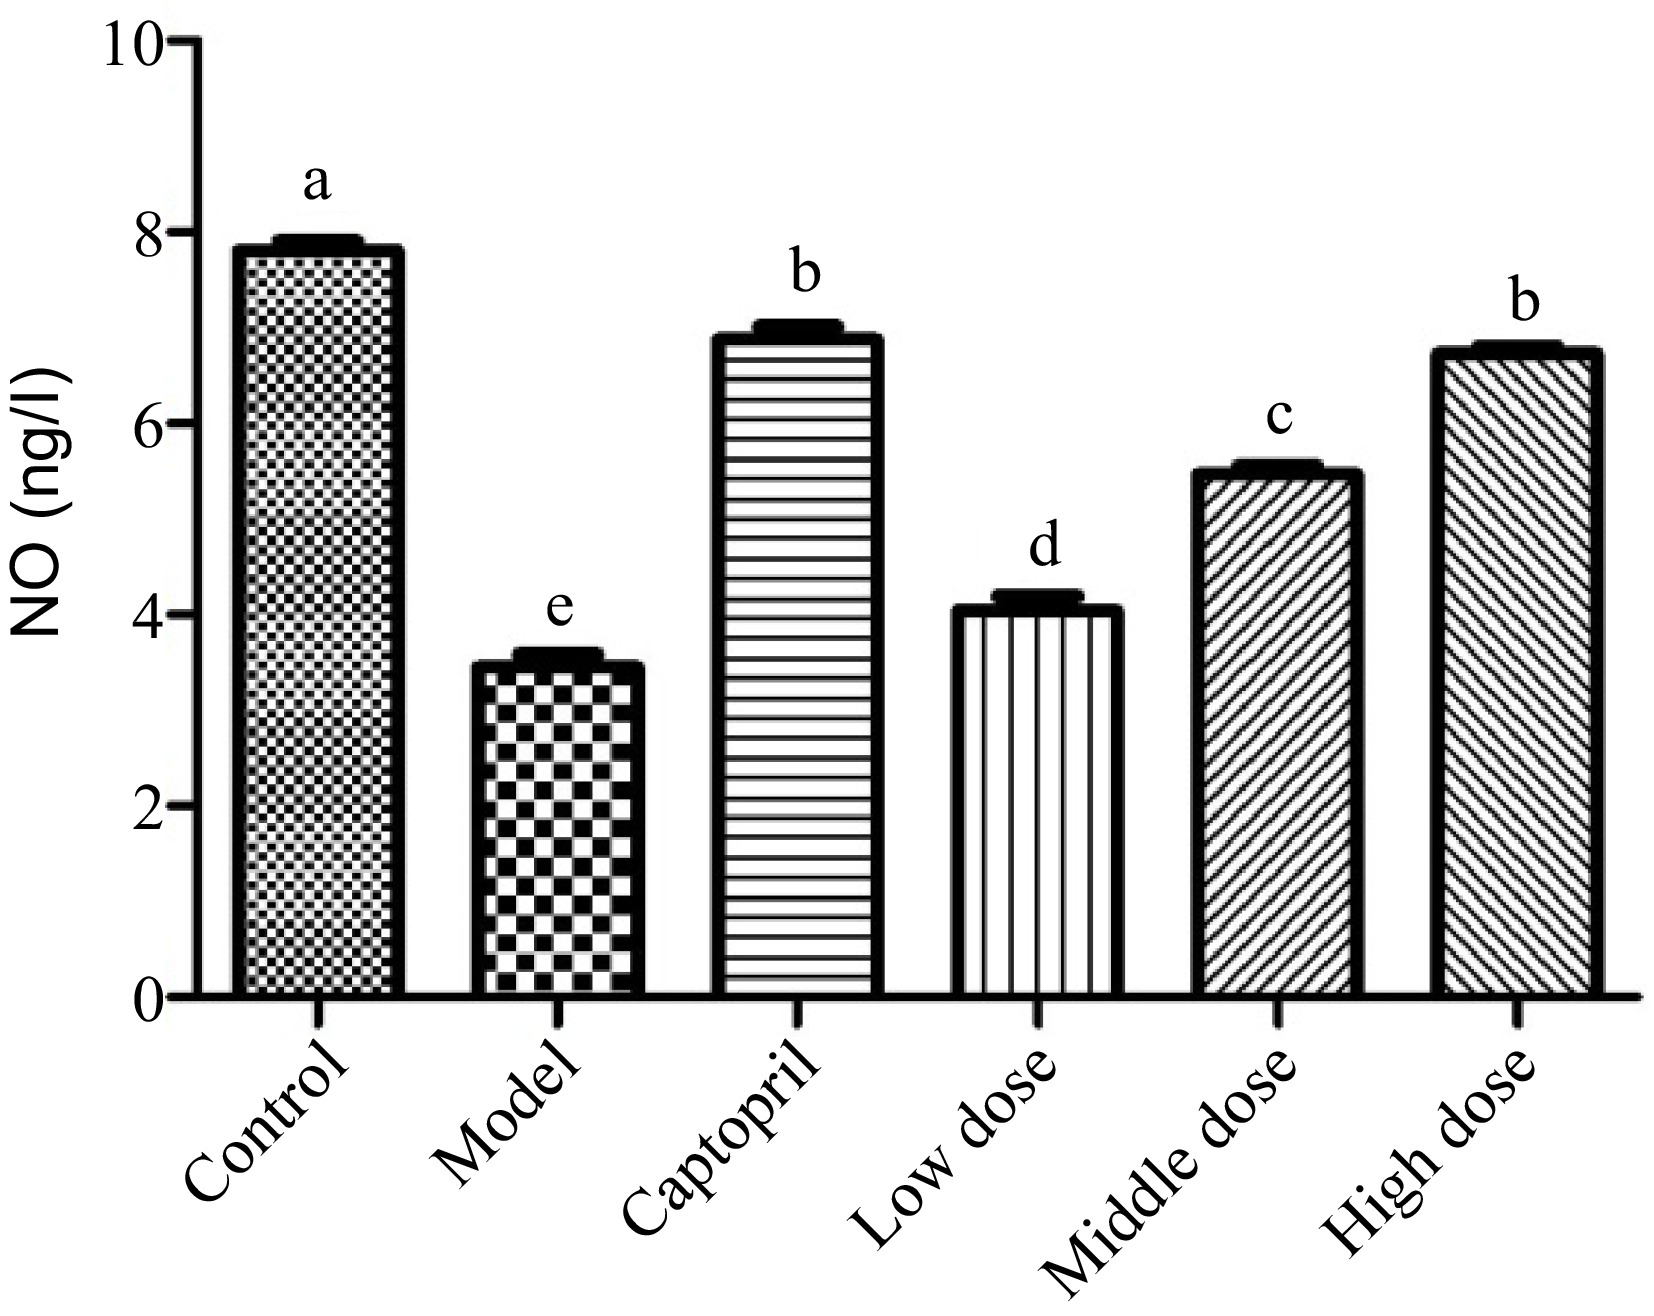
      Figure 2. 

      The serum nitric acid (NO) levels in normal and spontaneously hypertensive rats treated with different Gaocha extract doses. Different letters represent significant difference at a significant level of 0.05.

    • Interleukin 6 (IL-6) is an interleukin that could be produced as a pro-inflammatory cytokine by smooth muscle cells in the tunica media of blood vessels[37]. It has been reported that muscle contraction could stimulate the secretion of IL-6 into blood stream[18]. The spontaneous hypertension significantly increased the release of IL-6 level in the rats (Fig. 3a). The healthy control group rats had a IL-6 level of about 12 ng/L, whereas its level in the SHRs control group was higher than 25 ng/L. The SHRs treated with captopril for 16 d showed its IL-6 level at around 15 ng/L, indicating that captopril inhibited the biosynthesis and secretion of IL-6 in the SHRs. The SHRs gavaged with the Gaocha extract for 16 d also reduced the secretion of IL-6. For example, the IL-6 level in the SHRs with the mid and high dose of the Gaocha extract were much lower than the SHRs control group, and the high Gaocha extract dose treated SHRs showed a similar IL-6 level as the SHRs administrated with captopril.
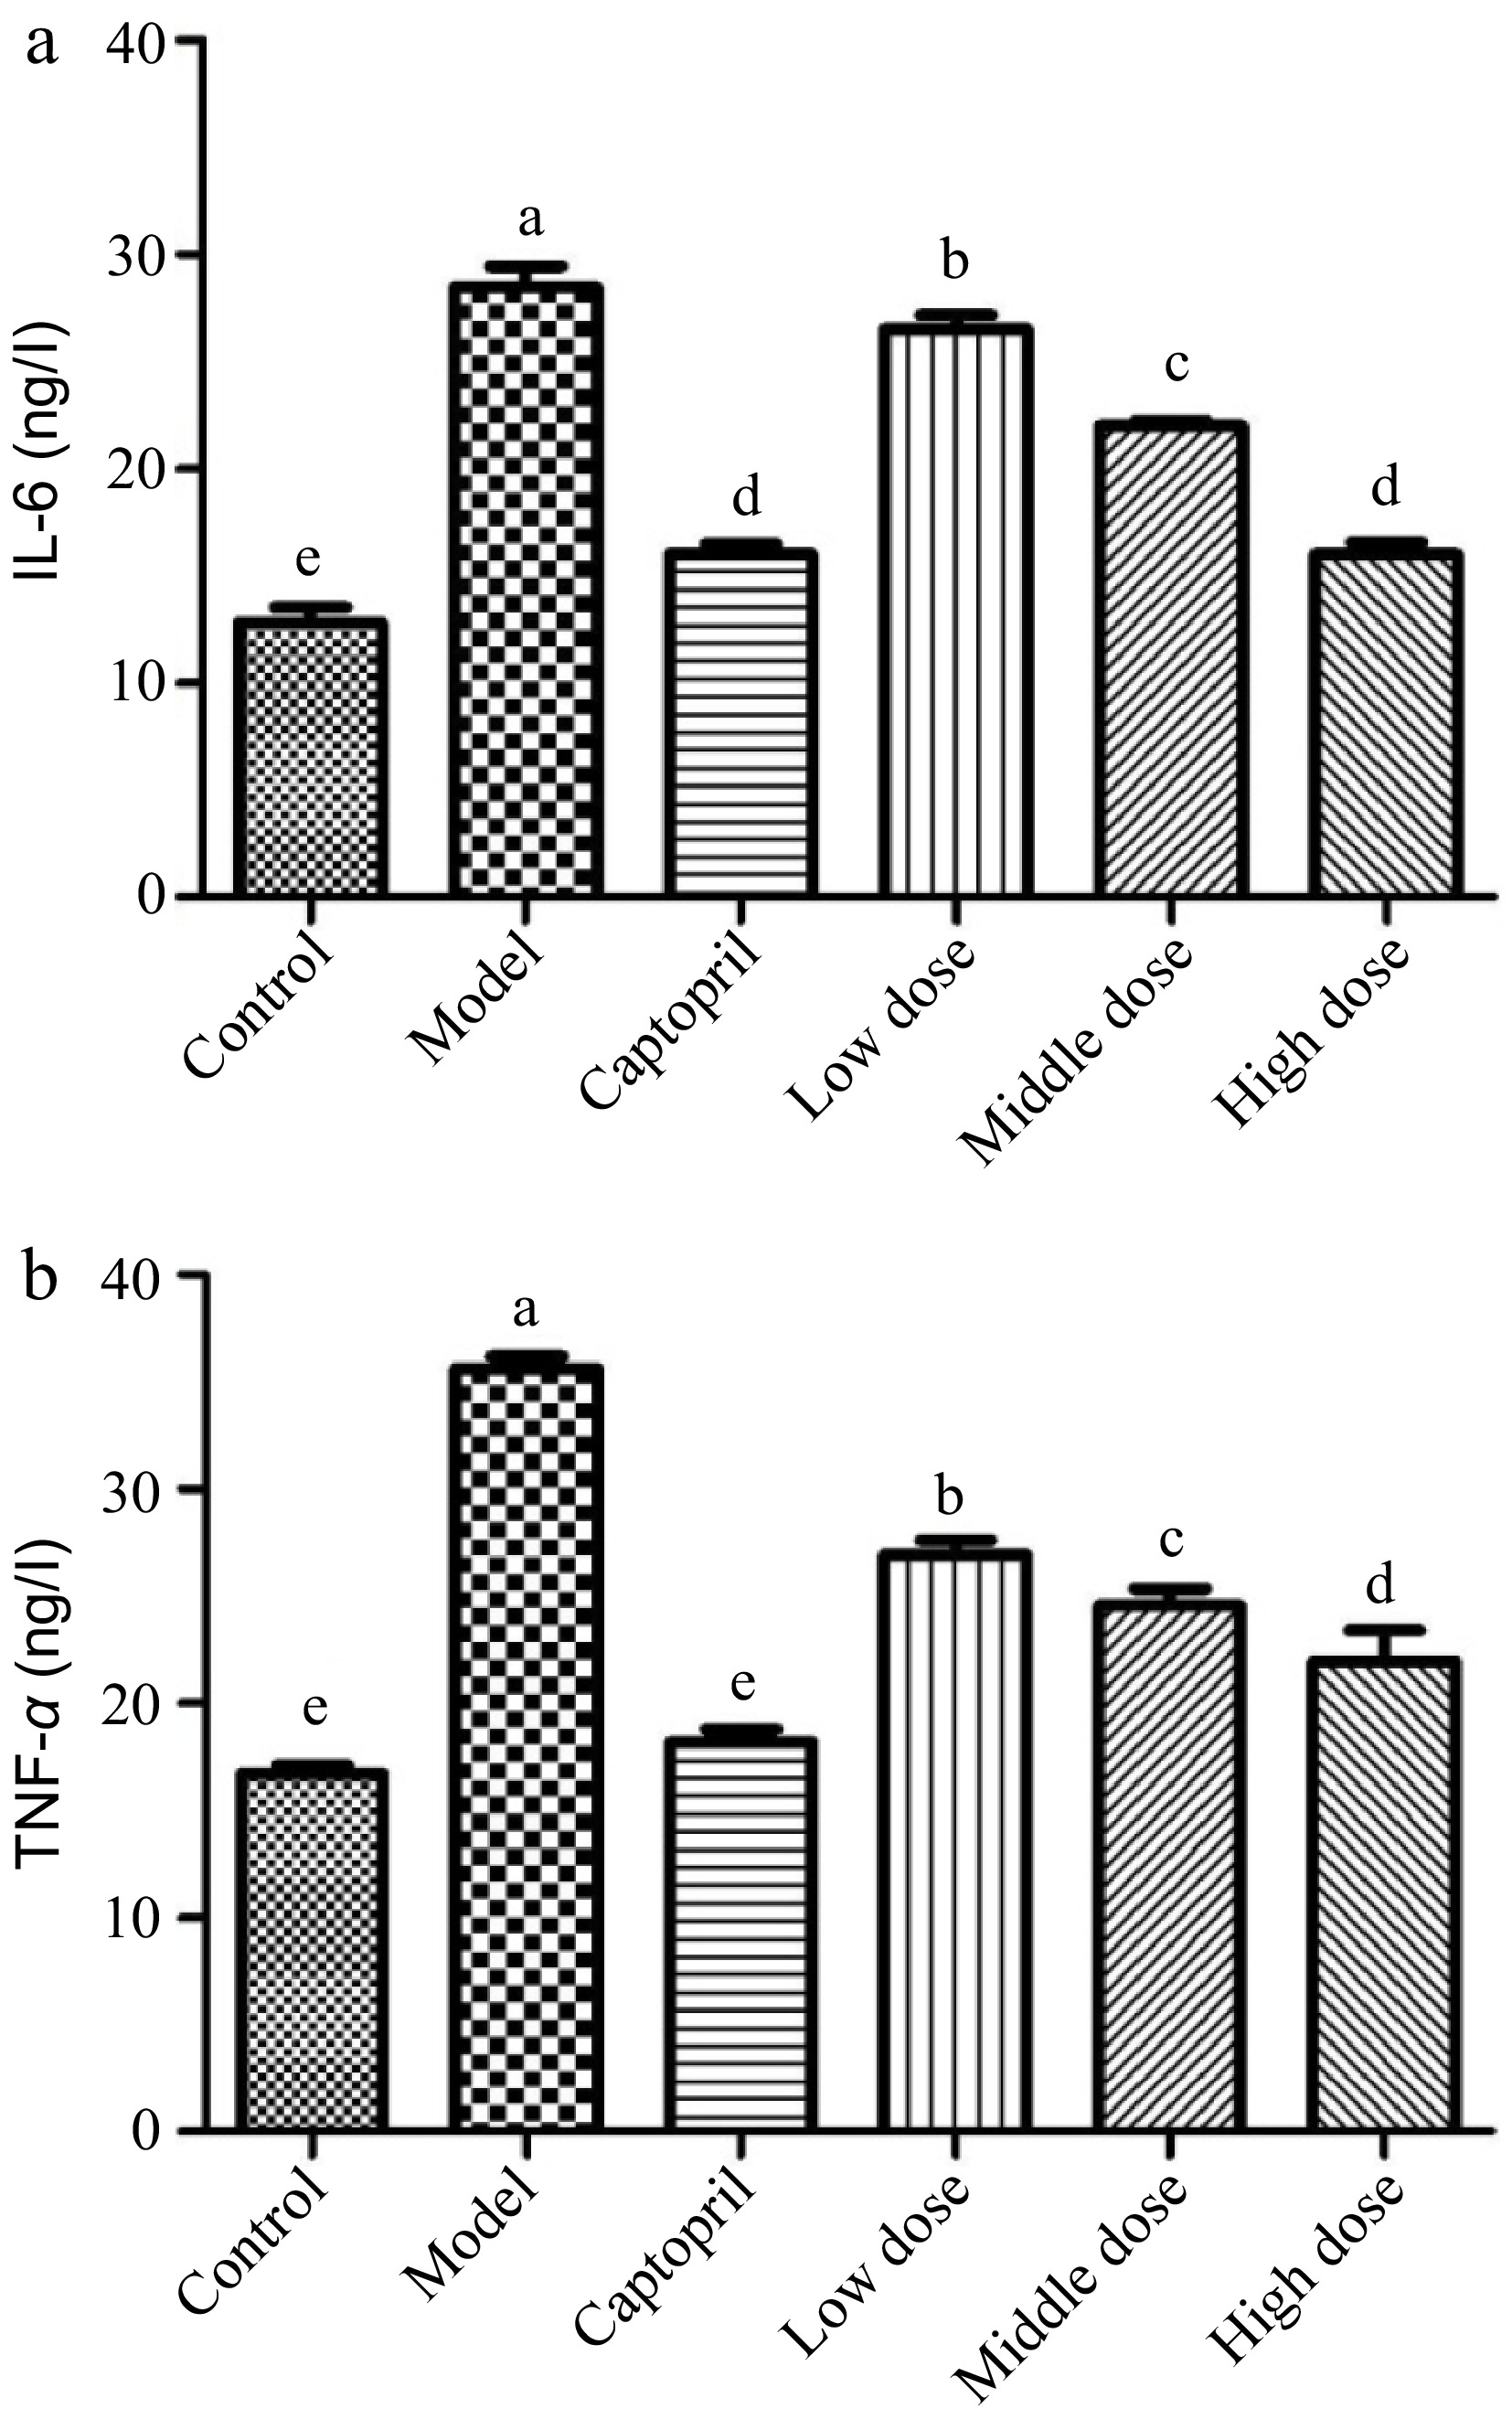
      Figure 3. 

      The serum IL-6 and TNF-α levels in normal and spontaneously hypertensive rats treated with different Gaocha extract doses. (a) Serum IL-6 level and (b) Serum TNF-α level. Different letters represent significant difference at a significant level of 0.05.

      Tumor necrosis factor-α (TNF-α) is a proinflammatory cytokine that can be elevated in an inflammatory state, such as hypertension[19,20]. It has been reported that the formation of TNF-α is associated with salt-sensitive hypertension and related renal injury, whereas Ang II increase could also promote the release of TNF-α[21,38]. In the present study, the SHRs control group showed a much higher level of TNF-α than the healthy control group rats (Fig. 3b). This indicated that hypertension stimulated the release of TNF-α in the SHRs. Both captopril and Gaocha extract inhibited the secretion of TNF-α in the SHRs after 16 d of treatment. For example, the captopril treated SHRs possessed a similar TNF-α level as the healthy control rats. The SHRs that were gavaged with Gaocha extract showed a significantly lower level of TNF-α compared to the control group. Furthermore, increasing the dose of the extract resulted in a greater inhibition of TNF-α release in the SHRs.

    • Regarding the rat heart histomorphological analysis, no thickening on the cardiac muscle fiber or fibrous hyperplasia was found in the healthy control group rats (Fig. 4a). However, the cardiac muscle fibers in the SHRs control group (disease control group) were significantly thickened with the muscle tissue hyperplasia (Fig. 4c). These demonstrated that spontaneous hypertension damaged the organs in the SHRs. In the captopril treated SHRs (positive control), their cardiac muscle fibers appeared to be normal without thickening, and their blood cells were visible in the cardiac cavities. Besides, no fibrous hyperplasia was found in the mesenchyme of the rats (Fig. 4b). The administration of the Gaocha extract improved the cardiac muscle fibers compared to the SHRs control although the thickening of the fibers still occurred to these Gaocha extract fed SHRs (Fig. 4df). It should be noted that the cardiac muscle fibers in the SHRs with the high Gaocha extract dose appeared to be much thinner than the low extract dose fed SHRs. Meanwhile, the blood cells were observed in the cardiac cavities of these SHRs treated with the Gaocha extract. More importantly, no obvious tissue hyperplasia was found in these Gaocha extract treated SHRs.
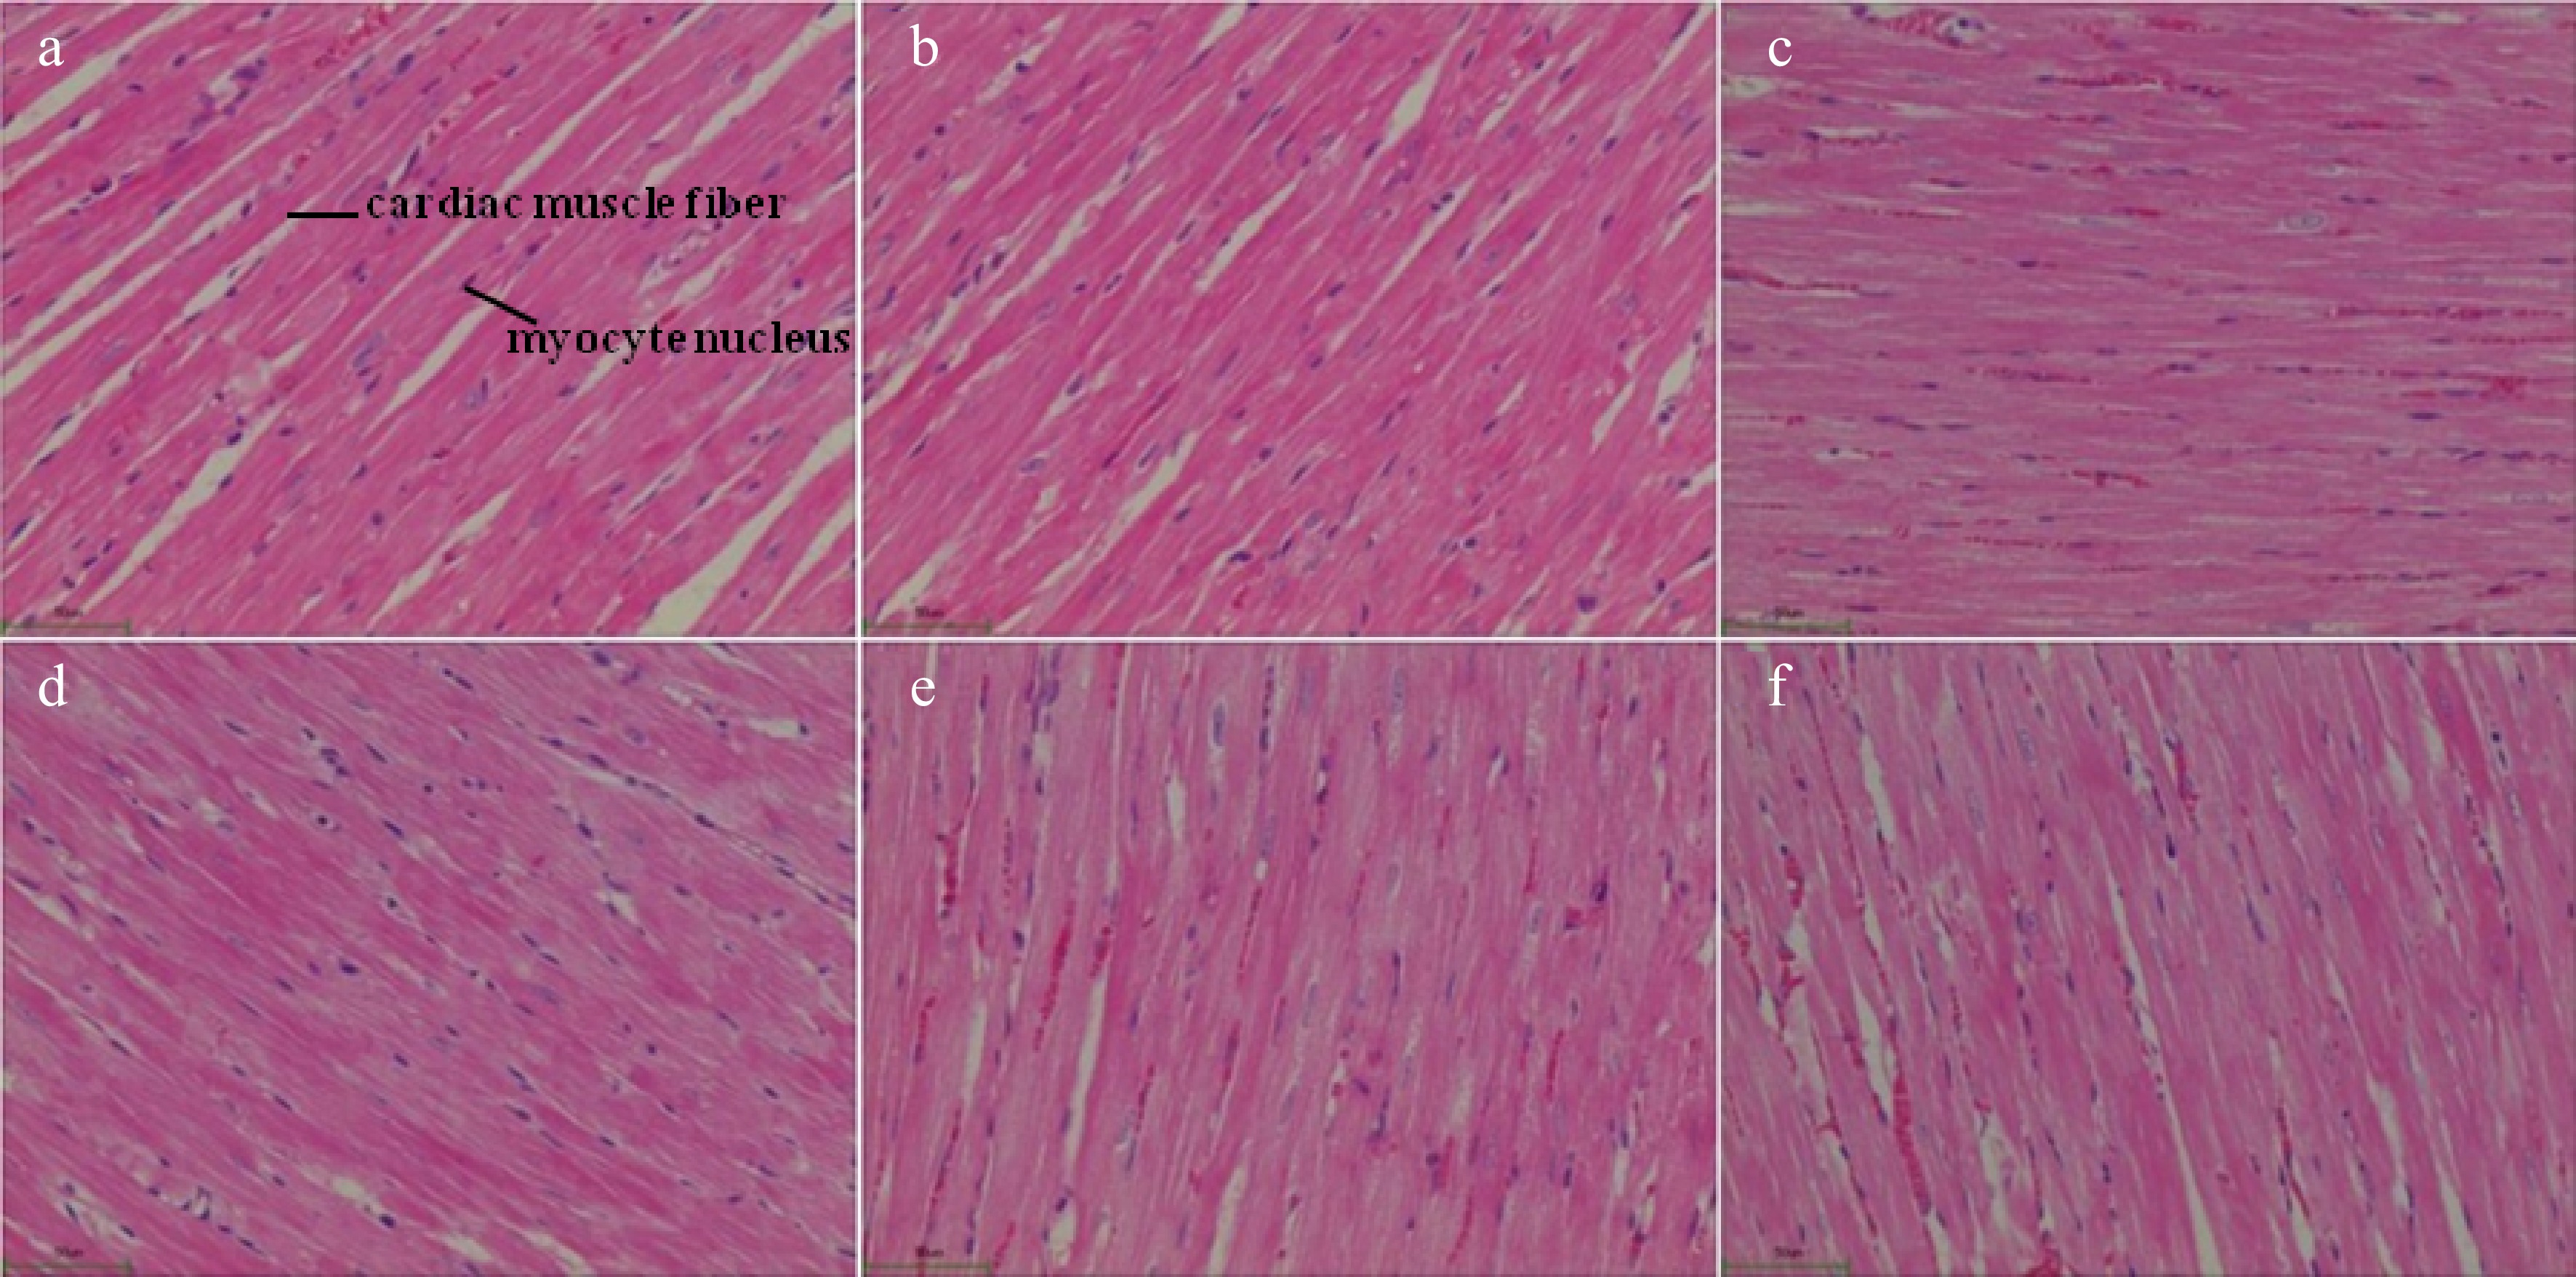
      Figure 4. 

      Morphological feature of cardiac tissue in normal and spontaneously hypertensive rats treated with different Gaocha extract doses. (a) Normal rats in healthy control group.(b) Captopril treated spontaneously hypertensive rats. (c) Spontaneously hypertensive rats in disease control group. (d) Low Gaocha extract dose treated spontaneously hypertensive rats. (e) Mid Gaocha extract dose treated spontaneously hypertensive rats. (f) High Gaocha extract dose treated spontaneously hypertensive rats.

      The healthy control group rats possessed normal renal tubules in the kidney histomorphological biopsy (Fig. 5a). However, a significant stenosis of the renal tubules happened in the SHRs (disease control group). Meanwhile, these SHRs were found to have fibrosis in the renal interstitium with a structural alteration on the glomerulus (Fig. 5c). The captopril treated SHRs improved the structure of the renal tubules and glomerulus and the histomorphological feature of the SHRs kidney was similar to that of the healthy rats. An improvement of the kidney structure on the SHRs treated with the Gaocha extract was also found. Among these treatments, the high Gaocha extract dose resulted in SHRs with normal renal tubules and glomerulus. Meanwhile, no obvious renal interstitial fibrosis or renal tubule stenosis was found in these SHRs.
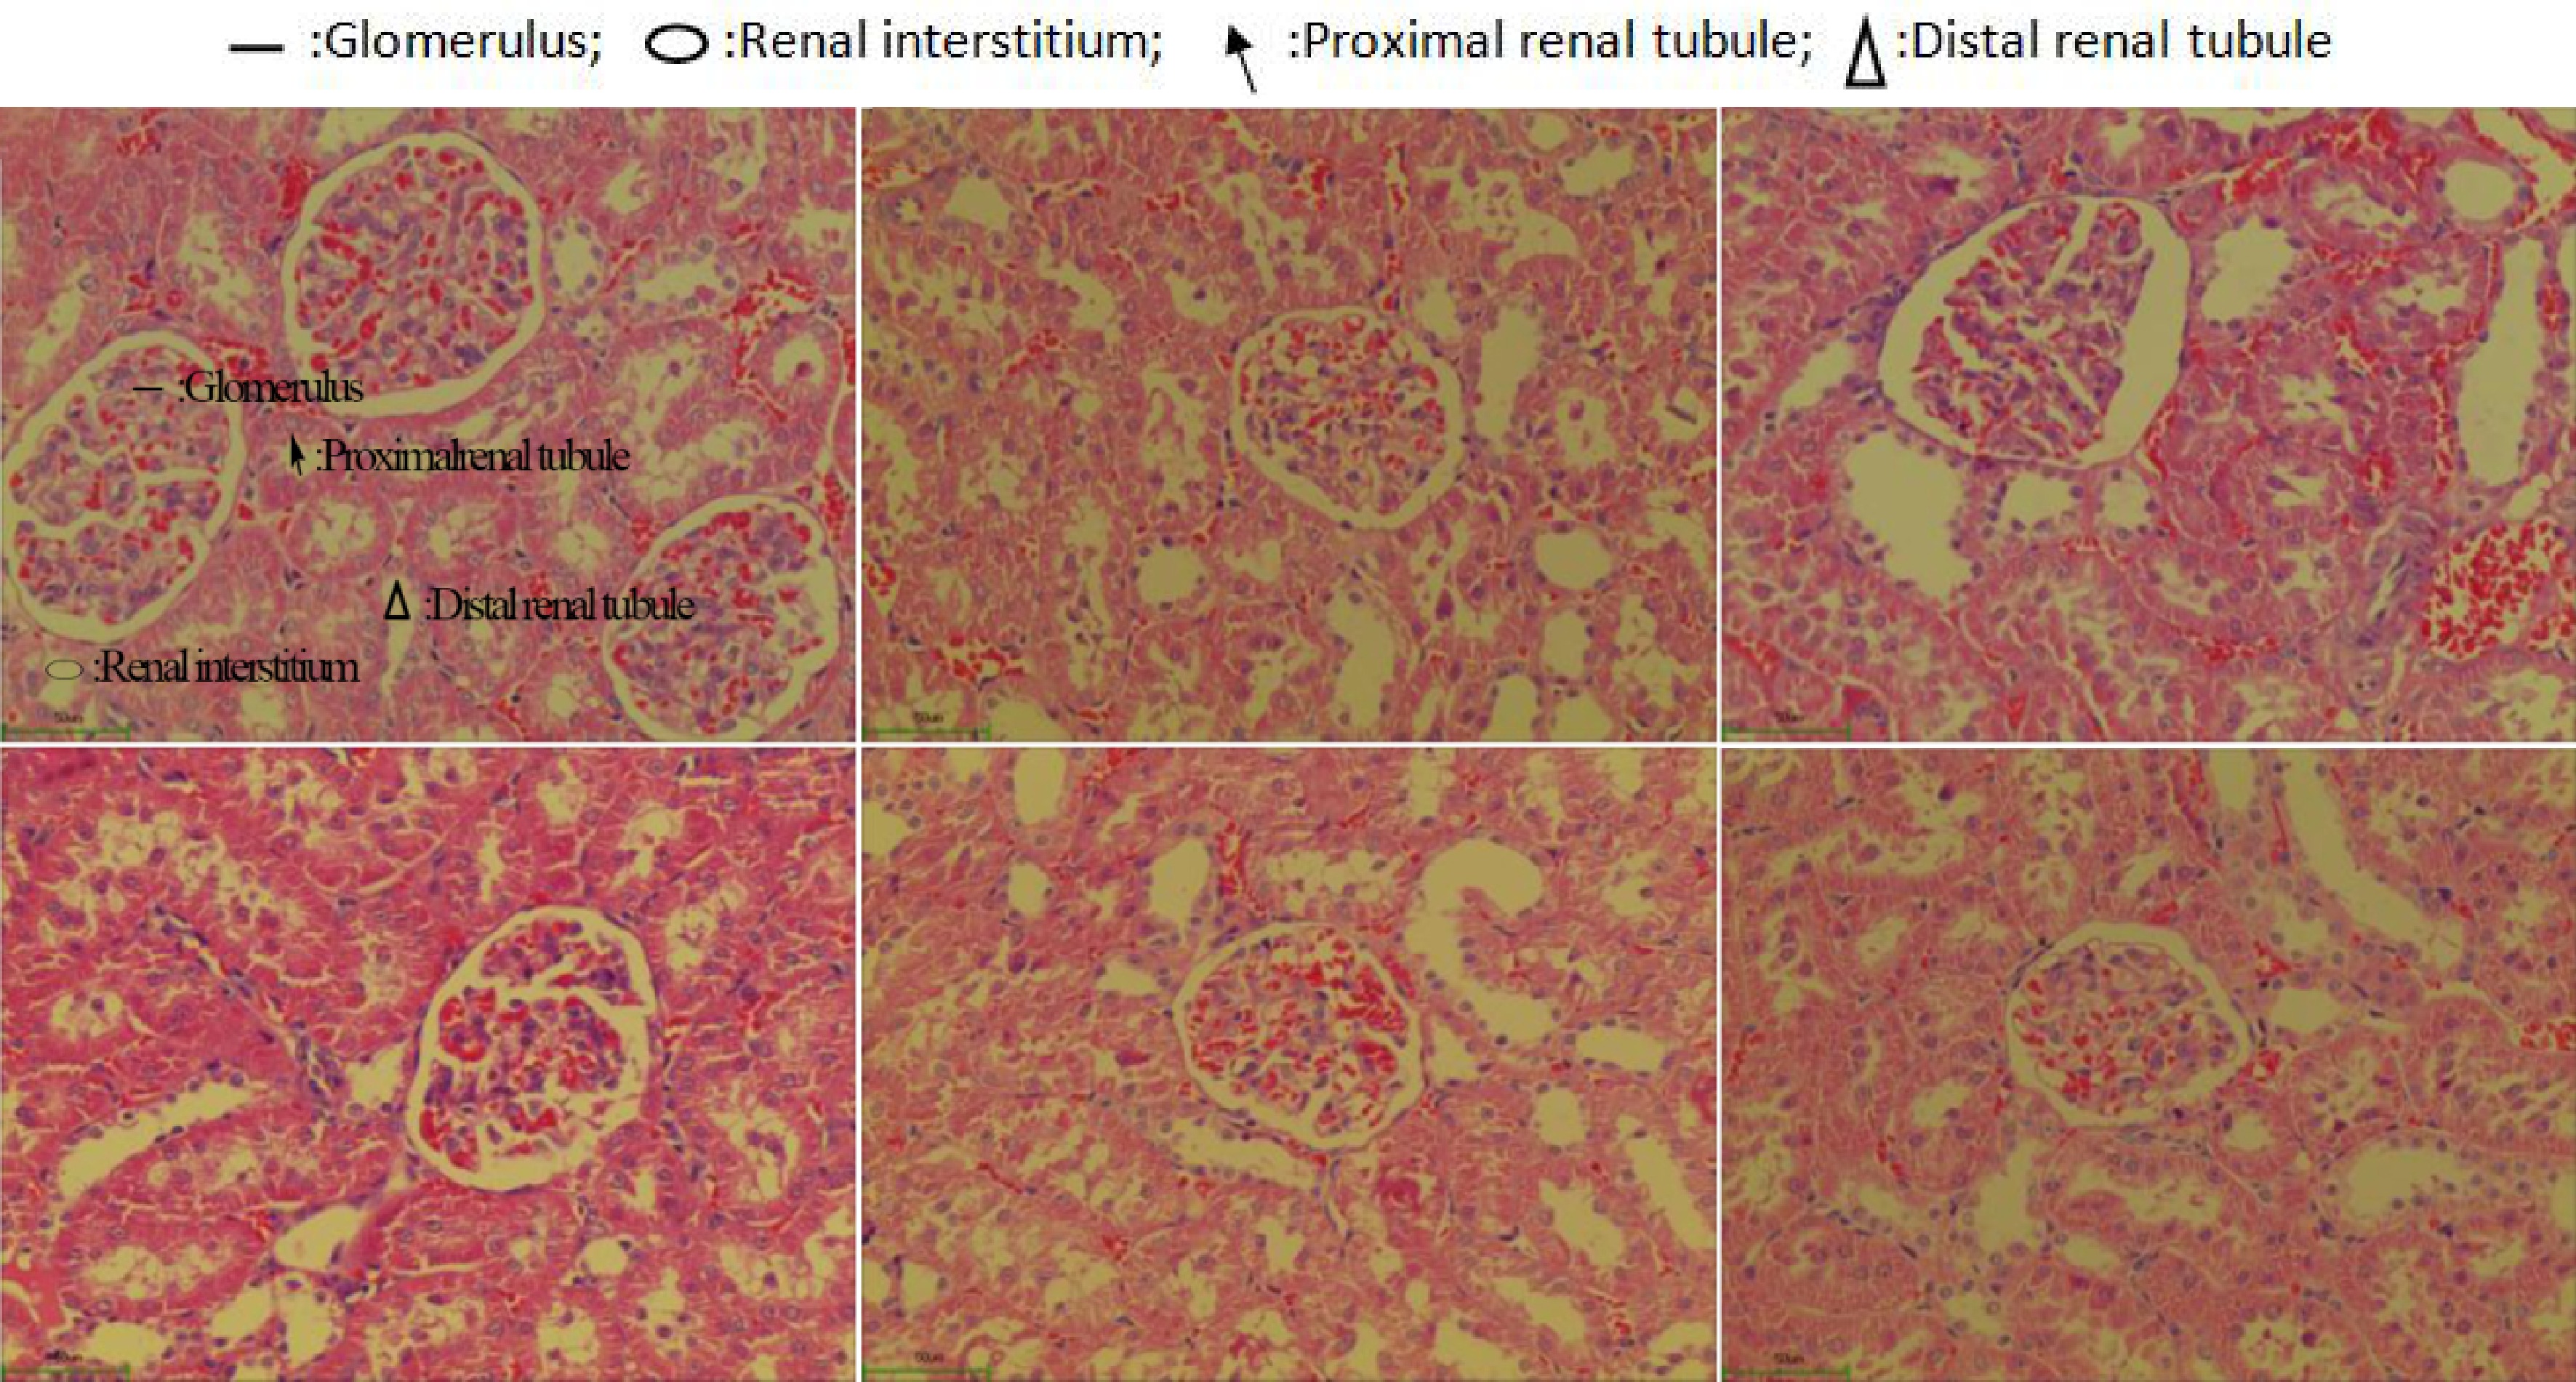
      Figure 5. 

      Morphological feature of renal tissue in normal and spontaneously hypertensive rats treated with different Gaocha extract doses. (a) Normal rats in healthy control group.(b) Captopril treated spontaneously hypertensive rats. (c) Spontaneously hypertensive rats in disease control group. (d) Low Gaocha extract dose treated spontaneously hypertensive rats. (e) Mid Gaocha extract dose treated spontaneously hypertensive rats. (f) High Gaocha extract dose treated spontaneously hypertensive rats.

      In this study, we explored the anti-hypertensive effects of Gaocha extract on spontaneously hypertensive (SHR) rats. It was found that the groups treated with Gaocha had lower systolic blood pressure in the tail artery compared to the control group. Additionally, the levels of certain biomarkers, such as PGI2, Angiotensin II, ET, and NO, were higher in the Gaocha-treated groups. After treatment, the levels of IL-6 and TNF-α were lower in the Gaocha-treated groups compared to the control group. Histomorphological examination of the heart and kidney indicated that Gaocha may possess a protective effect. Future research will aim to identify the active components and elucidate the associated health benefits.

    • Gaocha has been reported to contain numerous nutrients that could provide multiple benefits to human health[2326]. Among these nutrients, polyphenols appear to be a major group for such beneficial activities. It has been confirmed that polyphenols are important antioxidants that could prevent the occurrence of many active and chronic diseases and these secondary metabolites could also regulate the secretion of signaling molecules in the human body[39,40]. Interestingly, our results showed that the content of EC was extremely high in Gaocha extracted solution. It was reported that the EC had a positive effect on vascular function in humans by inhibition of NO synthase[33]. Furthermore, it was also reported that epicatechin (EC) may in part contribute to the cardioprotective effects of cocoa and tea by improving insulin resistance[34]. These suggested that the high content of EC could be part of the reason for the vascular function of Gaocha. Moreover, Gallic acid (GA) was also reported as an active compound in Gaocha. Previous studies have demonstrated that GA can enhance NO production by augmenting the phosphorylation of eNOS. Additionally, GA has been found to impede the activity of ACE, leading to a reduction in the blood pressure of spontaneously hypertensive rats[35]. It can increase eNOS phosphorylation levels by influencing the Ca2+/CaM compounds, and also inhibit calcium influx into cells through the L-type calcium channel, resulting in the dilation of endothelial cells[36]. It is yet to be determined whether the GA lowers blood pressure, and this will be the focus of future research involving active ingredients, molecular and cellular studies.

      Hypertension is a progressive cardiovascular condition, caused by different factors, which can cause changes in the heart and blood vessels' structure and function. It affects one in every three adults and an increase of 1 mm of mercury in hypertension patients increases the mortality rate by 1%. Therefore, research on molecular mechanisms is essential for the prevention and treatment of hypertension[12]. Hypertension is a multi-faceted medical condition, composed of several risk factors, such as atherosclerosis, endothelial cell damage, hyperlipidemia, and subclinical diseases, that can culminate in cardiovascular events. Its development involves endothelial dysfunction, vascular remodeling, inflammation, calcification, and increased vascular stiffness[11]. Endothelial dysfunction is believed to be an important factor in the pathogenesis of hypertension[7], as it has a genetic basis and can affect target organs. Furthermore, increased shear stress in the blood vessels due to hypertension can cause changes in the structure and function of vascular endothelium[41].Vascular endothelial cells are capable of releasing a variety of active factors that can cause blood vessels to relax or contract through autocrine and paracrine pathways, such as NO, PGI2, ET, and Ang II[11].

      In hypertension, the contraction of blood vessels causes ischemia and hypoxia of the endothelial cells, leading to damage to their structure and function, and consequently, affects the production and release of NO. Oxidative stress has been identified as a major contributor to the processes of endothelial dysfunction, inflammation, hypertrophy, apoptosis, migration, fibrosis, angiogenesis, and hypertensive vascular remodeling[13]. Endothelin has a pronounced effect of decreasing vascular diameter, in comparison to Angiotensin II, which is produced by hyperpolarization of vascular endothelial cells and also has a vasoconstrictive action but with less intensity. Ang II is a peptide hormone that is basically converted from Ang I through angiotensin-converting enzyme (ACE)[42]. Ang II has been confirmed to act on venous and arterial smooth muscle to increase vasoconstriction. ACE inhibitors could restrain the conversion of Ang I to Ang II and thus improve the blood pressure[43]. Feeding the SHRs with the Gaocha extract resulted in a decrease in the Ang II level. Such a decrease was much more obvious with the higher dose administration. We speculated that phenolic compounds, such as epicatechin and epigallocatechin, in the Gaocha extract might inhibit the renin-angiotensin system (RAS) activation pathway to reduce the secretion of Ang II in the SHRs. In this way, the vascular wall of the SHRs could be protected.

      In addition, ET is a peptide that is primarily present in endothelium and its overexpression could drive hypertension, heart diseases and other organ damages[44]. ET is a vasoconstrictor that interacts with smooth muscle endothelin receptors[45]. It has been reported that epicatechin could inhibit the interaction between ET and its endothelin receptors[46]. We hypothesized that the high level of epicatechin, found in the Gaocha extract, could inhibit endothelin receptors and thus prevent the excessive production of ET in SHRs.

      PGl2 is an important prostaglandin member that could inhibit platelet activation. It is biosynthesized in endothelial cells and plays a vital role in preventing the platelet plug formation through primary hemostatsis[16]. In addition, PGl2 could exert as a vasodilator to stabilize cardiovascular homeostasis[47]. Physiologically, NO, PGI2, ET, and AngII are in a state of balance. When pathological factors disrupt this equilibrium of active substances in VEC, it can cause platelet activation and endothelial cell damage, which can contribute to or aggravate the occurrence of cardiovascular disease[1416]. Recent research has revealed that endothelial damage and dysfunction are major factors in the onset and advancement of hypertension[48,49].

      IL-6 and TNF-α are pro-inflammatory factors that can cause direct damage to vascular endothelium. TNF-α can disrupt the structure and function of vascular endothelial cells, leading to inflammatory reactions in the vascular wall[14]. IL-6 is a glycoprotein mainly produced by T cells and B cells, and it is involved in the regulation of immune response, acute phase response, and hematopoietic function. Additionally, IL-6 can activate platelet activating factors, which can enhance platelet aggregation and form thrombosis, thus damaging the endothelial cells of hematopoietic blood vessels[15].

      The present study demonstrated that the Gaocha extract is capable of effectively reducing blood pressure in SHR rats, as well as decreasing the serum levels of Ang II and ET, while increasing the levels of NO and PGI2. This protective effect on vascular endothelial function is thought to be achieved by obstructing the activation pathway of RAS, thereby diminishing the amount of Ang II produced and its consequential damage to the vascular wall. Additionally, the Gaocha extract may bind to ET and receptors in vascular endothelial cells, resulting in the release of NO and PGI2, which leads to the relaxation of blood vessels and a decrease in blood pressure. The findings hold important clinical implications for the treatment of hypertension, suggesting that Gaocha extract may have the potential to serve as a natural alternative with potentially fewer side effects and greater safety compared to conventional chemical drugs. Furthermore, the study underscores the need for further research on Gaocha to elucidate its active components and associated mechanisms. Subsequent research will seek to identify the active components of Gaocha and explore their potential for treating hypertension using vascular endothelial cell lines. This will involve evaluating changes in pertinent biomarkers and utilizing Western blot or PCR techniques to assess the influence of these active components on gene and protein expression levels relevant to vascular activity, as well as their regulatory effects on genes linked to endothelial cell function. Meanwhile, conducting animal studies can provide insights into the effects of Gaocha extract on vascular endothelial function, vascular remodeling, inflammatory factors, and its regulatory influence on blood pressure. These efforts will enhance our understanding of the antihypertensive mechanisms of Gaocha extract and its potential for treating hypertension. Overall, the study highlights the promising antihypertensive effects of Gaocha extract and underscores the need for further research to unlock its full therapeutic potential for human health.

    • In this work, we discuss the effect of Gaocha extract treatment on spontaneously hypertensive (SHR) rats. Male SHR rats were randomly divided into the model (saline), positive control (captopril), low-dose Gaocha extract, medium-dose Gaocha extract and high-dose Gaocha extract groups, which were treated daily for two weeks. Tail artery systolic blood pressure (SBP) was measured before and 3, 7, 10, and 15 d after treatment. The Gaocha-treated groups had significantly lower SBP than the model group. Post-treatment abdominal aorta blood samples showed that the serum Angiotensin II, ET, IL-6, and TNF-α levels were significantly higher and the serum NO and PGI2 levels were significantly lower in the model group. Finally, haematoxylin-eosin staining of the heart and kidney showed that Gaocha extract had a protective effect. Thus, our findings indicate that Gaocha extract has obvious treatment benefits in SHR rats with regard to lowering SBP and protecting the vascular endothelium.

    • The animal study protocol was conducted in compliance with the Guide for the Care and Use of Laboratory Animals in Ministry of Science and Technology of the People's Republic of China. The protocol was reviewed and approved by the ethics committee of Anhui Agricultural University (Anhui, China).

    • The authors confirm contribution to the paper as follows: study conception and design: Wang H, Gao L; experiments performed: Wang W, Ma J, Ma Y, Bao Y, Long Z, Lei S, Xu Y, Dai Q; draft manuscript preparation: Wang H, Wang W. All authors reviewed the results and approved the final version of the manuscript.

    • The datasets generated during and/or analyzed during the current study are available from the corresponding author on reasonable request.

      • This work was supported by the National Natural Science Foundation of China (Grant No. 31700608 and 32202551), Natural Science Foundation of Anhui Province (Grant No. 1708085MC58), the Natural Science Basic Research Program of Shaanxi (Grant No. 2022JQ-194) and the Anhui Agriculture University Pesident Fund (Grant No. 2014SKQJ020). We thank Professor Zijiang Long at the Function Experiment Center, Anhui University of Chinese Medicine for his assistance.

      • The authors declare that they have no conflict of interest.

      • # These authors contributed equally: Wenzhao Wang, Jing Ma

      • Copyright: © 2024 by the author(s). Published by Maximum Academic Press, Fayetteville, GA. This article is an open access article distributed under Creative Commons Attribution License (CC BY 4.0), visit https://creativecommons.org/licenses/by/4.0/.
    Figure (5)  Table (2) References (49)
  • About this article
    Cite this article
    Wang W, Ma J, Ma Y, Bao Y, Long Z, et al. 2024. Chemical constitutes and anti-hypertension potential of Gaocha (Acer ginnala Maxim) in spontaneously hypertensive rat. Beverage Plant Research 4: e011 doi: 10.48130/bpr-0024-0004
    Wang W, Ma J, Ma Y, Bao Y, Long Z, et al. 2024. Chemical constitutes and anti-hypertension potential of Gaocha (Acer ginnala Maxim) in spontaneously hypertensive rat. Beverage Plant Research 4: e011 doi: 10.48130/bpr-0024-0004

Catalog

  • About this article

/

DownLoad:  Full-Size Img  PowerPoint
Return
Return