-
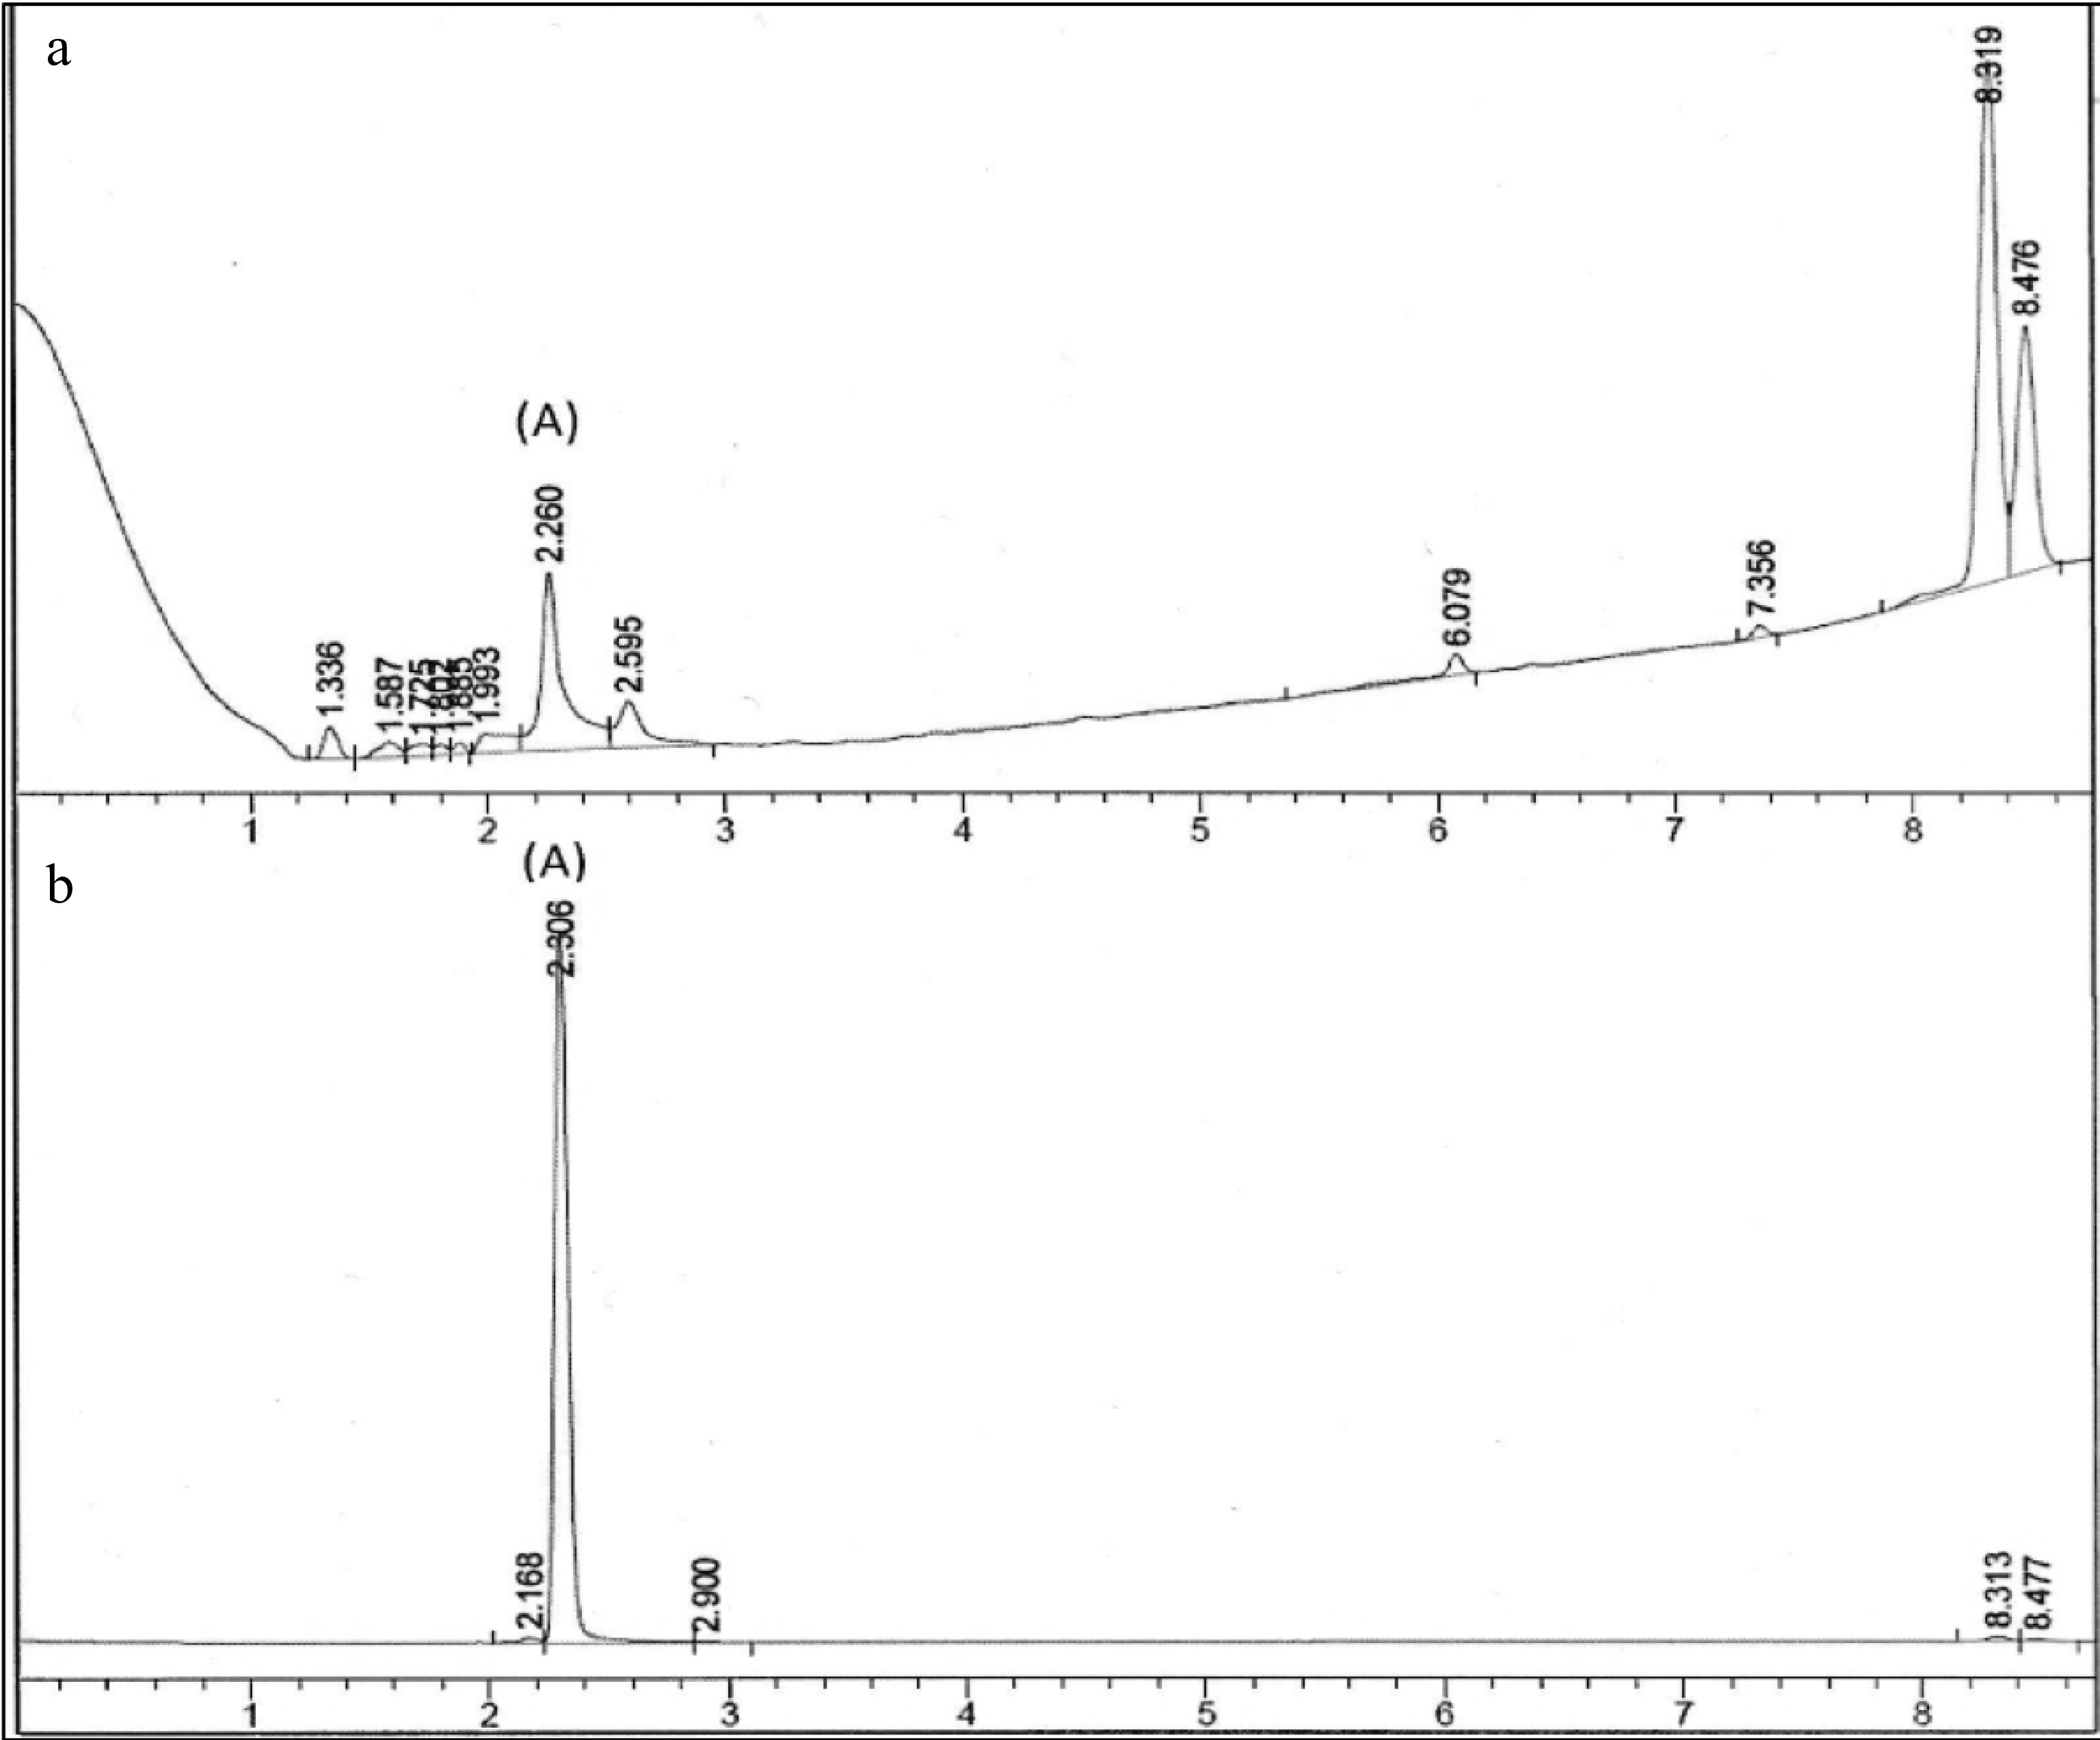
Figure 1.
Chromatographic fingerprint of (a) PE3 and standard marker, (b) gallic acid. Peak A indicated the presence of gallic acid.
-
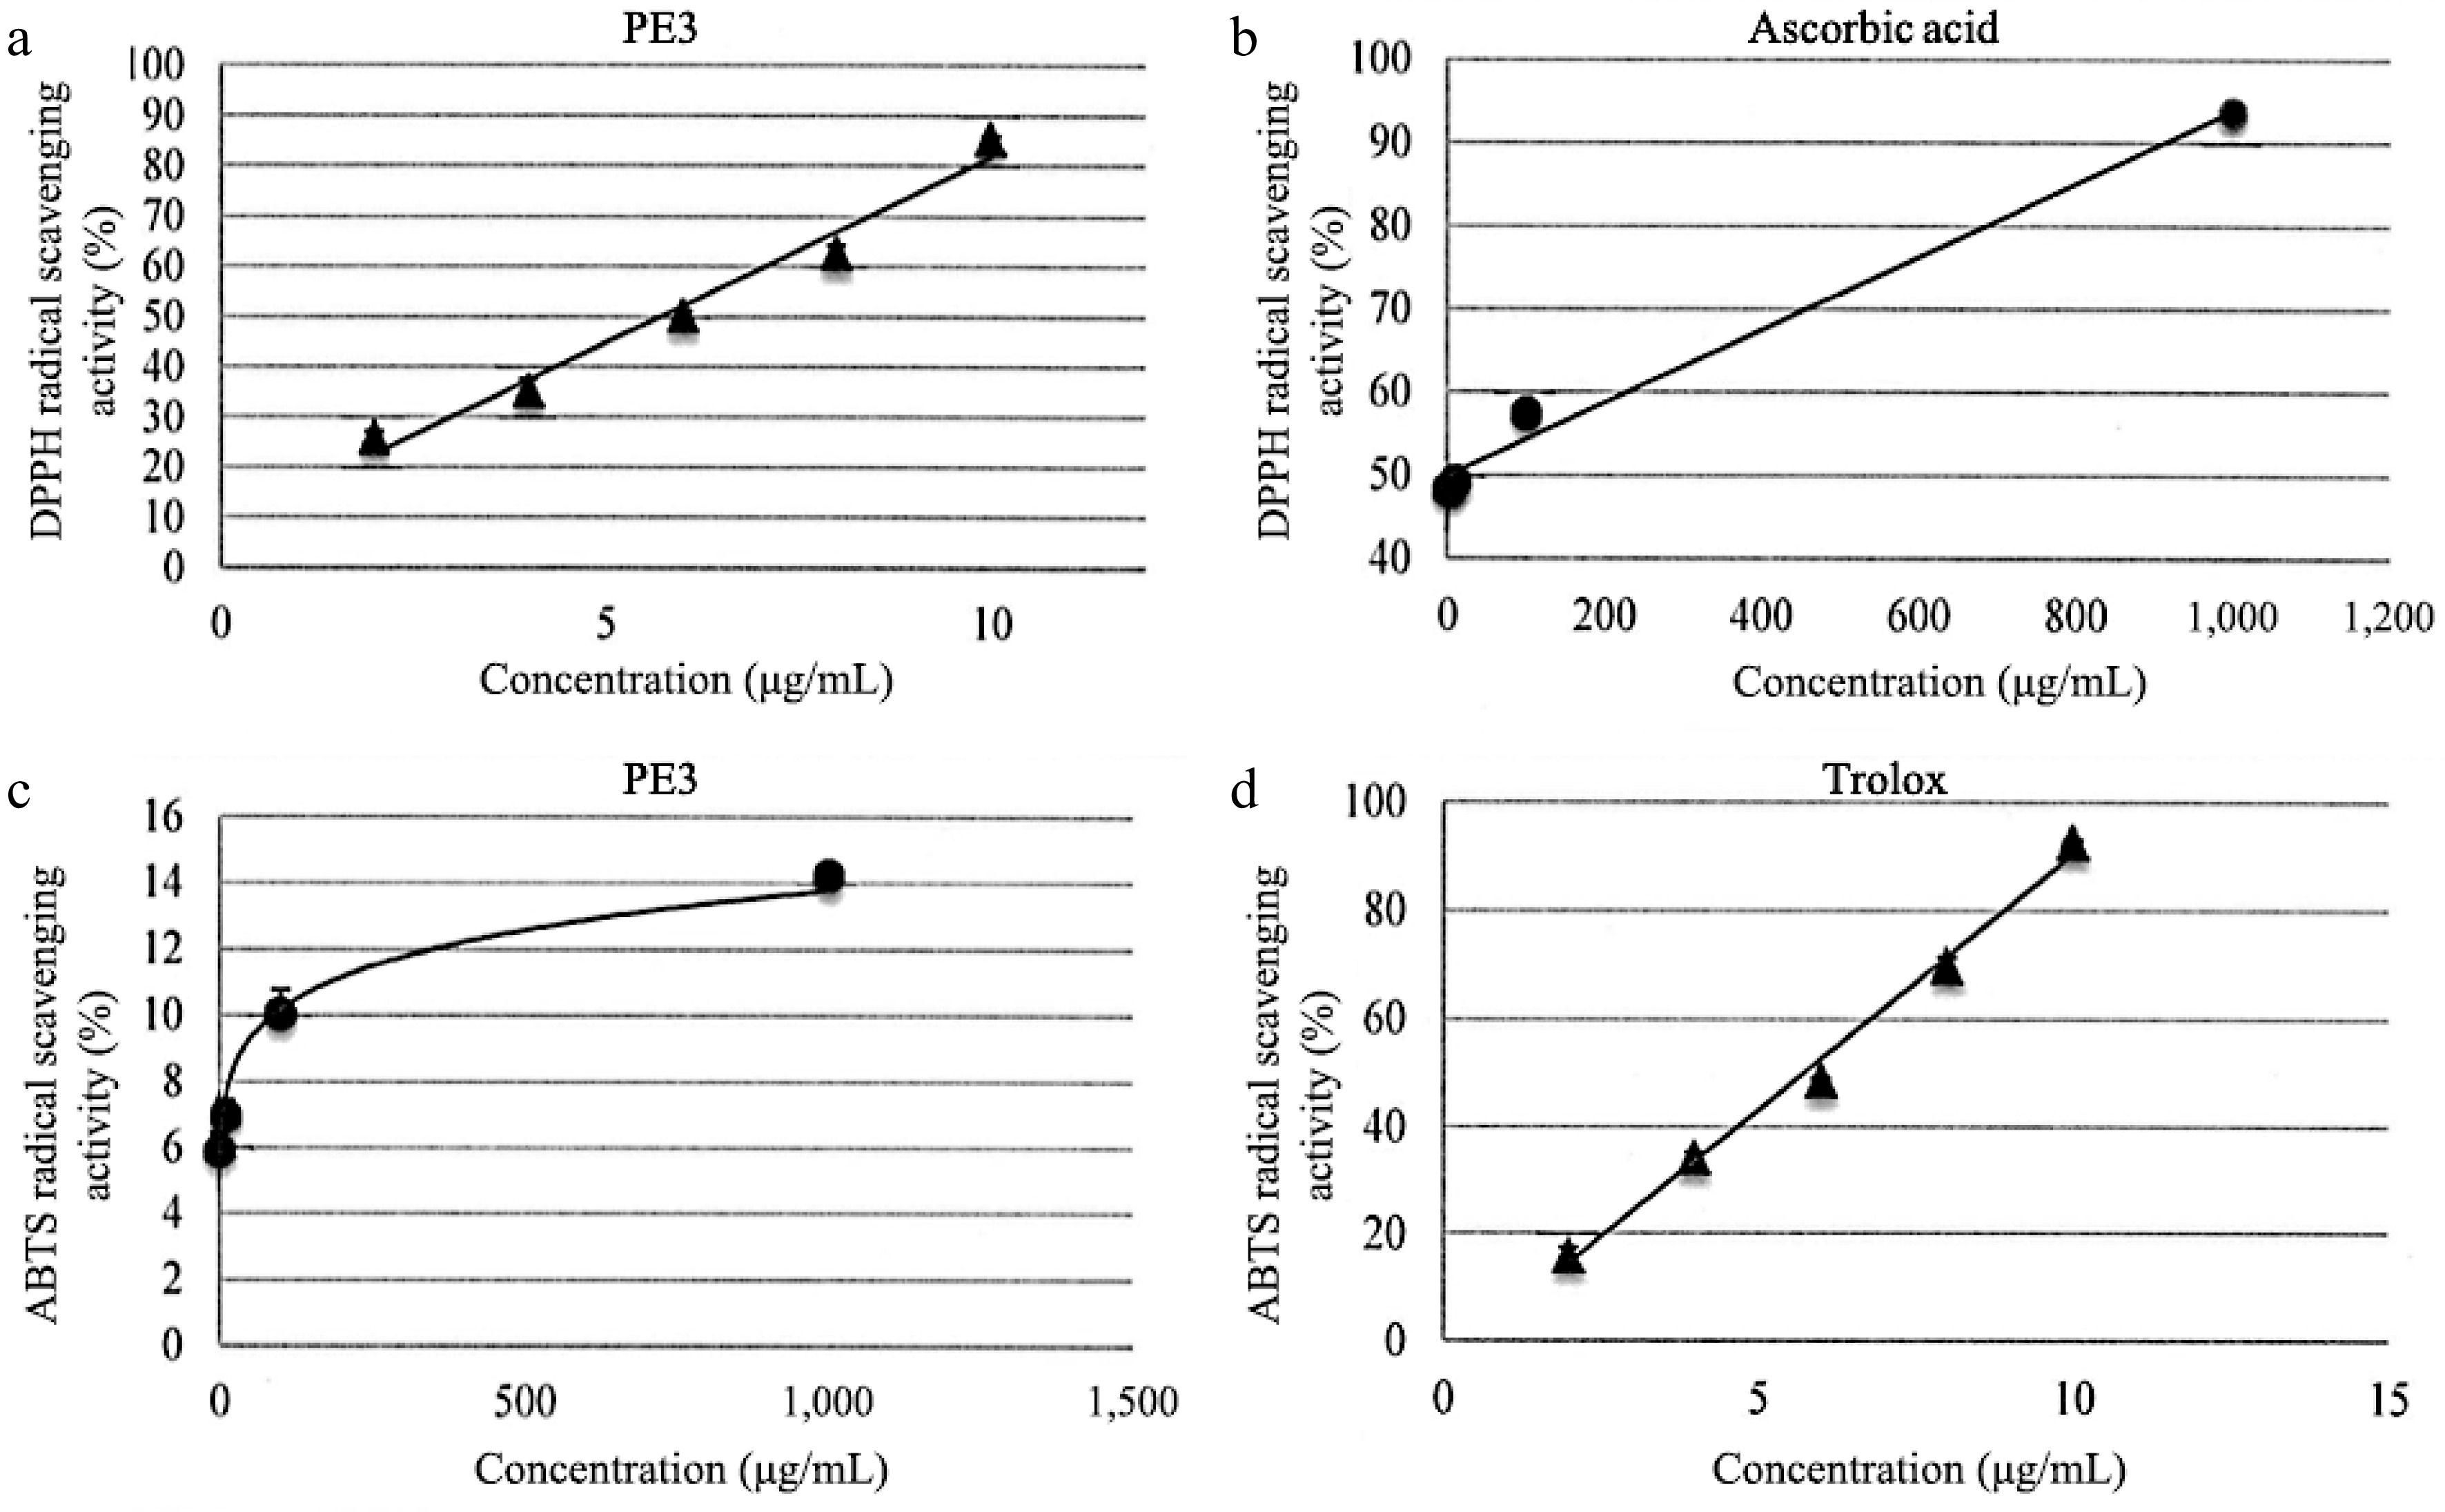
Figure 2.
DPPH scavenging activity of (a) PE3 extract and the standard, (b) ascorbic acid. ABTS scavenging activity of (c) PE3 extract and the standard, (d) Trolox. All values represent mean ± standard deviation.
-
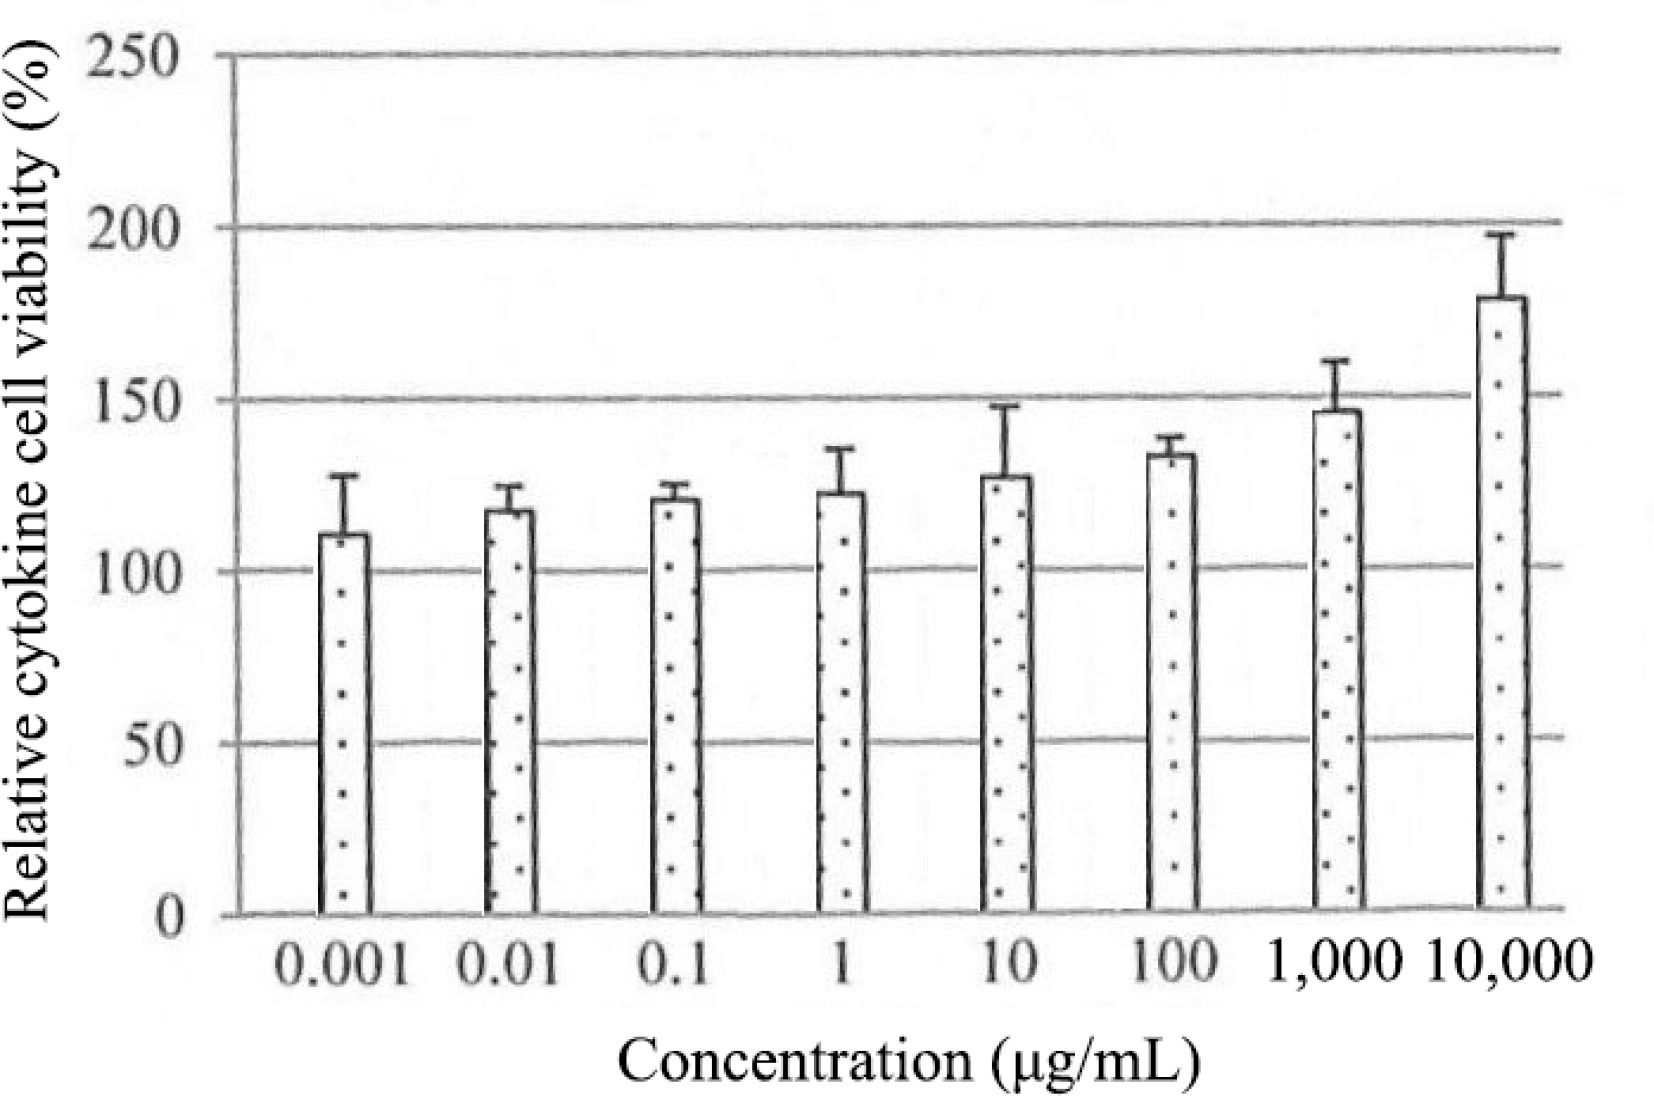
Figure 3.
Effect of PE3 extract on EGF secretion of HSF1184 cell within 24 h. Results are expressed as mean ± standard deviation.
-
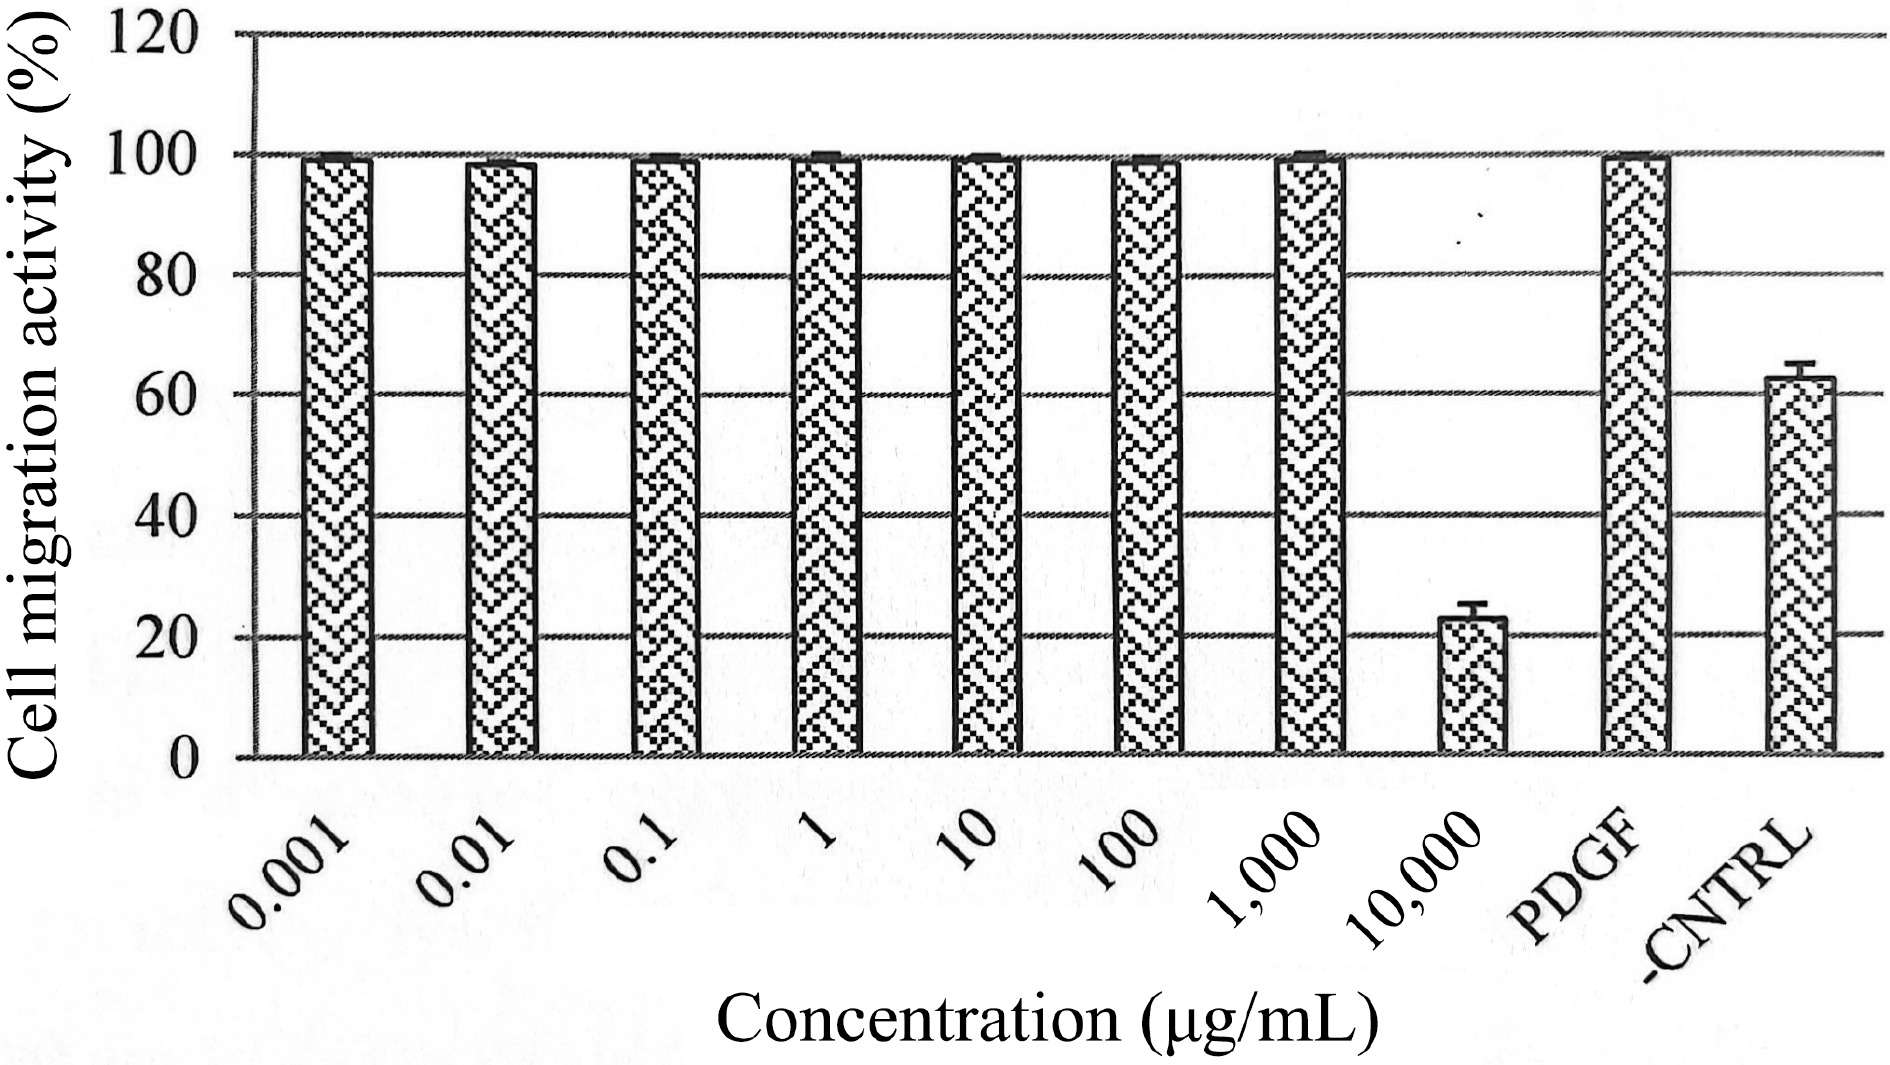
Figure 4.
Effects of PE3 extract at different concentrations on HSF1184 cell migration. Results are expressed as mean ± standard deviation.
-
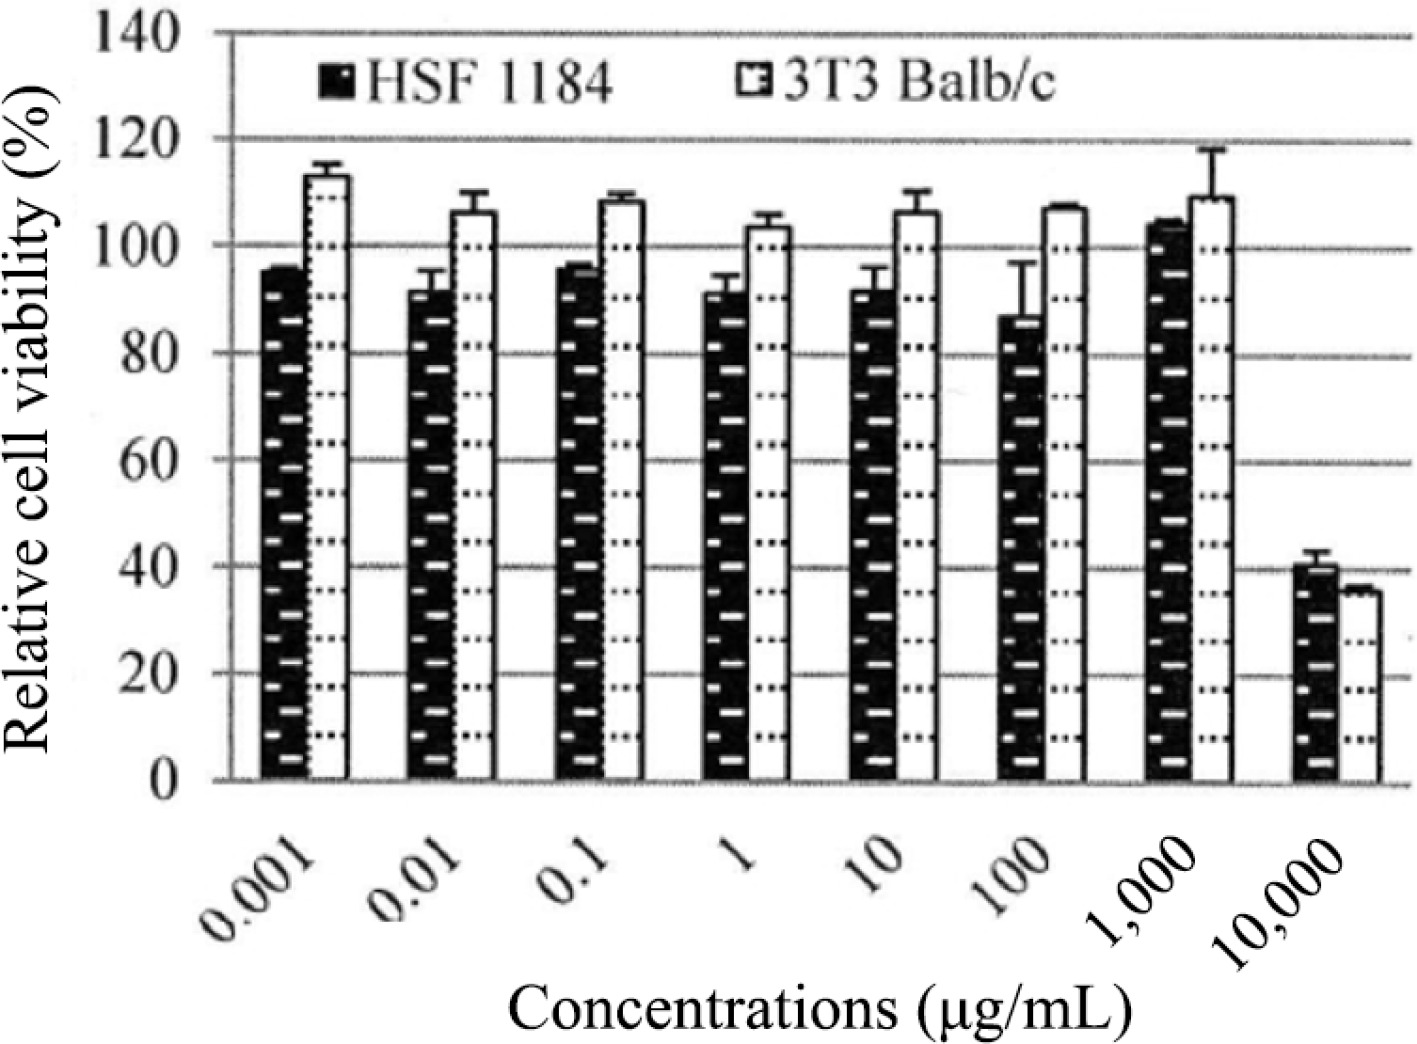
Figure 5.
Relative cell viability of HSF1184 and BALB/c 3T3 cell lines exposed to PE3 extract at various concentrations. Results are expressed as mean ± standard deviation.
-
Parameter Values (per 100 g) Protein, % (w/w) ND Calories, kcal/100 g 5.0 Carbohydrate, % (w/w) 7.0 Saturated fat, % (w/w) ND pH 4.45 Taste Bitter and sour Colour Brown Moisture, % (w/w) 92.4 Ash, % (w/w) 0.6 Dietary fibre (g) 0 Total sugar (g) 12.6 Vitamin C (mg) 0 Vitamin D (μg) 0 Calcium (mg) 11.0 Iron (mg) 3.0 Sodium (mg) 46.0 Potassium (mg) 58.0 ND = Not detected. Table 1.
The proximate and nutritional analysis of PE3 extract.
-
Assays Values Gallic acid content (mg/g) 11.22 ± 0.07 DPPH (IC50 μg/mL) 148.60 ± 1.52 ABTS (IC50 μg/mL) 91.18 ± 1.15 Tyrosinase assay (IC50 μg/mL) 160.20 ± 1.81 Elastase assay (IC50 μg/mL) 65.49 ± 0.38 All values represent the mean ± standard deviation of three replicates analyses. Table 2.
Antioxidant activity, elastase assay and tyrosinase assay of PE3 extract.
Figures
(5)
Tables
(2)