2024 Volume 4
Article Contents
About this article
ARTICLE   Open Access    

Proliv Essence-3 (PE3): a nutricosmetic botanical blend as a dietary beverage for skin wellness and general health

More Information
  • A natural product-based dietary approach could offer a safe and effective method for slowing down or preventing age-related deterioration in skin appearance and function, including issues like hyperpigmentation, dryness and wrinkles. Proliv Essence-3 (PE3) is a botanical beverage, meant for oral consumption with a unique formulation of three selected fruit extracts, Momordica charantia, Malus domestica, and Psidium guajava. Its purpose is to enhance both skin health and overall well-being from within. Proximate composition, presence of gallic acid and antioxidant activity of PE3 extract were determined. Elastase and tyrosinase inhibition assays were employed to investigate the anti-aging and whitening effects, respectively. The in vitro scratch assay and epidermal growth factor (EGF) assay were carried out to evaluate skin cell growth promotion and rejuvenation. The cytotoxicity analysis was carried out via neutral red uptake. The proximate analysis revealed that the product had a high moisture content and low amounts of calories. High-performance liquid chromatography (HPLC) analysis estimated 11.22 mg of gallic acid in 1 g of PE3 extract. PE3 exhibited a DPPH-IC50 value of 148.60 ± 1.52 μg/mL and an ABTS-IC50 value of 91.18 ± 1.15 μg/mL. The IC50 values for tyrosinase and elastase inhibition assays were 160.20 ± 1.81 μg/mL and 65.49 ± 0.38 μg/mL, respectively. PE3 was also discovered to be non-cytotoxic, and it enhanced the migration and proliferation of HSF1184 cells. EGF secretion was detected in PE3-treated HSF1184. This study provided preliminary evidence supporting the potential of PE3 as a nutricosmetical botanical beverage for promoting skin beautification and general health.
  • Columnar cacti are plants of the Cactaceae family distributed across arid and semi-arid regions of America, with ecological, economic, and cultural value[1]. One trait that makes it possible for the columnar cactus to survive in the desert ecosystem is its thick epidermis covered by a hydrophobic cuticle, which limits water loss in dry conditions[1]. The cuticle is the external layer that covers the non-woody aerial organs of land plants. The careful control of cuticle biosynthesis could produce drought stress tolerance in relevant crop plants[2]. In fleshy fruits, the cuticle maintains adequate water content during fruit development on the plant and reduces water loss in fruit during postharvest[3]. Efforts to elucidate the molecular pathway of cuticle biosynthesis have been carried out for fleshy fruits such as tomato (Solanum lycopersicum)[4], apple (Malus domestica)[5], sweet cherry (Prunus avium)[6], mango (Mangifera indica)[7], and pear (Pyrus 'Yuluxiang')[8].

    The plant cuticle is formed by the two main layers cutin and cuticular waxes[3]. Cutin is composed mainly of oxygenated long-chain (LC) fatty acids (FA), which are synthesized by cytochrome p450 (CYP) enzymes. CYP family 86 subfamily A (CYP86A) enzymes carry out the terminal (ω) oxidation of LC-FA[9]. Then, CYP77A carries out the mid-chain oxidation to synthesize the main cutin monomers. In Arabidopsis, AtCYP77A4 and AtCYP77A6 carry out the synthesis of mid-chain epoxy and mid-chain dihydroxy LC-FA, respectively[10,11]. AtCYP77A6 is required for the cutin biosynthesis and the correct formation of floral surfaces[10]. The expression of CYP77A19 (KF410855) and CYP77A20 (KF410856) from potato (Solanum tuberosum) restored the petal cuticular impermeability in Arabidopsis null mutant cyp77a6-1, tentatively by the synthesis of cutin monomers[12]. In eggplant (Solanum torvum), the over-expression of StoCYP77A2 leads to resistance to Verticillium dahlia infection in tobacco plants[13]. Although the function of CYP77A2 in cutin biosynthesis has not yet been tested, gene expression analysis suggests that CaCYP77A2 (A0A1U8GYB0) could play a role in cutin biosynthesis during pepper fruit development[14].

    It has been hypothesized that the export of cuticle precursors is carried out by ATP binding cassette subfamily G (ABCG) transporters. ABCG11/WBC11, ABCG12, and ABCG13 are required for the load of cuticle lipids in Arabidopsis[1517], but ABCG13 function appears to be specific to the flower epidermis[18]. The overexpression of TsABCG11 (JQ389853) from Thellungiella salsugineum increases cuticle amounts and promotes tolerance to different abiotic stresses in Arabidopsis[19].

    Once exported, the cutin monomers are polymerized on the surface of epidermal cells. CD1 code for a Gly-Asp-Ser-Leu motif lipase/esterase (GDSL) from tomato required for the cutin formation through 2-mono(10,16-dihydroxyhexadecanoyl)glycerol esterification[20]. GDSL1 from tomato carries out the ester bond cross-links of cutin monomers located at the cuticle layers and is required for cuticle deposition in tomato fruits[21]. It has been shown that the transcription factor MIXTA-like reduces water loss in tomato fruits through the positive regulation of the expression of CYP77A2, ABCG11, and GDSL1[22]. Despite the relevant role of cuticles in maintaining cactus homeostasis in desert environments[1], the molecular mechanism of cuticle biosynthesis has yet to be described for cactus fruits.

    Stenocereus thurberi is a columnar cactus endemic from the Sonoran desert (Mexico), which produces an ovoid-globose fleshy fruit named sweet pitaya[23]. In its mature state, the pulp of sweet pitaya contains around 86% water with a high content of antioxidants and natural pigments such as betalains and phenolic compounds, which have nutraceutical and industrial relevance[23]. Due to the arid environment in which pitaya fruit grows, studying its molecular mechanism of cuticle biosynthesis can generate new insights into understanding species' adaptation mechanisms to arid environments. Nevertheless, sequences of transcripts from S. thurberi in public databases are scarce.

    RNA-sequencing technology (RNA-seq) allows the massive generation of almost all the transcripts from non-model plants, even if no complete assembled genome is available[24]. Recent advances in bioinformatic tools has improved our capacity to identify long non-coding RNA (lncRNA), which have been showed to play regulatory roles in relevant biological processes, such as the regulation of drought stress tolerance in plants[25], fruit development, and ripening[2629].

    In this study, RNA-seq data were obtained for the de novo assembly and characterization of the S. thurberi fruit peel transcriptome. As a first approach, three transcripts, StCYP77A, StABCG11, and StGDSL1, tentatively involved in cuticle biosynthesis, were identified and quantified during sweet pitaya fruit development. Due to no gene expression analysis having been carried out yet for S. thurberi, stably expressed constitutive genes were identified for the first time.

    Sweet pitaya fruits (S. thurberi) without physical damage were hand harvested from plants in a native conditions field located at Carbó, Sonora, México. They were collocated in a cooler containing dry ice and transported immediately to the laboratory. The superficial part of the peels (~1 mm deep) was removed carefully from the fruits using a scalpel. Peel samples from three fruits were pooled according to their tentative stage of development defined by their visual characteristics, frozen in liquid nitrogen, and pulverized to create a single biological replicate. Four samples belonging to four different plants were analyzed. All fruits harvested were close to the ripening stage. Samples named M1 and M2 were turning from green to ripe [~35−40 Days After Flowering (DAF)], whereas samples M3 and M4 were turning from ripe to overripe (~40−45 DAF).

    Total RNA was isolated from the peels through the Hot Borate method[30]. The concentration and purity of RNA were determined in a spectrophotometer Nanodrop 2000 (Thermo Fisher) by measuring the 260/280 and 260/230 absorbance ratios. RNA integrity was evaluated through electrophoresis in agarose gel 1% and a Bioanalyzer 2100 (Agilent). Pure RNA was sequenced in the paired-end mode in an Illumina NextSeq 500 platform at the University of Arizona Genetics Core Facility. Four RNA-seq libraries, each of them from each sample, were obtained, which include a total of 288,199,704 short reads with a length of 150 base pairs (bp). The resulting sequence data can be accessed at the Sequence Read Archive (SRA) repository of the NCBI through the BioProject ID PRJNA1030439. Libraries are named corresponding to the names of samples M1, M2, M3, and M4.

    FastQC software (www.bioinformatics.babraham.ac.uk/projects/fastqc) was used for short reads quality analysis. Short reads with poor quality were trimmed or eliminated by Trimmomatic (www.usadellab.org/cms/?page=trimmomatic) with a trailing and leading of 25, a sliding window of 4:25, and a minimum read length of 80 bp. A total of 243,194,888 reads with at least a 25 quality score on the Phred scale were used to carry out the de novo assembly by Trinity (https://github.com/trinityrnaseq/trinityrnaseq/wiki) with the following parameters: minimal k-mer coverage of 1, normalization of 50, and minimal transcript length of 200 bp.

    Removal of contaminating sequences and ribosomal RNA (rRNA) was carried out through SeqClean. To remove redundancy, transcripts with equal or more than 90% of identity were merged through CD-hit (www.bioinformatics.org/cd-hit/). Alignment and quantification in terms of transcripts per million (TPM) were carried out through Bowtie (https://bowtie-bio.sourceforge.net/index.shtml) and RSEM (https://github.com/deweylab/RSEM), respectively. Transcripts showing a low expression (TPM < 0.01) were discarded. Assembly quality was evaluated by calculating the parameters N50 value, mean transcript length, TransRate score, and completeness. The statistics of the transcriptome were determined by TrinityStats and TransRate (https://hibberdlab.com/transrate/). The transcriptome completeness was determined through a BLASTn alignment (E value < 1 × 10⁻³) by BUSCO (https://busco.ezlab.org/) against the database of conserved orthologous genes from Embryophyte.

    To predict the proteins tentatively coded in the S. thurberi transcriptome, the best homology match of the assembled transcripts was found by alignment to the Swiss-Prot, RefSeq, nr-NCBI, PlantTFDB, iTAK, TAIR, and ITAG databases using the BLAST algorithm with an E value threshold of 1 × 10⁻¹⁰ for the nr-NCBI database and of 1 × 10⁻⁵ for the others[3134]. An additional alignment was carried out to the protein databases of commercial fruits Persea americana, Prunus persica, Fragaria vesca, Citrus cinensis, and Vitis vinifera to proteins of the cactus Opuntia streptacantha, and the transcriptomes of the cactus Hylocereus polyrhizus, Pachycereus pringlei, and Selenicereus undatus. The list of all databases and the database websites of commercial fruits and cactus are provided in Supplementary Tables S1 & S2. The open reading frame (ORF) of the transcripts and the protein sequences tentative coded from the sweet pitaya transcriptome was predicted by TransDecoder (https://github.com/TransDecoder/TransDecoder/wiki), considering a minimal ORF length of 75 amino acids (aa). The search for protein domains was carried out by the InterPro database (www.ebi.ac.uk/interpro). Functional categorization was carried out by Blast2GO based on GO terms and KEGG metabolic pathways[35].

    LncRNA were identified based on the methods reported in previous studies[25,29,36]. Transcripts without homology to any protein from Swiss-Prot, RefSeq, nr-NCBI, PlantTFDB, iTAK, TAIR, ITAG, P. americana, P. persica, F. vesca, C. cinensis, V. vinifera, and O. streptacantha databases, without a predicted ORF longer than 75 aa, and without protein domains in the InterPro database were selected to identify tentative lncRNA.

    Transcripts coding for signal peptide or transmembrane helices were identified by SignalP (https://services.healthtech.dtu.dk/services/SignalP-6.0/) and TMHMM (https://services.healthtech.dtu.dk/services/TMHMM-2.0/), respectively, and discarded. Further, transcripts corresponding to other non-coding RNAs (ribosomal RNA and transfer RNA) were identified through Infernal by using the Rfam database[37] and discarded. The remaining transcripts were analyzed by CPC[38], and CPC2[39] to calculate their coding potential. Transcripts with a coding potential score lower than −1 for CPC and a coding probability lower than 0.1 for CPC2 were considered lncRNA. To characterize the identified lncRNA, the length and abundance of coding and lncRNA were calculated. Bowtie and RSEM were used to align and quantify raw counts, respectively. The edgeR package[40] was used to normalize raw count data in terms of counts per million (CPM) for both coding and lncRNA.

    To obtain the transcript's expression, the aligning of short reads and quantifying of transcripts were carried out through Bowtie and RSEM software, respectively. A differential expression analysis was carried out between the four libraries by edgeR package in R Studio. Only the transcripts with a count equal to or higher than 0.5 in at least one sample were retained for the analysis. Transcripts with log2 Fold Change (log2FC) between +1 and −1 and with a False Discovery Rate (FDR) lower than 0.05 were taken as not differentially expressed (NDE).

    For the identification of the tentative reference genes two strategies were carried out as described below: i) The NDE transcripts were aligned by BLASTn (E value < 1 × 10⁻⁵) to 43 constitutive genes previously reported in fruits from the cactus H. polyrhizus, S. monacanthus, and S. undatus[4143] to identify possible homologous constitutive genes in S. thurberi. Then, the homologous transcripts with the minimal coefficient of variation (CV) were selected; ii) For all the NDE transcripts, the percentile 95 value of the mean CPM and the percentile 5 value of the CV were used as filters to recover the most stably expressed transcripts, based on previous studies[44]. Finally, transcripts to be tested by quantitative reverse transcription polymerase chain reaction (qRT-PCR) were selected based on their homology and tentative biological function.

    The fruit harvesting was carried out as described above. Sweet pitaya fruit takes about 43 d to ripen, therefore, open flowers were tagged, and fruits with 10, 20, 30, 35, and 40 DAF were collected to cover the pitaya fruit development process (Supplementary Fig. S1). The superficial part of the peels (~1 mm deep) was removed carefully from the fruits using a scalpel. Peel samples from three fruits were pooled according to their stage of development defined by their DAF, frozen in liquid nitrogen, and pulverized to create a single biological replicate. One biological replicate consisted of peels from three fruits belonging to the same plant. Two to three biological replicates were evaluated for each developmental stage. Two technical replicates were analyzed for each biological replicate. RNA extraction, quantification, RNA purity, and RNA integrity analysis were carried out as described above.

    cDNA was synthesized from 100 ng of RNA by QuantiTect Reverse Transcription Kit (QIAGEN). Primers were designed using the PrimerQuest™, UNAFold, and OligoAnalyzer™ tools from Integrated DNA Technologies (www.idtdna.com/pages) and following the method proposed by Thornton & Basu[45]. Transcripts quantification was carried out in a QIAquant 96 5 plex according to the PowerUp™ SYBR™ Green Master Mix protocol (Applied Biosystems), with a first denaturation step for 2 min at 95 °C, followed by 40 cycles of denaturation step at 95 °C for 15 s, annealing and extension steps for 30 s at 60 °C.

    The Cycle threshold (Ct) values obtained from the qRT-PCR were analyzed through the algorithms BestKeeper, geNorm, NormFinder, and the delta Ct method[46]. RefFinder (www.ciidirsinaloa.com.mx/RefFinder-master/) was used to integrate the stability results and to find the most stable expressed transcripts in sweet pitaya fruit peel during development. The pairwise variation value (Vn/Vn + 1) was calculated through the geNorm algorithm in R Studio software[47].

    An alignment of 17 reported cuticle biosynthesis genes from model plants were carried out by BLASTx against the predicted proteins from sweet pitaya. Two additional alignments of 17 charaterized cuticle biosynthesis proteins from model plants against the transcripts and predicted proteins of sweet pitaya were carried out by tBLASTn and BLASTp, respectively. An E value threshold of 1 × 10⁻⁵ was used, and the unique best hits were recovered for all three alignments. The sequences of the 17 characterized cuticle biosynthesis genes and proteins from model plants are showed in Supplementary Table S3. The specific parameters and the unique best hits for all the alignments carried out are shown in Supplementary Tables S4S8.

    Cuticle biosynthesis-related transcripts tentatively coding for a cytochrome p450 family 77 subfamily A (CYP77A), a Gly-Asp-Ser-Leu motif lipase/esterase 1 (GDSL1), and an ATP binding cassette transporter subfamily G member 11 (ABCG11) were identified by best bi-directional hit according to the functional annotation described above. Protein-conserved domains, signal peptide, and transmembrane helix were predicted through InterProScan, SignalP 6.0, and TMHMM, respectively. Alignment of the protein sequences to tentative orthologous of other plant species was carried out by the MUSCLE algorithm[48]. A neighbor-joining (NJ) phylogenetic tree with a bootstrap of 1,000 replications was constructed by MEGA11[49].

    Fruit sampling, primer design, RNA extraction, cDNA synthesis, and transcript quantification were performed as described above. Relative expression was calculated according to the 2−ΔΔCᴛ method[50]. The sample corresponding to 10 DAF was used as the calibrator. The transcripts StEF1a, StTUA, StUBQ3, and StEF1a + StTUA were used as normalizer genes.

    Normality was assessed according to the Shapiro-Wilk test. Significant differences in the expression of the cuticle biosynthesis-related transcripts between fruit developmental stages were determined by one-way ANOVA based on a completely randomized sampling design and a Tukey honestly significant difference (HSD) test, considering a p-value < 0.05 as significant. Statistical analysis was carried out through the stats package in R Studio.

    RNA was extracted from the peels of ripe sweet pitaya fruits (S. thurberi) from plants located in the Sonoran Desert, Mexico. Four cDNA libraries were sequenced in an Illumina NextSeq 500 platform at the University of Arizona Genetics Core Facility. A total of 288,199,704 reads with 150 base pairs (bp) in length were sequenced in paired-end mode. After trimming, 243,194,888 (84.38%) cleaned short reads with at least 29 mean quality scores per read in the Phred scale and between 80 to 150 bp in length were obtained to carry out the assembly. After removing contaminating sequences, redundancy, and low-expressed transcripts, the assembly included 174,449 transcripts with an N50 value of 2,110 bp. Table 1 shows the different quality variables of the S. thurberi fruit peel transcriptome. BUSCO score showed that 85.4% are completed transcripts, although out of these, 37.2% were found to be duplicated. The resulting sequence data can be accessed at the SRA repository of the NCBI through the BioProject ID PRJNA1030439.

    Table 1.  Quality metrics of the Stenocereus thurberi fruit peel transcriptome.
    Metric Data
    Total transcripts 174,449
    N50 2,110
    Smallest transcript length (bp) 200
    Largest transcript length (bp) 19,114
    Mean transcript length (bp) 1,198.69
    GC (%) 41.33
    Total assembled bases 209,110,524
    TransRate score 0.05
    BUSCO score (%) C: 85.38 (S:48.22, D:37.16),
    F: 10.69, M: 3.93.
    Values were calculated through the TrinityStats function of Trinity and TransRate software. Completeness analysis was carried out through BUSCO by aligning the transcriptome to the Embryophyte database through BLAST with an E value threshold of 1 × 10⁻³. Complete (C), single (S), duplicated (D), fragmented (F), missing (M).
     | Show Table
    DownLoad: CSV

    A summary of the homology search in the main public protein database for the S. thurberi transcriptome is shown in Supplementary Table S1. From these databases, the higher homologous transcripts were found in RefSeq with 93,993 (53.87 %). Based on the E value distribution, for 41,685 (44%) and 68,853 (49%) of the hits, it was found a strong homology (E value lower than 1 × 10−50) to proteins in the Swiss-Prot and RefSeq databases, respectively (Supplementary Fig. S2a & b). On the other hand, 56,539 (52.34%) and 99,599 (71.11%) of the matches showed a percentage of identity higher than 60% in the Swiss-Prot and RefSeq databases, respectively (Supplementary Fig. S2c & d).

    Figure 1 shows the homology between transcripts from S. thurberi and proteins of commercial fruits, as well as proteins and transcripts of cacti. Transcripts from S. thurberi homologous to proteins from fruits of commercial interest avocado (P. americana), peach (P. persica), strawberry (F. vesca), orange (C. sinensis), and grapefruit (V. vinifera) ranged from 77,285 (44.30%) to 85,421 (48.96%), with 70,802 transcripts homologous to all the five fruit protein databases (Fig. 1a).

    Transcripts homologous to transcripts or proteins from the cactus dragon fruit (H. polyrhizus), prickly pear cactus (O. streptacantha), Mexican giant cardon (P. pringlei), and pitahaya (S. undatus) ranged from 76,238 (43.70%) to 114,933 (65.88%), with 64,009 transcripts homologous to all the four cactus databases (Fig. 1b). Further, out of the total of transcripts, 44,040 transcripts (25.25%) showed homology only to sequences from cactus, but not for model plants Arabidopsis, tomato, or the commercial fruits included in this study (Fig. 1c).

    Figure 1.  Venn diagram of the homology search results against model plants databases, commercial fruits, and cactus. The number in the diagram corresponds to the number of transcripts from S. thurberi homologous to sequences from that plant species. (a) Homologous to sequences from Fragaria vesca (Fa), Persea americana (Pa), Prunus persica (Pp), Vitis vinifera (Vv), and Citrus sinensis (Cs). (b) Homologous to sequences from Opuntia streptacantha (Of), Selenicereus undatus (Su), Hylocereus polyrhizus (Hp), and Pachycereus pringlei (Pap). (c) Homologous to sequences from Solanum lycopersicum (Sl), Arabidopsis thaliana (At), from the commercial fruits (Fa, Pa, Pp, Vv, and Cs), or the cactus included in this study (Of, Su, Hp, and Pap). Homologous searching was carried out by BLAST alignment (E value < 1 × 10⁻⁵). The Venn diagrams were drawn by ggVennDiagram in R Studio.

    A total of 45,970 (26.35%), 58,704 (33.65%), and 48,186 (27.65%) transcripts showed homology to transcription factors, transcriptional regulators, and protein kinases in the PlantTFDB, iTAK-TR, and iTAK-PK databases, respectively (Supplementary Tables S1, S9S11). For the PlantTFDB, the homologous transcripts belong to 57 transcriptional factors (TF) families (Fig. 2 & Supplementary Table S9), from which, the most frequent were the basic-helix-loop-helix (bHLH), myeloblastosis-related (MYB-related), NAM, ATAF, and CUC (NAC), ethylene responsive factor (ERF), and the WRKY domain families (WRKY) (Fig. 2).

    Figure 2.  Transcription factor (TF) families distribution of S. thurberi fruit peel transcriptome. The X-axis indicates the number of transcripts with hits to each TF family. Alignment to the PlantTFDB database by BLASTx was carried out with an E value threshold of 1 × 10⁻⁵. The bar graph was drawn by ggplot2 in R Studio.

    Based on the homology found and the functional domain searches, gene ontology terms (GO) were assigned to 68,559 transcripts (Supplementary Table S12). Figure 3 shows the top 20 GO terms assigned to the S. thurberi transcriptome, corresponding to the Biological Processes (BP) and Molecular Function (MF) categories. For BP, organic substance metabolic processes, primary metabolic processes, and cellular metabolic processes showed a higher number of transcripts (Supplementary Table S13). Further, for MF, organic cyclic compound binding, heterocyclic compound binding, and ion binding were the processes with the higher number of transcripts. S. thurberi transcripts were classified into 142 metabolic pathways from the KEGG database (Supplementary Table S14). The pathways with the higher number of transcripts recorded were pyruvate metabolism, glycerophospholipid metabolism, glycolysis/gluconeogenesis, and citrate cycle. Further, among the top 20 KEEG pathways, the cutin, suberin, and wax biosynthesis include more than 30 transcripts (Fig. 4).

    Figure 3.  Top 20 Gene Ontology (GO) terms assigned to the S. thurberi fruit peel transcriptome. Bars indicate the number of transcripts assigned to each GO term. Assignment of GO terms was carried out by Blast2GO with default parameters. BP and MF mean Biological Processes and Molecular Functions GO categories, respectively. The graph was drawn by ggplot2 in R Studio.
    Figure 4.  Top 20 KEGG metabolic pathways distribution in the S. thurberi fruit peel transcriptome. Bars indicate the number of transcripts assigned to each KEGG pathway. Assignment of KEGG pathways was carried out in the Blast2GO suite. The bar graph was drawn by ggplot2 in R Studio.

    Out of the total of transcripts, 43,391 (24.87%) were classified as lncRNA (Supplementary Tables S15 & S16). Figure 5 shows a comparison of the length (Fig. 5a) and expression (Fig. 5b) of lncRNA and coding RNA. Both length and expression values were higher in coding RNA than in lncRNA. In general, coding RNA ranged from 201 to 18,629 bp with a mean length of 1,507.18, whereas lncRNA ranged from 200 to 5,198 bp with a mean length of 481.51 (Fig. 5a). The higher expression values recorded from coding RNA and lncRNA were 12.83 and 9.45 log2(CPM), respectively (Fig. 5b).

    Figure 5.  Comparison of coding RNA and long non-coding RNA (lncRNA) from S. thurberi transcriptome. (a) Box plot of transcript length distribution. The Y-axis indicates the length of each transcript in base pairs. (b) Box plot of expression levels. The Y-axis indicates the log2 of the count per million of reads (log2(CPM)) recorded for each transcript. Expression levels were calculated by the edgeR package in R studio. (a), (b) The lines inside the boxes indicate the median. The higher and lower box limits represent the 75th and 25th percentiles, respectively. The box plots were drawn by ggplot2 in R Studio.

    To identify the transcripts without significant changes in expression between the four RNA-seq libraries, a differential expression analysis was carried out. Of the total of transcripts, 4,980 were not differentially expressed (NDE) at least in one paired comparison between the libraries (Supplementary Tables S17S20). Mean counts per million of reads (CPM) and coefficient of variation (CV)[44] were calculated for these NDE transcripts. Transcripts with a CV value lower than 0.113, corresponding with the percentile 5 of the CV, and a mean CPM higher than 1,138.06, corresponding with the percentile 95 of the mean CPM were used as filters to identify the most stably expressed transcripts (Supplementary Table S21). Based on its homology and its tentative biological function, five transcripts were selected to be tested as tentative reference genes. Besides, three NDE transcripts homologous to previously identified stable expressed reference genes in other species of cactus fruit[4143] were selected (Supplementary Table S22). Homology metrics for the eight tentative reference genes selected are shown in Supplementary Table S23. The primer sequences used to amplify the transcripts by qRT-PCR and their nucleotide sequence are shown in Supplementary Tables S24 & S25, respectively.

    The amplification specificity of the eight candidate reference genes determined by melting curves analysis is shown in Supplementary Fig. S3. For the eight tentative reference transcripts selected, the cycle threshold (Ct) values were recorded during sweet pitaya fruit development by qRT-PCR (Supplementary Table S26). The Ct values obtained ranged from 16.85 to 30.26 (Fig. 6a). Plastidic ATP/ADP-transporter (StTLC1) showed the highest Ct values with a mean of 27.34 (Supplementary Table S26). Polyubiquitin 3 (StUBQ3) showed the lowest Ct values in all five sweet pitaya fruit developmental stages (Fig. 6a).

    Figure 6.  Expression stability analysis of tentative reference genes. (a) Box plot of cycle threshold (Ct) distribution of candidate reference genes during sweet pitaya fruit development (10, 20, 30, 35, and 40 d after flowering). The black line inside the box indicates the median. The higher and lower box limits represent the 75th and 25th percentiles, respectively. (b) Bar chart of the geometric mean (geomean) of ranking values calculated by RefFinder for each tentative reference gene (X-axis). The lowest values indicate the best reference genes. (c) Bar chart of the pairwise variation analysis and determination of the optimal number of reference genes by the geNorm algorithm. A pairwise variation value lower than 0.15 indicates that the use of Vn/Vn + 1 reference genes is reliable for the accurate normalization of qRT-PCR data. The Ct data used in the analysis were calculated by qRT-PCR in a QIAquant 96 5 plex (QIAGEN) according to the manufacturer's protocol. The box plot and the bar graphs were drawn by ggplot2 and Excel programs, respectively. Abbreviations: Actin 7 (StACT7), alpha-tubulin (StTUA), elongation factor 1-alpha (StEF1a), COP1-interactive protein 1 (StCIP1), plasma membrane ATPase 4 (StPMA4), BEL1-like homeodomain protein 1 (StBLH1), polyubiquitin 3 (StUBQ3), and plastidic ATP/ADP-transporter (StTLC1).

    The best stability values calculated by NormFinder were 0.45, 0.51, 0.97, and 0.99, corresponding to the transcripts elongation factor 1-alpha (StEF1a), alpha-tubulin (StTUA), plastidic ATP/ADP-transporter (StTLC1), and actin 7 (StACT7), respectively (Supplementary Table S27). For BestKeeper, the most stable expressed transcripts were StUBQ3, StTUA, and StEF1a, with values of 0.72, 0.75, and 0.87, respectively. In the case of the delta Ct method[51], the transcripts StEF1a, StTUA, and StTLC1 showed the best stability.

    According to geNorm analysis, the most stable expressed transcripts were StTUA, StEF1a, StUBQ3, and StACT7, with values of 0.74, 0.74, 0.82, and 0.96, respectively. All the pairwise variation values (Vn/Vn + 1) were lower than 0.15, ranging from 0.019 for V2/V3 to 0.01 for V6/V7 (Fig. 6c). The V value of 0.019 obtained for V2/V3 indicates that the use of the best two reference genes StTUA and StEF1a is reliable enough for the accurate normalization of qRT-PCR data, therefore no third reference gene is required[47]. Except for BestKeeper analysis, StEF1a and StTUA were the most stable transcripts for all of the methods carried out in this study (Supplementary Table S27). The comprehensive ranking analysis indicates that StEF1a, followed by StTUA and StUBQ3, are the most stable expressed genes and are stable enough to be used as reference genes in qRT-PCR analysis during sweet pitaya fruit development (Fig. 6b).

    Three cuticle biosynthesis-related transcripts TRINITY_DN17030_c0_g1_i2, TRINITY_DN15394_c0_g1_i1, and TRINITY_DN23528_c1_g1_i1 tentatively coding for the enzymes cytochrome p450 family 77 subfamily A (CYP77A), Gly-Asp-Ser-Leu motif lipase/esterase 1 (GDSL1), and an ATP binding cassette transporter subfamily G member 11 (ABCG11/WBC11), respectively, were identified and quantified. The nucleotide sequence and predicted amino acid sequences of the three transcripts are shown in Supplementary File 1. The best homology match for StCYP77A (TRINITY_DN17030_c0_g1_i2) was for AtCYP77A4 (AT5G04660) from Arabidopsis and SmCYP77A2 (P37124) from eggplant (Solanum melongena) in the TAIR and Swiss-Prot databases, respectively (Supplementary Table S23).

    TransDecoder, InterPro, and TMHMM analysis showed that StCYP77A codes a polypeptide of 518 amino acids (aa) in length that comprises a cytochrome P450 E-class domain (IPR002401) and a transmembrane region (residues 10 to 32). The phylogenetic tree constructed showed that StCYP77A is grouped in a cluster with all the CYP77A2 proteins included in this analysis, being closer to CYP77A2 (XP_010694692) from B. vulgaris and Cgig2_012892 (KAJ8441854) from Carnegiea gigantean (Supplementary Fig. S4).

    StGDSL1 (TRINITY_DN15394_c0_g1_i1) alignment showed that it is homologous to a GDSL esterase/lipase from Arabidopsis (Q9LU14) and tomato (Solyc03g121180) (Supplementary Table S23). TransDecoder, InterPro, and SignalP analysis showed that StGDSL1 codes a polypeptide of 354 aa in length that comprises a GDSL lipase/esterase domain IPR001087 and a signal peptide with a cleavage site between position 25 and 26 (Supplementary Fig. S5).

    Supplementary Figure S6 shows the analysis carried out on the predicted amino acid sequence of StABCG11 (TRINITY_DN23528_c1_g1_i1). The phylogenetic tree constructed shows three clades corresponding to the ABCG13, ABCG12, and ABCG11 protein classes with bootstrap support ranging from 40% to 100% (Supplementary Fig. S6a). StABCG11 is grouped with all the ABCG11 transporters included in this study in a well-separated clade, being closely related to its tentative ortholog from C. gigantean Cgig2_004465 (KAJ8441854). InterPro and TMHMM results showed that the StABCG11 sequence contains an ABC-2 type transporter transmembrane domain (IPR013525; PF01061.27) with six transmembrane helices (Supplementary Fig. S6b).

    The predicted protein sequence of StABCG11 is 710 aa in length, holding the ATP binding domain (IPR003439; PF00005.30) and the P-loop containing nucleoside triphosphate hydrolase domain (IPR043926; PF19055.3) of the ABC transporters of the G family. Multiple sequence alignment shows that the Walker A and B motif sequence and the ABC signature[15] are conserved between the ABCG11 transporters from Arabidopsis, tomato, S. thurberi, and C. gigantean (Supplementary Fig. S6c).

    According to the results of the expression stability analysis (Fig. 6), four normalization strategies were tested to quantify the three cuticle biosynthesis-related transcripts during sweet pitaya fruit development. The four strategies consist of normalizing by StEF1a, StTUA, StUBQ3, or StEF1a+StTUA. Primer sequences used to quantify the transcripts StCYP77A (TRINITY_DN17030_c0_g1_i2), StGDSL1 (TRINITY_DN15394_c0_g1_i1), and StABCG11 (TRINITY_DN23528_c1_g1_i1) by qRT-PCR during sweet pitaya fruit development are shown in Supplementary Table S24.

    The three cuticle biosynthesis-related transcripts showed differences in expression during sweet pitaya fruit development (Supplementary Table S28). The same expression pattern was recorded for the three cuticle biosynthesis transcripts when normalization was carried out by StEF1a, StTUA, StUBQ3, or StEF1a + StTUA (Fig. 7). A higher expression of StCYP77A and StGDSL1 are shown at the 10 and 20 DAF, showing a decrease at 30, 35, and 40 DAF. StABCG11 showed a similar behavior, with a higher expression at 10 and 20 DAF and a reduction at 30 and 35 DAF. Nevertheless, unlike StCYP77A and StGDSL1, a significant increase at 40 DAF, reaching the same expression as compared with 10 DAF, is shown for StABCG11 (Fig. 7).

    Figure 7.  Expression analysis of cuticle biosynthesis-related transcripts StCYP77A, StGDSL1, and StABCG11 during sweet pitaya (Stenocereus thurberi) fruit development. Relative expression was calculated through the 2−ΔΔCᴛ method using elongation factor 1-alpha (StEF1a), alpha-tubulin (StTUA), polyubiquitin 3 (StUBQ3), or StEF1a + StTUA as normalizing genes at 10, 20, 30, 35, and 40 d after flowering (DAF). The Y-axis and error bars represent the mean of the relative expression ± standard error (n = 4−6) for each developmental stage in DAF. The Ct data for the analysis was recorded by qRT-PCR in a QIAquant 96 5 plex (QIAGEN) according to the manufacturer's protocol. The graph line was drawn by ggplot2 in R Studio. Abbreviations: cytochrome p450 family 77 subfamily A (StCYP77A), Gly-Asp-Ser-Leu motif lipase/esterase 1 (StGDSL1), and ATP binding cassette transporter subfamily G member 11 (StABCG11).

    Characteristics of a well-assembled transcriptome include an N50 value closer to 2,000 bp, a high percentage of conserved transcripts completely assembled (> 80%), and a high proportion of reads mapping back to the assembled transcripts[52]. In the present study, the first collection of 174,449 transcripts from S. thurberi fruit peel are reported. The generated transcriptome showed an N50 value of 2,110 bp, a TransRate score of 0.05, and a GC percentage of 41.33 (Table 1), similar to that reported for other de novo plant transcriptome assemblies[53]. According to BUSCO, 85.4% of the orthologous genes from the Embryophyta databases completely matched the S. thurberi transcriptome, and only 3.9% were missing (Table 1). These results show that the S. thurberi transcriptome generated is not fragmented, and it is helpful in predicting the sequence of almost all the transcripts expressed in sweet pitaya fruit peel[24].

    The percentage of transcripts homologous found, E values, and identity distribution (Supplementary Tables S1 & S2; Supplementary Fig. S2) were similar to that reported in the de novo transcriptome assembly for non-model plants and other cactus fruits[4143,54] and further suggests that the transcriptome assembled of S. thurberi peel is robust[52]. Of the total of transcripts, 70,802 were common to all the five commercial fruit protein databases included in this study, which is helpful for the search for conserved orthologous involved in fruit development and ripening (Fig. 2a). A total of 34,513 transcripts (20%) show homology only to sequences in the cactus's databases, but not in the others (Supplementary Tables S1 & S2; Fig. 1c). This could suggest that a significant conservation of sequences among plants of the Cactaceae family exists which most likely are to have a function in this species adaptation to desert ecosystems.

    To infer the biological functionality represented by the S. thurberi fruit peel transcriptome, gene ontology (GO) terms and KEGG pathways were assigned. Of the main metabolic pathways assigned, 'glycerolipid metabolism' and 'cutin, suberine, and wax biosynthesis' suggests an active cuticle biosynthesis in pitaya fruit peel (Fig. 4). In agreement with the above, the main GO terms assigned for the molecular function (MF) category were 'organic cyclic compound binding', 'transmembrane transporter activity', and 'lipid binding' (Fig. 3). For the biological processes (BP) category, the critical GO terms for the present research are 'cellular response to stimulus', 'response to stress', 'anatomical structure development', and 'transmembrane transport', which could suggest the active development of the fruit epidermis and cuticle biosynthesis for protection to stress.

    The most frequent transcription factors (TF) families found in S. thurberi transcriptome were NAC, WRKY, bHLH, ERF, and MYB-related (Fig. 2), which had been reported to play a function in the tolerance to abiotic stress in plants[55,56]. Although the role of NAC, WRKY, bHLH, ERF, and MYB TF in improving drought tolerance in relevant crop plants has been widely documented[57,58], their contribution to the adaptation of cactus to arid ecosystems has not yet been elucidated and further experimental pieces of evidence are needed.

    It has been reported that the heterologous expression of ERF TF from Medicago truncatula induces drought tolerance and cuticle wax biosynthesis in Arabidopsis leaf[59]. In tomato fruits, the gene SlMIXTA-like which encodes a MYB transcription factor avoids water loss through the positive regulation of genes related to the biosynthesis and transport of cuticle compounds[22]. Despite the relevant role of cuticles in maintaining cactus physiology in desert environments, experimental evidence showing the role of the different TF-inducing cuticle biosynthesis has yet to be reported for cactus fruits.

    Out of the transcripts, 43,391 were classified as lncRNA (Supplementary Tables S15 & S16). This is the first report of lncRNA identification for the species S. thurberi. In fruits, 3,679 lncRNA has been identified from tomato[26], 3,330 from peach (P. persica)[29], 3,857 from melon (Cucumis melo)[28], 2,505 from hot pepper (Capsicum annuum)[27], and 3,194 from pomegranate (Punica granatum)[36]. Despite the stringent criteria to classify the lncRNA of sweet pitaya fruit (S. thurberi), a higher number of lncRNAs are shown when compared with previous reports. This finding is most likely due to the higher level of redundancy found during the transcriptome analysis. To reduce this redundancy, further efforts to achieve the complete genome assembly of S. thurberi are needed.

    Previous studies showed that lncRNA is shorter and has lower expression levels than coding RNA[6062]. In agreement with those findings, both the length and expression values of lncRNA from S. thurberi were lower than coding RNA (Fig. 5). It has been suggested that lncRNA could be involved in the biosynthesis of cuticle components in cabbage[61] and pomegranate[36] and that they could be involved in the tolerance to water deficit through the regulation of cuticle biosynthesis in wild banana[60]. Nevertheless, the molecular mechanism by which lncRNA may regulate the cuticle biosynthesis in S. thurberi fruits has not yet been elucidated.

    A relatively constant level of expression characterizes housekeeping genes because they are involved in essential cellular functions. These genes are not induced under specific conditions such as biotic or abiotic stress. Because of this, they are very useful as internal reference genes for qRT-PCR data normalization[63]. Nevertheless, their expression could change depending on plant species, developmental stages, and experimental conditions[64]. Reliable reference genes for a specific experiment in a given species must be identified to carry out an accurate qRT-PCR data normalization[63]. An initial screening of the transcript expression pattern through RNA-seq improves the identification of stably expressed transcripts by qRT-PCR[44,64].

    Identification of stable expressed reference transcripts during fruit development has been carried out in blueberry (Vaccinium bracteatum)[65], kiwifruit (Actinidia chinensis)[66], peach (P. persica)[67], apple (Malus domestica)[68], and soursop (Annona muricata)[69]. These studies include the expression stability analysis through geNorm, NormFinder, and BestKeeper algorithms[68,69], some of which are supported in RNA-seq data[65,66]. Improvement of expression stability analysis by RNA-seq had led to the identification of non-previously reported reference genes with a more stable expression during fruit development than commonly known housekeeping genes in grapevine (V. vinifera)[44], pear (Pyrus pyrifolia and P. calleryana)[64], and pepper (C. annuum)[70].

    For fruits of the Cactaceae family, only a few studies identifying reliable reference genes have been reported[4143]. Mainly because gene expression analysis has not been carried out previously for sweet pitaya (S. thurberi), the RNA-seq data generated in this work along with geNorm, NormFinder, BestKeeper, and RefFinder algorithms were used to identify reliable reference genes. The comprehensive ranking analysis showed that out of the eight candidate genes tested, StEF1a followed by StTUA and StUBQ3 were the most stable (Fig. 6b). All the pairwise variation values (Vn/Vn + 1) were lower than 0.15 (Fig. 6c), which indicates that StEF1a, StTUA, and StUBQ3 alone or the use of StEF1a and StTUA together are reliable enough to normalize the gene expression data generated by qRT-PCR.

    The genes StEF1a, StTUA, and StUBQ3 are homologous to transcripts found in the cactus species known as dragonfruit (Hylocereus monacanthus and H. undatus)[41], which have been tested as tentative reference genes during fruit development. EF1a has been proposed as a reliable reference gene in the analysis of changes in gene expression of dragon fruit (H. monacanthus and H. undatus)[41], peach (P. persica)[67], apple (M. domestica)[68], and soursop (A. muricata)[69]. According to the expression stability analysis carried out in the present study (Fig. 6) four normalization strategies were designed. The same gene expression pattern was recorded for the three target transcripts evaluated when normalization was carried out by the genes StEF1a, StTUA, StUBQ3, or StEF1a + StTUA (Fig. 7). Further, these data indicates that these reference genes are reliable enough to be used in qRT-PCR experiments during fruit development of S. thurberi.

    The plant cuticle is formed by two main layers: the cutin, composed mainly of mid-chain oxygenated LC fatty acids, and the cuticular wax, composed mainly of very long-chain (VLC) fatty acids, and their derivates VLC alkanes, VLC primary alcohols, VLC ketones, VLC aldehydes, and VLC esters[3]. In Arabidopsis CYP77A4 and CYP77A6 catalyze the synthesis of midchain epoxy and hydroxy ω-OH long-chain fatty acids, respectively[10,11], which are the main components of fleshy fruit cuticle[3].

    The functional domain search carried out in the present study showed that StCYP77A comprises a cytochrome P450 E-class domain (IPR002401) and a membrane-spanning region from residues 10 to 32 (Supplementary Fig. S4). This membrane-spanning region has been previously characterized in CYP77A enzymes from A. thaliana and Brassica napus[11,71]. It suggests that the protein coded by StCYP77A could catalyze the oxidation of fatty acids embedded in the endoplasmic reticulum membrane of the epidermal cells of S. thurberi fruit. Phylogenetic analysis showed that StCYP77A was closer to proteins from its phylogenetic-related species B. vulgaris (BvCYP772; XP_010694692) and C. gigantea (Cgig2_012892) (Supplementary Fig. S4). StCYP77A, BvCYP77A2, and Cgig2_012892 were closer to SlCYP77A2 and SmCYP77A2 than to CYP77A4 and CYP77A6 proteins, suggesting that StCYP77A (TRINITY_DN17030_c0_g1_i2) could correspond to a CYP77A2 protein.

    Five CYP77A are present in the Arabidopsis genome, named CYP77A4, CYP77A5, CYP77A6, CYP77A7, and CYP77A9, but their role in cuticle biosynthesis has only been reported for CYP77A4 and CYP77A6[72]. It has been suggested that CYP77A2 from eggplant (S. torvum) could contribute to the defense against fungal phytopathogen infection by the synthesis of specific compounds[13]. In pepper fruit (C. annuum), the expression pattern of CYP77A2 (A0A1U8GYB0) and ABCG11 (LOC107862760) suggests a role of CYP77A2 and ABCG11 in cutin biosynthesis at the early stages of pepper fruit development[14].

    In the case of the protein encoded by StGDSL1 (354 aa), the length found in this work is similar to the length of its homologous from Arabidopsis (AT3G16370) and tomato (Solyc03g121180) (Supplementary Fig. S5). A GDSL1 protein named CD1 polymerizes midchain oxygenated ω-OH long-chain fatty acids to form the cutin polyester in the extracellular space of tomato fruit peel[20,21]. It has been suggested that the 25-amino acid N-signal peptide found in StGDSL1 (Supplementary Fig. S5), previously reported in GDSL1 from Arabidopsis, B. napus, and tomato, plays a role during the protein exportation to the extracellular space[21,73].

    A higher expression of StCYP77A, StGDSL1, and StABCG11 is shown at the 10 and 20 DAF of sweet pitaya fruit development (Fig. 7), suggesting the active cuticle biosynthesis at the early stages of sweet pitaya fruit development. In agreement with that, two genes coding for GDSL lipase/hydrolases from tomato named SGN-U583101 and SGN-U579520 are highly expressed in the early stages and during the expansion stages of tomato fruit development, but their expression decreases in later stages[74]. It has been shown that the expression of GDSL genes, like CD1 from tomato, is higher in growing fruit[20,21]. Like tomato, the increase in expression of StCYP77A and StGDSL1 shown in pitaya fruit development could be due to an increase in cuticle deposition during the expansion of the fruit epidermis[20].

    The phylogenetic analysis, the functional domains, and the six transmembrane helices found in the StABCG11 predicted protein (Supplementary Fig. S6), suggests that it is an ABCG plasma membrane transporter of sweet pitaya[15]. Indeed, an increased expression of StABCG11 at 40 DAF was recorded in the present study (Fig. 7). Further, this data strongly suggests that it could be playing a relevant role in the transport of cuticle components at the beginning and during sweet pitaya fruit ripening.

    In Arabidopsis, ABCG11 (WBC11) exports cuticular wax and cutin compounds from the plasma membrane[15,75]. It has been reported that a high expression of the ABC plasma membrane transporter from mango MiWBC11 correlates with a higher cuticle deposition during fruit development[7]. The expression pattern for StABCG11, StCYP77A, and StGDSL1 suggests a role of StABCG11 as a cutin compound transporter in the earlier stages of sweet pitaya fruit development (Fig. 7). Further, its increase at 40 DAF suggests that it could be transporting cuticle compounds other than oxygenated long-chain fatty acids, or long-chain fatty acids that are not synthesized by StCYP77A and StGDSL1 in the later stages of fruit development.

    Like sweet pitaya, during sweet cherry fruit (Prunus avium) development, the expression of PaWCB11, homologous to AtABCG11 (AT1G17840), increases at the earlier stages of fruit development decreases at the intermediate stages, and increases again at the later stages[76]. PaWCB11 expression correlated with cuticle membrane deposition at the earlier and intermediate stages of sweet cherry fruit development but not at the later[76]. The increased expression of StABCG11 found in the present study could be due to the increased transport of cuticular wax compounds, such as VLC fatty acids and their derivates, in the later stages of sweet pitaya development[15,75].

    Cuticular waxes make up the smallest amount of the fruit cuticle. Even so, they mainly contribute to the impermeability of the fruit's epidermis[3]. An increase in the transport of cuticular waxes at the beginning of the ripening stage carried out by ABCG transporters could be due to a greater need to avoid water loss and to maintain an adequate amount of water during the ripening of the sweet pitaya fruit. Nevertheless, further expression analysis of cuticular wax biosynthesis-related genes, complemented with chemical composition analysis of cuticles could contribute to elucidating the molecular mechanism of cuticle biosynthesis in cacti and their physiological contribution during fruit development.

    In this study, the transcriptome of the sweet pitaya (S. thurberi) fruit peel was assembled for the first time. The reference genes found here are a helpful tool for further gene expression analysis in sweet pitaya fruit. Transcripts tentatively involved in cuticle compound biosynthesis and transport are reported for the first time in sweet pitaya. The results suggest a relevant role of cuticle compound biosynthesis and transport at the early and later stages of fruit development. The information generated will help to improve the elucidation of the molecular mechanism of cuticle biosynthesis in S. thurberi and other cactus species in the future. Understanding the cuticle's physiological function in the adaptation of the Cactaceae family to harsh environmental conditions could help design strategies to increase the resistance of other species to face the increase in water scarcity for agricultural production predicted for the following years.

    The authors confirm contribution to the paper as follows: study conception and design: Tiznado-Hernández ME, Tafolla-Arellano JC, García-Coronado H, Hernández-Oñate MÁ; data collection: Tiznado-Hernández ME, Tafolla-Arellano JC, García-Coronado H, Hernández-Oñate MÁ; analysis and interpretation of results: Tiznado-Hernández ME, García-Coronado H, Hernández-Oñate MÁ, Burgara-Estrella AJ; draft manuscript preparation: Tiznado-Hernández ME, García-Coronado H. All authors reviewed the results and approved the final version of the manuscript.

    All data generated or analyzed during this study are included in this published article and its supplementary information files. The sequence data can be accessed at the Sequence Read Archive (SRA) repository of the NCBI through the BioProject ID PRJNA1030439.

    The authors wish to acknowledge the financial support of Consejo Nacional de Humanidades, Ciencias y Tecnologías de México (CONAHCYT) through project number 579: Elucidación del Mecanismo Molecular de Biosíntesis de Cutícula Utilizando como Modelo Frutas Tropicales. We appreciate the University of Arizona Genetics Core and Illumina for providing reagents and equipment for library sequencing. The author, Heriberto García-Coronado (CVU 490952), thanks the CONAHCYT (acronym in Spanish) for the Ph.D. scholarship assigned (749341). The author, Heriberto García-Coronado, thanks Dr. Edmundo Domínguez-Rosas for the technical support in bioinformatics for identifying long non-coding RNA.

  • The authors declare that they have no conflict of interest.

  • [1]

    Martin KI, Glaser DA. 2011. Cosmeceuticals: the new medicine of beauty. Missouri Medicine 108(1):60−63

    Google Scholar

    [2]

    Mishra AP, Saklani S, Milella L, Tiwari P. 2014. Formulation and evaluation of herbal antioxidant face cream of Nardostachys jatamansi collected from Indian Himalayan region. Asian Pacific Journal of Tropical Biomedicine 4:S679−S682

    doi: 10.12980/apjtb.4.2014apjtb-2014-0223

    CrossRef   Google Scholar

    [3]

    Joseph B, Jini D. 2013. Antidiabetic effects of Momordica charantia (bitter melon) and its medicinal potency. Asian Pacific Journal of Tropical Disease 3(2):93−102

    doi: 10.1016/s2222-1808(13)60052-3

    CrossRef   Google Scholar

    [4]

    Daswani PG, Gholkar MS, Birdi TJ. 2017. Psidium guajava: A single plant for multiple health problems of rural Indian population. Pharmacognosy Reviews 11(22):167−74

    doi: 10.4103/phrev.phrev_17_17

    CrossRef   Google Scholar

    [5]

    Patocka J, Bhardwaj K, Klimova B, Nepovimova E, Wu Q, et al. 2020. Malus domestica: A Review on Nutritional Features, Chemical Composition, Traditional and Medicinal Value. Plants 9(11):1408

    doi: 10.3390/plants9111408

    CrossRef   Google Scholar

    [6]

    Akyüz E, Türkoğlu S, Sözgen Başkan K, Tütem E, Apak MR. 2020. Comparison of antioxidant capacities and antioxidant components of commercial bitter melon (Momordica charantia L.) products. Turkish Journal of Chemistry 44(6):1663−73

    doi: 10.3906/kim-2007-67

    CrossRef   Google Scholar

    [7]

    Hiramoto K, Orita K, Yamate Y, Kobayashi H. 2021. Momordica charantia. Ameliorates Atopic Dermatitis by Inhibiting the Expression of Inducible Nitric Oxidase Synthase in NC/Nga Mice. Food and Nutrition Sciences 12(11):1136−51

    doi: 10.4236/fns.2021.1211083

    CrossRef   Google Scholar

    [8]

    Sut S, Zengin G, Maggi F, Malagoli M, Dall'Acqua S. 2019. Triterpene Acid and Phenolics from Ancient Apples of Friuli Venezia Giulia as Nutraceutical Ingredients: LC-MS Study and In Vitro Activities. Molecules 24(6):1109

    doi: 10.3390/molecules24061109

    CrossRef   Google Scholar

    [9]

    Sanz MT, Campos C, Milani M, Foyaca M, Lamy A, et al. 2016. Biorevitalizing effect of a novel facial serum containing apple stem cell extract, pro-collagen lipopeptide, creatine, and urea on skin aging signs. Journal of Cosmetic Dermatology 15(1):24−30

    doi: 10.1111/jocd.12173

    CrossRef   Google Scholar

    [10]

    Angulo-López JE, Flores-Gallegos AC, Torres-León C, Ramírez-Guzmán KN, Martínez GA, et al. 2021. Guava (Psidium guajava L.). Fruit and Valorization of Industrialization By-Products. Processes 9(6):1075

    doi: 10.3390/pr9061075

    CrossRef   Google Scholar

    [11]

    Kumar M, Tomar M, Amarowicz R, Saurabh V, Nair MS, et al. 2021. Guava (Psidium guajava L.) Leaves: Nutritional Composition, Phytochemical Profile, and Health-Promoting Bioactivities. Foods 10(4):752

    doi: 10.3390/foods10040752

    CrossRef   Google Scholar

    [12]

    Naseer S, Hussain S, Naeem N, Pervaiz M, Rahman M. 2018. The phytochemistry and medicinal value of Psidium guajava (guava). Clinical Phytoscience 4:32

    doi: 10.1186/s40816-018-0093-8

    CrossRef   Google Scholar

    [13]

    Aksoy L, Güzey I, Düz M. 2022. Essential oil content, antioxidative characteristics and enzyme inhibitory activity of Sideritis akmanii Aytaç, Ekici & Dönmez. Turkish Journal of Pharmaceutical Sciences 19(1):76−83

    doi: 10.4274/tjps.galenos.2021.86422

    CrossRef   Google Scholar

    [14]

    Abdul Karim N. 2019. Antioxidant properties of stingless bee honey and its effect on the viability of lymphoblastoid cell line. Medicine & Health 14(1):91−105

    doi: 10.17576/mh.2019.1401.08

    CrossRef   Google Scholar

    [15]

    Tripathi IP, Mishra Mahendra KR, Yogesh P, Atul D, Noopa D, et al. 2012. HPLC analysis of methanolic extract of some medicinal plant leaves of Myrtaceae family. Internationale Pharmaceutica Sciencia 2(3):49−53

    Google Scholar

    [16]

    Oh MJ, Abdul Hamid M, Ngadiran S, Seo YK, Sarmidi MR, Park CS. 2010. Ficus deltoidea (Mas cotek) extract exerted anti-melanogenic activity by preventing tyrosinase activity in vitro and by suppressing tyrosinase gene expression in B16F1 melanoma cells. Archives of Dermatological Research 303(3):161−70

    doi: 10.1007/s00403-010-1089-5

    CrossRef   Google Scholar

    [17]

    Era B, Floris S, Sogos V, Porcedda C, Piras A, et al. 2021. Anti-Aging Potential of Extracts from Washingtonia filifera Seeds. Plants 10(1):151

    doi: 10.3390/plants10010151

    CrossRef   Google Scholar

    [18]

    Fronza M, Heinzmann B, Hamburger M, Laufer S, Merfort I. 2009. Determination of the wound healing effect of Calendula extracts using the scratch assay with 3T3 fibroblasts. Journal of Ethnopharmacology 126(3):463−67

    doi: 10.1016/j.jep.2009.09.014

    CrossRef   Google Scholar

    [19]

    Zofia NŁ, Martyna ZD, Aleksandra Z, Tomasz B. 2020. Comparison of the antiaging and protective properties of plants from the Apiaceae Family. Oxidative Medicine and Cellular Longevity 2020:5307614

    doi: 10.1155/2020/5307614

    CrossRef   Google Scholar

    [20]

    Wong TS, Hashim Z, Zulkifli RM, Ismail HF, Zainol SN, et al. 2017. LD50 estimations for diabecineTM polyherbal extracts based on in vitro diabetic models of 3T3-l1, WRL-68 and 1.1B4 cell lines. Chemical Engineering Transactions 56:1567−72

    doi: 10.3303/CET1756262

    CrossRef   Google Scholar

    [21]

    Matabura VV, Kibazohi O. 2021. Physicochemical and sensory evaluation of mixed juices from banana, pineapple and passion fruits during storage. Tanzania Journal of Science 47(1):332−43

    Google Scholar

    [22]

    Nobile V, Schiano I, Germani L, Cestone E, Navarro P, et al. 2023. Skin Anti-Aging Efficacy of a Four-Botanical Blend Dietary Ingredient: A Randomized, Double Blind, Clinical Study. Cosmetics 10(1):16

    doi: 10.3390/cosmetics10010016

    CrossRef   Google Scholar

    [23]

    Lvovskaya S, Smith DP. 2013. A Spoonful of Bitter Helps the Sugar Response Go Down. Neuron 79(4):612−14

    doi: 10.1016/j.neuron.2013.07.038

    CrossRef   Google Scholar

    [24]

    Haftek M, Abdayem R, Guyonnet-Debersac P. 2022. Skin Minerals: Key Roles of Inorganic Elements in Skin Physiological Functions. International Journal of Molecular Sciences 23(11):6267

    doi: 10.3390/ijms23116267

    CrossRef   Google Scholar

    [25]

    Kubola J, Siriamornpun S. 2008. Phenolic contents and antioxidant activities of bitter gourd (Momordica charantia L.) leaf, stem, and fruit fraction extracts in vitro. Food Chemistry 110(4):881−90

    doi: 10.1016/j.foodchem.2008.02.076

    CrossRef   Google Scholar

    [26]

    Du G, Zhu Y, Wang X, Zhang J, Tian C, et al. 2019. Phenolic composition of apple products and by-products based on cold pressing technology. Journal of Food Science and Technology 56(3):1389−97

    doi: 10.1007/s13197-019-03614-y

    CrossRef   Google Scholar

    [27]

    Zhang KQ, Lin LL, Xu HJ. 2022. Research on antioxidant performance of diglucosyl gallic acid and its application in emulsion cosmetics. International Journal of Cosmetic Science 44(2):177−88

    doi: 10.1111/ics.12766

    CrossRef   Google Scholar

    [28]

    Borde VU, Pangrikar PP, Tekale SU. 2011. Gallic Acid in Ayurvedic Herbs and Formulations. Recent Research in Science and Technology 3(7):51−54

    Google Scholar

    [29]

    Meena AK, Narasimhaji CV, Velvizhi D, Singh A, Rekha P, et al. 2018. Determination of Gallic Acid in Ayurvedic Polyherbal Formulation Triphala churna and its ingredients by HPLC and HPTLC. Research Journal of Pharmacy and Technology 11(8):3243

    doi: 10.5958/0974-360x.2018.00596.6

    CrossRef   Google Scholar

    [30]

    BenSaad LA, Kim KH, Quah CC, Kim WR, Shahimi M. 2017. Anti-inflammatory potential of ellagic acid, gallic acid, and punicalagin A&B isolated from Punica granatum. BMC Complementary and Alternative Medicine 17:47

    doi: 10.1186/s12906-017-1555-0

    CrossRef   Google Scholar

    [31]

    Willis S, Verghese M, McCollum M, Cheatom K, Willis Z, et al. 2017. A Comparison of Selected Phytochemical and Antioxidant Potential of Two Tea Beverages. Food and Nutrition Sciences 8(11):1039−49

    doi: 10.4236/fns.2017.811076

    CrossRef   Google Scholar

    [32]

    Fatanah DN, Abdullah N, Hashim N, Abd. Hamid A. 2018. Antioxidant and mutagenic activity of herbal tea prepared from Cosmos caudatus leaves at different maturity stages. Sains Malaysiana 47(4):725−30

    doi: 10.17576/jsm-2018-4704-10

    CrossRef   Google Scholar

    [33]

    Zainol MK, Abd-Hamid A, Yusof S, Muse R. 2003. Antioxidative activity and total phenolic compounds of leaf, root and petiole of four accessions of Centella asiatica (L.) Urban. Food Chemistry 81(4):575−81

    doi: 10.1016/s0308-8146(02)00498-3

    CrossRef   Google Scholar

    [34]

    Masaki H. 2010. Role of antioxidants in the skin: anti-aging effects. Journal of Dermatological Science 58(2):85−90

    doi: 10.1016/j.jdermsci.2010.03.003

    CrossRef   Google Scholar

    [35]

    Zaidi KU, Ali AS, Ali SA, Naaz I. 2014. Microbial tyrosinases: promising enzymes for pharmaceutical, food bioprocessing, and environmental industry. Biochemistry Research International 2014:854687

    doi: 10.1155/2014/854687

    CrossRef   Google Scholar

    [36]

    Limtrakul P, Yodkeeree S, Thippraphan P, Punfa W, Srisomboon J. 2016. Anti-aging and tyrosinase inhibition effects of Cassia fistula flower butanolic extract. BMC Complementary and Alternative Medicine 16:497

    doi: 10.1186/s12906-016-1484-3

    CrossRef   Google Scholar

    [37]

    Baumann L, Bernstein EF, Weiss AS, Bates D, Humphrey S, et al. 2021. Clinical relevance of elastin in the structure and function of skin. Aesthetic Surgery Journal Open Forum 3(3):ojab019

    doi: 10.1093/asjof/ojab019

    CrossRef   Google Scholar

    [38]

    Thring TSA, Hili P, Naughton DP. 2009. Anti-collagenase, anti-elastase and anti-oxidant activities of extracts from 21 plants. BMC Complementary and Alternative Medicine 9:27

    doi: 10.1186/1472-6882-9-27

    CrossRef   Google Scholar

    [39]

    Raphaelli CdeO, Azevedo JG, Pereira EdosS, Vinholes JR, Camargo TM, et al. 2021. Phenolic-rich apple extracts have photoprotective and anti-cancer effect in dermal cells. Phytomedicine Plus 1(4):100112

    doi: 10.1016/j.phyplu.2021.100112

    CrossRef   Google Scholar

    [40]

    Ahmad Z, Sarmidi MR, Hasham R. 2017. Evaluation of wound closure activity of cocos nucifera oil on scratched monolayer of human dermal fibroblasts. Chemical Engineering Transactions 56:1657−62

    doi: 10.3303/CET1756277

    CrossRef   Google Scholar

    [41]

    Karatas O, Gevrek F. 2019. Gallic acid liposome and powder gels improved wound healing in wistar rats. Annals of Medical Research 26(12):2720−27

    doi: 10.5455/annalsmedres.2019.05.301

    CrossRef   Google Scholar

    [42]

    Rahimi AM, Cai M, Hoyer-Fender S. 2022. Heterogeneity of the NIH3T3 Fibroblast Cell Line. Cells 11(17):2677

    doi: 10.3390/cells11172677

    CrossRef   Google Scholar

    [43]

    Zhang M, Aguilera D, Das C, Vasquez H, Zage P, et al. 2007. Measuring cytotoxicity: a new perspective on lC50. Anticancer Research 27(1A):35−38

    Google Scholar

    [44]

    Nemudzivhadi V, Masoko P. 2014. In vitro assessment of cytotoxicity, antioxidant, and anti-inflammatory activities of Ricinus communis (Euphorbiaceae) leaf extracts. Evidence-Based Complementary and Alternative Medicine 1−8

    doi: 10.1155/2014/625961

    CrossRef   Google Scholar

    [45]

    Botham PA. 2004. Acute systemic toxicity—prospects for tiered testing strategies. Toxicology in Vitro 18:227−230

    doi: 10.1016/S0887-2333(03)00143-7

    CrossRef   Google Scholar

    [46]

    Interagency Coordinating Committee on the Validation of Alternative Methods (ICCVAM). 2006. ICCVAM test method evaluation report: in vitro cytotoxicity test methods for estimating starting doses for acute oral systemic toxicity tests. NIH Publication No. 07-4519. National Institute for Environmental Health Sciences, Research Triangle Park, North Carolina, United Stated. https://ntp.niehs.nih.gov/sites/default/files/iccvam/docs/acutetox_docs/brd_tmer/brdvol1_nov2006.pdf

  • Cite this article

    Zakaria NH, Abdul Majid FA, Fadhlina A, Abdul Hamid SN, Anuar MNN, et al. 2024. Proliv Essence-3 (PE3): a nutricosmetic botanical blend as a dietary beverage for skin wellness and general health. Beverage Plant Research 4: e016 doi: 10.48130/bpr-0024-0008
    Zakaria NH, Abdul Majid FA, Fadhlina A, Abdul Hamid SN, Anuar MNN, et al. 2024. Proliv Essence-3 (PE3): a nutricosmetic botanical blend as a dietary beverage for skin wellness and general health. Beverage Plant Research 4: e016 doi: 10.48130/bpr-0024-0008

Figures(5)  /  Tables(2)

Article Metrics

Article views(3896) PDF downloads(595)

ARTICLE   Open Access    

Proliv Essence-3 (PE3): a nutricosmetic botanical blend as a dietary beverage for skin wellness and general health

Beverage Plant Research  4 Article number: e016  (2024)  |  Cite this article

Abstract: A natural product-based dietary approach could offer a safe and effective method for slowing down or preventing age-related deterioration in skin appearance and function, including issues like hyperpigmentation, dryness and wrinkles. Proliv Essence-3 (PE3) is a botanical beverage, meant for oral consumption with a unique formulation of three selected fruit extracts, Momordica charantia, Malus domestica, and Psidium guajava. Its purpose is to enhance both skin health and overall well-being from within. Proximate composition, presence of gallic acid and antioxidant activity of PE3 extract were determined. Elastase and tyrosinase inhibition assays were employed to investigate the anti-aging and whitening effects, respectively. The in vitro scratch assay and epidermal growth factor (EGF) assay were carried out to evaluate skin cell growth promotion and rejuvenation. The cytotoxicity analysis was carried out via neutral red uptake. The proximate analysis revealed that the product had a high moisture content and low amounts of calories. High-performance liquid chromatography (HPLC) analysis estimated 11.22 mg of gallic acid in 1 g of PE3 extract. PE3 exhibited a DPPH-IC50 value of 148.60 ± 1.52 μg/mL and an ABTS-IC50 value of 91.18 ± 1.15 μg/mL. The IC50 values for tyrosinase and elastase inhibition assays were 160.20 ± 1.81 μg/mL and 65.49 ± 0.38 μg/mL, respectively. PE3 was also discovered to be non-cytotoxic, and it enhanced the migration and proliferation of HSF1184 cells. EGF secretion was detected in PE3-treated HSF1184. This study provided preliminary evidence supporting the potential of PE3 as a nutricosmetical botanical beverage for promoting skin beautification and general health.

    • Nutraceuticals are defined as food-derived products that offer both nutritional and medicinal advantages, such as aiding in the management of specific health issues. The use of therapeutics derived from plant sources is expanding in the beverage industry. Several claims are made about the dermatological benefits of botanical products, including anti-inflammatory, anti-aging, and whitening properties[1]. The rationale for utilizing herbal remedies lies in their composition, which is exclusively derived from herbs and shrubs. These herbal medicines not only supply the body with essential nutrients and beneficial elements but also offer the assurance of having no adverse effects on human health due to their natural components[2]. Proliv Essence-3, also known as PE3, is a botanical beverage made from three selected fruits; Momordica charantia (bitter gourd), Malus domestica (apple), and Psidium guajava (guava). It was formulated primarily to help with the restoration of healthy skin and body as well as to boost overall health and wellness. Each of these components has a long history of being promoted as an alternative therapy for several types of skin conditions, such as skin radiance, reversing anti-aging signs, and the general improvement of internal health[35].

      M. charantia (Cucurbitaceae), often known as bitter melon or bitter gourd, is a potent nutrient-dense plant made up of a complex array of advantageous substances, including flavonoids, tannins, steroids, triterpenes glycoside, phenolic acid, all of which impart a bitter flavour[6]. Furthermore, a study has revealed that M. Charantia effectively treats inflammatory skin conditions[3]. On the other hand, M. domestica (Roseaceae), or apple, is among the fruits renowned for its exceptional medicinal and therapeutic properties[7]. It is also rich in dietary fibre, polyphenols, and antioxidants[8]. The benefits of apples in skin renewal and anti-aging have been documented in several studies[5,9].

      P. Guava (Myrtaceae) is commonly grown in tropical and sub-tropical regions[10]. It is high in antioxidants and phytochemicals, including vitamin C, saponin, flavonoids, oleanolic acid, quercetin and many other compositions[11]. According to Naseer et al., guava exhibited the ability to modify the activity of the heme oxygenase-1 protein, suggesting its possible use as an anti-inflammatory remedy for skin-related problems[12]. The aforementioned studies have shown that each of the components used in the formulation of PE3 has been proven to possess therapeutic benefits. To maximize the benefits of PE3 as an oral supplement, we recommend that individuals incorporate it into their daily routine as part of a balanced diet. Consuming PE3 regularly may offer the best potential for experiencing the intended benefits for skin health and overall well-being. Therefore, the purpose of the present work is to substantiate the effectiveness and safety of PE3 as a nutraceutical product, employing scientific approaches to bolster the acquisition of scientific insights concerning PE3 and its key components.

    • Naturemedics Laboratories Sdn. Bhd., Terengganu, Malaysia provided the PE3 extract for the study. The ingredients of PE3 consisted of M. charantia, M. domestica and P. Guava fruits. Initially, these fruits were processed into juices and then subjected to filtration using Whatman filter paper and a vacuum pump. To produce a liquid extract, the filtered juices were centrifuged to remove any clumps. For powder extract, the moisture content was removed through the freeze-drying method before concentrating it. Both liquid and powder of PE3 extracts were stored in an airtight container at 4 °C.

    • The proximate compositions, including protein, ash, moisture, fat, total carbohydrate, and calorie content, were analysed by Lotus Laboratory Services (M) Sdn. Bhd., Malaysia. While, other nutritional parameters such as vitamins, minerals, dietary fibers, and total sugar were analysed by KHTP Bio Analytical Laboratory Sdn. Bhd., Malaysia. All the parameters were analysed following the methods outlined in the Association of Official Analytical Chemists (AOAC).

    • DPPH solution (Sigma-Aldrich, USA) was mixed with 100 μL of PE3 liquid extract at various concentrations (1−1,000 μg/mL) and further incubated for 30 min at room temperature[13]. In the control group, ascorbic acid (Qrec, New Zealand) was used with a concentration of 0 to 10 μg/mL. The absorbance was measured in triplicate at 515 nm using the ELx800 Absorbance Microplate Reader (BioTek Instrument, USA). The DPPH scavenging activity was calculated using the formula:

      DPPH activity (%) = [(Ablank − Asample) / Ablank] × 100

      'A' represents the absorbance reading of the DPPH scavenging activity as a function of sample concentration was plotted, and the half-maximal inhibitory concentration (IC50) value was obtained.

    • To generate the ABTS+ cation radical, a reaction was initiated by mixing 7 mM ABTS (Sigma-Aldrich, USA) with 2.45 mM potassium persulfate (Sigma-Aldrich, USA) in a 1:1 ratio. At room temperature, the mixture was then placed in a dark environment for 12−16 h[14]. Subsequently, the ABTS solution was diluted with methanol to achieve an absorbance reading of 0.70 at 750 nm. Then, 30 μL of PE3 liquid extract was mixed with 300 μL of the ABTS solution, and the mixture was allowed to incubate for 6 min under dark conditions. Absorbance measurements were acquired in triplicate at a wavelength of 750 nm utilizing an ELx800 Absorbance Microplate Reader (BioTek Instrument, USA). Trolox (0−100 μg/mL) was employed as a positive control. To calculate the percentage inhibition, the following formula was used:

      Radical scavenging activity (%) = [1 − (Asample / Acontrol)] × 100

      'A' represents the absorbance reading and a graph depicting the relationship between radical scavenging activity and sample concentration was constructed, enabling the determination of the half-maximal inhibitory concentration (IC50) value.

    • Agilent's 1260 series HPLC equipment (Agilent Technologies Inc., USA), equipped with an autosampler and a UV detector using column (150 mm × 4.6 mm) Luna 5 μm C18 (Phenomenex, Torrance, USA) was used for the detection of gallic acid. The powder of PE3 extract was dissolved in deionized water at a concentration of 1,000 μg/mL. To establish the calibration curve, a broad range of concentrations for the gallic acid standard (20, 40, 60, and 80 μg/mL) was prepared in methanol. Elution was conducted through a gradient elution process, with a flow rate of 1.0 mL/min. Eluent A was composed of water (99.9%) and formic acid (0.1%), while eluent B consisted of acetonitrile (99.9%) and formic acid (0.1%). Initially, at 0.0 min, the elution mixture consisted of eluent A (80%) and eluent B (20%), and at 10.0 min, it transitioned to eluent A (55%) and eluent B (45%). Detection was performed at 280 nm utilizing a UV detector[15].

    • The study investigated the inhibitory potential of PE3 against mushroom tyrosinase. For the tyrosinase inhibition assay, L-DOPA was employed as the substrate[16]. Since tyrosinase is an enzyme responsible for catalyzing the conversion of L-DOPA into dopachrome, enzymatic activity was tracked by monitoring dopachrome formation at 410 nm in the presence of a potent tyrosinase inhibitor. The reaction mixture consisted of 20 μL of L-DOPA, 40 μL of mushroom tyrosinase (10 μg/mL), and 140 μL of PE3 liquid extract at varying concentrations (0.001−1,000 μg/mL). Ascorbic acid was utilized as a positive control. The dopachrome was determined by measuring the absorbance at 410 nm in triplicate, employing the ELx800 Absorbance Microplate Reader (BioTek Instrument, USA). The median inhibitory concentration (IC50) was calculated from the dose-response curves by nonlinear regression analysis using GraphPad Prism Version 6 software (United States). The enzymatic activity was calculated using the formula:

      Enzyme inhibition activity (%) = [1 − (Asample / Acontrol) × 100], where A is the absorbance reading.

    • The experiment was conducted following the methodology outlined by Era et al.[17]. To initiate the experiment, porcine pancreatic elastase was dissolved in a Tris-Cl buffer at pH 8.0 to create an enzyme solution with a concentration of 0.5 units/mL. This enzyme solution was employed to monitor the release of p-nitroaniline during the cleavage of the substrate N-succ-(Ala)3-nitroanilide (SANA). The substrate solution was prepared at a concentration of 0.1 M by dissolving SANA in Tris-Cl buffer. Subsequently, 130 μL of the enzyme solution was incubated with 10 μL of PE3 liquid for 5 min, followed by the addition of 15 μL of the substrate solution after the incubation period. As a positive control, epigallocatechin gallate (EGCG) was utilized. The enzymatic activity was quantified by measuring the absorbance at 410 nm using an ELx800 Absorbance Microplate Reader (BioTek Instrument, USA). The median inhibitory concentration (IC50) was calculated from the dose-response curves by nonlinear regression analysis using GraphPad Prism Version 6 software (USA). The enzymatic activity was calculated using the formula:

      Enzyme inhibition activity (%) = [Acontrol − Asample) / Acontrol × 100], where A is the absorbance reading.

    • The experiment aimed to assess in vitro cell migration using a protocol adapted from Fronza et al.[18]. Initially, the human skin fibroblast cell line HSF1184 (ATCC CL-193, USA) was seeded into a 12-well microplate and allowed to incubate for 24 h. After this incubation period, a uniform cell monolayer was formed and then a linear scratch was carefully created. Subsequently, different concentrations of PE3 extract were applied to the scratched area. As a positive control, platelet-derived growth factor (PDGF) was employed. The width of the scratch and the cell migration activity of HSF1184 were measured in triplicate.

    • The cytokine analysis was evaluated using an enzyme-linked immunosorbent assay (ELISA) (InvitrogenTM, USA) based on the manufacturer's procedure[18]. The cell lysate (0.001−10,000 μg/mL) was collected for cytokine analysis following 24 h of exposure to PE3 extract. EGF standard was prepared at various concentrations of 3.9 to 250 μg/mL. The standards were reconstituted using Standard Diluent Buffer before being subjected to a 10-min incubation period. Both the standards and the PE3 sample were allowed to incubate for 2 h at room temperature. Next, the mixture was combined with 100 μL of biotin conjugate, and this new mixture was further incubated for an additional hour at room temperature. Then, 100 μL of Streptavidin-HRP was added and the mixture was incubated for another 30 min before adding 100 μL of Stabilized Chromogen. Lastly, 100 μL of stop solution was added to the well. The color changes were observed and the absorbances were taken at 450 nm using ELx800 Absorbance Microplate Reader (BioTek Instrument, USA). Relative cytokine concentration was determined using the formula:

      Relative cytokine concentration (%) = (Asample / A control) × 100, where A is the absorbance reading.

    • A cytotoxicity test was conducted using the methodology described by Zofia et al.[19]. Two cell lines, HSF1184 (ATCC CL-193, USA) and BALB/c 3T3 (ECACC 90011883, UK), were cultured at 37 °C in a humidified incubator. The culture medium used was Dulbecco's Modified Eagle Medium (DMEM) supplemented with 10% fetal bovine serum, 5% fetal calf serum, and 1% Penicillin-Streptomycin. All the chemicals used in the experiment were procured from Gibco, Scotland. A density of 1 × 10⁵ cells/mL of fresh media was used to seed the cells in 96-well plates. The medium was aspirated after the initial 24 h of preculture, and various concentrations of PE3 extracts (0.001−10,000 μg/mL) were applied to each well. The cultures were then continued for an additional 24 h. The control group was unexposed cells. Following exposure to the PE3 extract, the cells were incubated for 2 h with neutral red dye. After the treatment, the cells were washed with Phosphate Buffered Saline (PBS), and subsequently, 150 μL of a destaining solution containing ethanol and acetic acid was added to each well. The mixture was gently shaken for 10 min to facilitate the removal of neutral red from the cells, resulting in a homogeneous solution. For each concentration of the extract, triplicate tests were performed, and the absorbances were measured at 540 nm using the ELx800 Absorbance Microplate Reader (BioTek Instrument, USA). The IC50 value was then determined by creating a graph and utilizing GraphPad Prism Version 6 software (USA). The in vivo LD50 of acute oral toxicity was estimated from in vitro IC50 using the formula, logLD50 = 0.372 × logIC50 (μg/mL) + 2.024[20]. While relative cell viability was calculated using the formula:

      Relative cell viability (%) = (Asample / Acontrol) × 100, where A is the absorbance reading.

    • The data were presented as mean ± standard deviation (SD), and the level of significance was assessed at a 5% probability (p < 0.05). Data analysis was performed using GraphPad Prism software (version 6, USA), and a one-way analysis of variance (ANOVA) was utilized for statistical evaluation.

    • Based on the proximate analysis in Table 1, high moisture content and low calories of PE3 were observed. The value of pH was slightly acidic, with an indication of bitter and sour taste. The nutritional analysis revealed a PE3 profile characterized by limited quantities of essential nutrients such as vitamin C, vitamin D, and dietary fiber. Additionally, the assessment identified a presence of 11 mg of calcium, a moderate level of 3 mg of iron, and 58 mg of potassium. The sodium content is moderate, warranting careful monitoring for individuals with specific health considerations.

      Table 1.  The proximate and nutritional analysis of PE3 extract.

      Parameter Values (per 100 g)
      Protein, % (w/w) ND
      Calories, kcal/100 g 5.0
      Carbohydrate, % (w/w) 7.0
      Saturated fat, % (w/w) ND
      pH 4.45
      Taste Bitter and sour
      Colour Brown
      Moisture, % (w/w) 92.4
      Ash, % (w/w) 0.6
      Dietary fibre (g) 0
      Total sugar (g) 12.6
      Vitamin C (mg) 0
      Vitamin D (μg) 0
      Calcium (mg) 11.0
      Iron (mg) 3.0
      Sodium (mg) 46.0
      Potassium (mg) 58.0
      ND = Not detected.
    • The chromatographic fingerprint of the PE3 extract is shown in Fig. 1. Peak A indicated the presence of gallic acid in PE3 as it exhibited identical spectral characteristics and retention time with the standard marker, gallic acid. The concentration of gallic acid was estimated based on the linear calibration curves of the standard compound, and the result yielded 11.21 ± 0.07 mg/g of gallic acid.
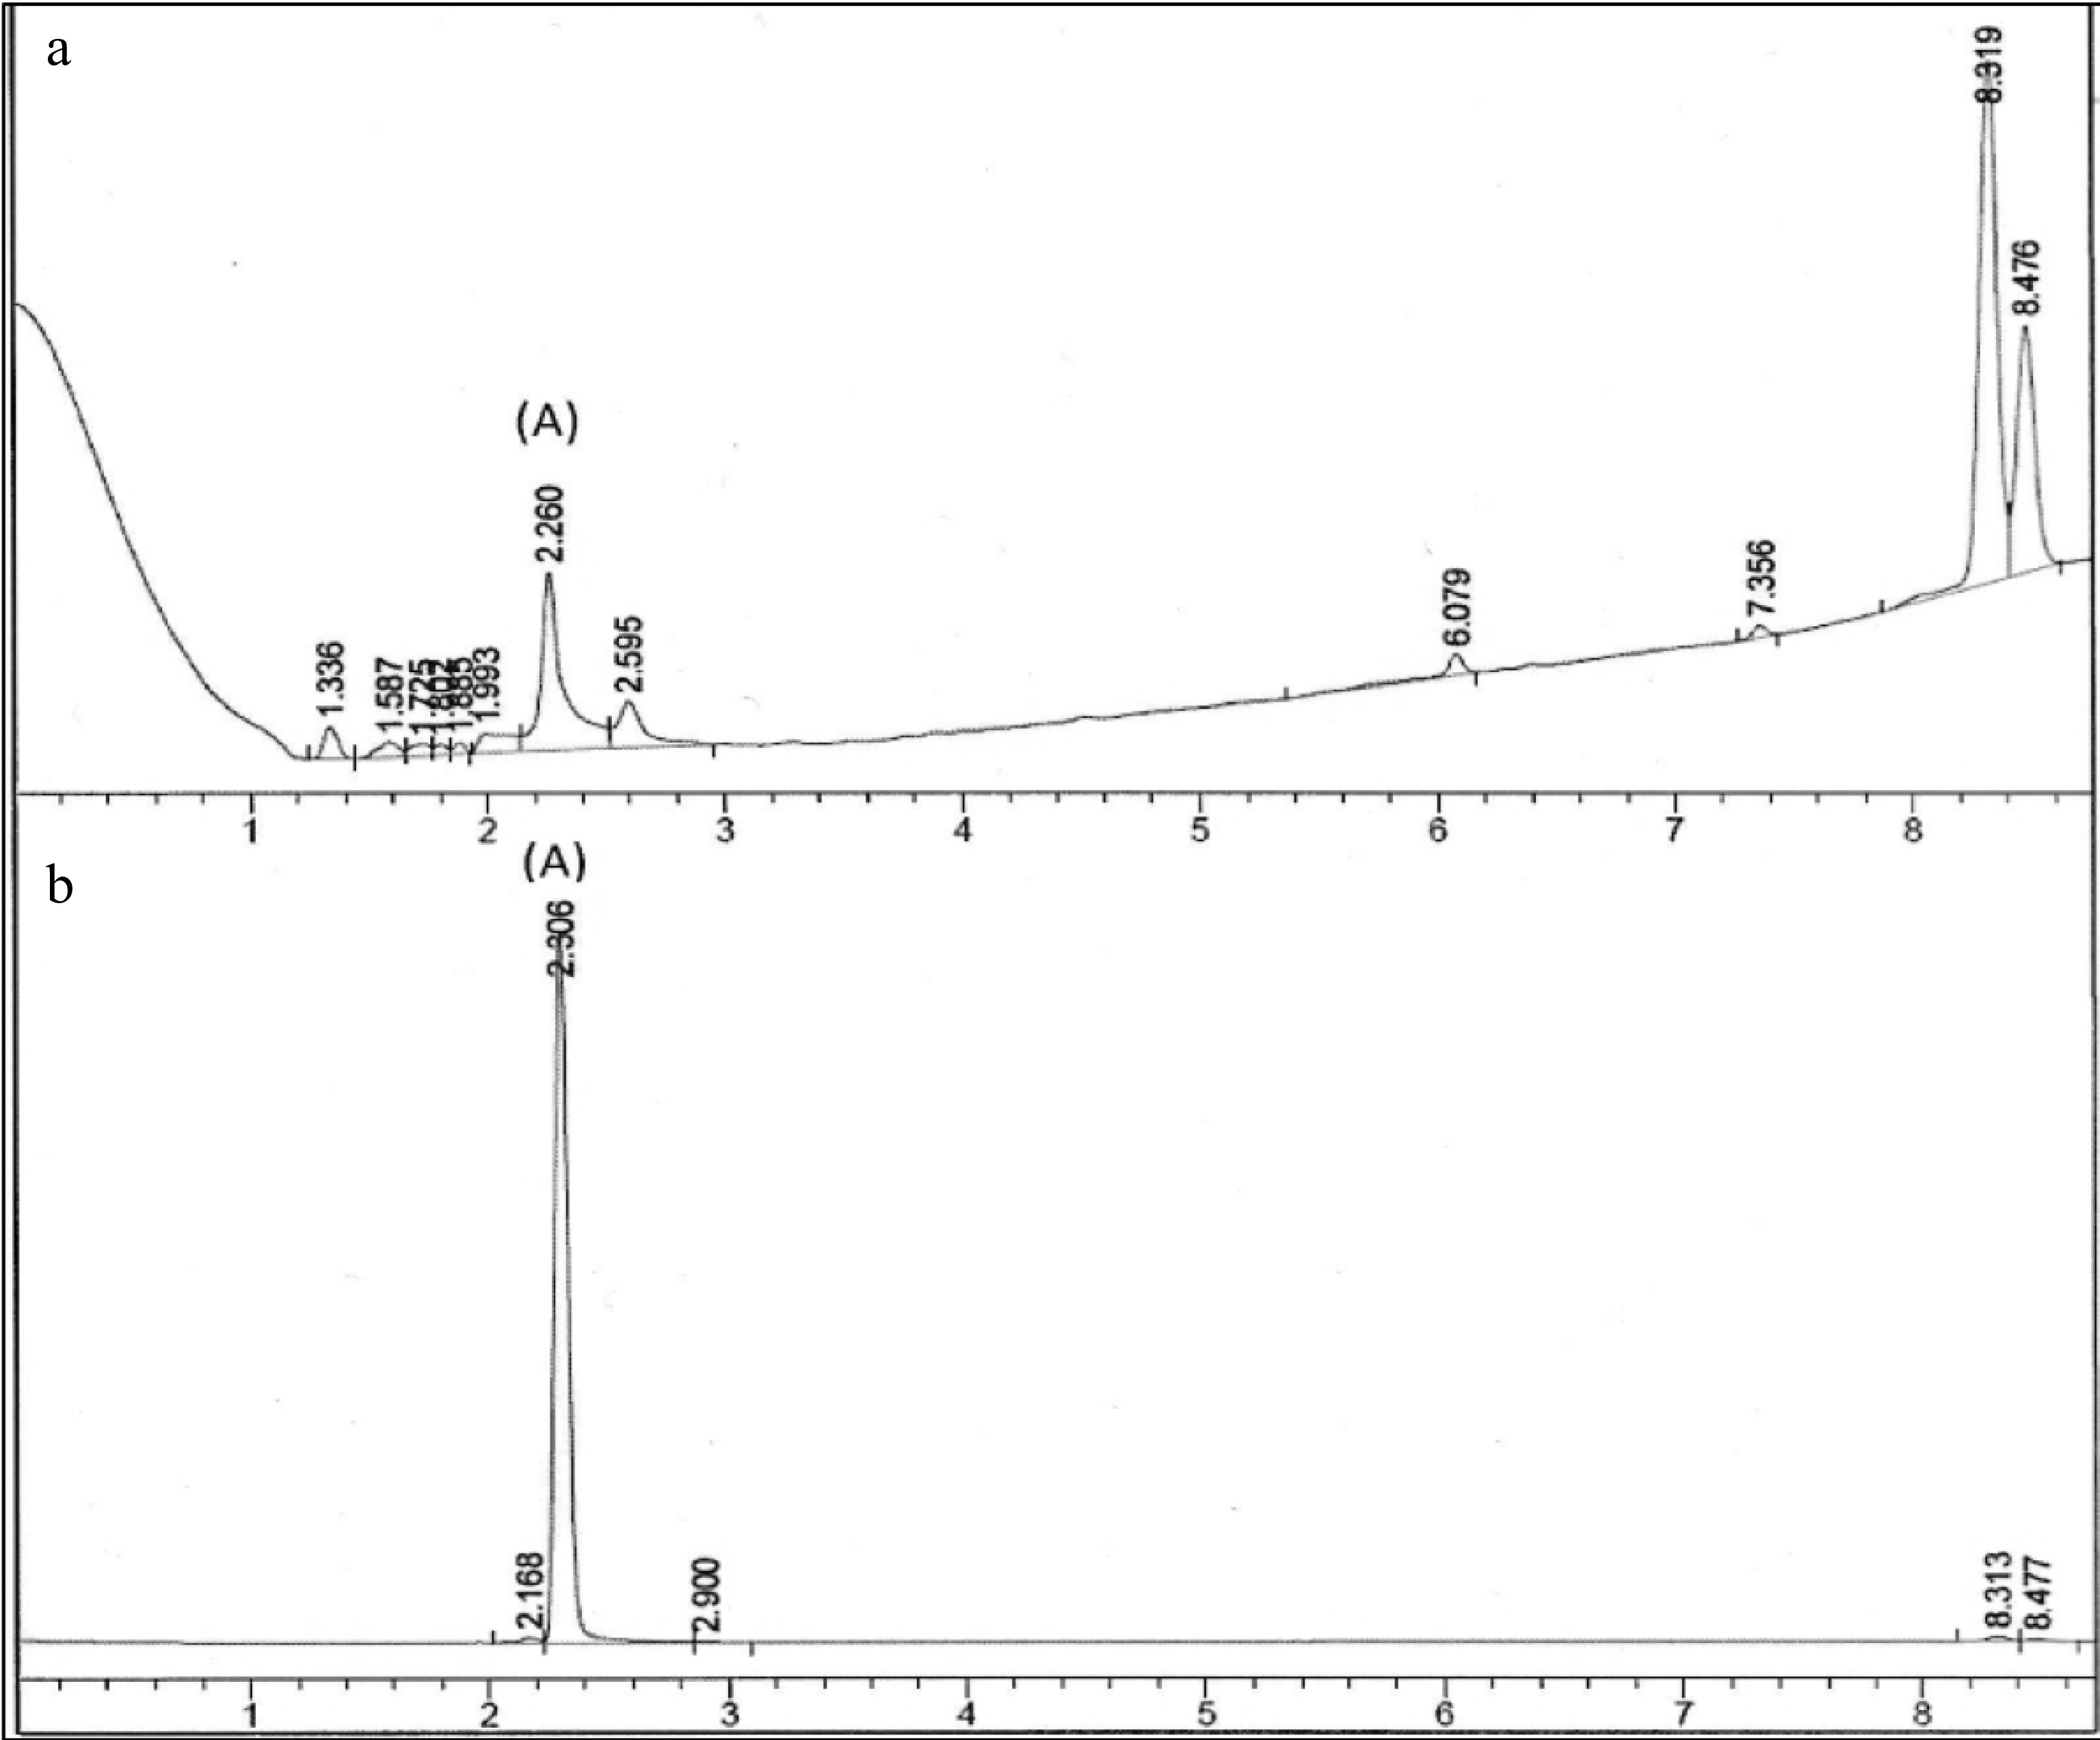
      Figure 1. 

      Chromatographic fingerprint of (a) PE3 and standard marker, (b) gallic acid. Peak A indicated the presence of gallic acid.

    • As shown in Table 2, the IC50 for PE3 extract was 148.60 ± 1.52 μg/mL, and the IC50 for ascorbic acid was 6.50 ± 1.04 μg/mL for DPPH assay. Based on the ABTS assay, PE3 extract exhibited 91.18 ± 1.15 μg/mL of IC50, while Trolox showed 6.07 ± 1.07 μg/mL of IC50. The scavenging activity percentage increased with concentrations of PE3 in both the DPPH and ABTS assays (Fig. 2). Interestingly, at the concentration of 10 μg/mL, PE3 produced 80% DPPH scavenging activity, while ascorbic acid had 90% of scavenging activity at the concentration of 1000 μg/mL. In the ABTS assay, 1,000 μg/mL of PE3 produced 14% scavenging activity, while Trolox revealed 90% scavenging activity at 10 μg/mL concentration.

      Table 2.  Antioxidant activity, elastase assay and tyrosinase assay of PE3 extract.

      Assays Values
      Gallic acid content (mg/g) 11.22 ± 0.07
      DPPH (IC50 μg/mL) 148.60 ± 1.52
      ABTS (IC50 μg/mL) 91.18 ± 1.15
      Tyrosinase assay (IC50 μg/mL) 160.20 ± 1.81
      Elastase assay (IC50 μg/mL) 65.49 ± 0.38
      All values represent the mean ± standard deviation of three replicates analyses.
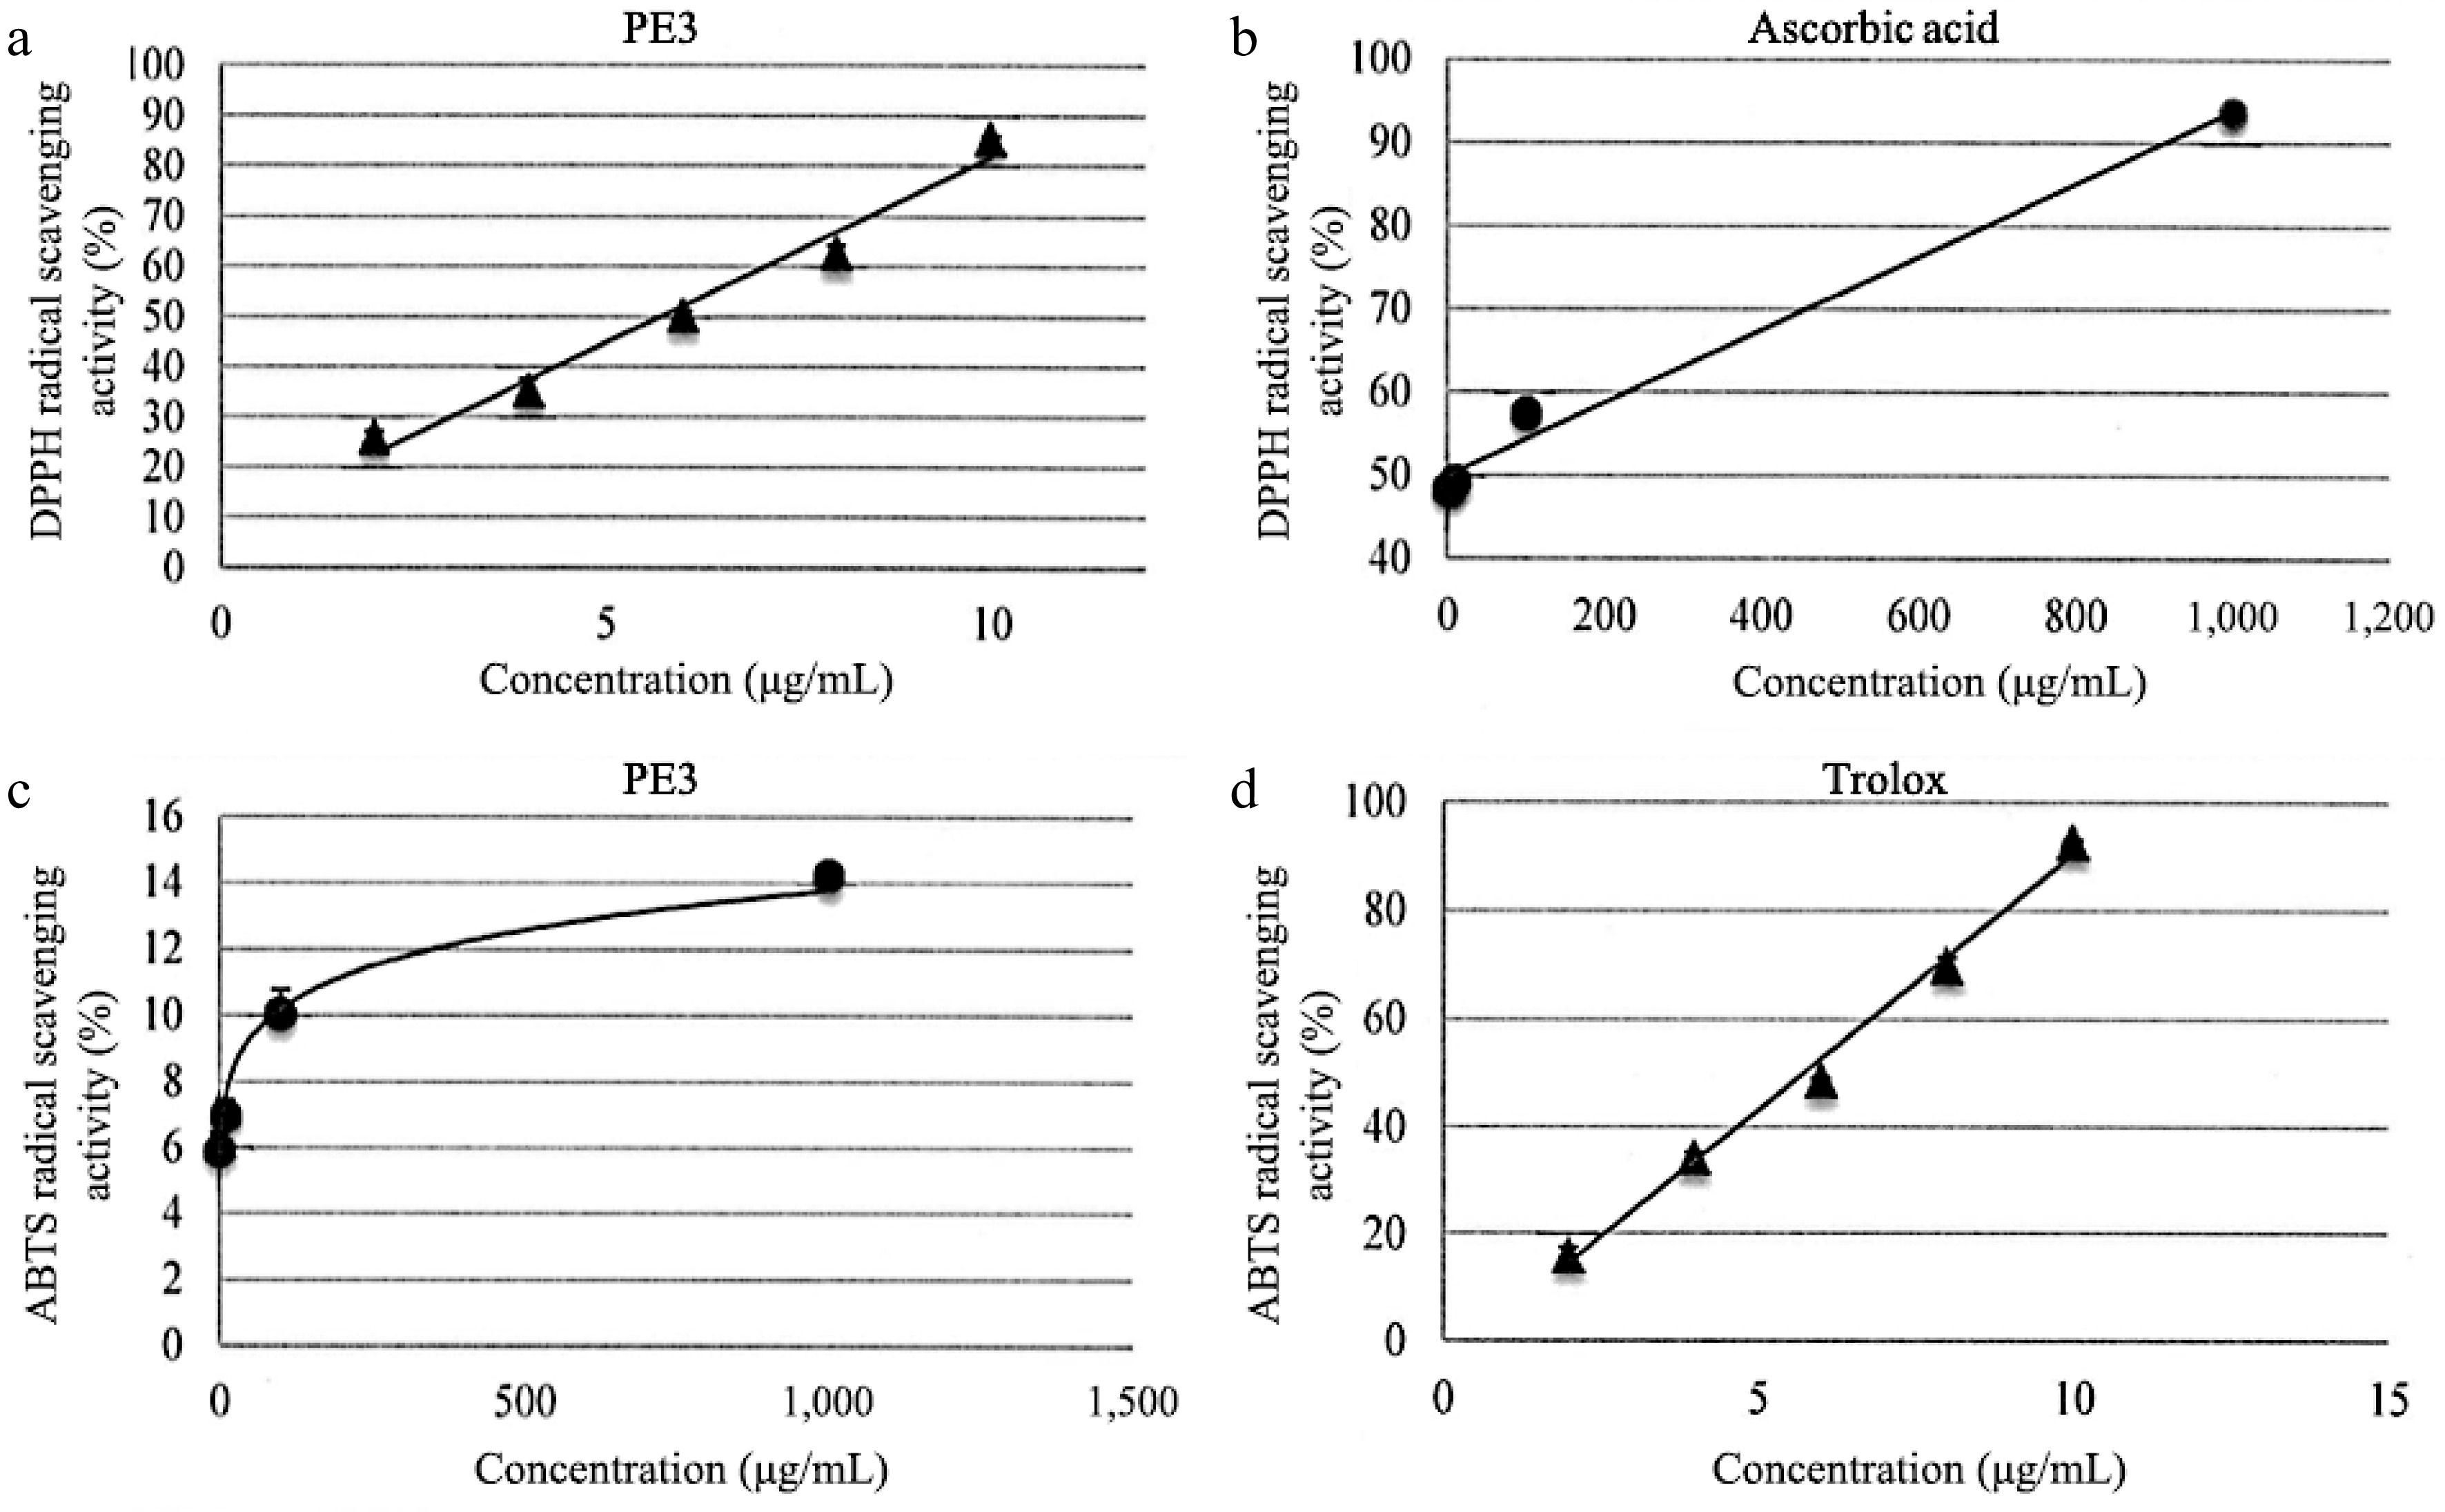
      Figure 2. 

      DPPH scavenging activity of (a) PE3 extract and the standard, (b) ascorbic acid. ABTS scavenging activity of (c) PE3 extract and the standard, (d) Trolox. All values represent mean ± standard deviation.

    • Skin whitening and rejuvenation properties of PE3 extract were evaluated using mushroom tyrosinase and elastase inhibition assays (Table 2). In the mushroom tyrosinase test, PE3 extract showed the highest significant inhibition (p < 0.05) at the concentration of 1,000 μg/mL (16%). PE3 extract also had an IC50 value of 160.20 ± 1.81 μg/mL, which was lower than the standard ascorbic acid (17.36 μg/mL). In the elastase inhibition activity assay, the enzyme was inhibited in a dose-dependent manner up to 1,000 μg/mL, which showed the highest inhibition (23%) of PE3 at the concentration of 1,000 μg/mL compared to the EGCG (33%). PE3 extract also exhibited a low IC50 value (65.49 ± 0.38 μg/mL), indicating a strong elastase inhibition capacity.

    • The role of EGF in regulating the proliferation of HSF1184 cells was further investigated in cytokine analysis (Fig. 3). In HSF1184 cells treated with PE3, a substantial increase in the secretion of EGF was observed, ranging from 110% to 170% relative cytokine viability. As the extract concentration increased, the relative cytokine viability increased. The cell migration of fibroblast for PE3-treated cells (0.001−1,000 μg/mL) was approximately 100%, comparable to the cells treated with PDGF (Fig. 4). Cells with untreated medium showed 60 to 70% of migration activity. The confluent monolayer of HSF1184 cells treated with PE3 extract demonstrated a fast wound closure after 24 h, showing this extract is notably an efficient wound healing therapy.
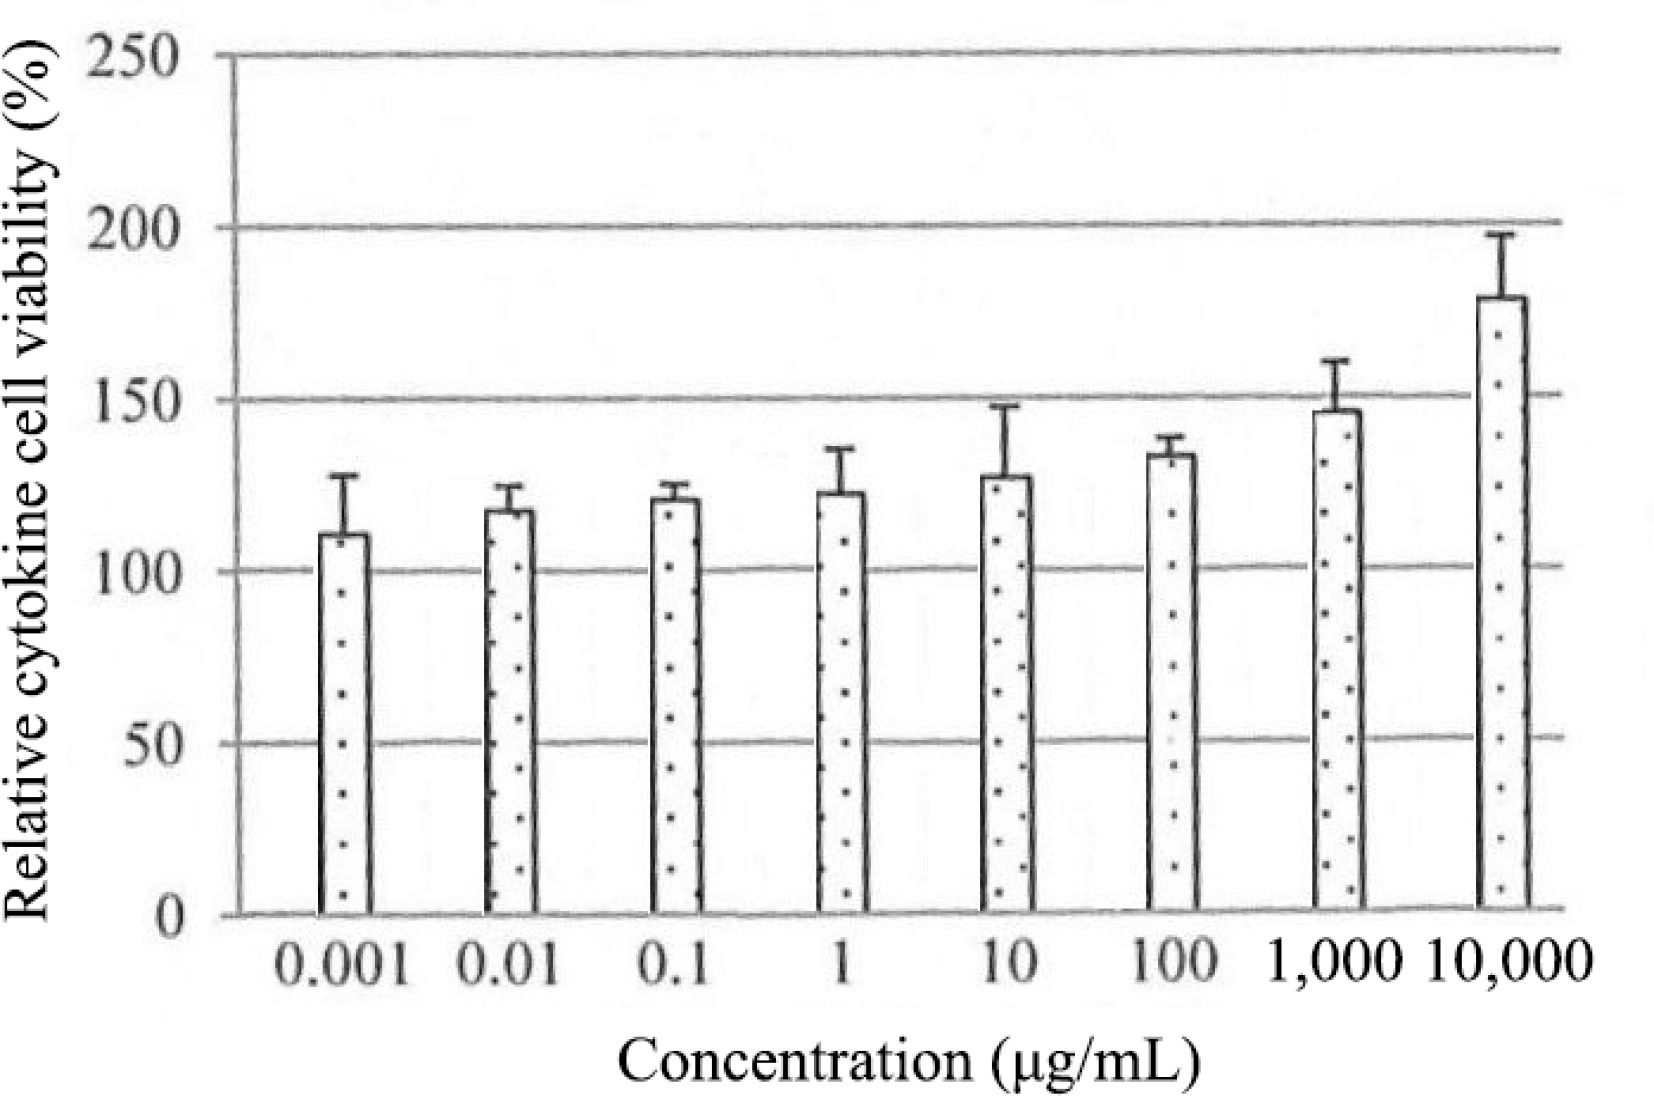
      Figure 3. 

      Effect of PE3 extract on EGF secretion of HSF1184 cell within 24 h. Results are expressed as mean ± standard deviation.
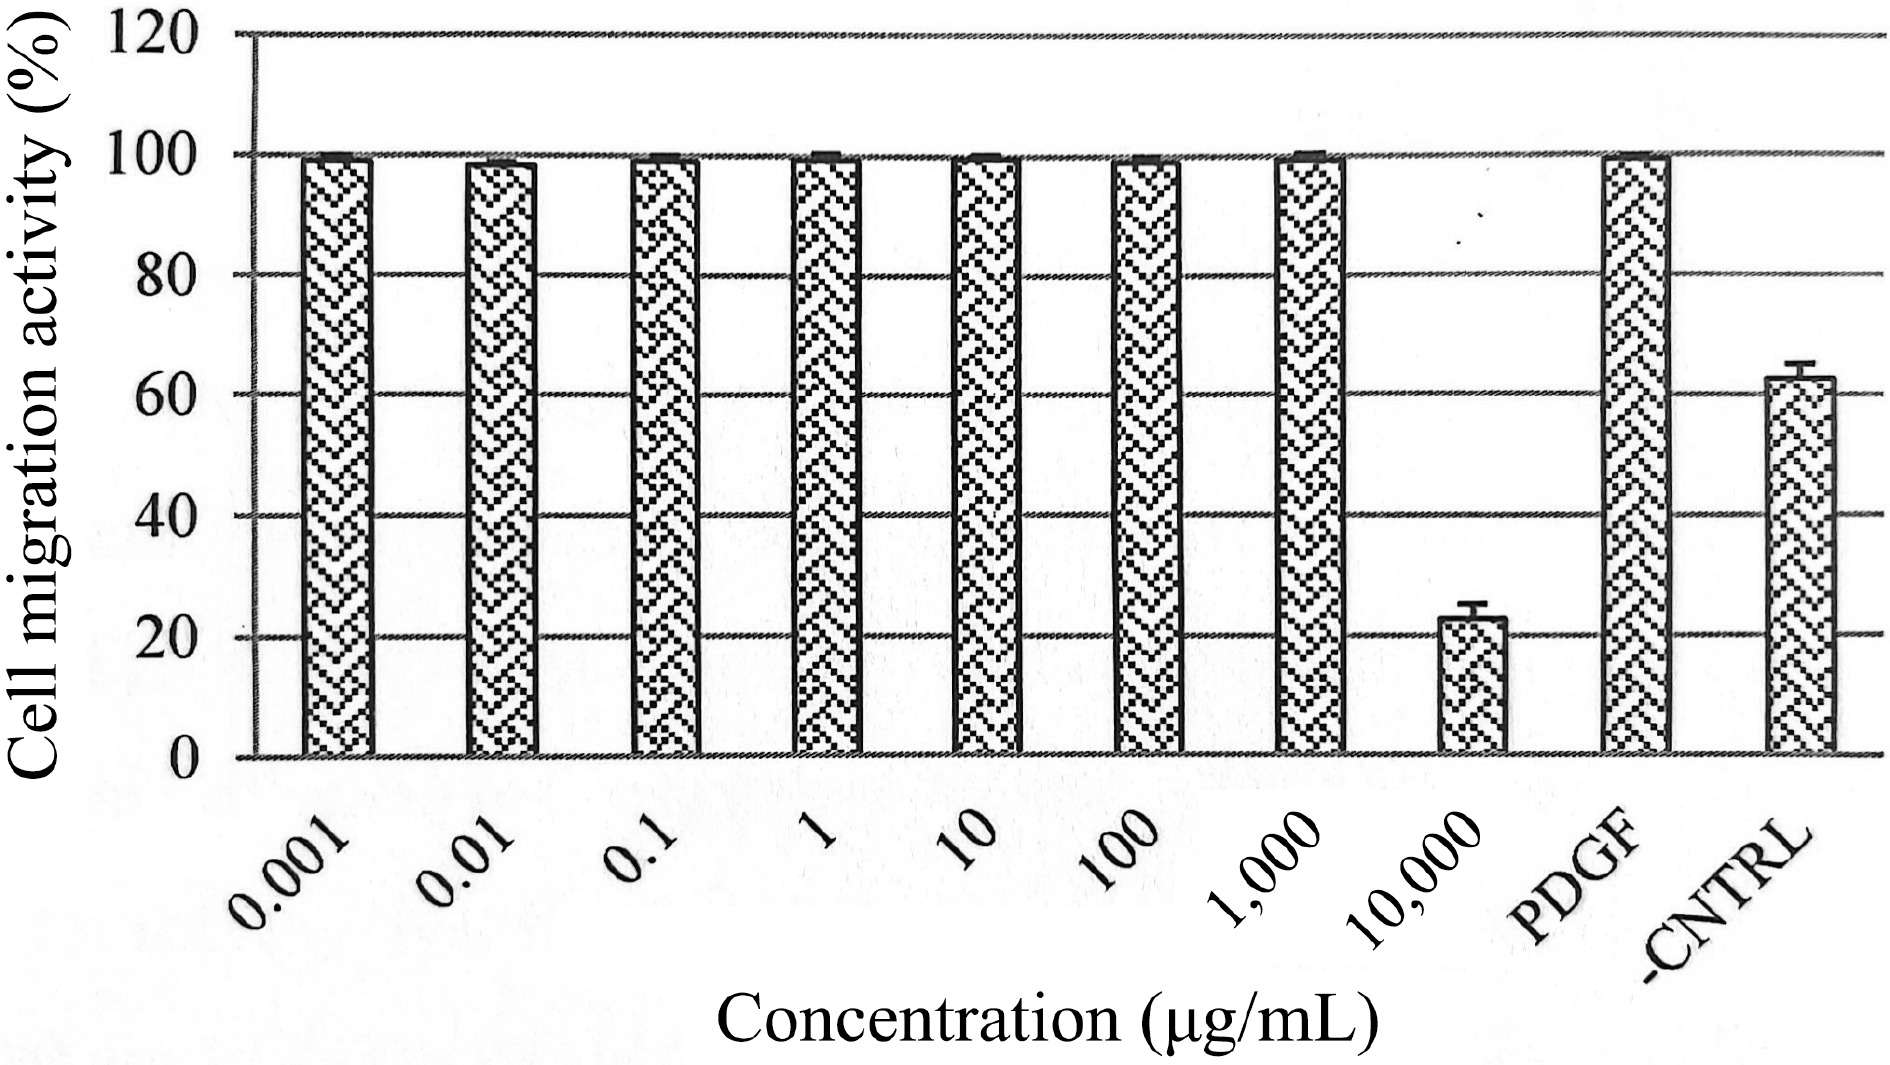
      Figure 4. 

      Effects of PE3 extract at different concentrations on HSF1184 cell migration. Results are expressed as mean ± standard deviation.

      Cytotoxicity test

      The biological activity of PE3 extract was also investigated on cells as an in vitro model. The test showed that PE3 extract was non-cytotoxic at concentrations below 1,000 μg/mL when exposed to HSF1184 and BALB/c 3T3 cell lines (Fig. 5). The result showed a consistent pattern in the mean of relative cell viability on both cell lines. Generally, the BALB/c 3T3 cell line produced higher cell viability than HSF1184 in all concentrations tested. The figure also shows that at 0.001 μg/mL (BALB/c 3T3) and 1,000 μg/mL (HSF1184), PE3 extract exhibited more than 100% cell viability in a dose-dependent manner for 24 h. Cell damage was observed at a concentration of 10,000 μg/mL, indicating that this dose is considered toxic when administered at levels exceeding 10,000 μg/mL. The calculated IC50 values were 3,141 μg/mL (HSF1184) and 3,145 μg/mL (BALB/c 3T3). Meanwhile, the calculated LD50 values were 2,113.05 μg/mL and 2,114.05 μg/mL for HSF1184 and BALB/c 3T3, respectively.

      Figure 5. 

      Relative cell viability of HSF1184 and BALB/c 3T3 cell lines exposed to PE3 extract at various concentrations. Results are expressed as mean ± standard deviation.

    • The demand for natural and plant-based nutricosmetics has consistently surged in recent years, driven by a growing awareness of the pivotal role these ingredients play in promoting health and beauty[21]. However, despite the considerable availability of natural nutricosmetic ingredients in the market, scientific validation and the tolerance profiles of many of these components remain limited. Preclinical trials are imperative to substantiate their effectiveness[22]. The increasing interest in nutrition that promotes both internal well-being and external appearance is also heightening consumer awareness. Consequently, this study holds great significance, given that PE3, as a dietary beverage, has the potential to provide essential nutrients to the body while also improving skin health concurrently. Its means of consumption are both straightforward and cost-effective, and its safety is assured due to its nature-derived and readily available raw materials.

      Based on the proximate composition, PE3 extract has a unique flavour profile, comprising mainly bitter and sour acidic taste, as reflected in the low pH of the drink, making it suitable for bodily hydrating features. The sour taste in the formulation was attributed to the guava and green apple juices, while the bitter taste was derived from the bitter gourd juice. Research has shown that the sour and bitter taste may aid digestion, improve appetite, and help to keep sugar cravings at bay[23]. The nutritional analysis of PE3, focusing on its impact on skin health, indicated some noteworthy aspects. The degradation or loss of vitamins C and vitamin D in this study could be related to the processing method as these vitamins are sensitive to heat and light. Other than that, the formulation of the PE3 supplement, including how the ingredients are combined and processed, can influence the nutrient content. If certain ingredients or processing steps are chosen that lead to the loss of these vitamins, it would be reflected in the analysis results. While PE3 is found to be lacking in certain essential nutrients like vitamin C and vitamin D, which play crucial roles in skin health, it does contain moderate levels of beneficial minerals such as calcium, iron, and potassium. The presence of these minerals can contribute to overall skin well-being, supporting aspects like collagen production, oxygen transport, and cellular function[24]. The moderate sodium content in PE3 highlights the need for careful monitoring.

      Previous studies have found gallic acid in M. charantia, M. domestica, and P. guava, which are the main ingredients of PE3, hence the presence of gallic acid in the PE3 concoction was verified in this study[25,26]. Furthermore, following extensive research, gallic acid has demonstrated significant antioxidant and anti-inflammatory capacities, with its most prominent advantages often linked to skin health. Zhang et al. validated the clinical efficacy of gallic acid in reducing free radical generation, controlling skin inflammation, inhibiting tyrosinase production, and preventing melanin transfer[27]. Therefore, gallic acid was selected as a targeted compound of interest in this study. Several studies have documented the quantification of gallic acid in herbal formulations. For example, in the research conducted by Borde et al.[28], 30 Ayurvedic herbs and formulations were screened for gallic acid by silica gel thin layer chromatography, and they found that nine Ayurvedic herbs contained gallic acid in the range of 0.091 to 27.36 mg/g. In a related study, the amount of gallic acid in the polyherbal Triphala churna formulation was determined using HPLC, and they discovered that it was present at a level of approximately 3.27% w/w which is lower than the findings of the present study[29]. The pharmacological features of the product, such as its anti-inflammatory, antibacterial, antioxidant, and antimutagenic actions, may have been influenced by the presence of gallic acid in the herbal formulation[30].

      The antioxidant activity of PE3 was first assessed using the DPPH free radical scavenging assay. DPPH, which stands for 2,2-diphenyl-1-picrylhydrazyl, is a stable free radical molecule. It absorbs light in the range of 515 to 520 nm in its oxidized state. The DPPH test is a rapid and efficient method for evaluating free radical scavenging activity. DPPH can accept either an electron or a hydrogen radical, leading to the formation of a stable diamagnetic molecule[14]. This transformation results in a change in color from purple to yellow, indicating a decrease in DPPH radical absorption. The reducing power was determined by calculating the concentrations required to achieve 50% inhibition (IC50), representing the amount needed to scavenge 50% of DPPH free radicals. The lower the value of IC50, the higher the scavenging power of the antioxidant.

      The DPPH solution undergoes reduction due to the presence of antioxidant compounds that contain hydrogen-donating groups, such as phenolic acids. This reduction leads to the formation of non-radical compounds. A study exploring the antioxidant properties of herbal tea revealed that the extracts displayed DPPH radical inhibition, with a range of 21.8% to 44.48%[31]. In contrast, the PE3 extract in our current study exhibited even higher antioxidant activity, ranging from 25 to 80%. Meanwhile, the IC50 value determined in our current study indicates that PE3 exhibits a significantly higher antioxidant capacity in comparison to the previous study conducted by Fatanah et al.[32]. In their research, they reported an IC50 value of 1055 μg/mL for herbal tea made from C. caudatus leaves.

      To support the DPPH results, we conducted the ABTS assay, which is based on the decolorization of the blue-green color of the ABTS solution. This assay effectively demonstrates antioxidant capacity by reducing ABTS+ to ABTS. Our findings indicate that the PE3 extract serves as a potent source of antioxidants, capable of scavenging both ABTS and DPPH free radicals. The presence of gallic acid in the sample likely contributes to the observed antioxidant potential in PE3. Gallic acid, a phenolic compound commonly found in plants, plays an important role in preventing the detrimental effects of oxidative stress[33]. By mitigating oxidative stress, antioxidants can effectively slow down the skin aging process, diminishing the appearance of fine lines, wrinkles, and age spots, ultimately preserving a more youthful complexion[34].

      Tyrosinase and elastase are pivotal enzymes in the context of skin aging. Tyrosinase plays a central role in melanin synthesis, influencing skin pigmentation. Overactivity of tyrosinase can lead to hyperpigmentation, contributing to age-related skin discoloration[35]. Addressing tyrosinase activity is a common strategy in skincare to manage uneven skin tone. On the other hand, elastase is responsible for breaking down elastin, a protein critical for maintaining skin elasticity and firmness. Increased elastase activity is associated with the degradation of elastin fibers, resulting in the loss of skin elasticity and the formation of wrinkles and sagging skin[36]. Therefore, inhibiting elastase is a targeted approach in skin-care formulations to preserve skin elasticity and mitigate visible signs of aging, contributing to a more youthful and resilient complexion.

      Theoretically, tyrosinase will catalyse the production of brown pigment using L-dopa as a substrate. The capacity of the sample to inhibit the oxidation process will result in a reduction in the intensity of the brown pigment colour, which can be detected using a spectrophotometric approach[37]. The inhibitory activity of PE3 is comparable to what has been reported for the herbal formulation containing C. palala and U. micrantha, as well as their mixture, all of which exhibited less than 20% of tyrosinase inhibition[38]. Meanwhile, for elastase assay, as reported by Zofia et al.[19], several plants from the Apiaceae family revealed inhibition elastase activities ranging from 15% to 30% for 0.5% concentration of plant extracts. This action is primarily due to the presence of a significant amount of a variety of biologically active substances, such as polyphenols, which comprise, among other things, flavonoids, phenolic acids, tocopherols, and tannins[33]. In a recent study carried out by Raphaelli et al., the phenolic extracts of M. domestica showed potential uses in the treatment of melanoma and protection against harmful UV radiation which are ideal for the formulation of skin-related products[39].

      The ability of PE3 extract to stimulate fibroblast proliferation and cell migration in enhancing wound healing activity was demonstrated using an in vitro wound scratch test. Skin fibroblast is one of the most crucial cells in tissue repair as its proliferation is involved in migration, contraction, and collagen production. Based on the results observed in this study, PE3 was proven to enhance wound healing. Significant secretion of EGF was observed in this study, indicating that it could promote cell proliferation and thus enhance skin rejuvenation. The wound-healing effect of PE3 could be related to the presence of gallic acid in the sample, which could induce fibroblast cell growth and proliferation to enhance the wound closure activity[40]. As supported by the previous study, gallic acid was found to increase fibroblast cell counts and decrease late inflammation along with increased TGF-β expressions in the wound healing process of Wistar rats[41].

      The HSF1184 cell line is derived from the human skin fibroblast. Whereas, the BALB/c 3T3 cell line is a mouse fibroblast cell line that is widely used in cytotoxic studies. Fibroblasts are a type of connective tissue cells that play a crucial role in tissue repair and maintenance. BALB/c 3T3 cells, being fibroblasts, are often used as a representative cell type for studying cellular processes related to connective tissues[42]. Both HSF1184 and BALB/c 3T3 cells were used in the present study to ensure the reliability and increase robustness of the study's findings. Different cell lines have unique characteristics and responses to various substances, and using multiple cell lines assists in obtaining a more comprehensive understanding of the potential cytotoxic effects of PE3 extract.

      PE3 extract exhibited no cytotoxic effects at concentrations below 1,000 μg/mL when tested both on HSF1184 and BALB/c 3T3 cell lines. If the non-cytotoxic effects are consistent across different cell lines, it strengthens the argument that the observed effects are not specific to a particular cell type but may have broader implications. The IC50 value for PE3 was considered high, which typically indicated low cytotoxicity[43]. Extracts with high IC50 values are preferable for work because they have fewer toxic effects on host cells. In a prior study, it was found that the leaf extract of R. communis displayed an IC50 value of 784 μg/mL when tested against the human Caucasian skin fibroblast cell line (Bud-8)[44]. In another study, a 5% concentration of Aegopodium podagraria extract demonstrated the highest proliferation, reaching 100% cell viability when treated with human foreskin fibroblast (BJ) cell lines for 24 h[19].

      LD50 was also predicted in this study to assess the safety of PE3 extract. Traditionally, the safety and toxicity profiles are determined via in vivo acute oral toxicity tests, where the lethal dose for 50% of the tested animals (LD50) will be calculated[45]. However, in line with the recommendations of the Interagency Coordinating Committee on the Validation of Alternative Methods, the LD50 value for rats can be estimated using the lC50 value obtained from an in vitro cytotoxicity assay, employing a previously established regression formula. This innovative approach allows us to approximate a starting dose much closer to the actual LD50 value for subsequent in vivo acute oral toxicity studies. As a result, this approach not only reduces the number of animals required for preliminary range-finding experiments but also minimizes the unnecessary need to sacrifice animals due to toxicity concerns[46].

      The research had limitations that involved a restricted focus primarily on in vitro assays, a lack of human clinical trials to substantiate the asserted health benefits, and an absence of extended-term studies to evaluate sustained effectiveness and safety. Future investigations may focus on the clinical trials for substantiating health claims, performing thorough chemical analyses, exploring long-term implication, and refining the formulation of the drink. While the present study provided valuable insights into the proximate composition, antioxidant activity, and biofunctionalities of PE3, it is also important to include further exploration of standardization on the formulated extract. Addressing these aspects comprehensively in future research is essential to ensure transparency, and further validate the quality and efficacy of PE3 in terms of its major constituents. Furthermore, continuous safety assessments are imperative to confirm its non-cytotoxic nature.

    • Botanical nutraceuticals are an efficient approach for sustaining health and combating nutritionally related illnesses, promoting optimal health, and quality of life. The findings from this study revealed that PE3 can serve as a botanical beverage due to the presence of bioactive ingredients, and its good antioxidant capacity which may aid in skin whitening and rejuvenation, wound healing activity, and overall consumer health. PE3 presents consumers with a cost-effective and practical alternative that not only offers a delightful flavor but also potential health benefits, making it a promising candidate to replace synthetic antioxidant beverages available in the market.

    • The authors confirm contribution to the paper as follows: study conception and design: Abdul Majid FA; experiment conduction and data analysis: Abdul Hamid SN; draft manuscript preparation and revision: Zakaria NH; manuscript revision: Fadhlina A, Anuar MNN, Tengku Aziz TN. All authors reviewed the results and approved the final version of the manuscript.

    • All data generated or analyzed during this study are included in this published article.

    • The authors would like to acknowledge the Faculty of Chemical Engineering and Natural Resources, Universiti Teknologi Mara for providing the facilities to conduct the research and the Institute of Climate Adaptation and Marine Biotechnology, Universiti Malaysia Terengganu for the support. The authors are also thankful to Naturemedics Laboratories for providing the source material.

      • The authors declare that they have no conflict of interest.

      • Copyright: © 2024 by the author(s). Published by Maximum Academic Press, Fayetteville, GA. This article is an open access article distributed under Creative Commons Attribution License (CC BY 4.0), visit https://creativecommons.org/licenses/by/4.0/.
    Figure (5)  Table (2) References (46)
  • About this article
    Cite this article
    Zakaria NH, Abdul Majid FA, Fadhlina A, Abdul Hamid SN, Anuar MNN, et al. 2024. Proliv Essence-3 (PE3): a nutricosmetic botanical blend as a dietary beverage for skin wellness and general health. Beverage Plant Research 4: e016 doi: 10.48130/bpr-0024-0008
    Zakaria NH, Abdul Majid FA, Fadhlina A, Abdul Hamid SN, Anuar MNN, et al. 2024. Proliv Essence-3 (PE3): a nutricosmetic botanical blend as a dietary beverage for skin wellness and general health. Beverage Plant Research 4: e016 doi: 10.48130/bpr-0024-0008

Catalog

  • About this article

/

DownLoad:  Full-Size Img  PowerPoint
Return
Return