


-
Increasing evidence suggests the imbalance between the accumulation and clearance of amyloid β (Aβ) and Aβ-related peptides plays a crucial role in the onset of Alzheimer’s disease (AD)[1,2]. Aβ is known to trigger various stress responses, including oxidative stress, inflammation, and mitochondrial dysfunction[3−5]. Externally, Aβ forms senile plaques outside of cells, while intracellular hyperphosphorylated tau protein forms neurofibrillary tangles and cell apoptosis, both of which are important factors leading to the development and progression of AD[6−8].
Moreover, Aβ exerts multiple toxic effects, such as causing ion leakage, disruption of cellular calcium ion balance, and induction of cell apoptosis[9]. Beyond external accumulation, Aβ can also accumulate in cell membranes, organelles, and the cell nucleus, leading to mitochondrial dysfunction, endoplasmic reticulum stress, and abnormal cell cycle[10,11]. This buildup triggers microglia activation, leading to the production and release of pro-inflammatory cytokines, including IL-6 and TNF-α[12]. Additionally, Aβ can stimulate the reactivation of the mitotic cycle in neurons, hastening their apoptosis[13].
Numerous investigations have indicated that tea and its functional components can delay brain aging[10,14−18]. Key active ingredients in green tea, such as catechins and theanine, are noted for their ability to prevent the accumulation of Aβ aggregates, while also providing anti-inflammatory, antioxidant, and axonal growth stimulation[16,19−22]. Black tea accounts for approximately 80% of the world's tea production and has the quality characteristics of 'red tea, red soup, red leaves, and mellow taste'[23]. Research has found that black tea can inhibit the formation of Aβ aggregates and has significant protective effects against Aβ-induced neurotoxicity[24]. In a rat model of attention deficit hyperactivity disorder (ADHD), black tea has been shown to effectively counteract Aβ-induced neurotoxicity and prevent memory loss[10,25,26]. The exact mechanisms behind black tea's protective effects in the brain remain to be fully elucidated.
This research established a neurodegeneration model of Alzheimer's disease (AD) using PC12 cells exposed to Aβ25-35 to compare the effectiveness of green tea and black teas, derived from the same batch of leaves, in mitigating Aβ-induced cellular dysfunction. Furthermore, this study employed a comprehensive metabolomic analysis of tea components, alongside network pharmacology approaches, to explore the neuroprotective qualities of both green tea and black tea.
-
The tea raw materials used in the experiment were commercially available green tea and black tea. Fresh tea leaves of the same variety and from the same period of time were used to make the tea. 3-(4,5-Dimethyl-2-Thiazolyl)-2,5-Diphenyl Tetrazolium Bromide (MTT), and Dimethyl sulfoxide (DMSO) were purchased from Sigma-Aldrich (St Louis, MO, USA). RIPA lysate, protease inhibitor mixture, and anti-fluorescence quenching agent (containing DAPI) were purchased from Beyotime Biotechnology (Shanghai, China). In addition to anti-GAPDH, anti-IL-6, anti-NF-κB, anti-Histone H3, anti-Sirt1, anti-Cyclin B1, anti-Cyclin D1, anti-Bax, anti-Bcl-2 and anti-AMPK (Cell Signaling, Boston, MA, USA), the following primary antibodies were also used for Western blot analysis: anti-multiubiquitin (UPs) (Medical & Biological Laboratories co. Ltd, Tokyo, Japan), anti-4-HNE (Millipore, Boston, USA), anti-sequestosome-1 (p62) (Epitomics, Burlingame, CA, USA), anti-Klotho (Novusbio, Littleton, USA) and anti-RAGE (Santa Cruz Biotechnology, Dallas, TX, USA). Rabbit anti-Goat IgG-HRP Antibody, Goat anti-Rabbit IgG-HRP Antibody, Goat anti-Mouse IgG-HRP Antibody were purchased from Absin Biotechnology (Shanghai, China). Western chemiluminescent horseradish peroxidase substrate was purchased from Millipore (Boston, USA).
Preparation of tea water extract
-
To accurately simulate the neuroprotective effects of tea consumption, this study utilized a simulated tea brewing method and a direct freeze-drying process to accurately preserve the components and particle structures of the tea infusion. Specifically, 100 g each of green tea and black tea were accurately weighed and placed into conical flasks containing 1 L of boiling water (100 °C), followed by a 45-min immersion in a 100 °C water bath, filtered, and then subjected to another liter of boiling water for an additional 45 min in the water bath. The infusions from each tea were combined, cooled to room temperature, pre-frozen at −20 °C for 24 h, and freeze-dried to produce green tea and black tea water extracts, subsequently stored at −20 °C.
Preparation of Aβ25-35 with different treatments
-
Aβ25-35 (1 mM), Aβ25-35 (1 mM)/green tea (1 mM) and Aβ25-35 (1 mM)/black tea (1 mM) were preincubation in sterile water for 7 d in a constant temperature incubator at 37 °C to obtain Aβ25-35, Aβ25-35/green tea, Aβ25-35/black tea proteins.
ThT signal detection
-
Thioflavin T (ThT) was used to analyze the β-sheet structure generated during amyloid aggregation[25]. Aβ25-35 (50 μM), Aβ25-35 (50 μM)/green tea (50 μg/mL) and Aβ25-35 (50 μM)/black Tea (50 μg/mL) were incubated at 37 °C for 7 d. In subsequent experiments, these groups of proteins were abbreviated as Aβ25-35, Aβ25-35/green tea and Aβ25-35/black tea, respectively. ThT was assayed as follows: 40 μL of different protein solutions and 160 μL of ThT working solution were aspirated in a 96-well plate. The fluorescence intensity was measured on a multifunctional microplate apparatus at an excitation wavelength of 440 nm and an emission wavelength of 485 nm.
Cell culture and drug treatment
-
PC12 cells were inoculated at 1 × 10⁵/mL in a culture dish containing DMEM medium with 10% FBS and incubated in a constant temperature incubator at 37 °C containing 5% CO2. The medium was changed every 2 d, and when the cells reached 60%−70% fusion rate, the cells were treated with Aβ25-35, Aβ25-35/green tea, and Aβ25-35/black tea for 24 h. For the control group (Control) cells, equal amounts of sterile water were added.
Cell viability
-
PC12 cells were seeded at 1 × 10⁴ cells/well in a 96-well plate and cultured for 24 h. Cells were incubated with the different protein samples (Aβ25-35, Aβ25-35/green tea, Aβ25-35/black tea) prepared as above and the control group was added with the same amount of sterile water. After 24 h, the cell viability of different treatment groups was detected using the MTT method[26].
ATP detection
-
Cells were inoculated in 6-well culture plates at 1.5 × 10⁵ cells/well and cultured as described above. Then the supernatant was aspirated, the cells were washed twice by adding pre-cooled PBS, and 200 μL of lysate was added, and the supernatant was collected by centrifugation (4 °C, 12,000 rpm, 5 min) to determine the ATP content (Beyotime Biotechnology, Shanghai, China).
Detection of reactive oxygen species (ROS)
-
Cells were inoculated in 6-well culture plates at a density of 1.5 × 10⁵ cells/well, and cell culture was performed as described above. The cells were collected and suspended in diluted DCFH-DA (10 μM) and incubated in a cell culture incubator at 37 °C for 20 min. The cells were washed three times with a serum-free cell culture medium to remove the DCFH-DA that had not entered the cells fully. Then, the fluorescence values were detected at 488 nm excitation wavelength and 525 nm emission wavelength using a fluorescence zymograph.
JC-1 fluorescent staining
-
Cells were inoculated at a density of 5 × 10⁴ cells/well onto cell crawls in 24-well culture plates, and cell culture was performed as described above. The supernatant was then aspirated and the cells were washed twice by adding pre-cooled PBS. Cell culture medium (250 μL) was added to each well, then 250 μL of JC-1 staining working solution was added to each well and incubated in a cell incubator at 37 °C for 20 min. 300 μL of JC-1 staining buffer (1×) was added to wash the cells twice, followed by blocking the slides with an anti-fluorescent bursting agent (containing DAPI). Images were acquired using a fluorescence microscope (Zeiss, Axio scope. A1). The average fluorescence intensity of the images was measured using ZEN software package. Three measurements were taken, each time measuring an area of the same size.
BODIPY fluorescent staining
-
Cellular lipid droplet staining was performed using the BODIPY fluorescent probe (Invitrogen, New York, USA). Cells were treated according to the methods described above. After the experiment, the cells were collected and stained strictly following the kit's instructions. Finally, photographs were taken with a fluorescence microscope (Zeiss, Axio scope. A1), and the average fluorescence intensities of different treatment groups were calculated using ZEN software.
Western blotting analysis
-
Cells were inoculated at 6 × 10⁵ cells/well in a 10 cm diameter cell culture dish, and cell culture was performed as described above. The supernatant was then aspirated, cells were washed twice by adding pre-cooled PBS, and 500 μL of RIPA lysate containing protease inhibitors and the supernatant was collected by centrifugation (4 °C, 12,000 rpm, 20 min). The protein concentration was determined by the BCA protein analysis kit (Pierce, Grand Island, NY, USA). Equal amounts of protein from each sample were separated on 8%−10% SDS-PAGE gels. Proteins from the gels were transferred to PVDF (Millipore, USA) membranes. The membranes were closed in TBST buffer containing 5% skim milk powder for 1 h. The membranes were then incubated overnight at 4 °C in the primary antibody at dilution ratios of 1:500−1:2000. After washing in TBST buffer, the membranes were incubated with appropriate secondary antibodies for 90 min at room temperature. Signals were detected using enhanced chemiluminescence (ECL) detection kit (Millipore, USA) and analyzed by Western blot densitometry using Image-J software[26].
ELISA kit detection
-
ELISA detection kits (Jiangsu Feiya Biotechnology, Yancheng, China) were used to determine the contents of GAP43 and TNF-α in the protein samples of different treatment groups prepared above.
Transcriptome analysis
-
Cell experiments were performed according to the methods above. After the experiment, the collected cell samples were snap-frozen in liquid nitrogen, frozen in dry ice, and sent to BGI Company (Shenzhen, China) for subsequent RNA-seq detection (BGISEQ-500 sequencer). In order to explore molecular pathways and networks more comprehensively from the transcriptome level, a sufficient number of differential genes (DEGs) were screened with |fold change|≥1.2 and Q ≤ 0.05 for heatmap, KEGG and gene interaction analysis. All analyses were performed using the online bioinformatics platform Dr. Tom (biosys.bgi.com/) provided by BGI.
Untargeted metabolomics of green tea and black tea
-
Pre-treatment, extract analysis, metabolite identification and quantification of green tea and black tea samples were performed at BGI-Shenzhen (Shenzhen, China) according to their standard procedures. Untargeted Metabolomics analysis was performed by UPLC-MS/MS technique using a high-resolution mass spectrometer Q Exactive HF (Thermo Fisher Scientific, USA) with separate data acquisition in both positive and negative ion modes to improve metabolite coverage. The VIP values of the first two principal components were modelled using Partial Least Squares Method-Discriminant Analysis (PLS-DA), and the results of Fold change and Student's t test obtained from univariate analysis were combined to screen for differential metabolites.
Network pharmacology
-
The screened compounds were converted into the Standard Simplified Molecular Input Line Entry System (SMILES) by Pubchem (
https://pubchem.ncbi.nlm.nih.gov/ ) and screened for drug similarity by blood-brain barrier (BBB) permeation and SwissADME calculations (www.swissadme.ch ), active compounds with a BBB of 'yes' and Bioavailability Score > 0.17 are considered to have good bioavailability. Probability > 0 was used as the screening threshold, pharmacological targets were obtained using the SwissTargetPrediction database. In the GeneCard database (www.genecards.org ), the disease genes of 'Neurodegenerative changes' were searched for intersection targets for subsequent analysis. The Venn diagram was used to evaluate the potential targets of the intersection genes of green tea and black tea with neurodegenerative changes. GO and KEGG analysis of cross-targeted genes using the 'custom analysis' module in Metascape (https://metascape.org/gp/index.html ), with species set to Homo sapiens and omicstudio (www.omicstudio.cn ) visualized KEGG analysis of target genes. PPI analysis of targets was performed by STRING database (https://string-db.org/ ), with the target species set to Homo sapiens and a confidence level greater than 0.09. Then, the PPI network was visualized using Cytoscape software (version 3.9.1), with images showing only the core targets with degree values greater than the mean or above.Statistical analysis
-
Statistical analysis was performed using the GraphPad Prism 8.01 software package. Combined with Turkey's multiple comparison test, one-way ANOVA was used to test the significance of differences, and the results were expressed as the mean ± standard deviation. p < 0.05 was significant, and p < 0.01 was judged to be extremely significant.
-
UPLC-MS/MS technology was utilized for untargeted metabolomics analysis, with data acquisition in both positive and negative ionization modes to enhance the range of detected metabolites. The base peak ion chromatograms revealed that the total ion current (TIC) profiles for metabolite identification overlapped significantly, demonstrating consistent retention times and peak intensities, which suggests reliable instrument signal stability (Fig. 1a & b). Partial least squares-discriminant analysis (PLS-DA) showed that samples of green and black tea were distinctly separated within the 95% confidence interval ellipse, effectively differentiating between the two tea varieties based on their component qualities (Fig. 1c). Utilizing criteria such as a VIP score ≥ 1, a Fold-Change range of 0.83 ≤ Fold-Change ≤ 1.2, and a q-value < 0.05, a total of 753 differential metabolites were screened. Among these, black tea demonstrated an increase in 570 metabolites and a decrease in 183 metabolites when compared to green tea (Fig. 1e). A heatmap further illustrated the propertional differences in various components between green tea and black tea (Fig. 1d).
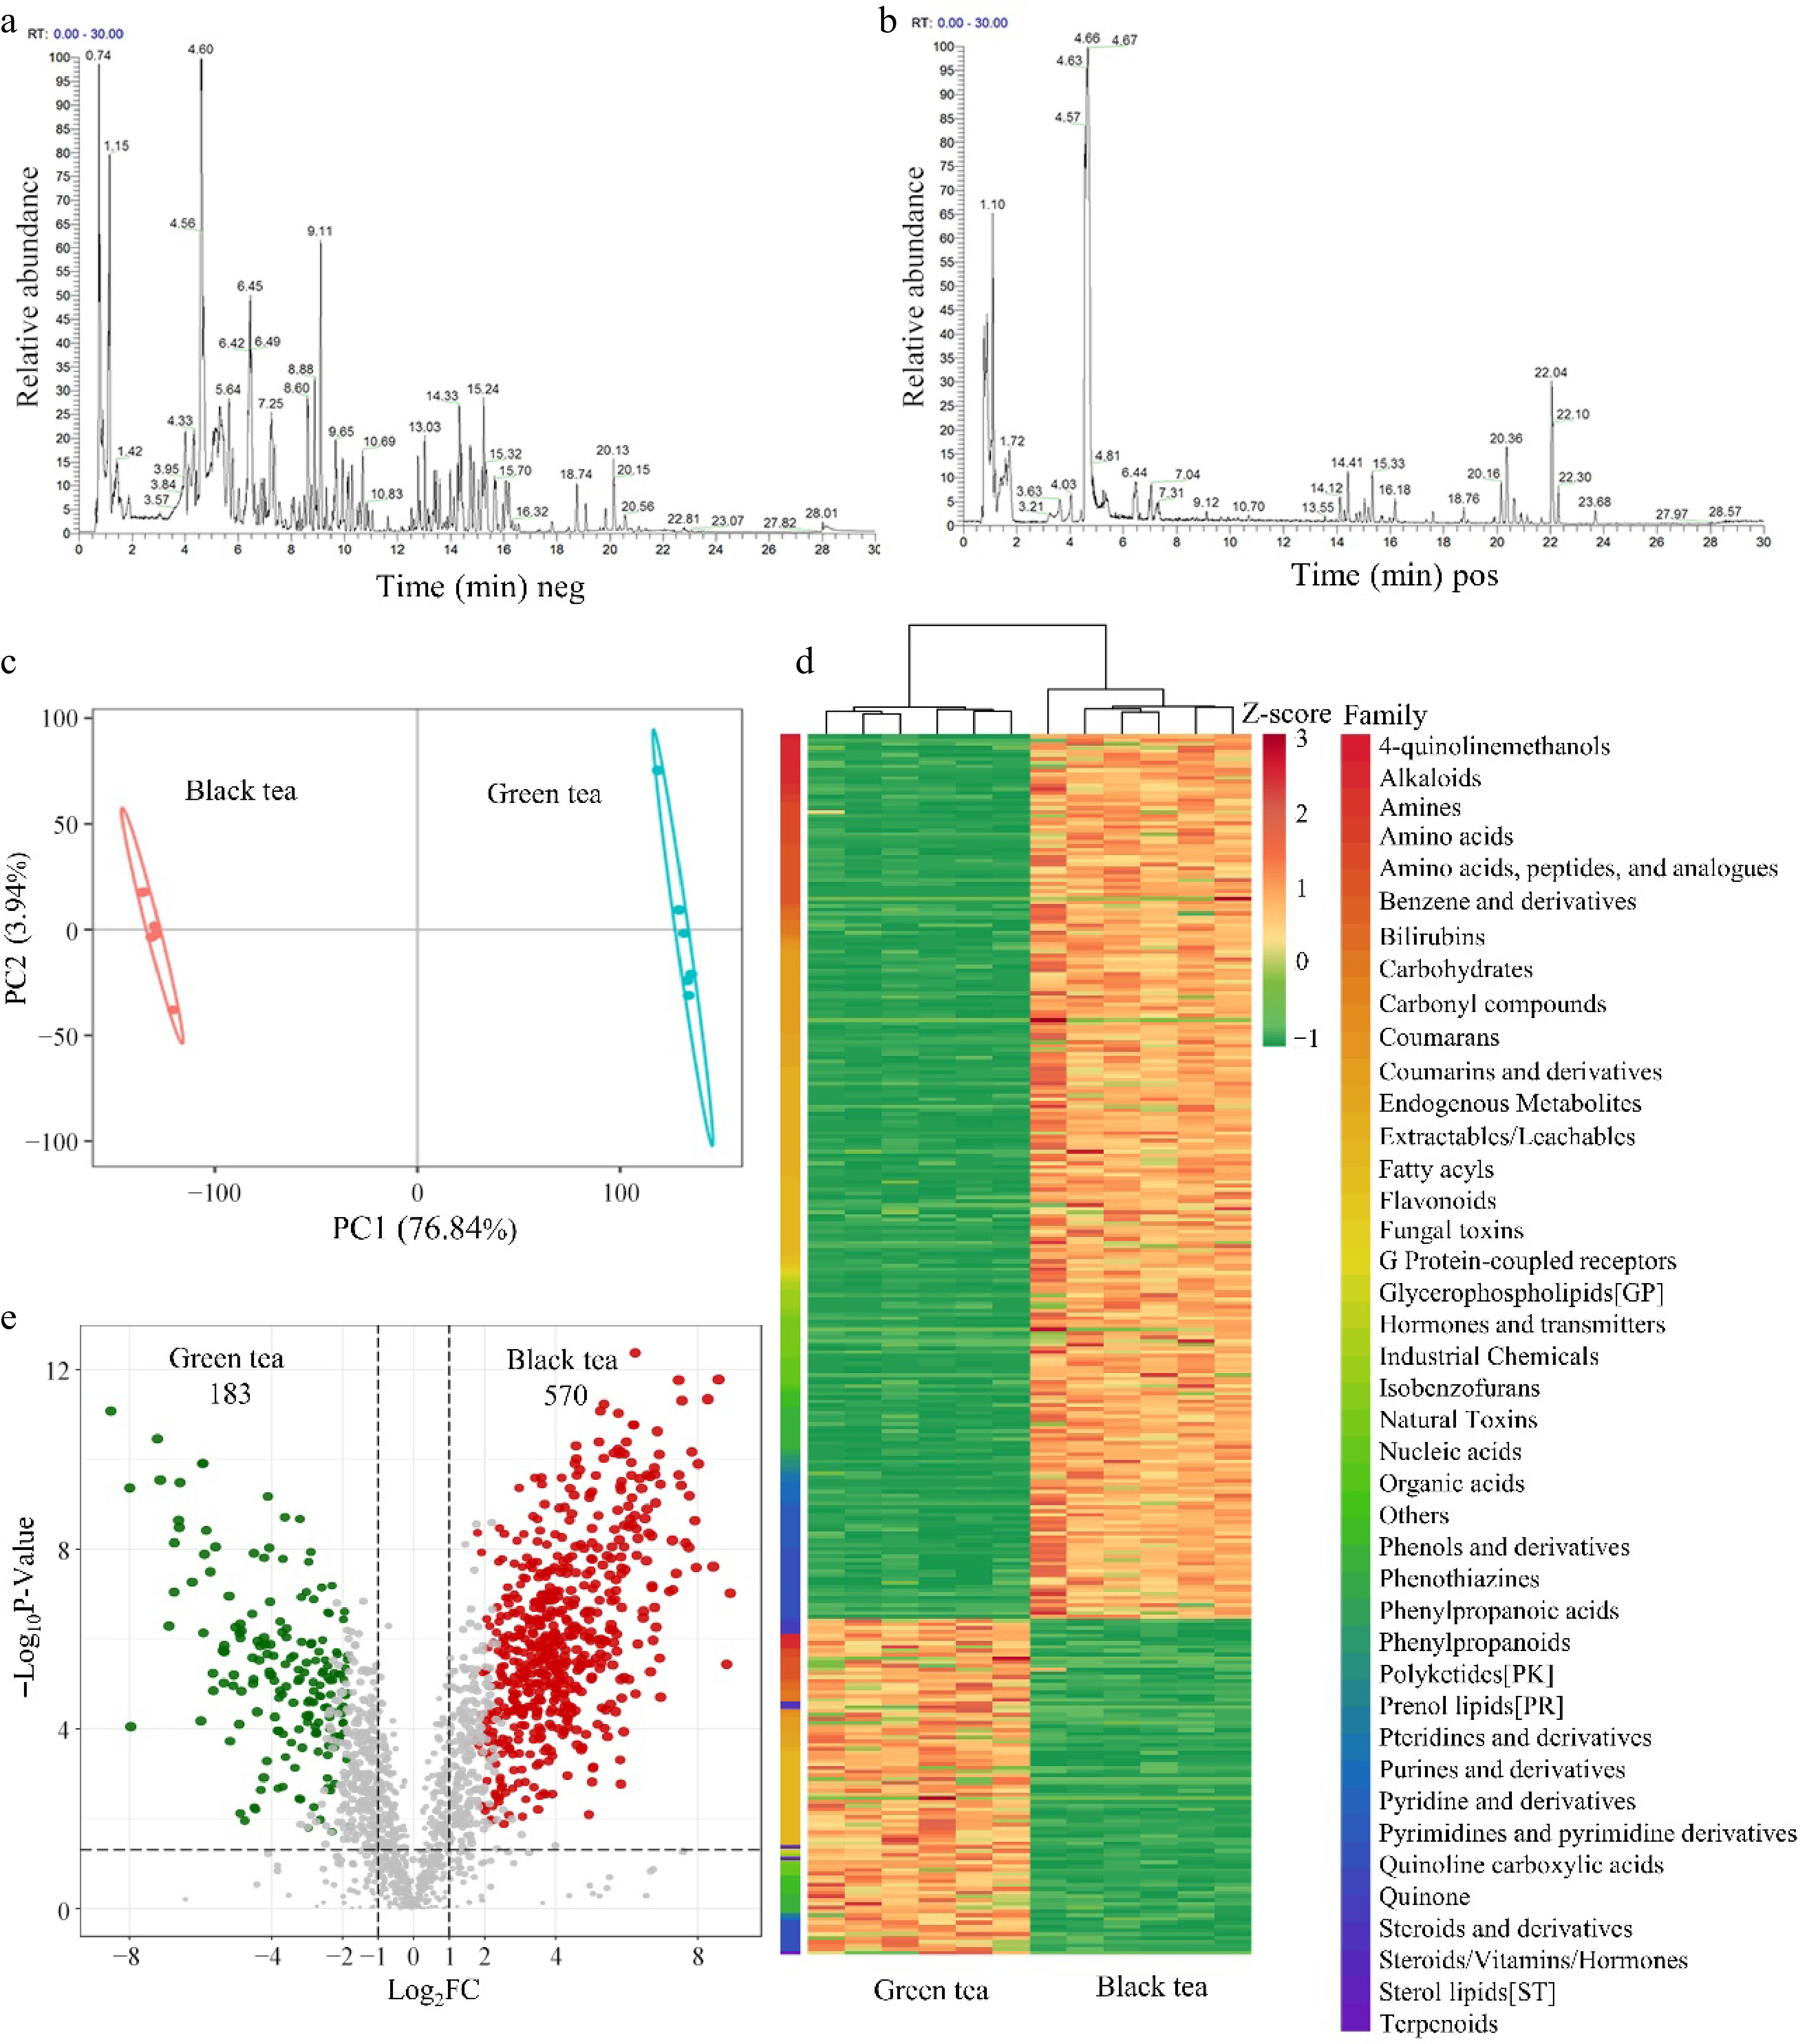
Figure 1.
Untargeted metabolomics analysis of aqueous extracts of green tea and black tea. (a), (b) Base peak ion chromatogram (BPC). (c) PLSDA Score Chart. (d) Heat map of differential metabolite clustering. Classification of compounds according to 'Family'. (e) Differential metabolite volcano map, VIP ≥ 1, 0.83 ≤ Fold-change of Difference ≤ 1.2, q-value < 0.05.
Green tea and black tea inhibit Aβ25-35-induced degenerative changes in differentiated PC12 cells
-
Research has shown that the formation of β-sheet structures plays a pivotal role in the early stages of amyloidgenesis[27,28]. Fluorescence detection revealed that the fluorescence intensity of Aβ25-35 was about sevenfold higher than that of the control (p < 0.01), suggesting a significant increase in β-sheet structures within the Aβ25-35 group. Treatment with both green tea and black tea markedly reduced the formation of these β-sheet structures (p < 0.01) (Fig. 2a). For simplicity, in the subsequent sections of the article, the treatments with Aβ25-35 (50 μM), Aβ25-35 (50 μM) combined with green tea (50 μg/ml), and Aβ25-35 (50 μM) combined with black tea (50 μg/ml) are referred to as Aβ25-35, Aβ25-35/green tea and Aβ25-35/black tea, respectively.
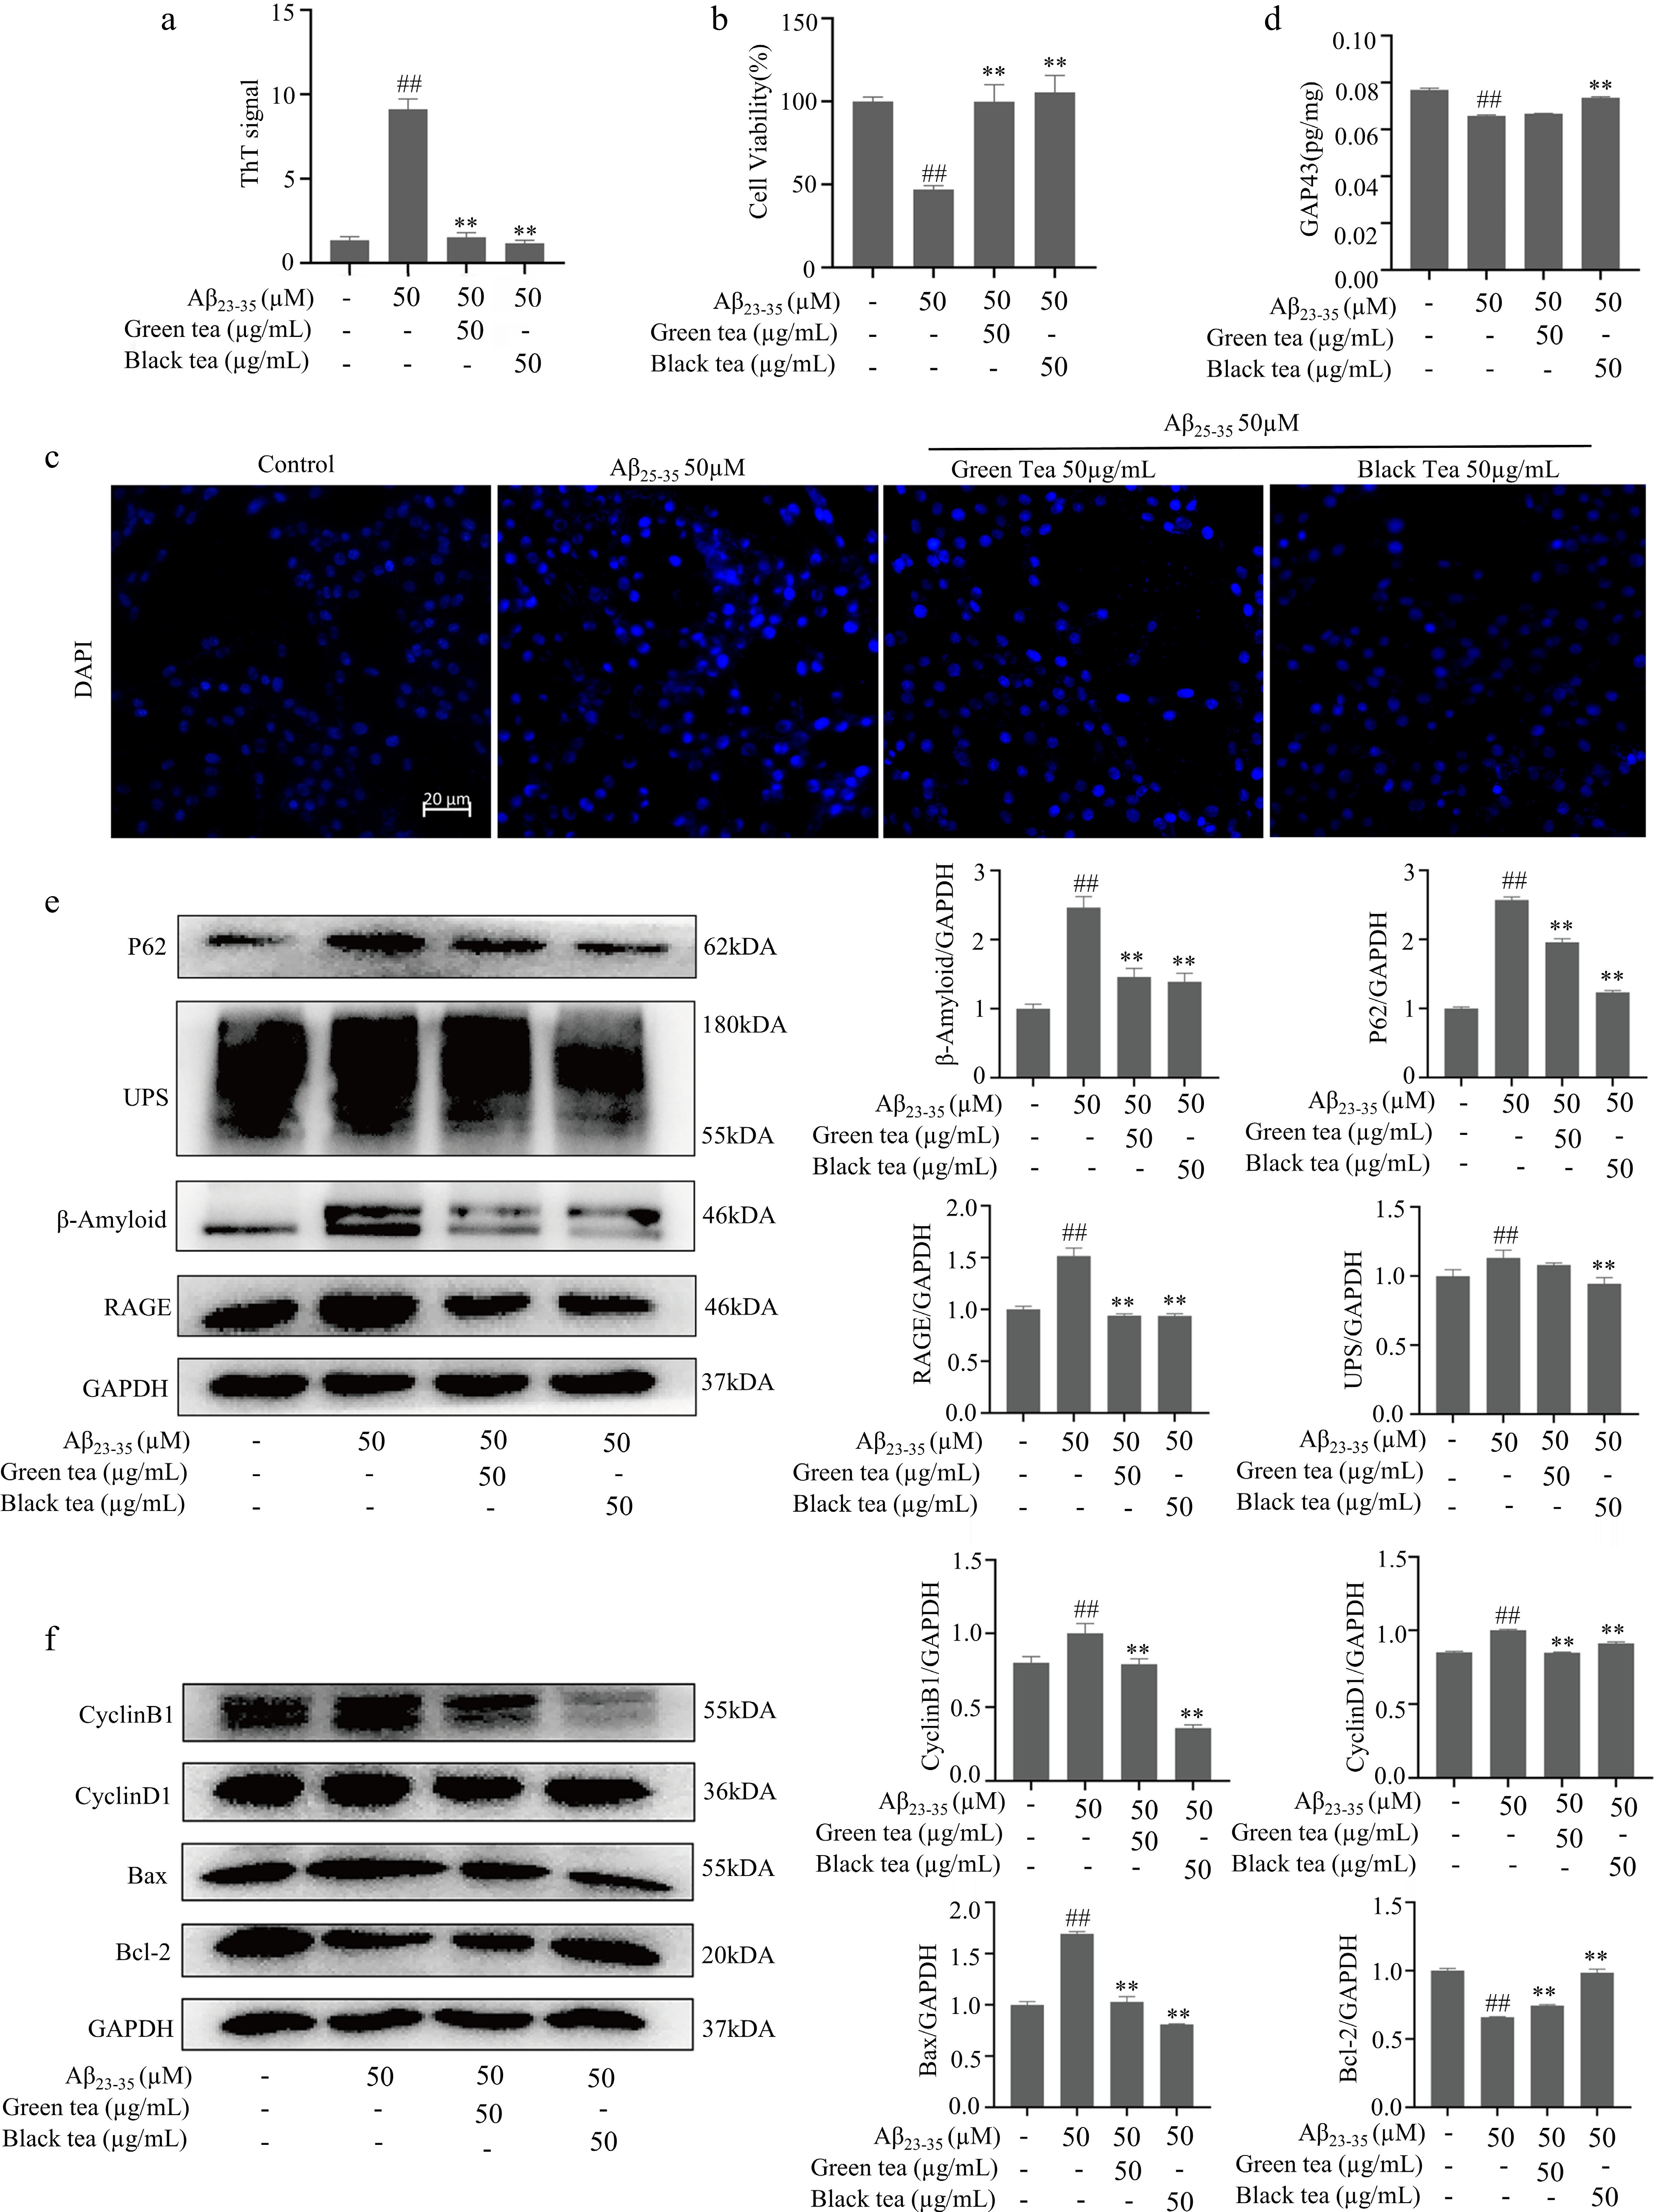
Figure 2.
Green tea and black tea inhibits Aβ25-35-induced degenerative changes in differentiated PC12 cells. (a) ThT assay for β-fold structure content of different Aβ25-35 incubated samples. (b) MTT assay for cell viability. (c) DAPI fluorescence staining (bar = 20 μm). (d) ELISA assay for GAP43 protein expression level. (e) Westen-blotting for Aβ and other protein aggregate-related pathways. (f) Westen-blotting detection of cell cycle and apoptosis-related pathways. Compared with the Control group, # p < 0.05, ## p < 0.01. Compared with Aβ25-35 group, ** p < 0.01, n = 3.
When well-differentiated PC12 cells were exposed to the various Aβ25-35 samples for 24 h, the viability of cells treated with Aβ25-35 alone decreased significantly (p < 0.01), as evidenced by enhanced DAPI staining and observations of fragmented or enlarged nuclei, indicating DNA damage. Conversely, green tea and black tea treatments significantly mitigated the toxicity induced by Aβ25-35. Notably, cell viability in the Aβ25-35/black tea group improved (p < 0.01), with DAPI staining results comparable to those of the control group (Fig. 2b & c).
The expression of GAP43 in neurons plays a pivotal role in axon elongation, synapse formation, and neural germination during development[29]. Bax and Bcl-2 are homologous water-soluble related proteins, and overexpression of Bax antagonizes the protective effect of Bcl-2, leading to cell death[30]. Cyclin B1 drives the G2/M phase transition, and Cyclin D1 regulates the G1/S phase transition, both key cell cycle regulators[31]. ELISA and Western blot analyses (Fig. 2d−f) revealed that in the Aβ25-35-treated cells, the levels of GAP43 and Bcl-2 were significantly reduced (p < 0.01), whereas the levels of Bax, p62, UPs, β-Amyloid, RAGE, Cyclin B1 and Cyclin D1 were significantly elevated (p < 0.05 or p < 0.01). Conversely, these proteins exhibited reverse expression patterns in Aβ25-35/black tea group cells. The findings suggest that Aβ25-35 contributes to axonal atrophy, apoptosis, and the accumulation of toxic aggregates, thereby leading to aberrant cell cycle activation. Black tea exhibited a notable protective effect against the toxic stress induced by Aβ25-35, performing better than green tea in this regard.
Anti-inflammatory and metabolism properties of green tea and black tea
-
Axons are rich in mitochondria, and mitochondrial dysfunction leads to neuronal axonal degeneration, the root cause of neurodegenerative diseases[32−34]. In cells treated with Aβ25-35, there was a significant reduction in mitochondrial membrane potential (MMP) and ATP levels (p < 0.01), accompanied by an increase in ROS (p < 0.01) (Fig. 3a−d). Further, ELISA and Western blot assays showed that Aβ25-35 promoted the nuclear translocation of NF-κB (p < 0.01), elevated the levels of TNF-α (p < 0.01), and decreased AMPK and Sirt1 protein levels (p < 0.01) (Fig. 3e & f). BODIPY staining for lipid droplets demonstrated that Aβ25-35 treatment led to increased cellular lipid deposition (p < 0.01) (Fig. 3g & h). These findings imply that Aβ25-35 triggers inflammatory pathways and suppresses cellular metabolism. Black tea exhibited a notable protective effect against mitochondrial damage, reduced inflammation and lipid accumulation, and enhanced cellular metabolic functions (p < 0.01), outperforming green tea in these respects.
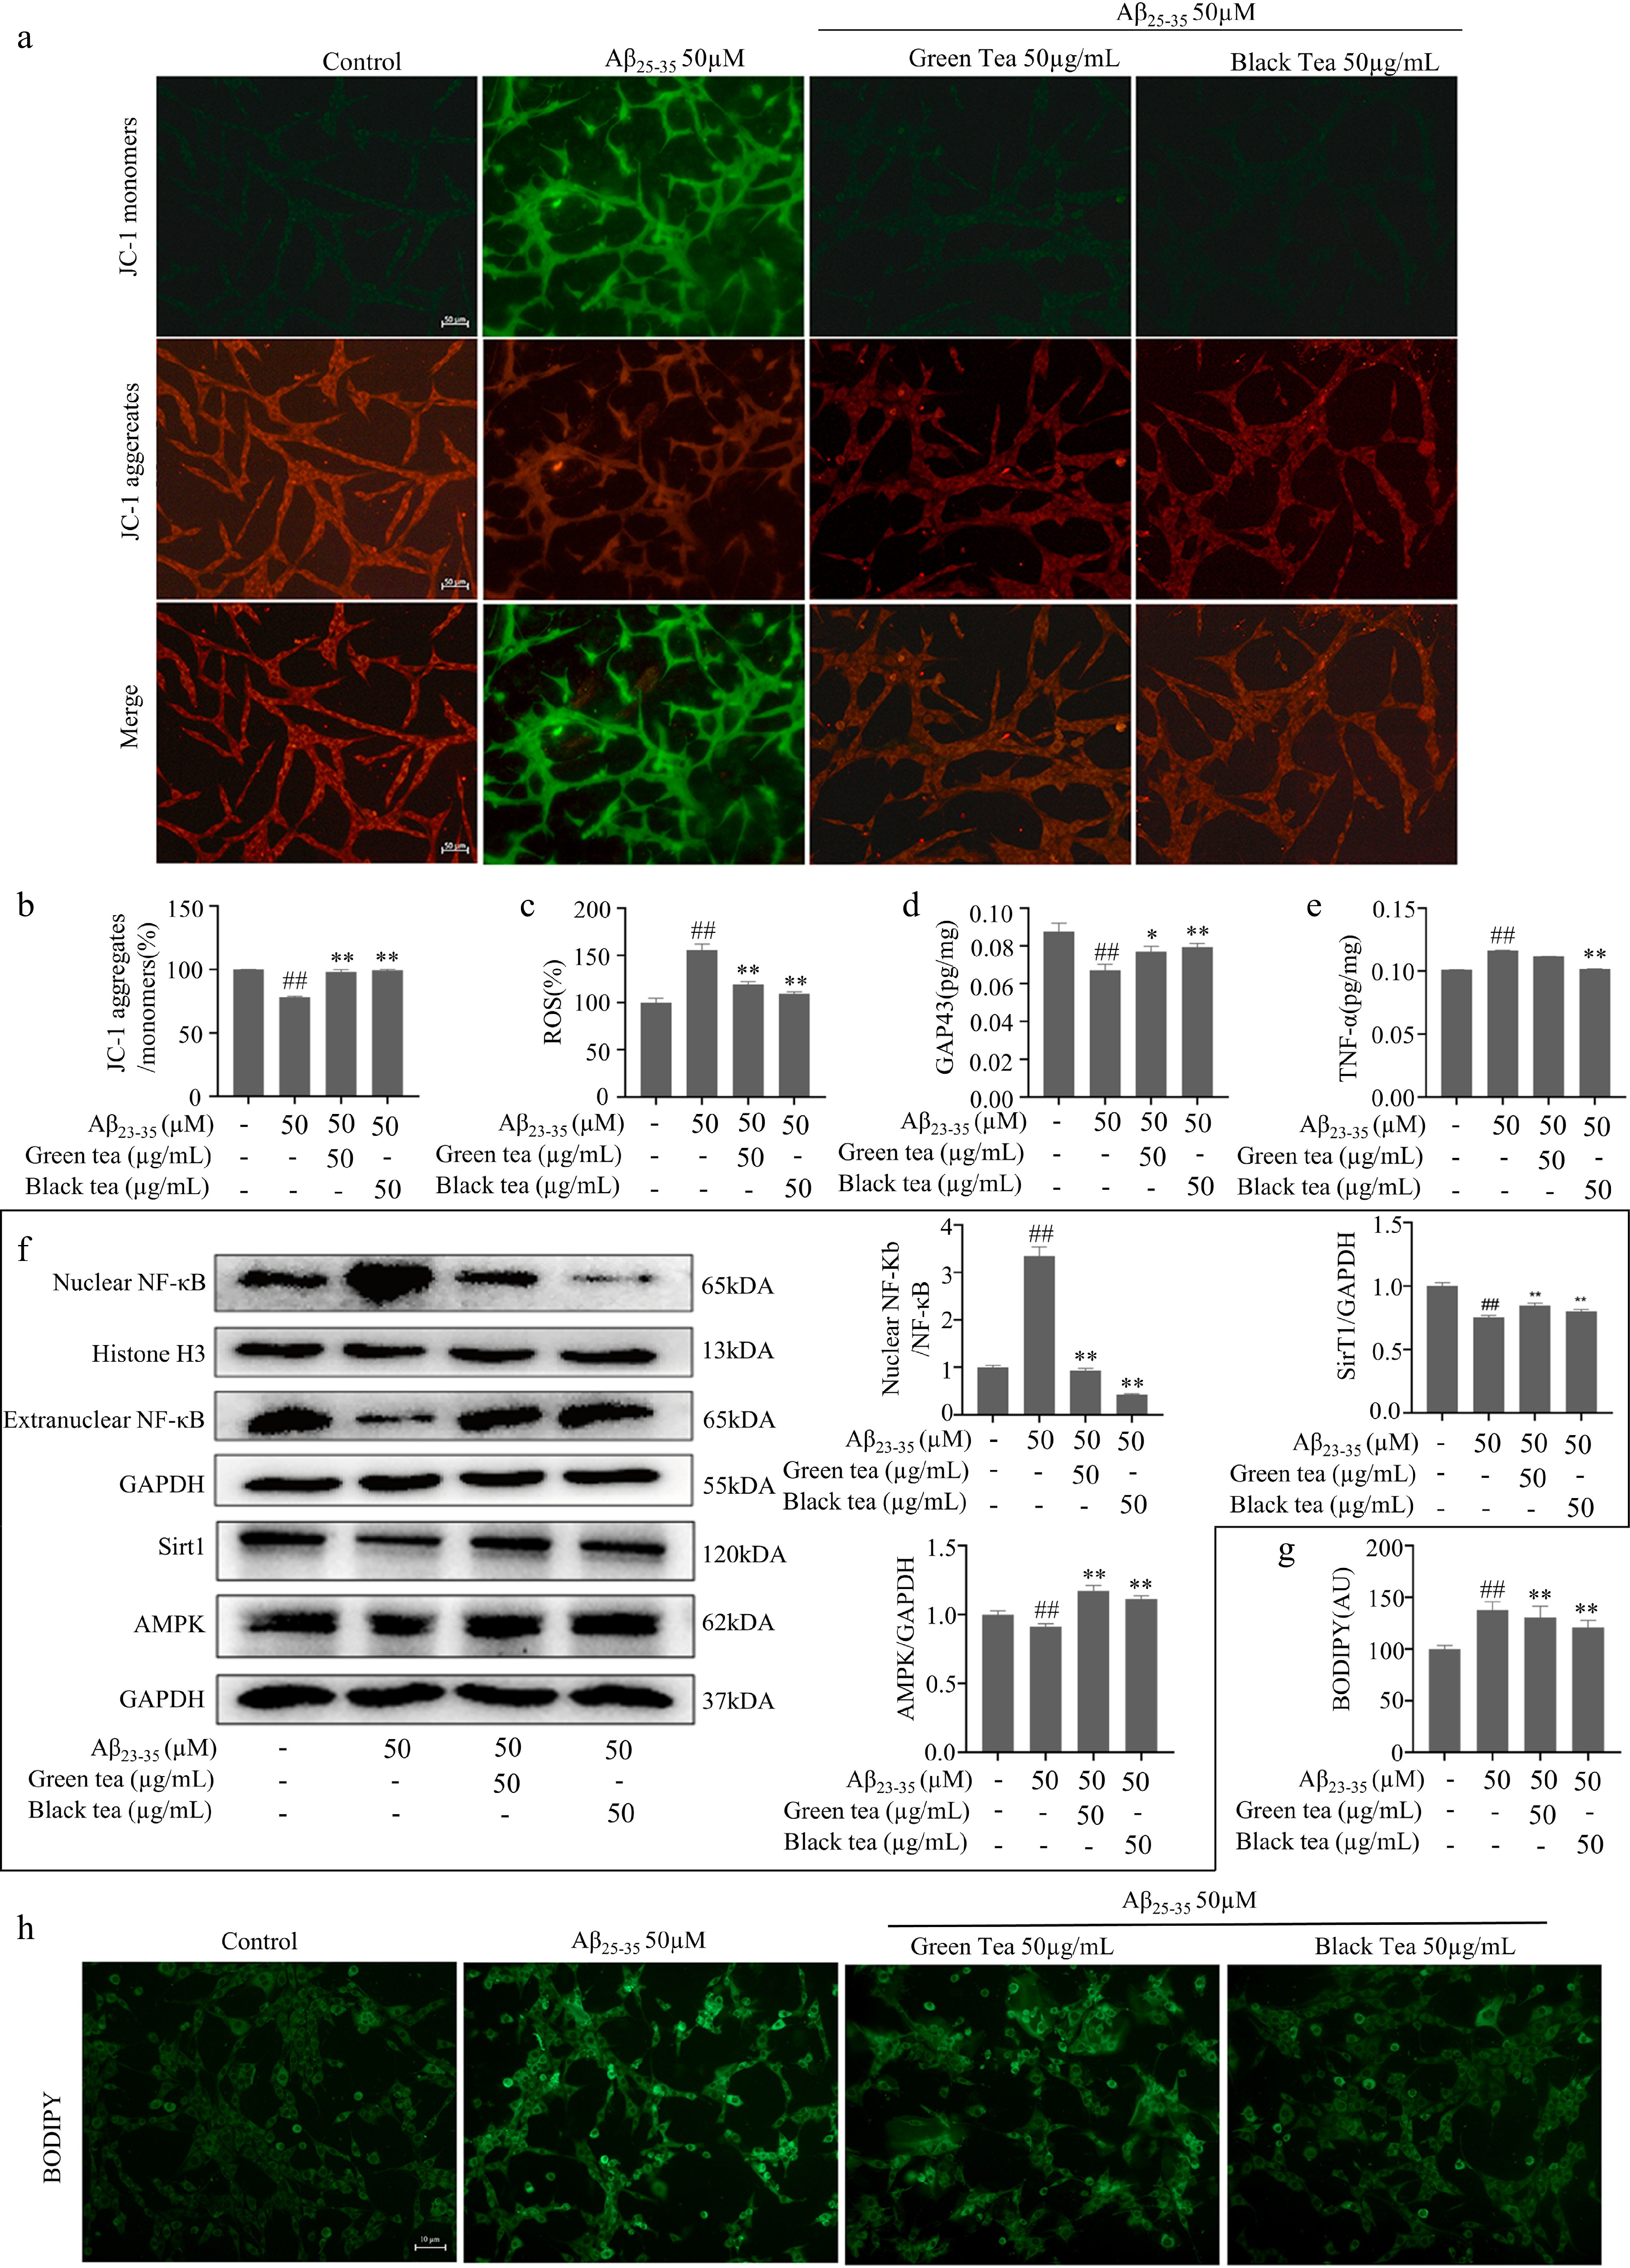
Figure 3.
Anti-inflammatory and metabolism-promoting functions of green tea and black tea. (a), (b) JC-1 staining plot with statistics (bar = 50 μm). (c) Fluorescence enzyme marker for ROS level. (d) ATP content assay. (e) ELISA for cellular TNF-α protein expression level. (f) Western-blotting for inflammation and energy metabolism-related pathways. (g), (h) BODIPY fluorescence staining with statistics for lipid droplets (bar = 10 μm). Compared with the Control group, ## p < 0.01; Compared with the Aβ25-35 group, * p < 0.05, ** p < 0.01, n = 3.
Green tea and black tea mitigate neurodegeneration at the transcriptomic level
-
In comparison to the Aβ25-35 group, the DEGs in both the Aβ25-35/green tea and the Aβ25-35/black tea groups were significantly increased, with the DEGs in the Aβ25-35/black group being approximately 2.9 times higher than those in the Aβ25-35 group (Fig. 4a). KEGG pathway analysis revealed that these DEGs were predominantly involved in processes such as ribosomes function, related neurodegeneration, oxidative phosphorylation, AGE-RAGE signaling pathway, RNA transport, and DNA replication, among others (Fig. 4b−d).
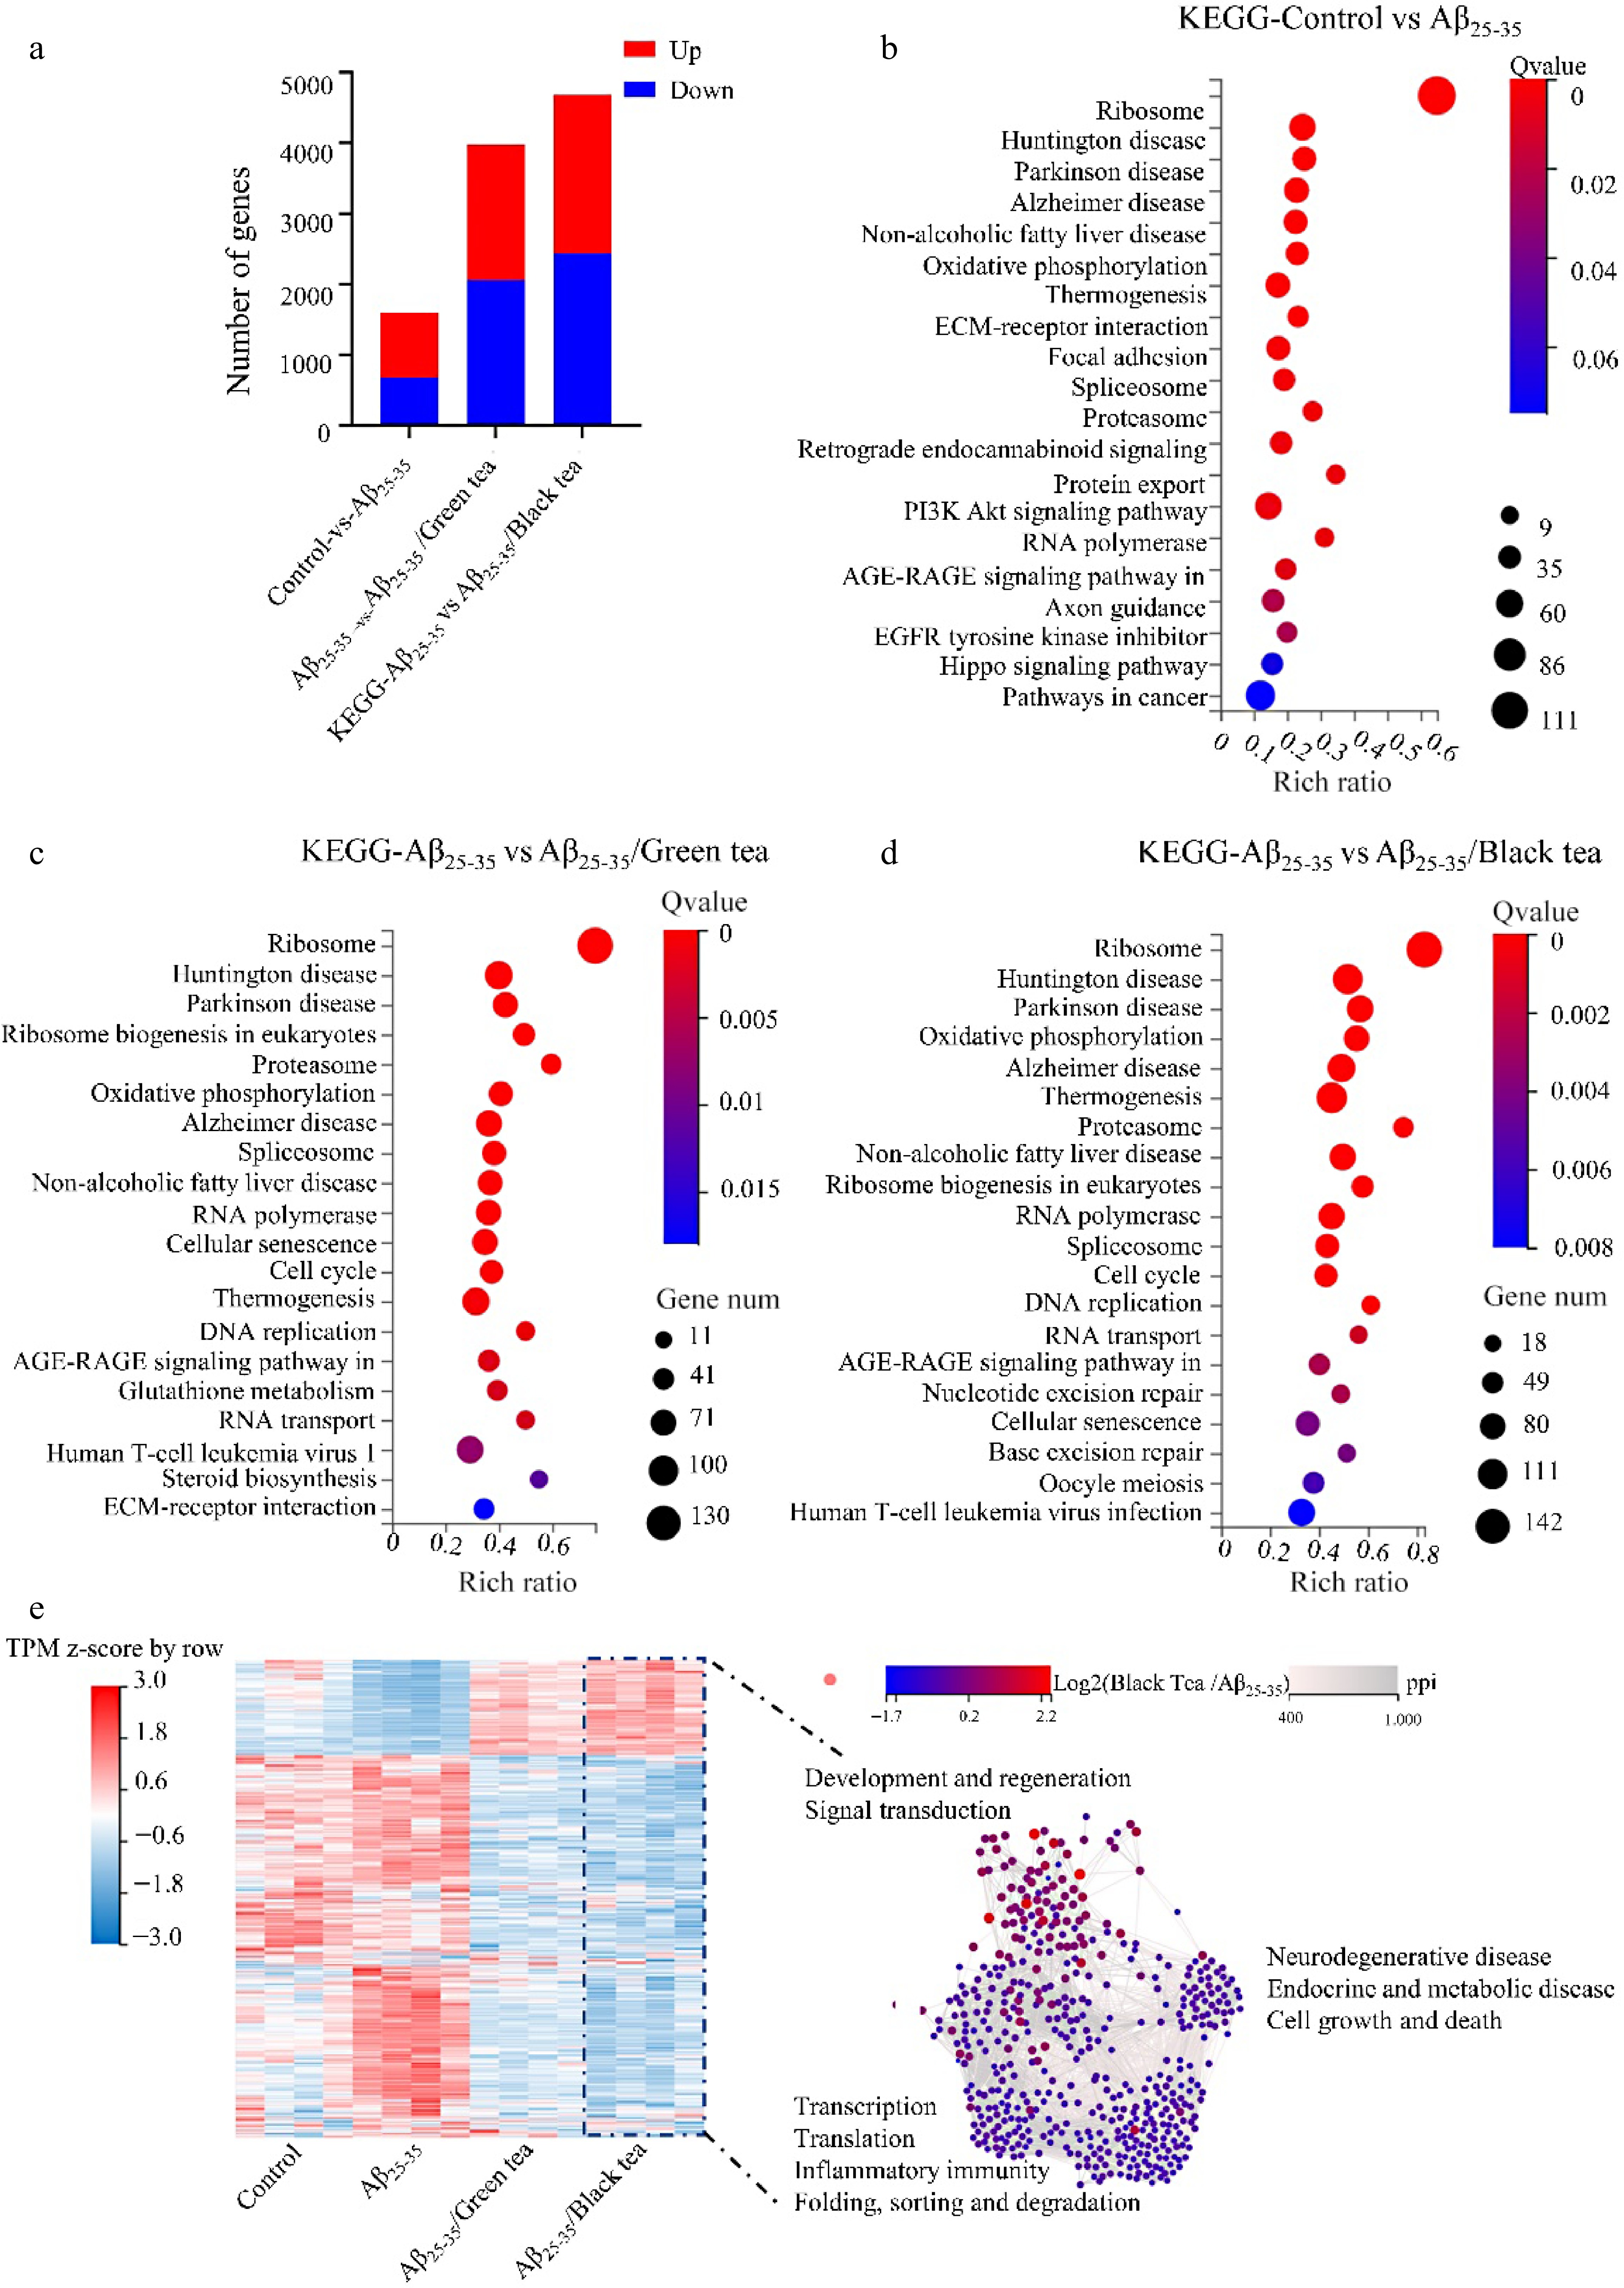
Figure 4.
Transcriptome analysis of different treatment groups. (a) Comparative analysis of DEGs between groups. (b)−(d) KEGG analysis of DEGs in different treatment groups. (e) Heatmap and interaction network analysis of DEGs in different treatment groups with DEGs of Aβ25-35/black tea as a reference.
Heatmap and protein-protein interaction network (PPI) analysis of DEGs in different treatment groups with DEGs of Aβ25-35/black tea as a reference. The expression patterns of DEGs in the tea-treated groups counteracted those observed in the Aβ25-35 group. Specifically, the DEGs in the Aβ25-35/black tea group predominantly enhanced pathways related to signal transduction, cell growth, and regeneration, while suppressing pathways associated with neurodegeneration, translation, transcription, protein folding, sorting and degradation, as well as networks related to endocrine and metabolic diseases. Moreover, black tea’s impact on the transcriptome was more pronounced than that of green tea (Fig. 4e).
Exploring the neuroprotective active compounds of green tea and black tea through network pharmacology
-
To uncover the neuroprotective mechanisms of green tea and black tea on highly differentiated neuronal cells, network pharmacology approaches were employed to identify potential targets and pathways. Utilizing ADME (Absorption, Distribution, Metabolism, and Excretion) criteria, specifically a Bioavailability Score greater than 0.17, 46 active components in green tea and 155 in black tea that were upregulated were identified. Among these, 66 compounds from black tea and 14 from green tea were predicted to cross the blood-brain barrier (detailed compound information is provided in Supplemental Tables S1 & S2). The investigation highlighted 389 potential targets for green tea and 455 for black tea in combating neurodegenerative changes. GO (Gene Ontology) enrichment analysis revealed that both green tea and black tea target processes related to phosphorylation and protein kinase activity. Notably, green tea was associated with phosphotransferase activity, and alcohol group as acceptor, whereas black tea was linked to protein phosphorylation (Fig. 5a & b). KEGG analysis showed that the potential targets of both teas significantly impacted pathways involving neuroactive ligand-receptor interaction, cancer, PI3K-Akt signaling pathway, lipid and atherosclerosis, and MAPK signaling pathway. Despite the similarity in targeted pathways, black tea was found to enrich a greater number of genes within these pathways compared to green tea (Fig. 5c& d).
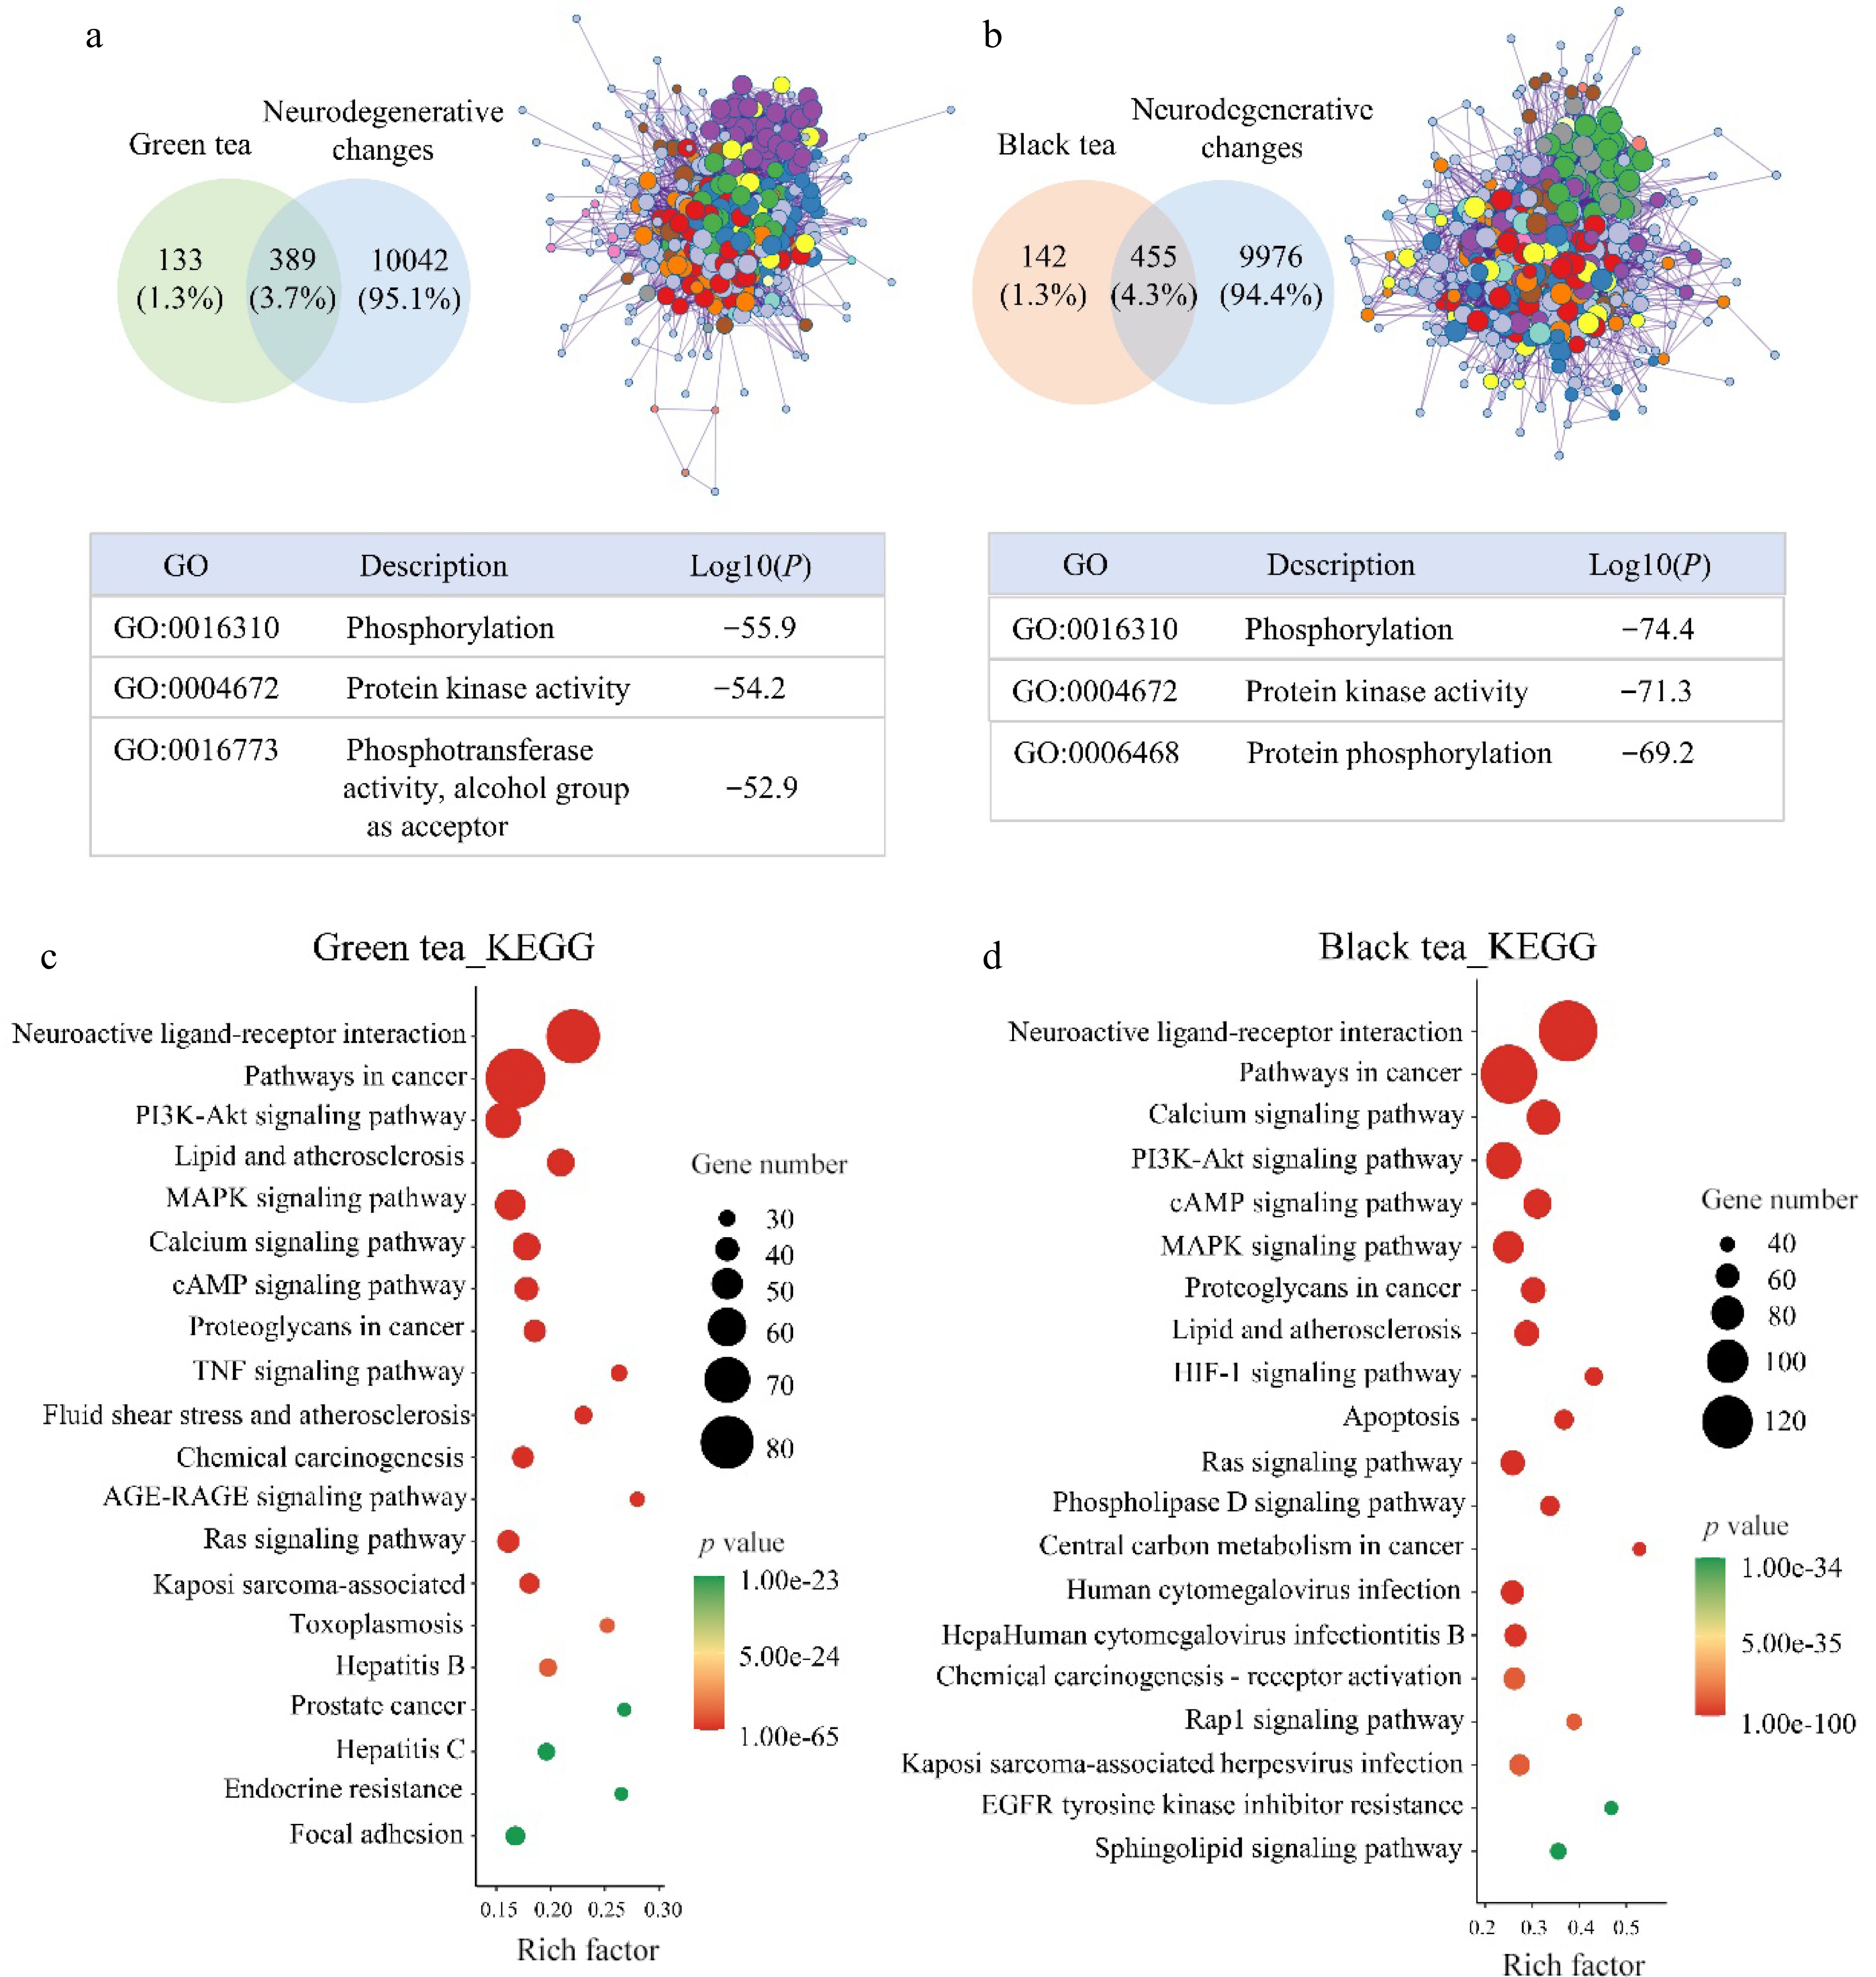
Figure 5.
Network pharmacological analysis of green tea and black tea against neurodegenerative changes. (a), (b) VENN and GO analysis. (c), (d) KEGG analysis.
The analysis of active component-target interaction maps revealed that green tea combats neurodegenerative changes through key components such as benzene and its derivatives, endogenous metabolites, nucleic acids, amino acids, alkaloids, coumarins, terpenoids. Black tea, while encompassing these types of components, also includes organic acids, lipids, phenolic acids, and flavonoids, offering a wider and more varied spectrum of neuroprotective targets. Black tea stands out with 113 main differential active compounds, compared to green tea’s 77, showcasing a greater diversity through higher compound interconnectivity. This suggests that black tea exhibits more complex biological activities (Fig. 6) (details of the compounds are provided in Supplemental Tables S3 & S4). SRC, identified as a pivotal target of black tea, is integral to central nervous system development and prevalent in neurons, highlighting black tea's nuanced neuroprotective capabilities[35].
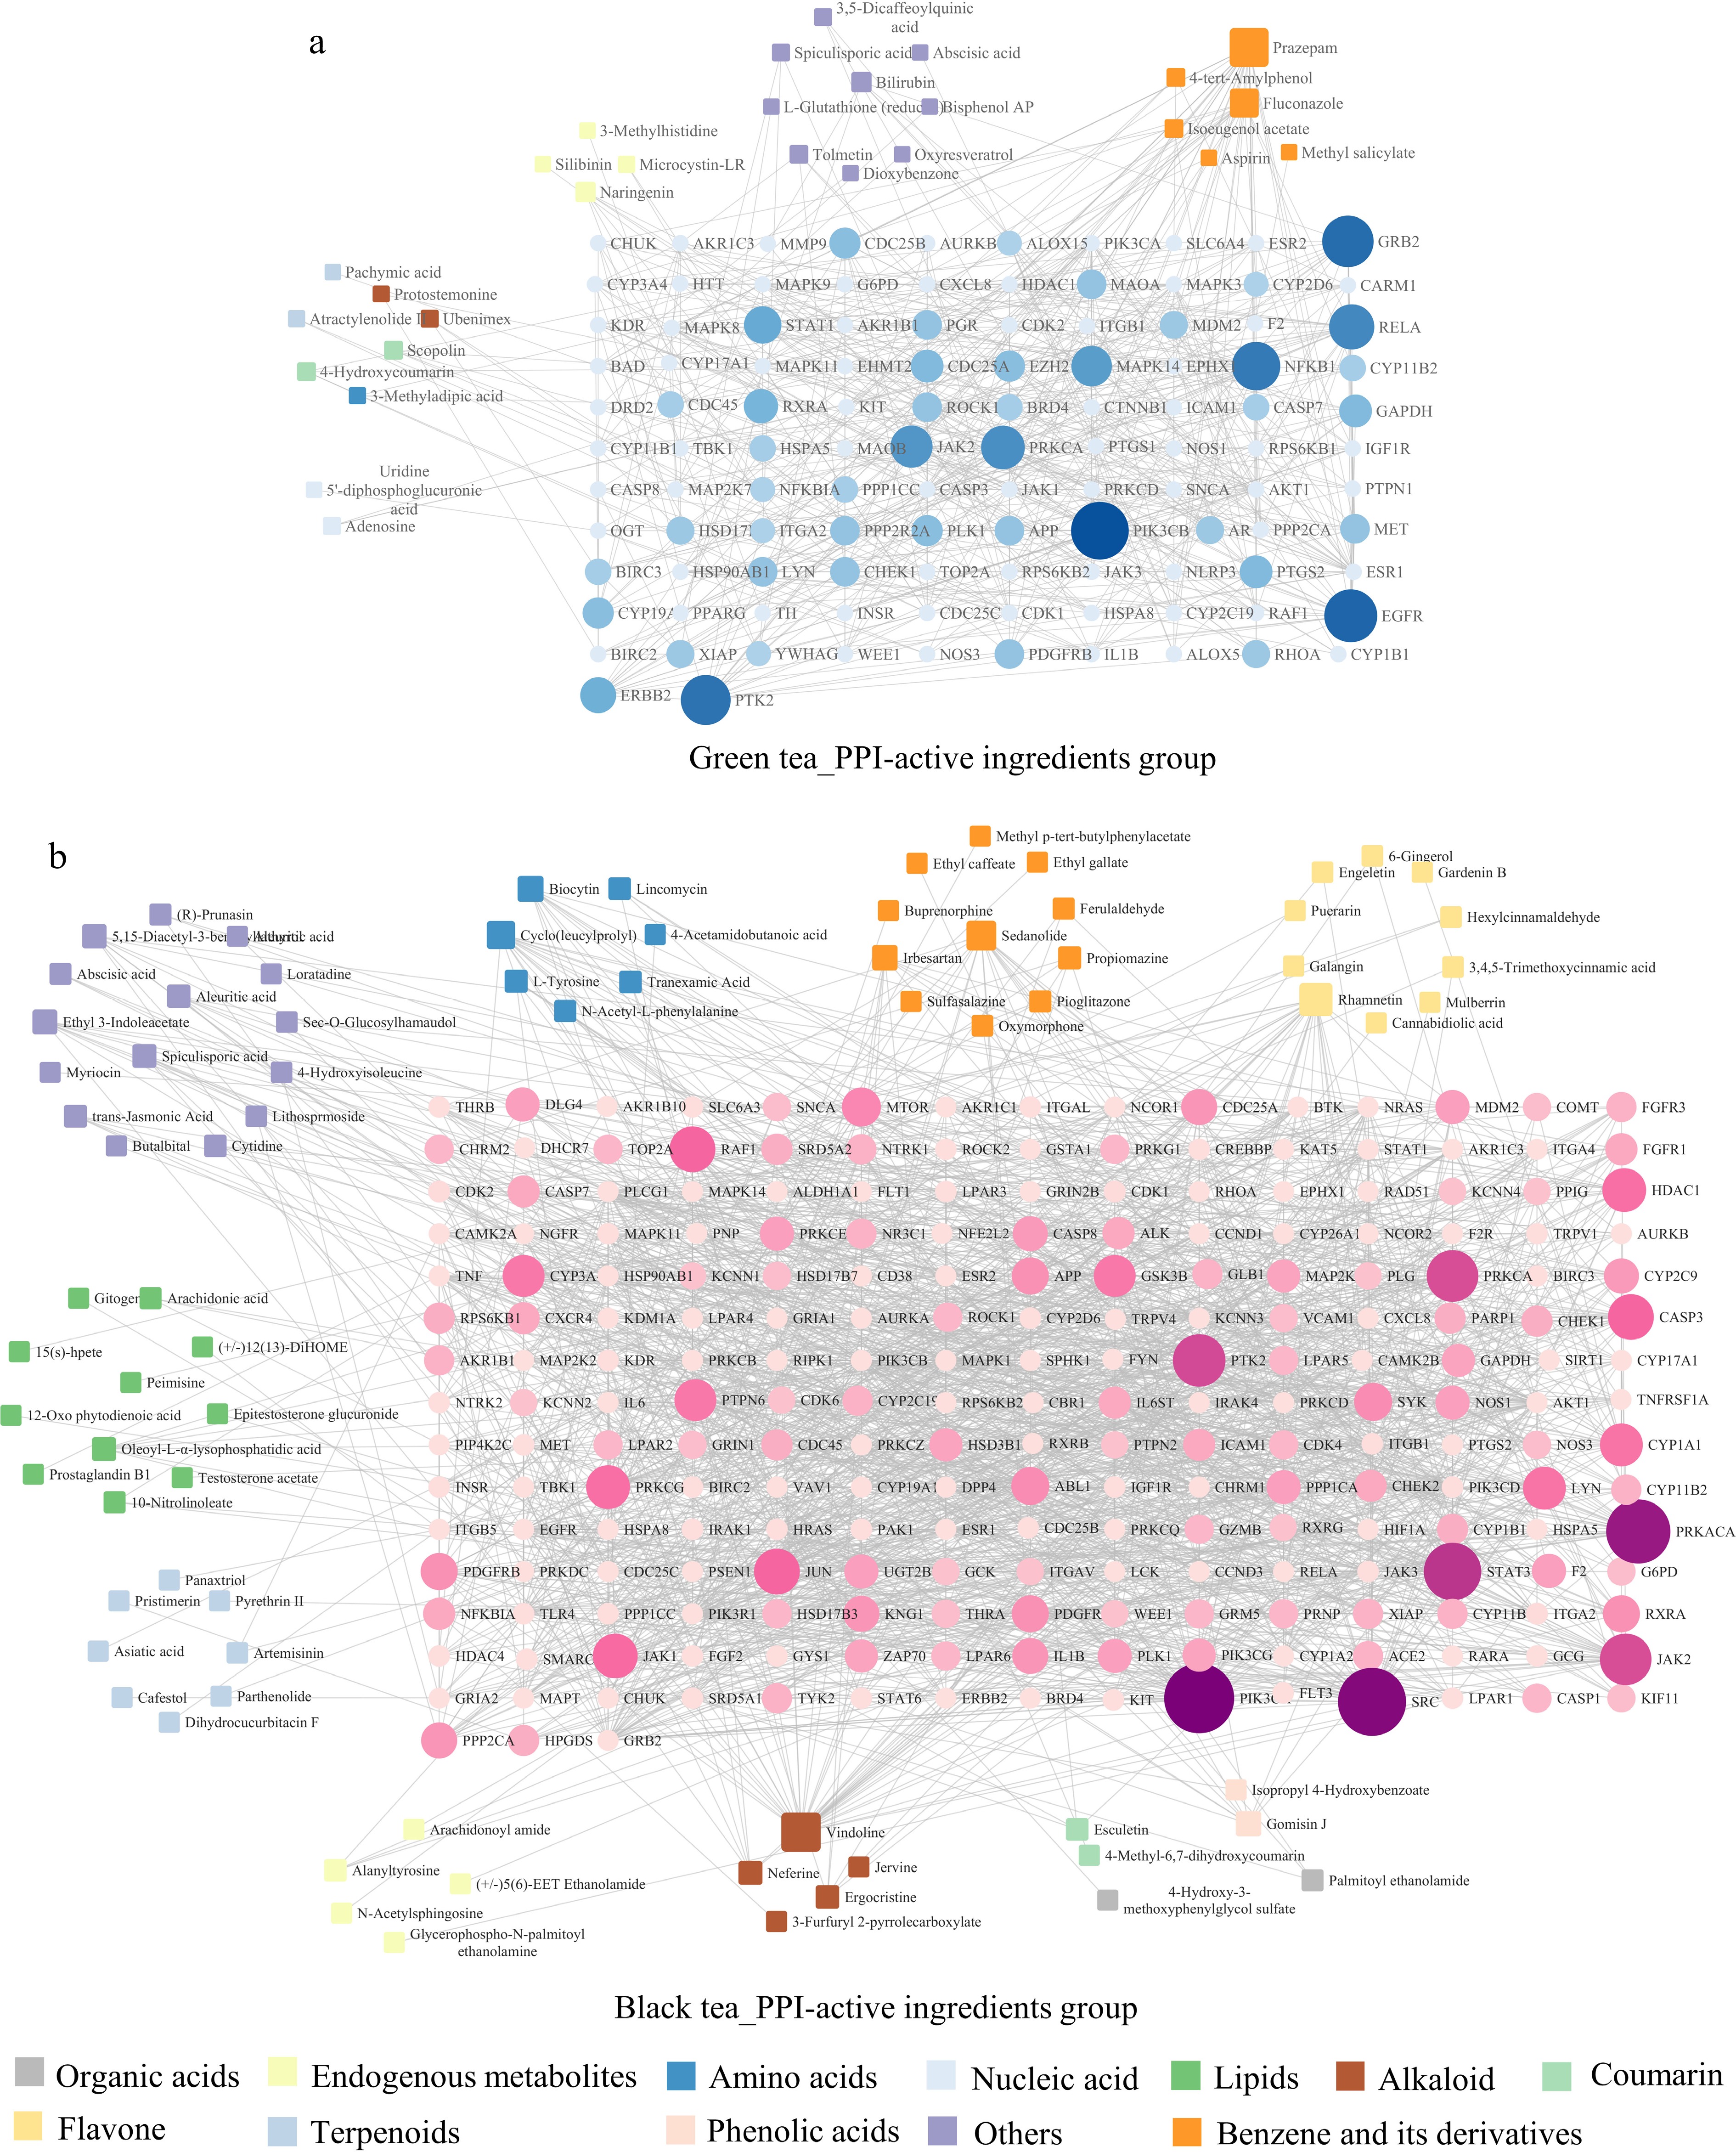
Figure 6.
Network diagram of the active component-key target of green tea and black tea in the intervention of neurodegenerative changes. (a) Association analysis plot for green tea's differential active components with protein-protein interactions (PPI). (b) Similar plot for black tea. Circles in the diagram now represent target genes, with their size and color intensity indicating the extent of their network connections and interaction strength, respectively. Quadrilaterals represent active components, with their size reflecting the degree of linkage to other genes.
-
This research indicates that both green tea and black tea share similar protective mechanisms against Aβ25-35-induced neurodegenerative changes in PC12 cells. Yet, black tea outperforms green tea in safeguarding mitochondria, preventing DNA damage, reducing lipid accumulation, and hindering the formation of aggregates (Figs 2 & 3). Further, transcriptomic analysis and network pharmacology studies suggest that black tea impacts a wider and more complex network of transcriptome and cellular signaling pathways, showcasing a richer array of bioactive compounds indicating a greater variety of bioactive components (Figs 4& 6).
Aβ’s multiple toxic effects on neurons include inducing apoptosis, which contributes to neuronal loss[36]; and mitochondrial accumulation, which disrupts normal function[37]. These findings align with our study’s outcomes. Black tea pre-incubation can attenuate Aβ25-35-induced apoptosis of PC12 cells, enhance cell viability, and downregulate the expression of apoptotic pathway-related proteins (Fig. 2f). Mitochondrial dysfunction plays a key role in aging-related neurodegenerative diseases[38]. Aβ can impair neuronal function by damaging mitochondrial electron transport chains and inhibiting ATP production[39]. Our findings show that the pre-incubation with black tea significantly restores mitochondrial membrane potential, increases ATP levels, and elevates the expression of proteins in energy-metabolism pathways (Fig. 3a, d−f). For highly differentiated cells to undergo normal differentiation and maintain physiological functions, they must remain in a stationary phase of their cycle. Promoting axonal differentiation has been identified as crucial in combating neurodegenerative diseases[40]. Black tea appears to prevent neuronal degeneration by enforcing cycle arrest, outperforming green tea in this regard and aligning with previous research findings.
Oxidative stress induced by Aβ leads to the oxidation of polyunsaturated fatty acids (PUFAs) in cell membranes through free radical chain reactions, resulting in the formation of lipid hydroperoxides such as 4-HNE[41]. These lipid hydroperoxides, including 4-HNE, can bind to nucleophilic functional groups in proteins, nucleic acids, and membrane lipids, thereby contributing to the impairment of autophagy[41]. When autophagy is disrupted, protein aggregates and damaged organelles accumulate within cells[42,43], leading to the cellular buildup of p62 and ubiquitin-modified proteins[44,45]. Black tea treatment effectively reduces the levels of ubiquitin- and p62-modified proteins, and suppresses inflammatory pathways (Fig. 2e & 3f).
Excessive lipid storage is closely associated with metabolic abnormalities[46]. The accumulation of lipids in microglial cells can induced a pro-inflammatory state, hindering the repair mechanisms of the central nervous system. The proper management of lipid storage within cells is crucial for the maintenance of cellular energy balance[47,48]. Black tea has been shown to more effectively reduce the aberrant lipid accumulation induced by Aβ in PC12 cells compared to green tea (Fig. 3h).
Given the prolonged half-lives of proteins in the brain, changes in mRNA translation can have enduring impacts on neuronal cells and potentially contribute to disease processes[49,50]. The biogenesis of ribosomes, which is critical for both the growth and upkeep of neuronal cells, is compromised under amyloid stress, leading to neuronal atrophy and loss of synaptic connections[49−52]. Hence, targeting the dysregulation in protein synthesis might offer a viable strategy for restoring neuronal functionality. Transcriptome data revealed that black tea counters the disruptions in ribosome-related pathways induced by Aβ25-35. Analysis of DEGs suggested that black tea predominantly enhances axonal growth and signaling pathways, while it diminishes pathways involved in neurodegeneration, translation, and protein folding (Fig. 4e).
Black tea exhibited significant metabolic regulation through the synergistic action of multiple components. The neurodegenerative mechanisms of green tea and black tea were explored using network pharmacology, highlighting how both teas influenced similar signaling pathways. However, the pathways influenced by black tea were characterized by a notably higher count of DEGs (Fig. 5c & d). Analysis of the effective component-target interactions showed that black tea, compared to green tea, contains distinctive components such as organic acids, lipids, phenolic acids, and flavonoids. The metabolic pathways affected by these components are more complex and interconnected (Fig. 6). Notably, the green tea and black tea used in our experiments were derived from the same raw materials harvested in early spring. Differences in the content of common active components like amino acids and caffeine between the two types of tea were minimal, leading to their exclusion from the differential metabolite analysis.
In our investigation, we employed in vitro cell models to assess the neuroprotective properties of green tea and black tea, with a focus on Homo sapien target genes in network pharmacology analysis. Our findings indicated that black tea impacts a wider array of genes, pointing to a more potent anti-neurodegenerative activity. Nonetheless, these results should be approached with caution. Given the complexity of neurodegenerative conditions and the myriad of bioactive compounds present in tea, further confirmation via animal studies is imperative. Future research will extend to in vivo experiments to validate the neuroprotective efficacy of black tea and to elucidate its underlying mechanisms more thoroughly. This strategy aims to provide clearer insights into our findings and bolster the evidence supporting black tea's contribution to neuroprotection.
-
The authors confirm contribution to the paper as follows: methodology, data curation: Wu H, Wan J; investigation, visualization: Yuan J, Xie M, Nie Q; draft manuscript preparation: Wu H, Wan J, Cai S; manuscript review: Cai S; resources: Liu Z; funding acquisition, supervision: Liu Z, Cai S. All authors reviewed the results and approved the final version of the manuscript.
-
Due to administrative requirements, the datasets generated and/or analyzed during this study are not publicly available, but can be obtained from the corresponding author upon reasonable request.
This research was funded by the Guangxi Innovation Driven Development Special Fund Project (No. AA20302018), the National Key R&D Program of China (2018YFC1604405), the Key R&D Program of Hunan Province (2020WK2017), National Tea Industry Technology System Research Project of China (CARS-19-C01), National Natural Science Foundation Project of China (31471590, 31100501), and Self-Science Foundation of Hunan Province, China (2019jj50237).
-
The authors declare that they have no conflict of interest. Zhonghua Liu is the Editorial Board member of Beverage Plant Research who was blinded from reviewing or making decisions on the manuscript. The article was subject to the journal's standard procedures, with peer-review handled independently of this Editorial Board member and the research groups.
-
# Authors contributed equally: Huan Wu, Juan Wan
- Supplemental Tables S1 Compound information in green tea (GT).
- Supplemental Tables S2 Compound information in black tea (BT).
- Supplemental Tables S3 Analysis of the main differential active ingredients associated with neurodegenerative changes PPI in green tea (GT) compared to black tea (BT).
- Supplemental Tables S4 Analysis of the main differential active ingredients associated with neurodegenerative changes PPI in black tea (BT) compared to green tea (GT).
- Copyright: © 2024 by the author(s). Published by Maximum Academic Press, Fayetteville, GA. This article is an open access article distributed under Creative Commons Attribution License (CC BY 4.0), visit https://creativecommons.org/licenses/by/4.0/.
-
About this article
Cite this article
Wu H, Wan J, Yuan J, Xie M, Nie Q, et al. 2024. Neuroprotective comparisons and bioactive profiles of green tea and black tea: in vitro cellular experiments, metabolomics, and network pharmacology analysis. Beverage Plant Research 4: e017 doi: 10.48130/bpr-0024-0019 

Neuroprotective comparisons and bioactive profiles of green tea and black tea: in vitro cellular experiments, metabolomics, and network pharmacology analysis
- Received: 12 January 2024
- Revised: 26 March 2024
- Accepted: 07 April 2024
- Published online: 20 May 2024
Abstract: This study aimed to compare the neuroprotective effects of green tea and black tea, made from the same raw materials, on an Aβ25-35-induced PC12 cell model, using Ultra-High Performance Liquid Chromatography-Tandem Mass Spectrometry (UPLC-MS/MS) and network pharmacology approaches. This addresses the gap in current research, which has extensively explored the neuroprotective properties of green tea and its components but has paid less attention to black tea. The findings indicate that both teas can alleviate Aβ-induced neurodegenerative changes by reducing inflammation, mitochondrial disruption, and other cellular stressors. Notably, black tea showed higher effectiveness, enriching more differentially expressed genes within critical pathways and exhibiting a broader spectrum of bioactive compounds. Its protein-protein interaction network also suggested that black tea acted on a wider range of potential targets. However, these results are preliminary and emphasize the importance of the complex interplay of bioactive components in tea, advocating for further comparative studies to fully understand their neuroprotective mechanisms.
-
Key words:
- Green tea /
- Black tea /
- PC12 cells /
- β-amyloid stress /
- Biologically active ingredients /
- Cell signaling network /
- Inflammation /
- Regulate metabolism