-
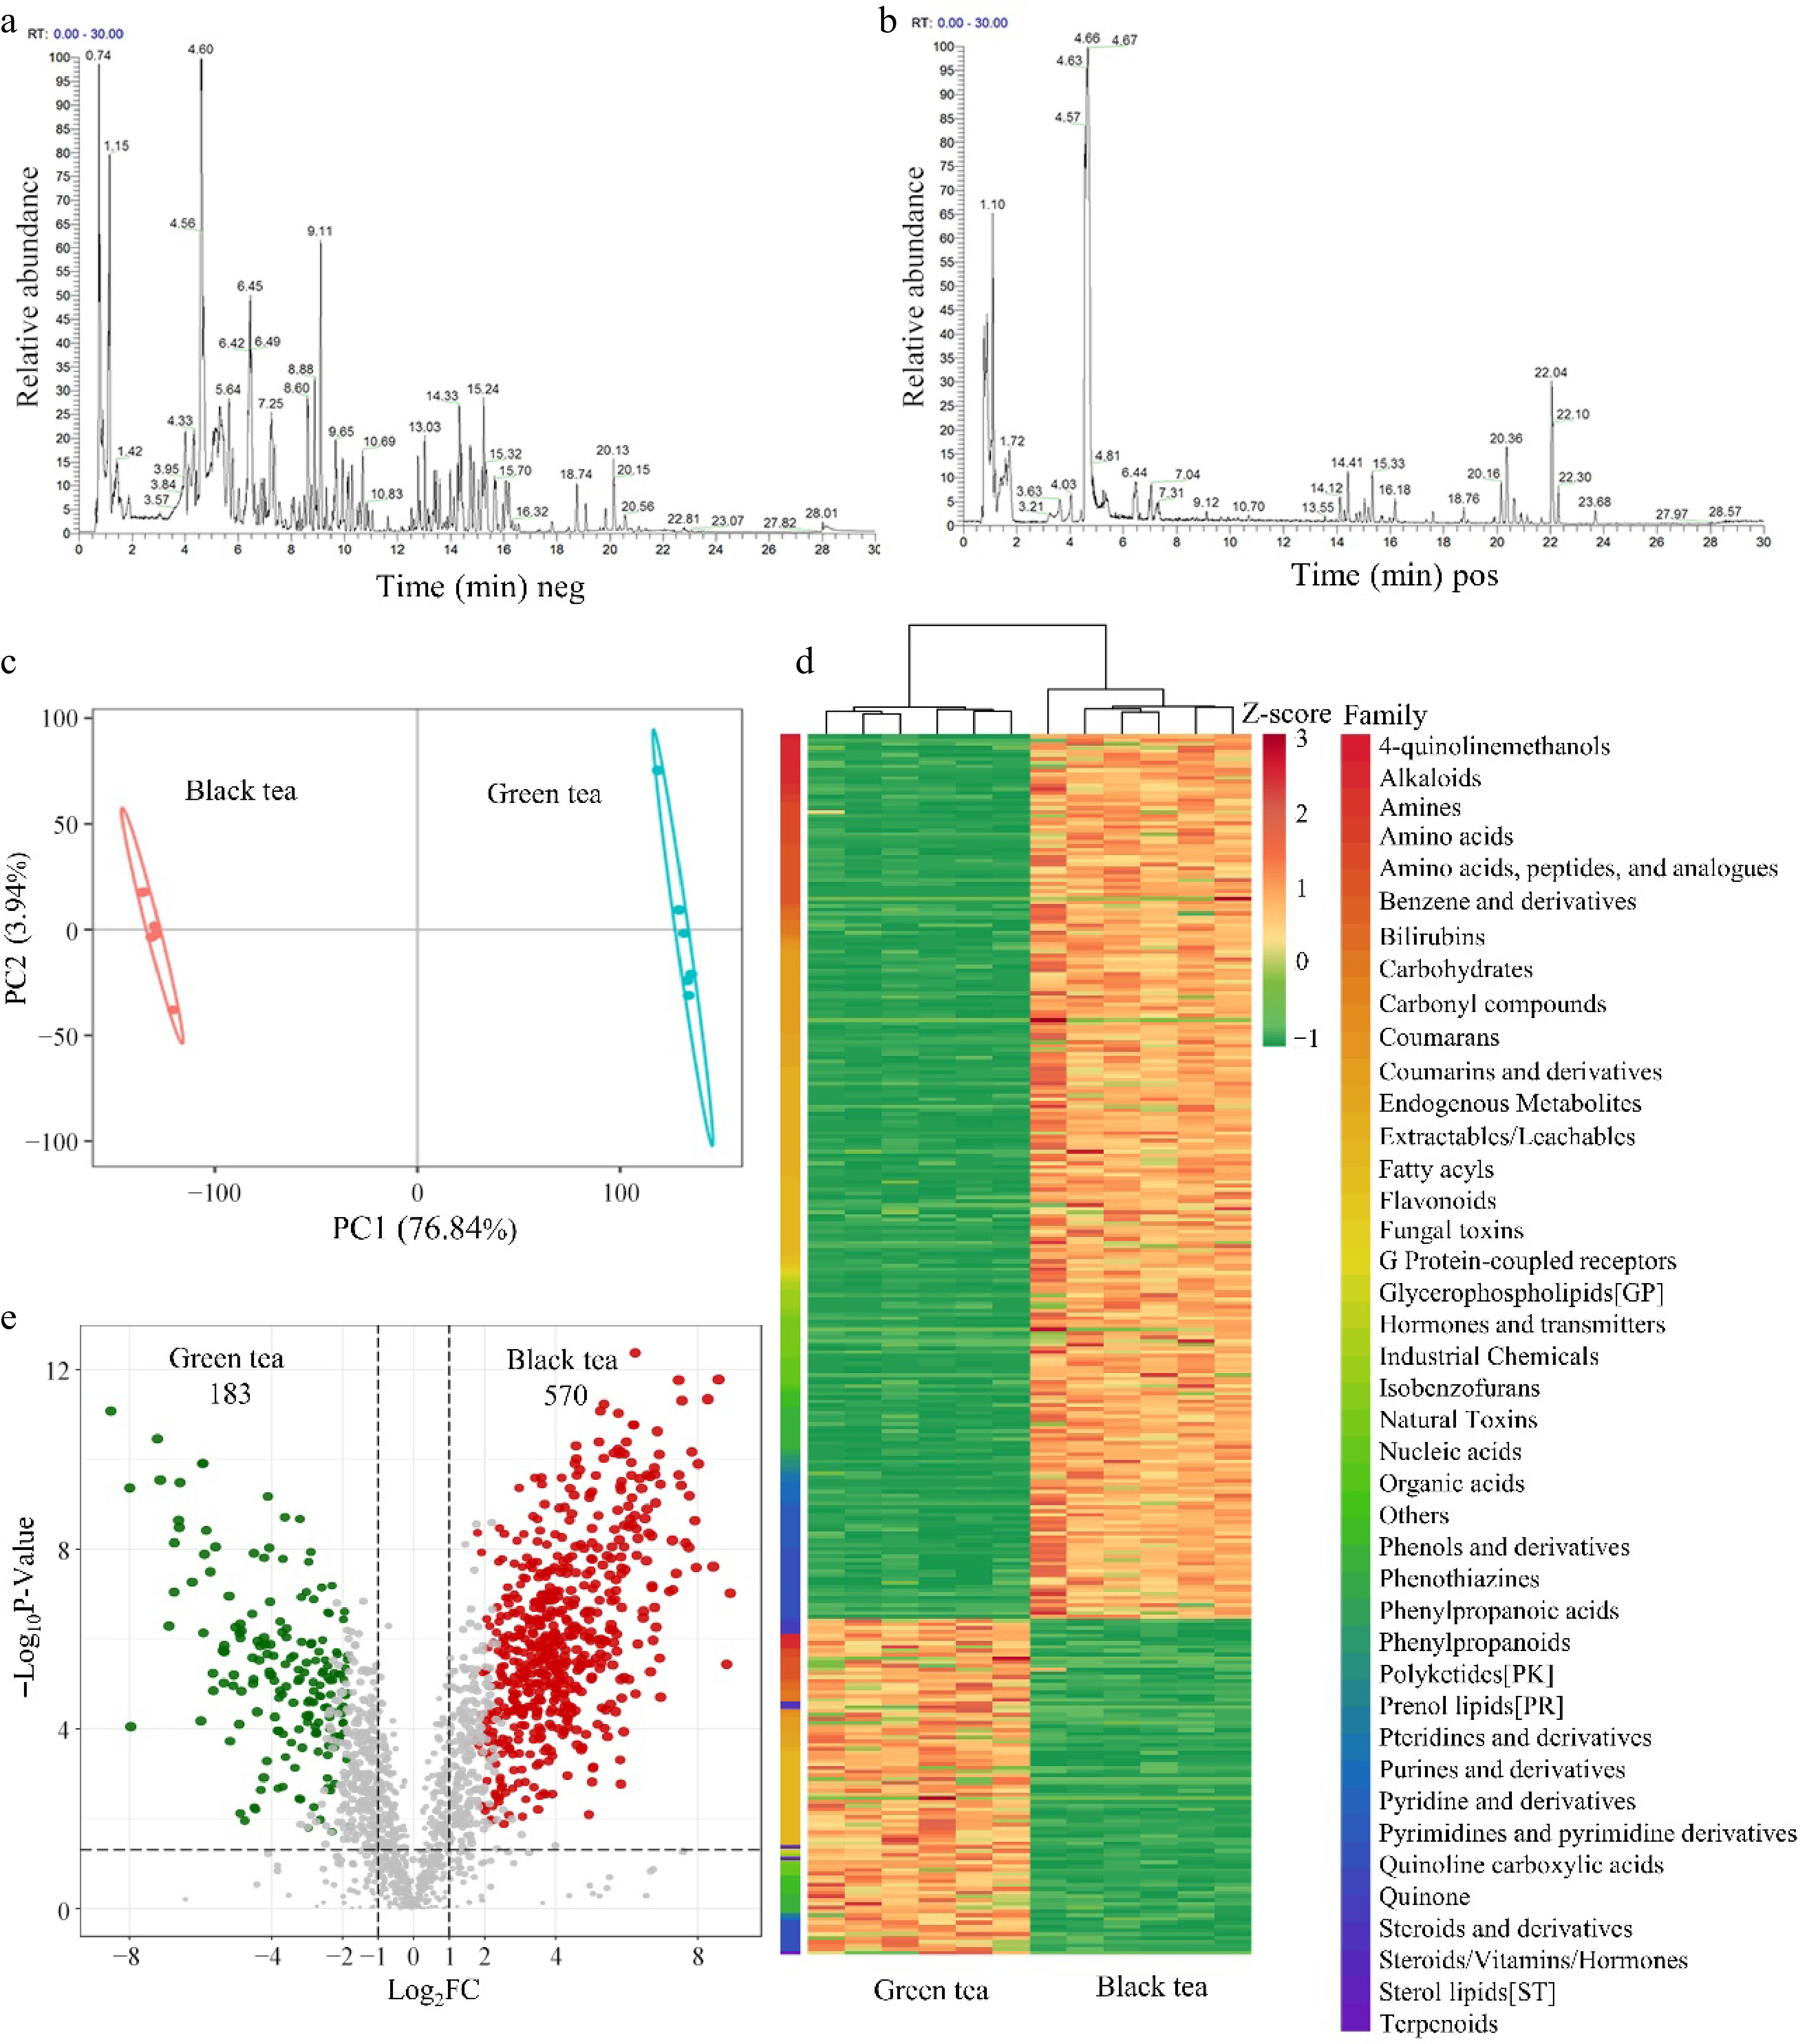
Figure 1.
Untargeted metabolomics analysis of aqueous extracts of green tea and black tea. (a), (b) Base peak ion chromatogram (BPC). (c) PLSDA Score Chart. (d) Heat map of differential metabolite clustering. Classification of compounds according to 'Family'. (e) Differential metabolite volcano map, VIP ≥ 1, 0.83 ≤ Fold-change of Difference ≤ 1.2, q-value < 0.05.
-
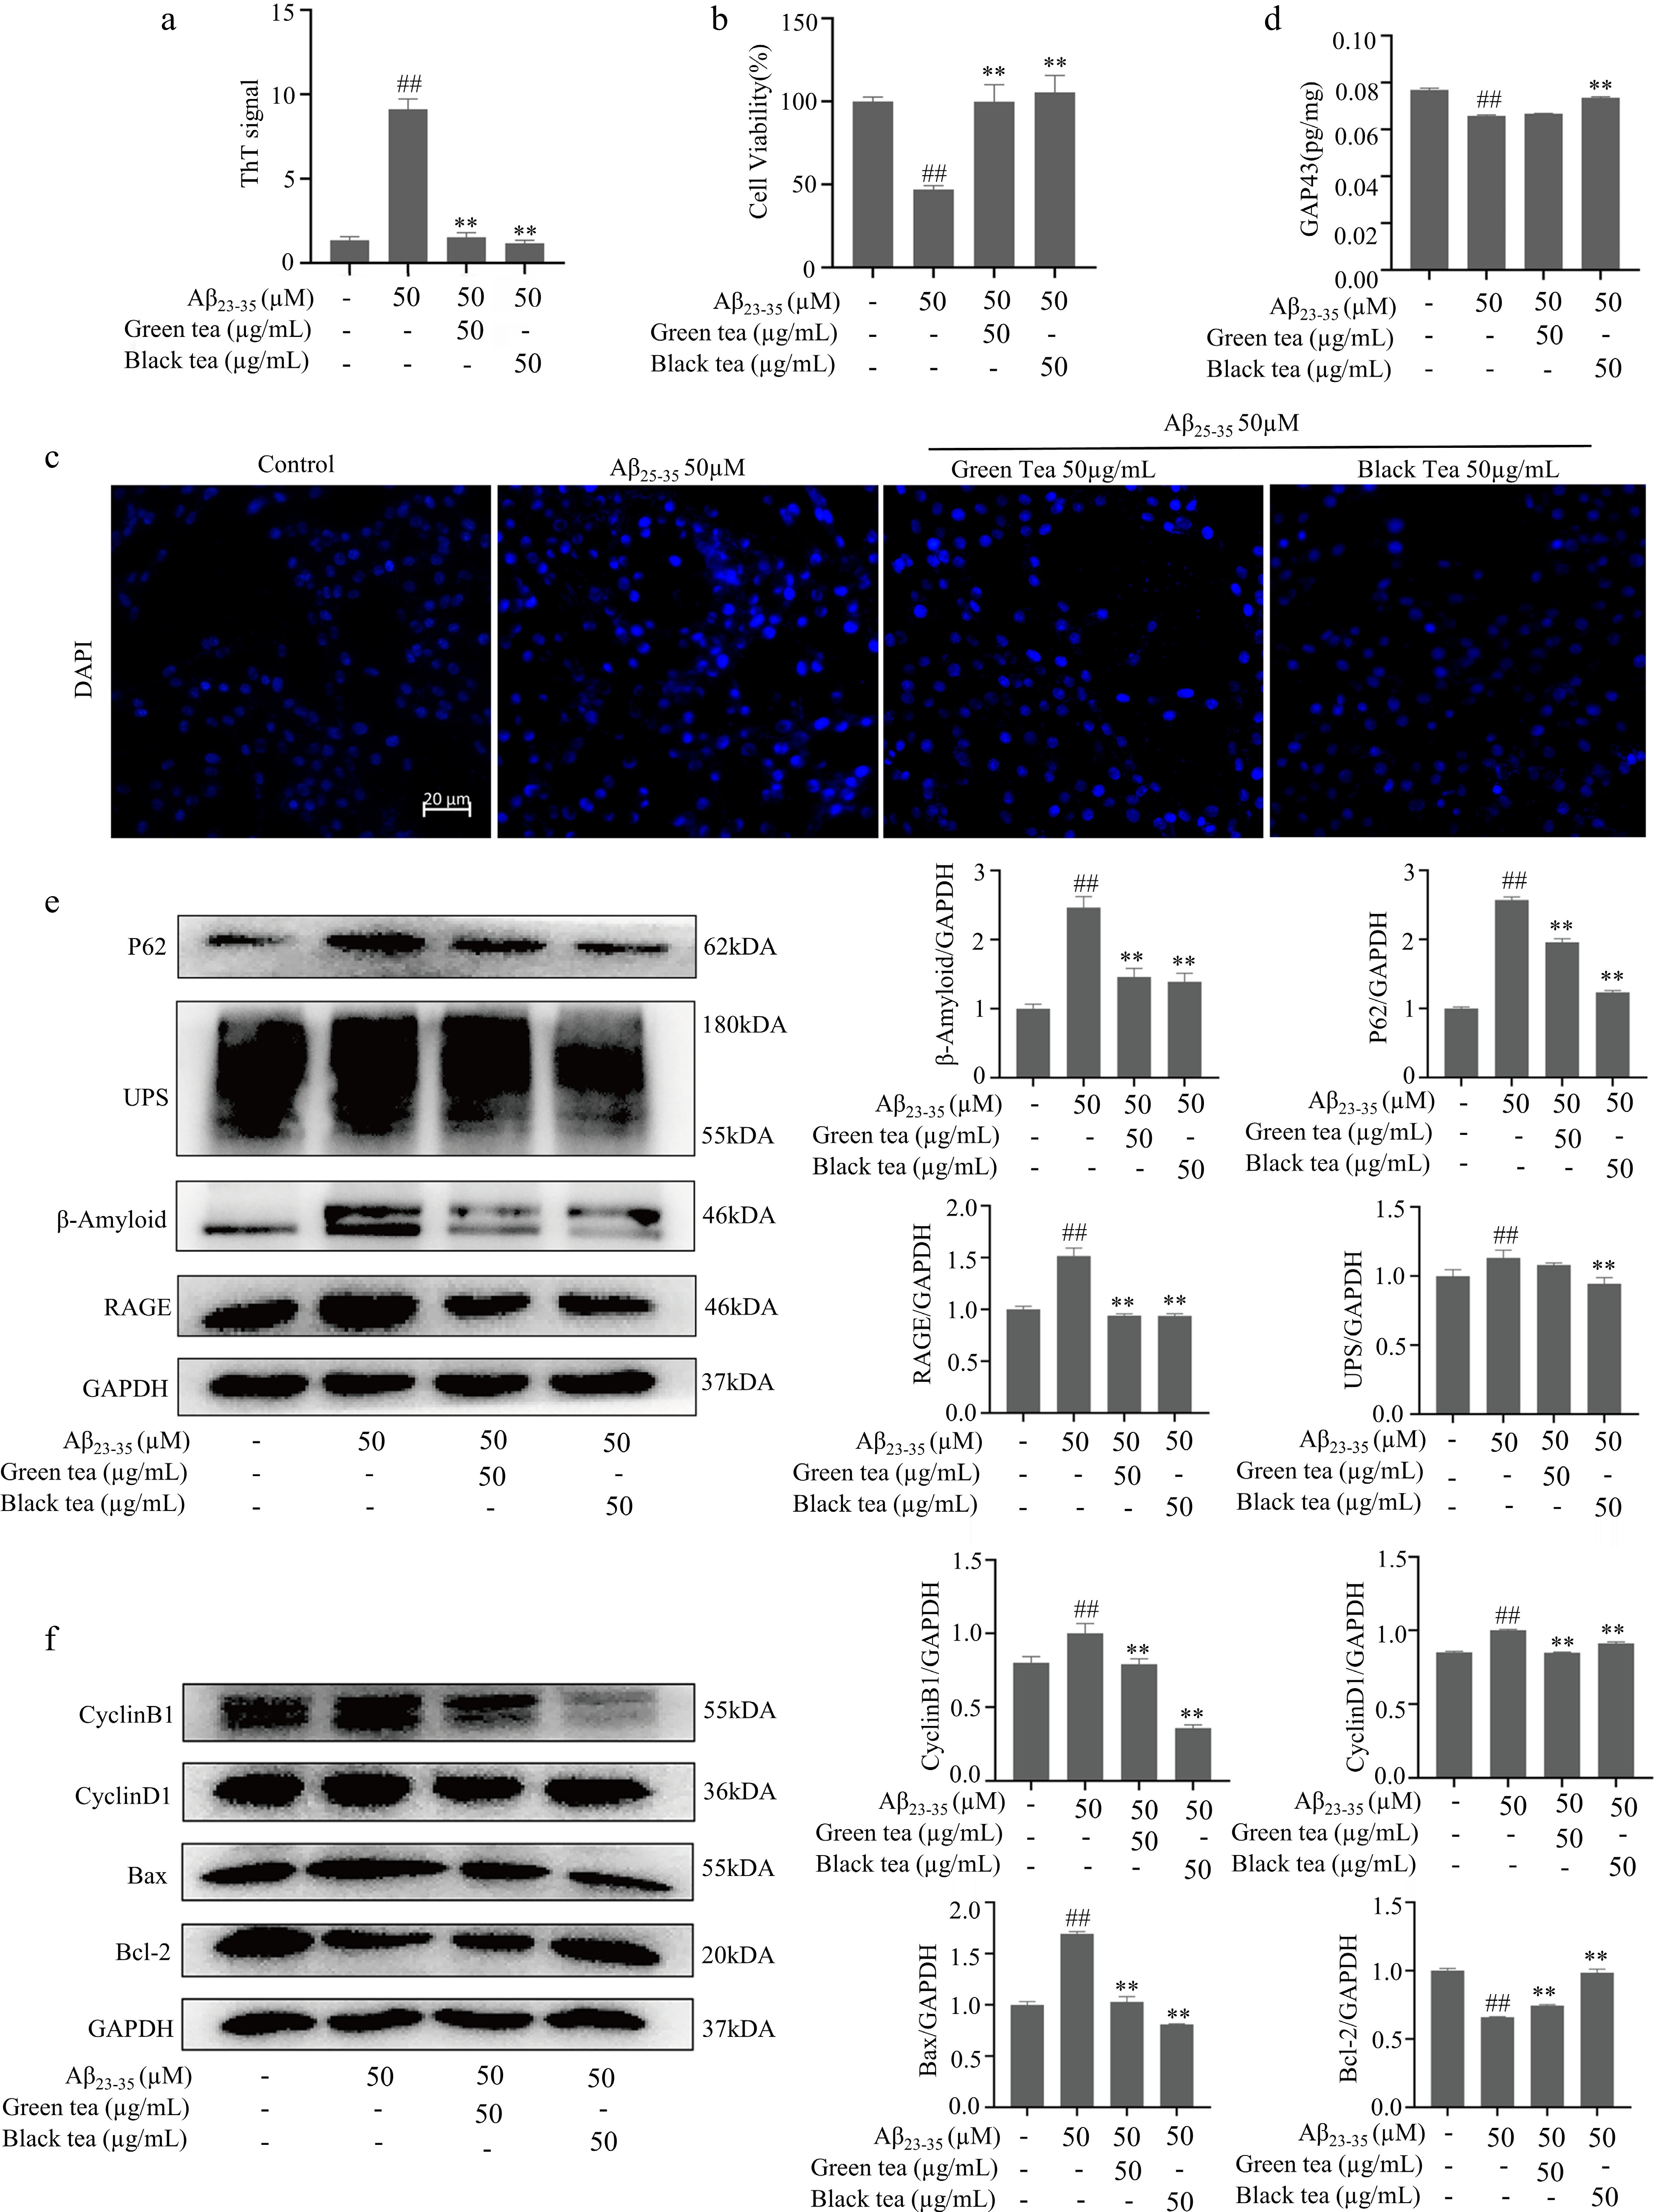
Figure 2.
Green tea and black tea inhibits Aβ25-35-induced degenerative changes in differentiated PC12 cells. (a) ThT assay for β-fold structure content of different Aβ25-35 incubated samples. (b) MTT assay for cell viability. (c) DAPI fluorescence staining (bar = 20 μm). (d) ELISA assay for GAP43 protein expression level. (e) Westen-blotting for Aβ and other protein aggregate-related pathways. (f) Westen-blotting detection of cell cycle and apoptosis-related pathways. Compared with the Control group, # p < 0.05, ## p < 0.01. Compared with Aβ25-35 group, ** p < 0.01, n = 3.
-
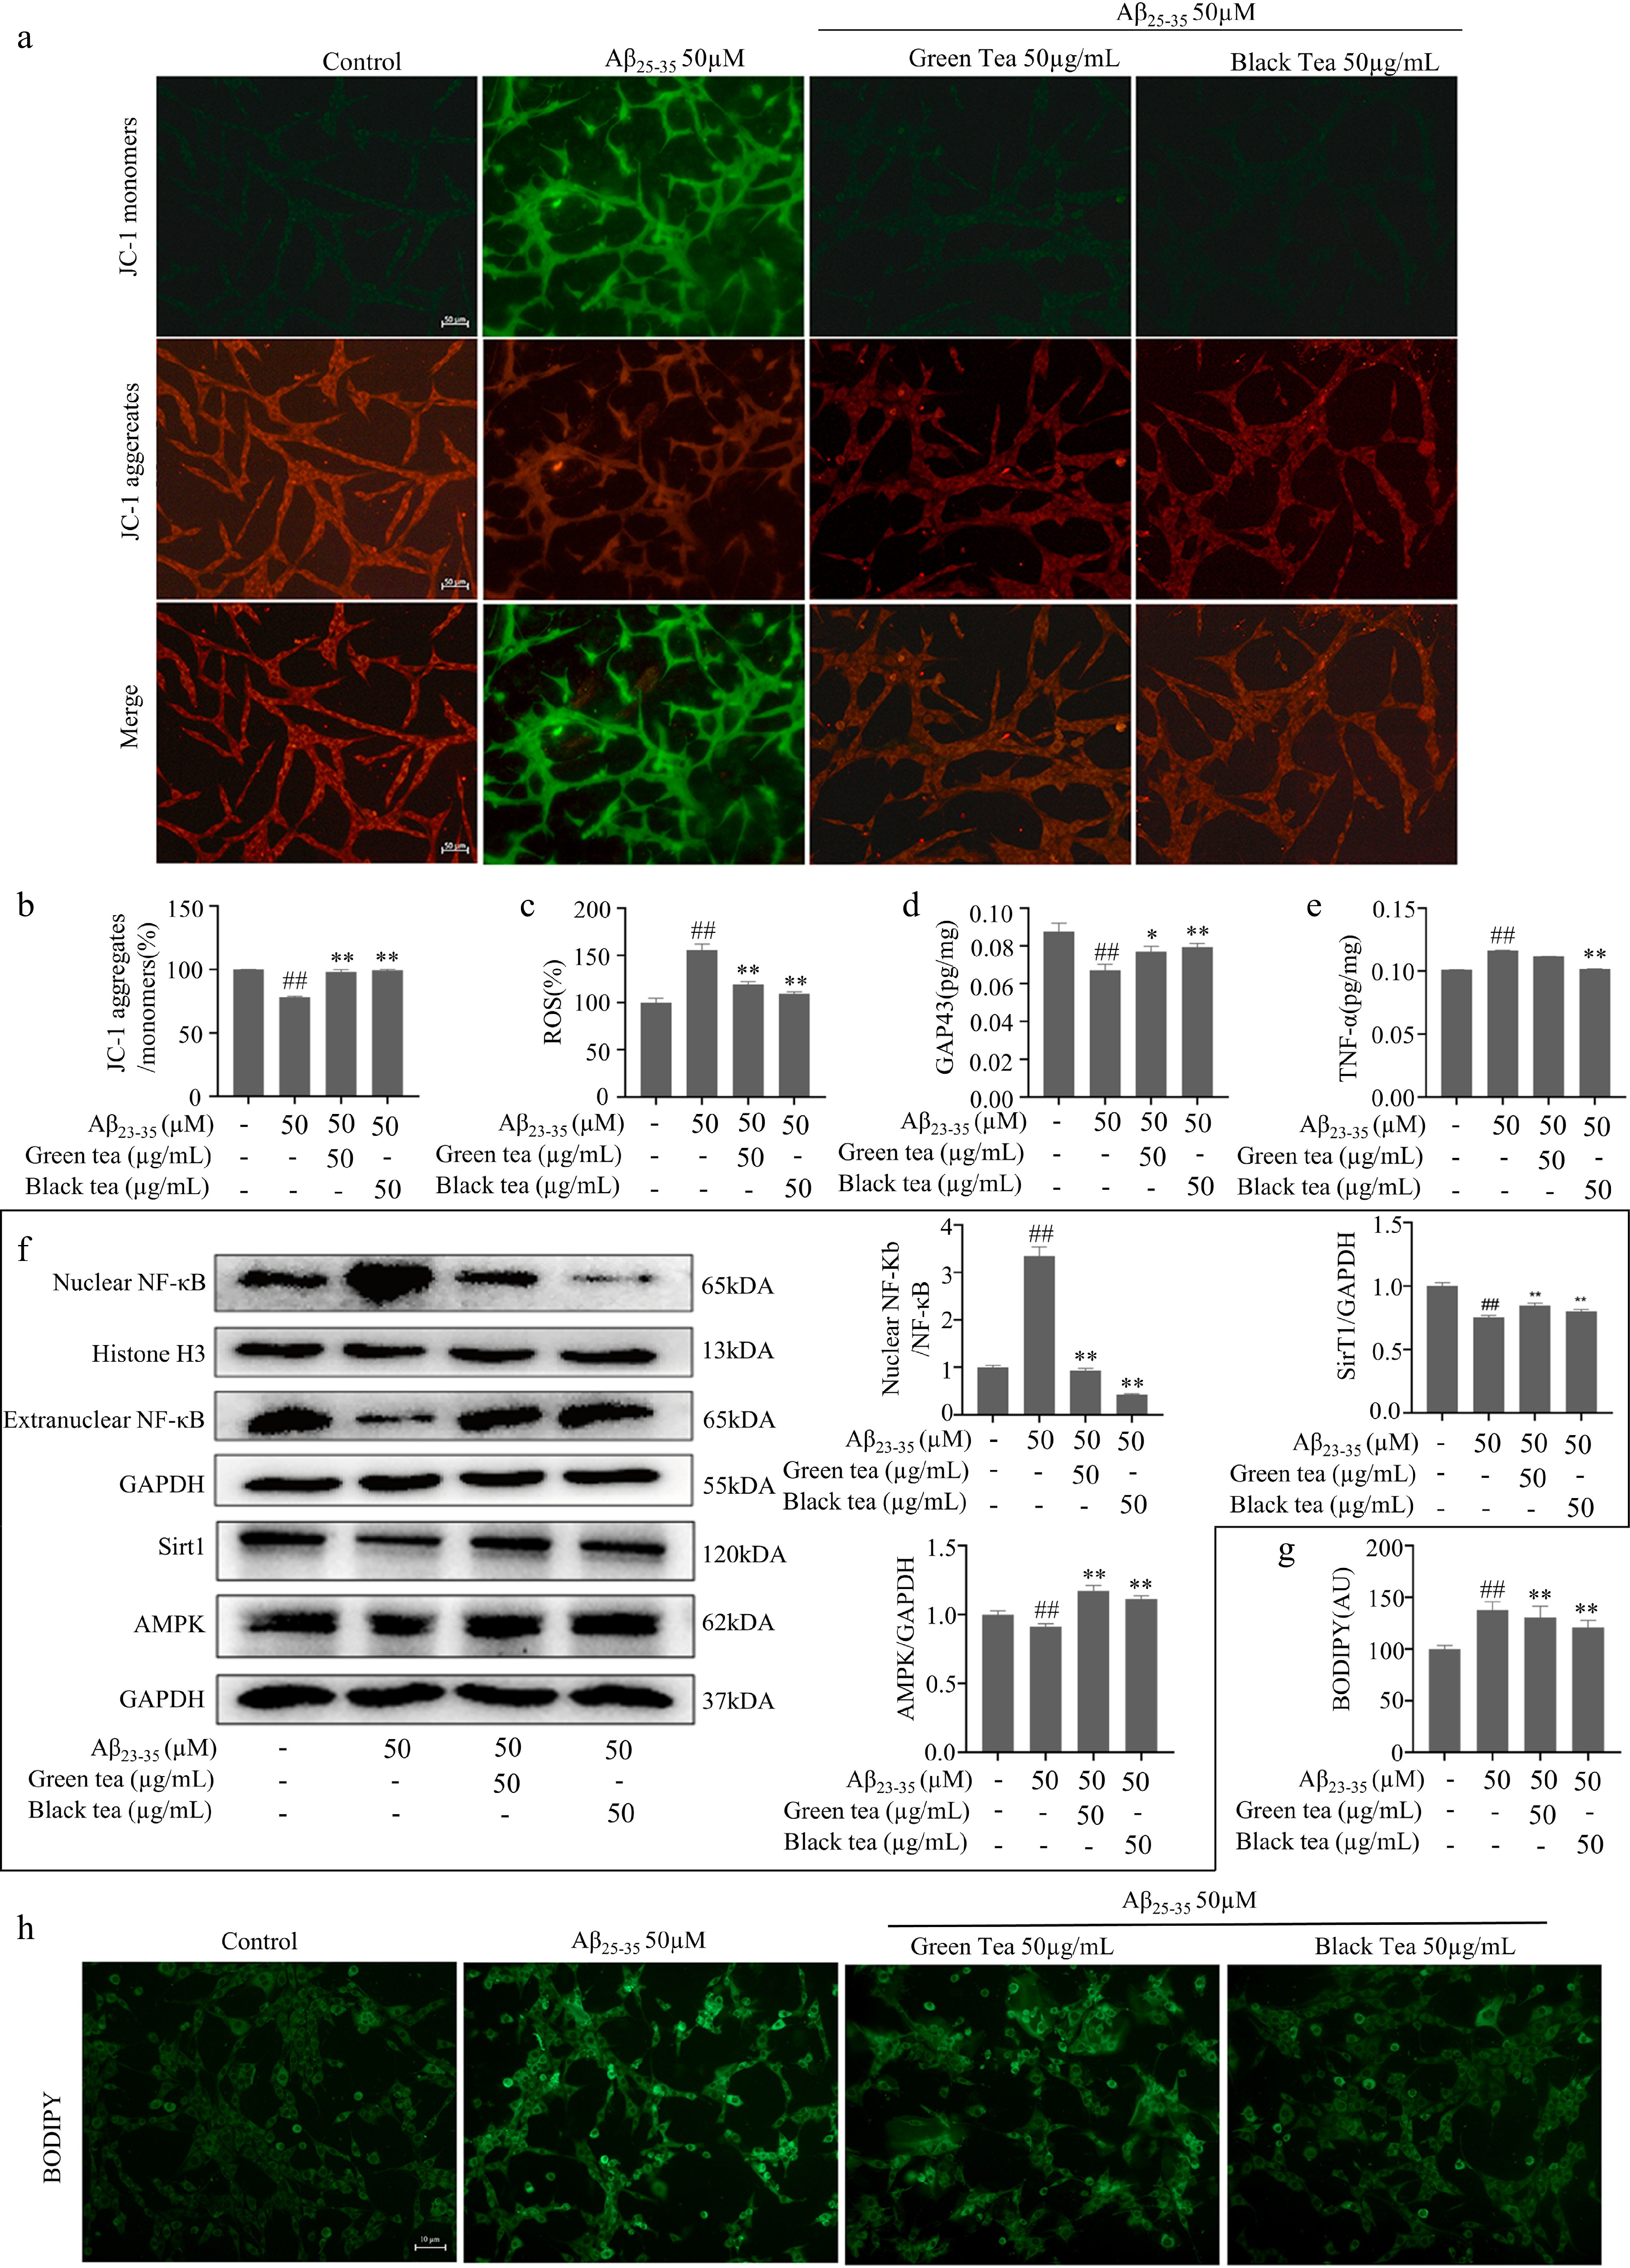
Figure 3.
Anti-inflammatory and metabolism-promoting functions of green tea and black tea. (a), (b) JC-1 staining plot with statistics (bar = 50 μm). (c) Fluorescence enzyme marker for ROS level. (d) ATP content assay. (e) ELISA for cellular TNF-α protein expression level. (f) Western-blotting for inflammation and energy metabolism-related pathways. (g), (h) BODIPY fluorescence staining with statistics for lipid droplets (bar = 10 μm). Compared with the Control group, ## p < 0.01; Compared with the Aβ25-35 group, * p < 0.05, ** p < 0.01, n = 3.
-
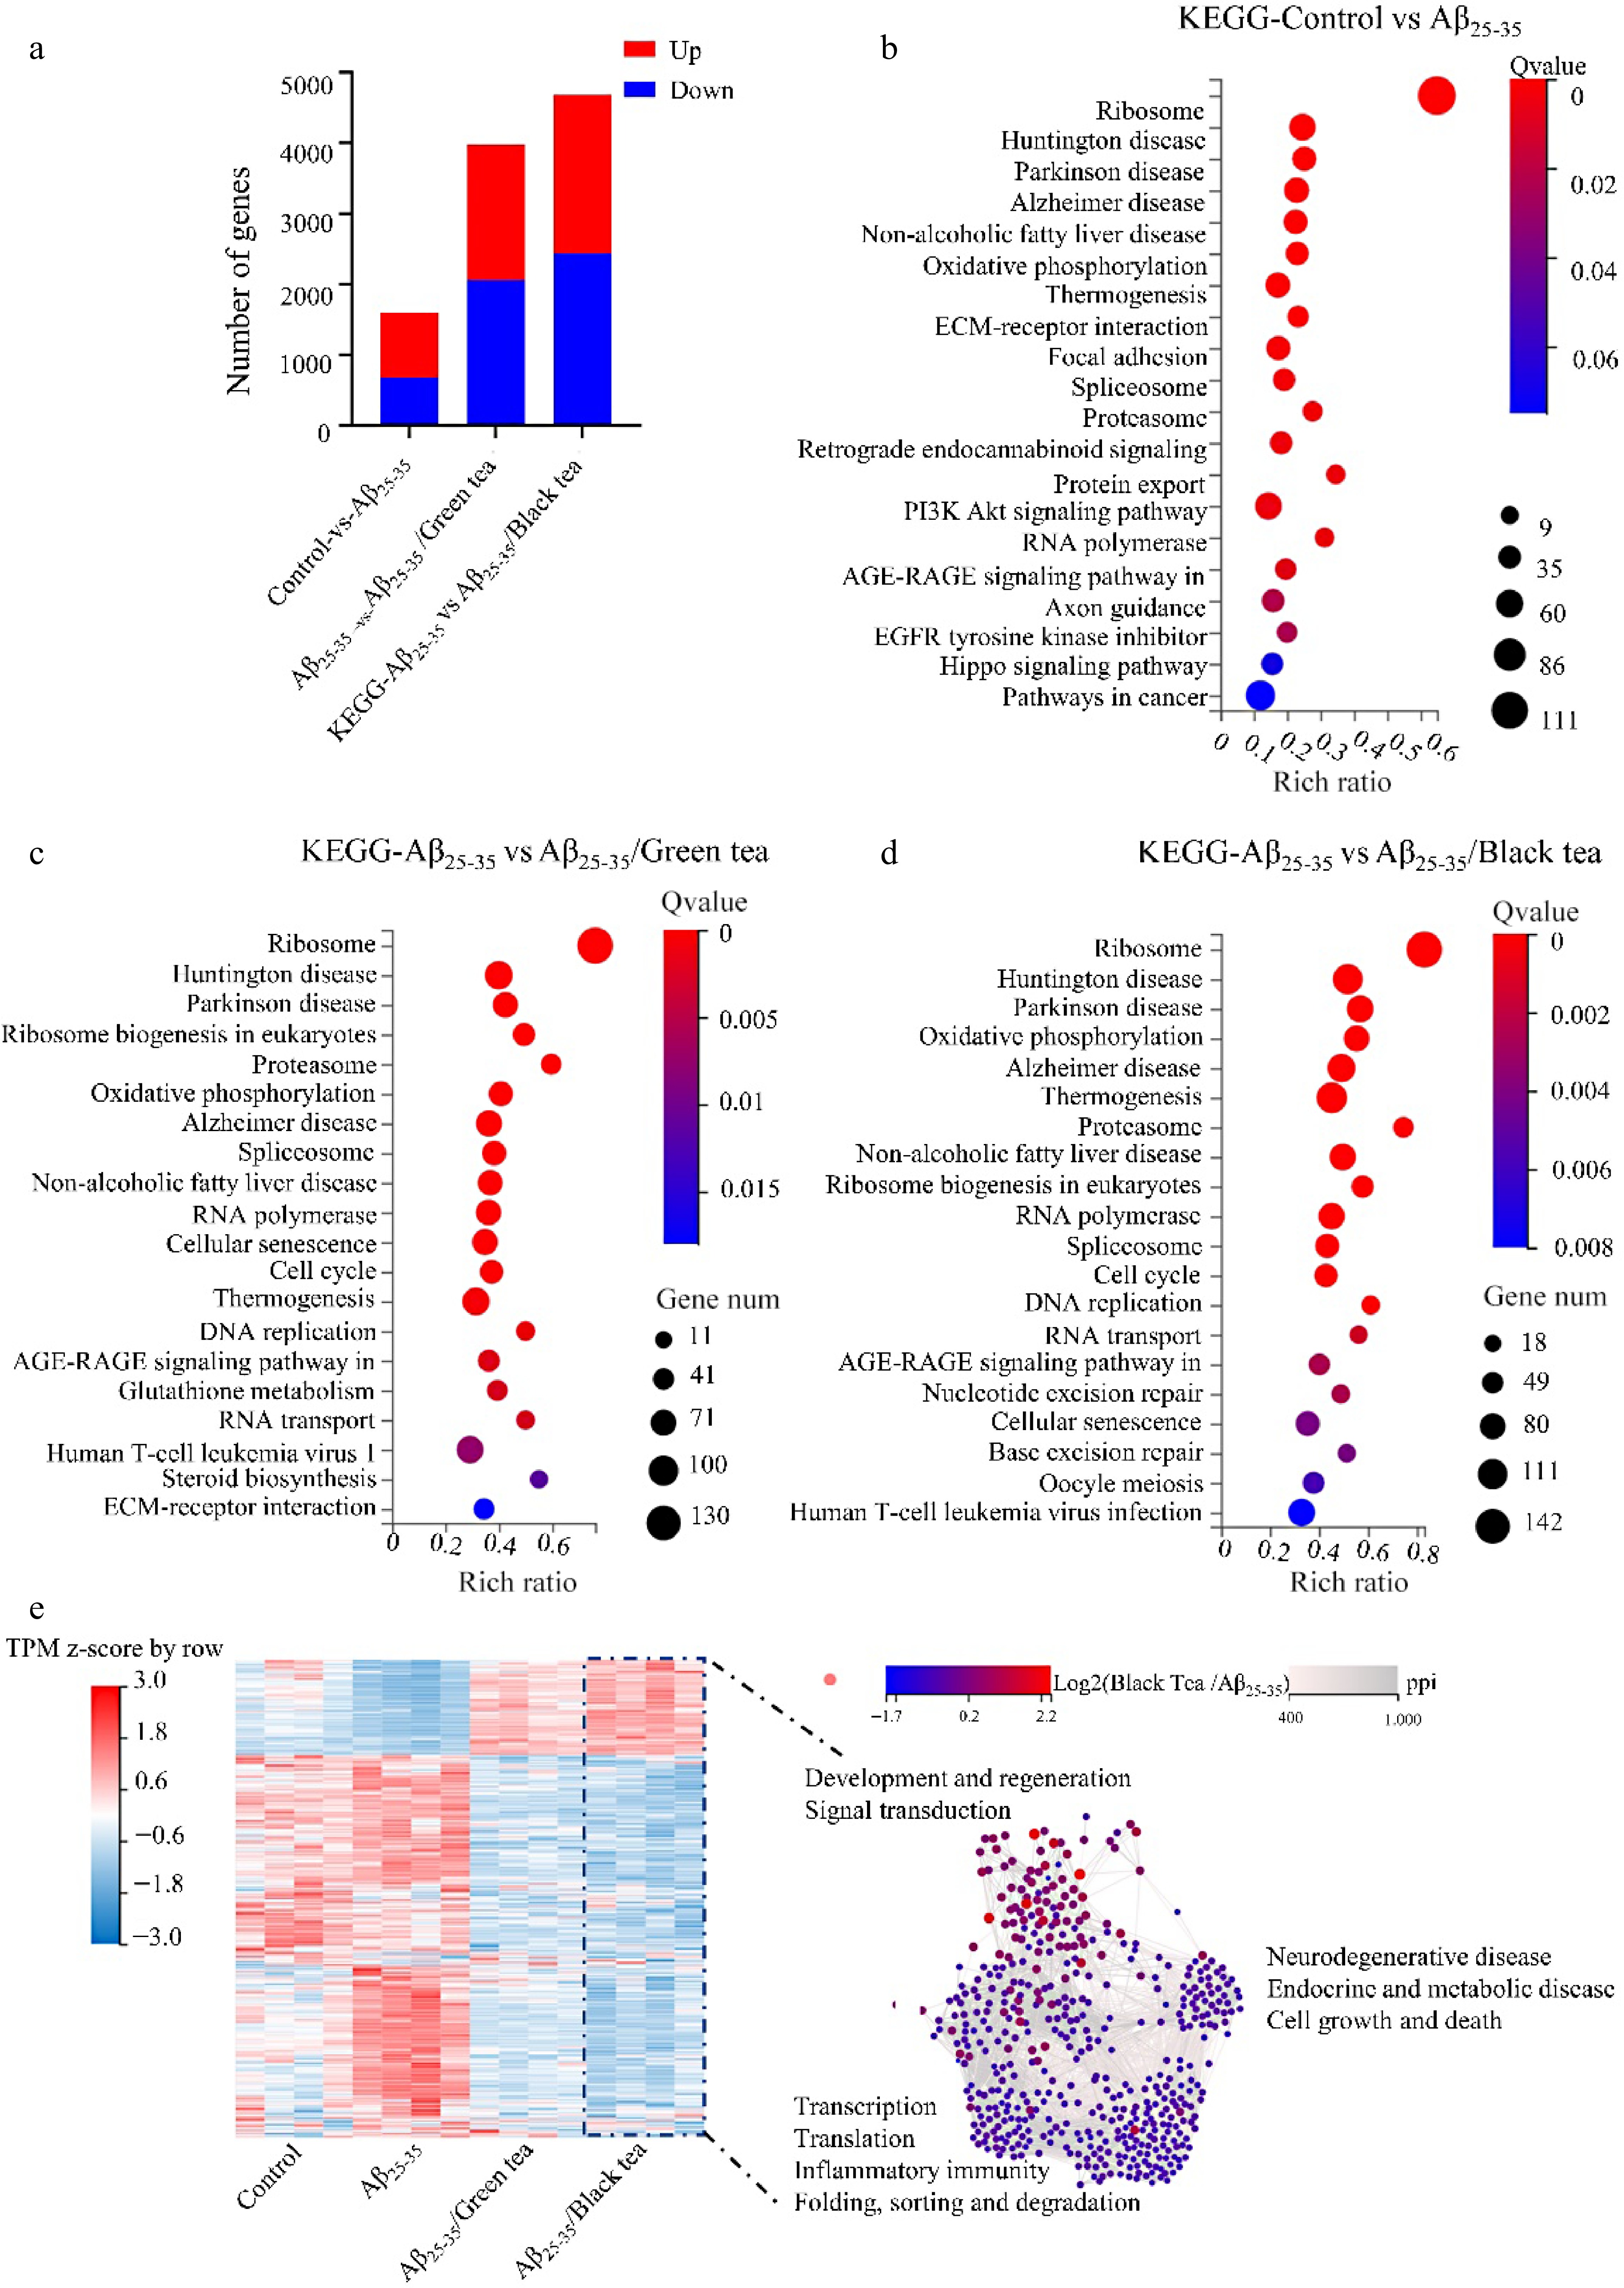
Figure 4.
Transcriptome analysis of different treatment groups. (a) Comparative analysis of DEGs between groups. (b)−(d) KEGG analysis of DEGs in different treatment groups. (e) Heatmap and interaction network analysis of DEGs in different treatment groups with DEGs of Aβ25-35/black tea as a reference.
-
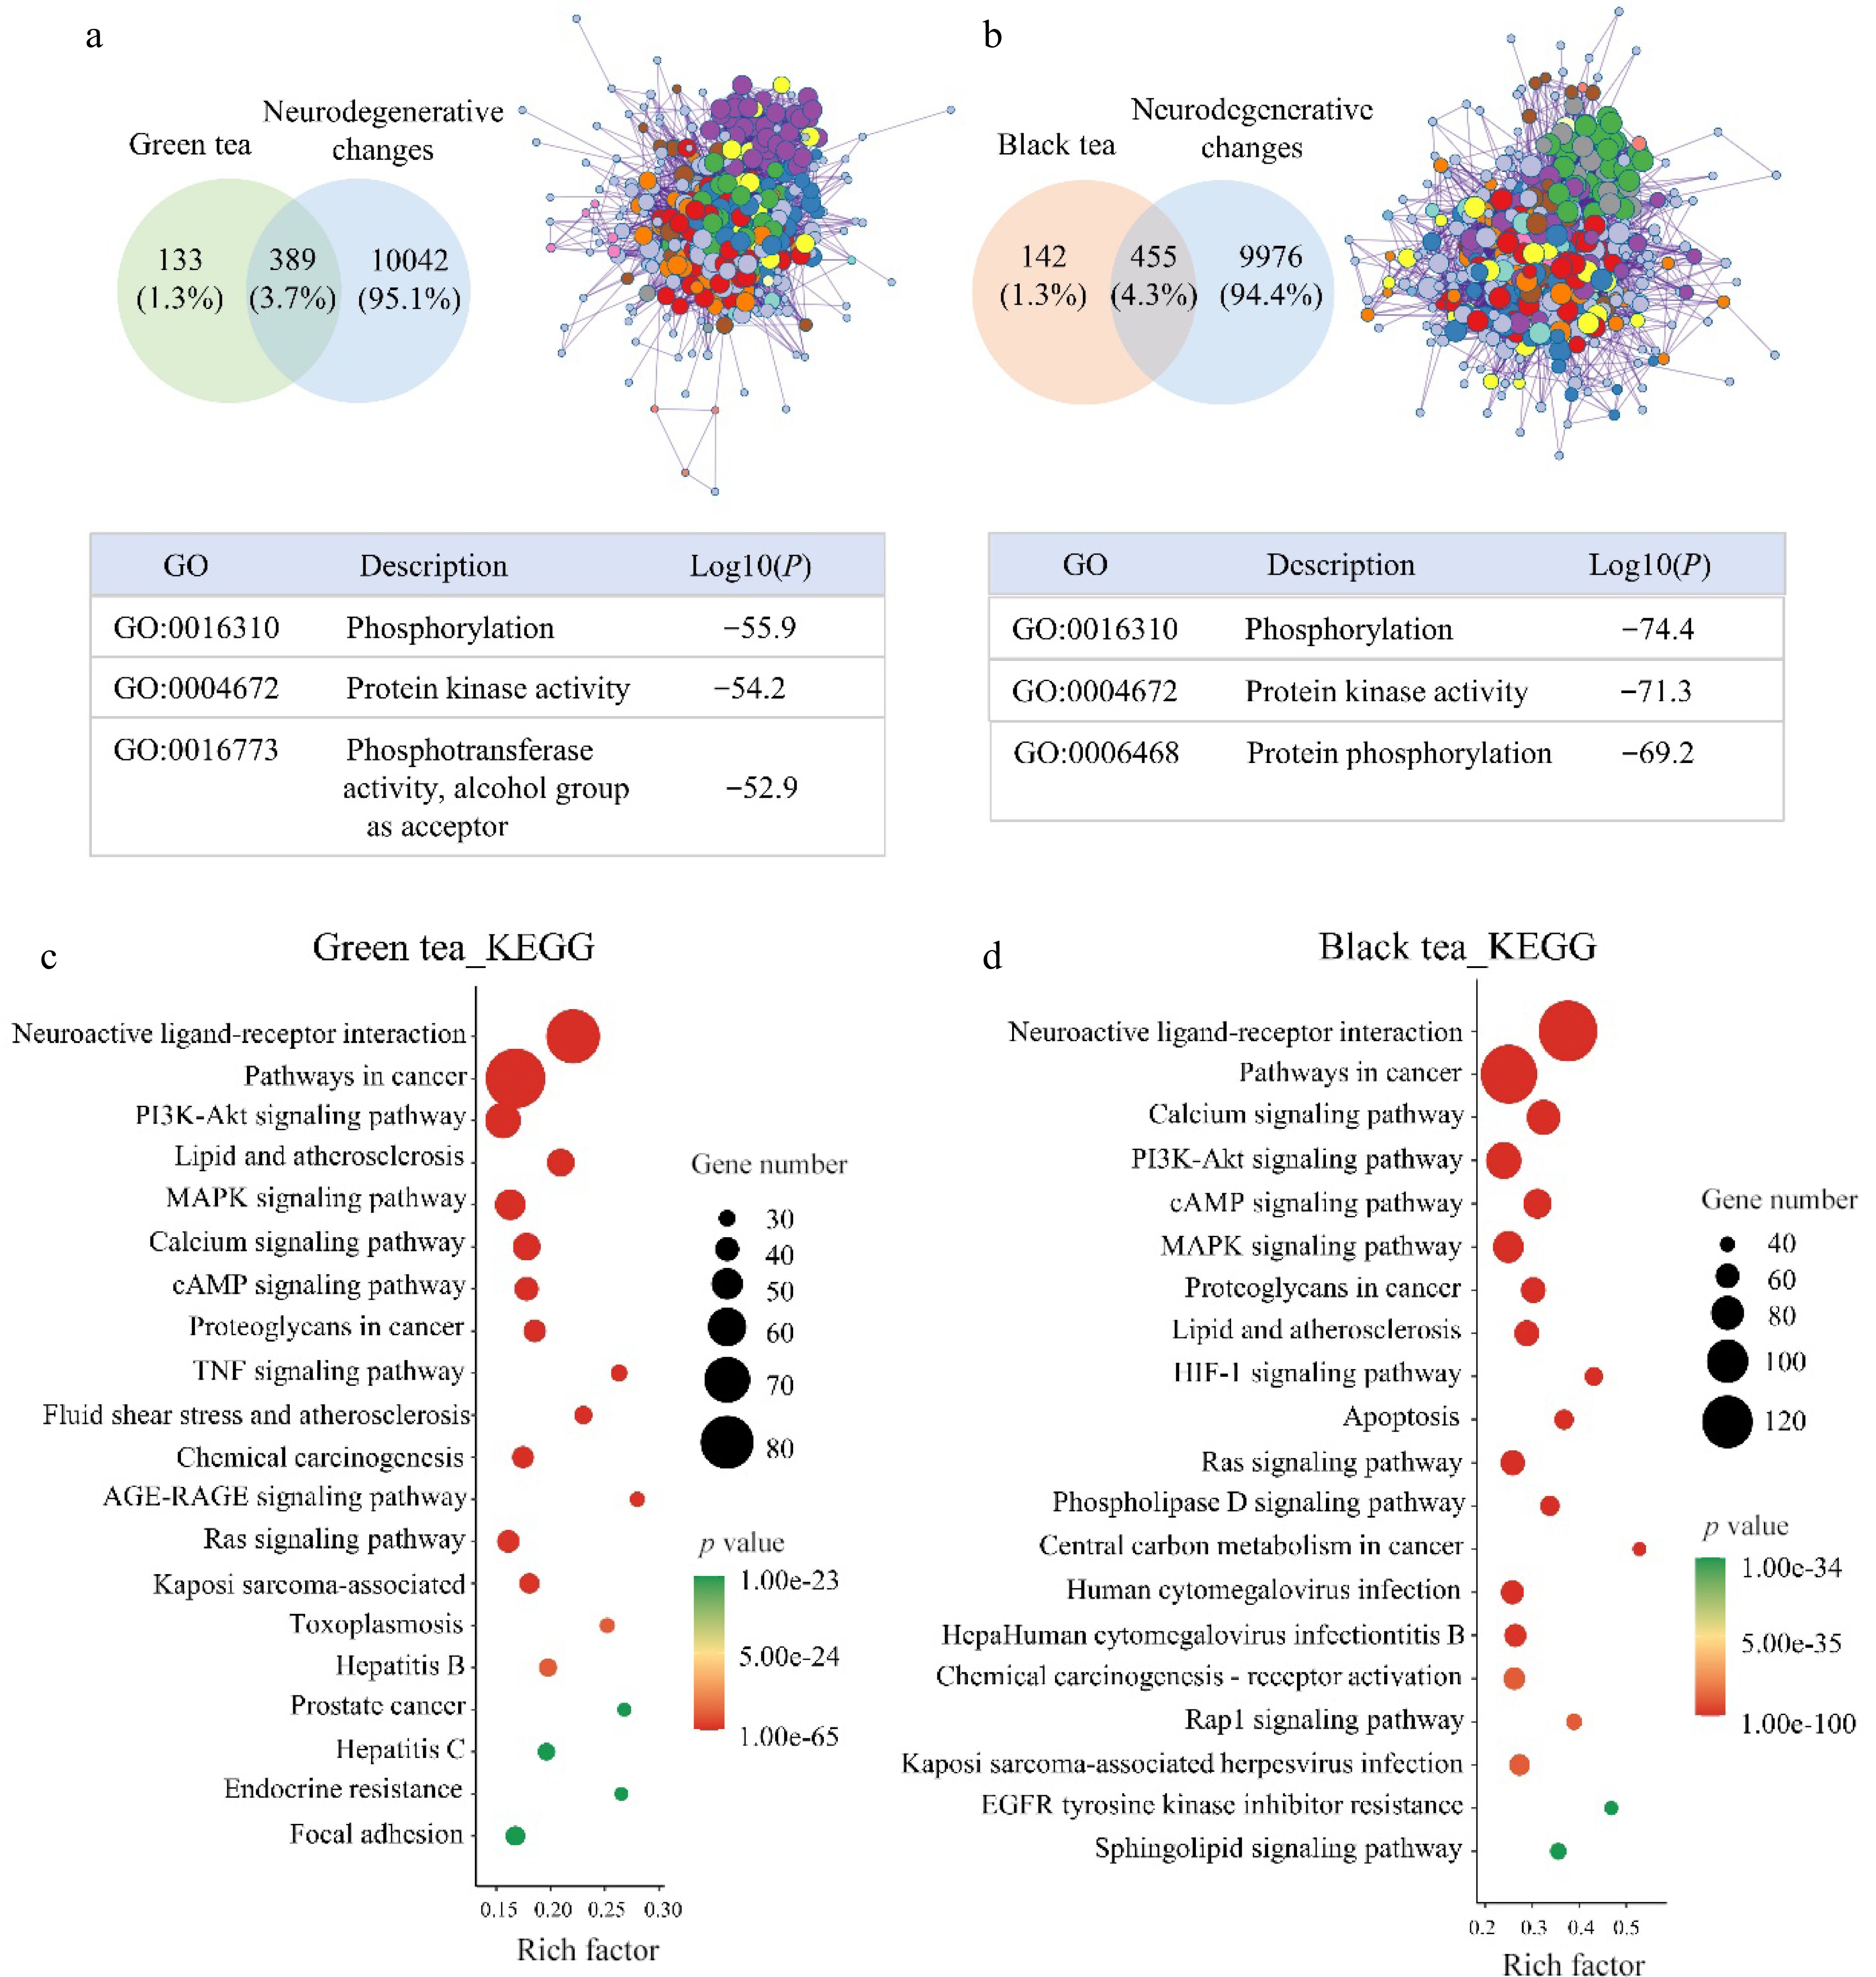
Figure 5.
Network pharmacological analysis of green tea and black tea against neurodegenerative changes. (a), (b) VENN and GO analysis. (c), (d) KEGG analysis.
-
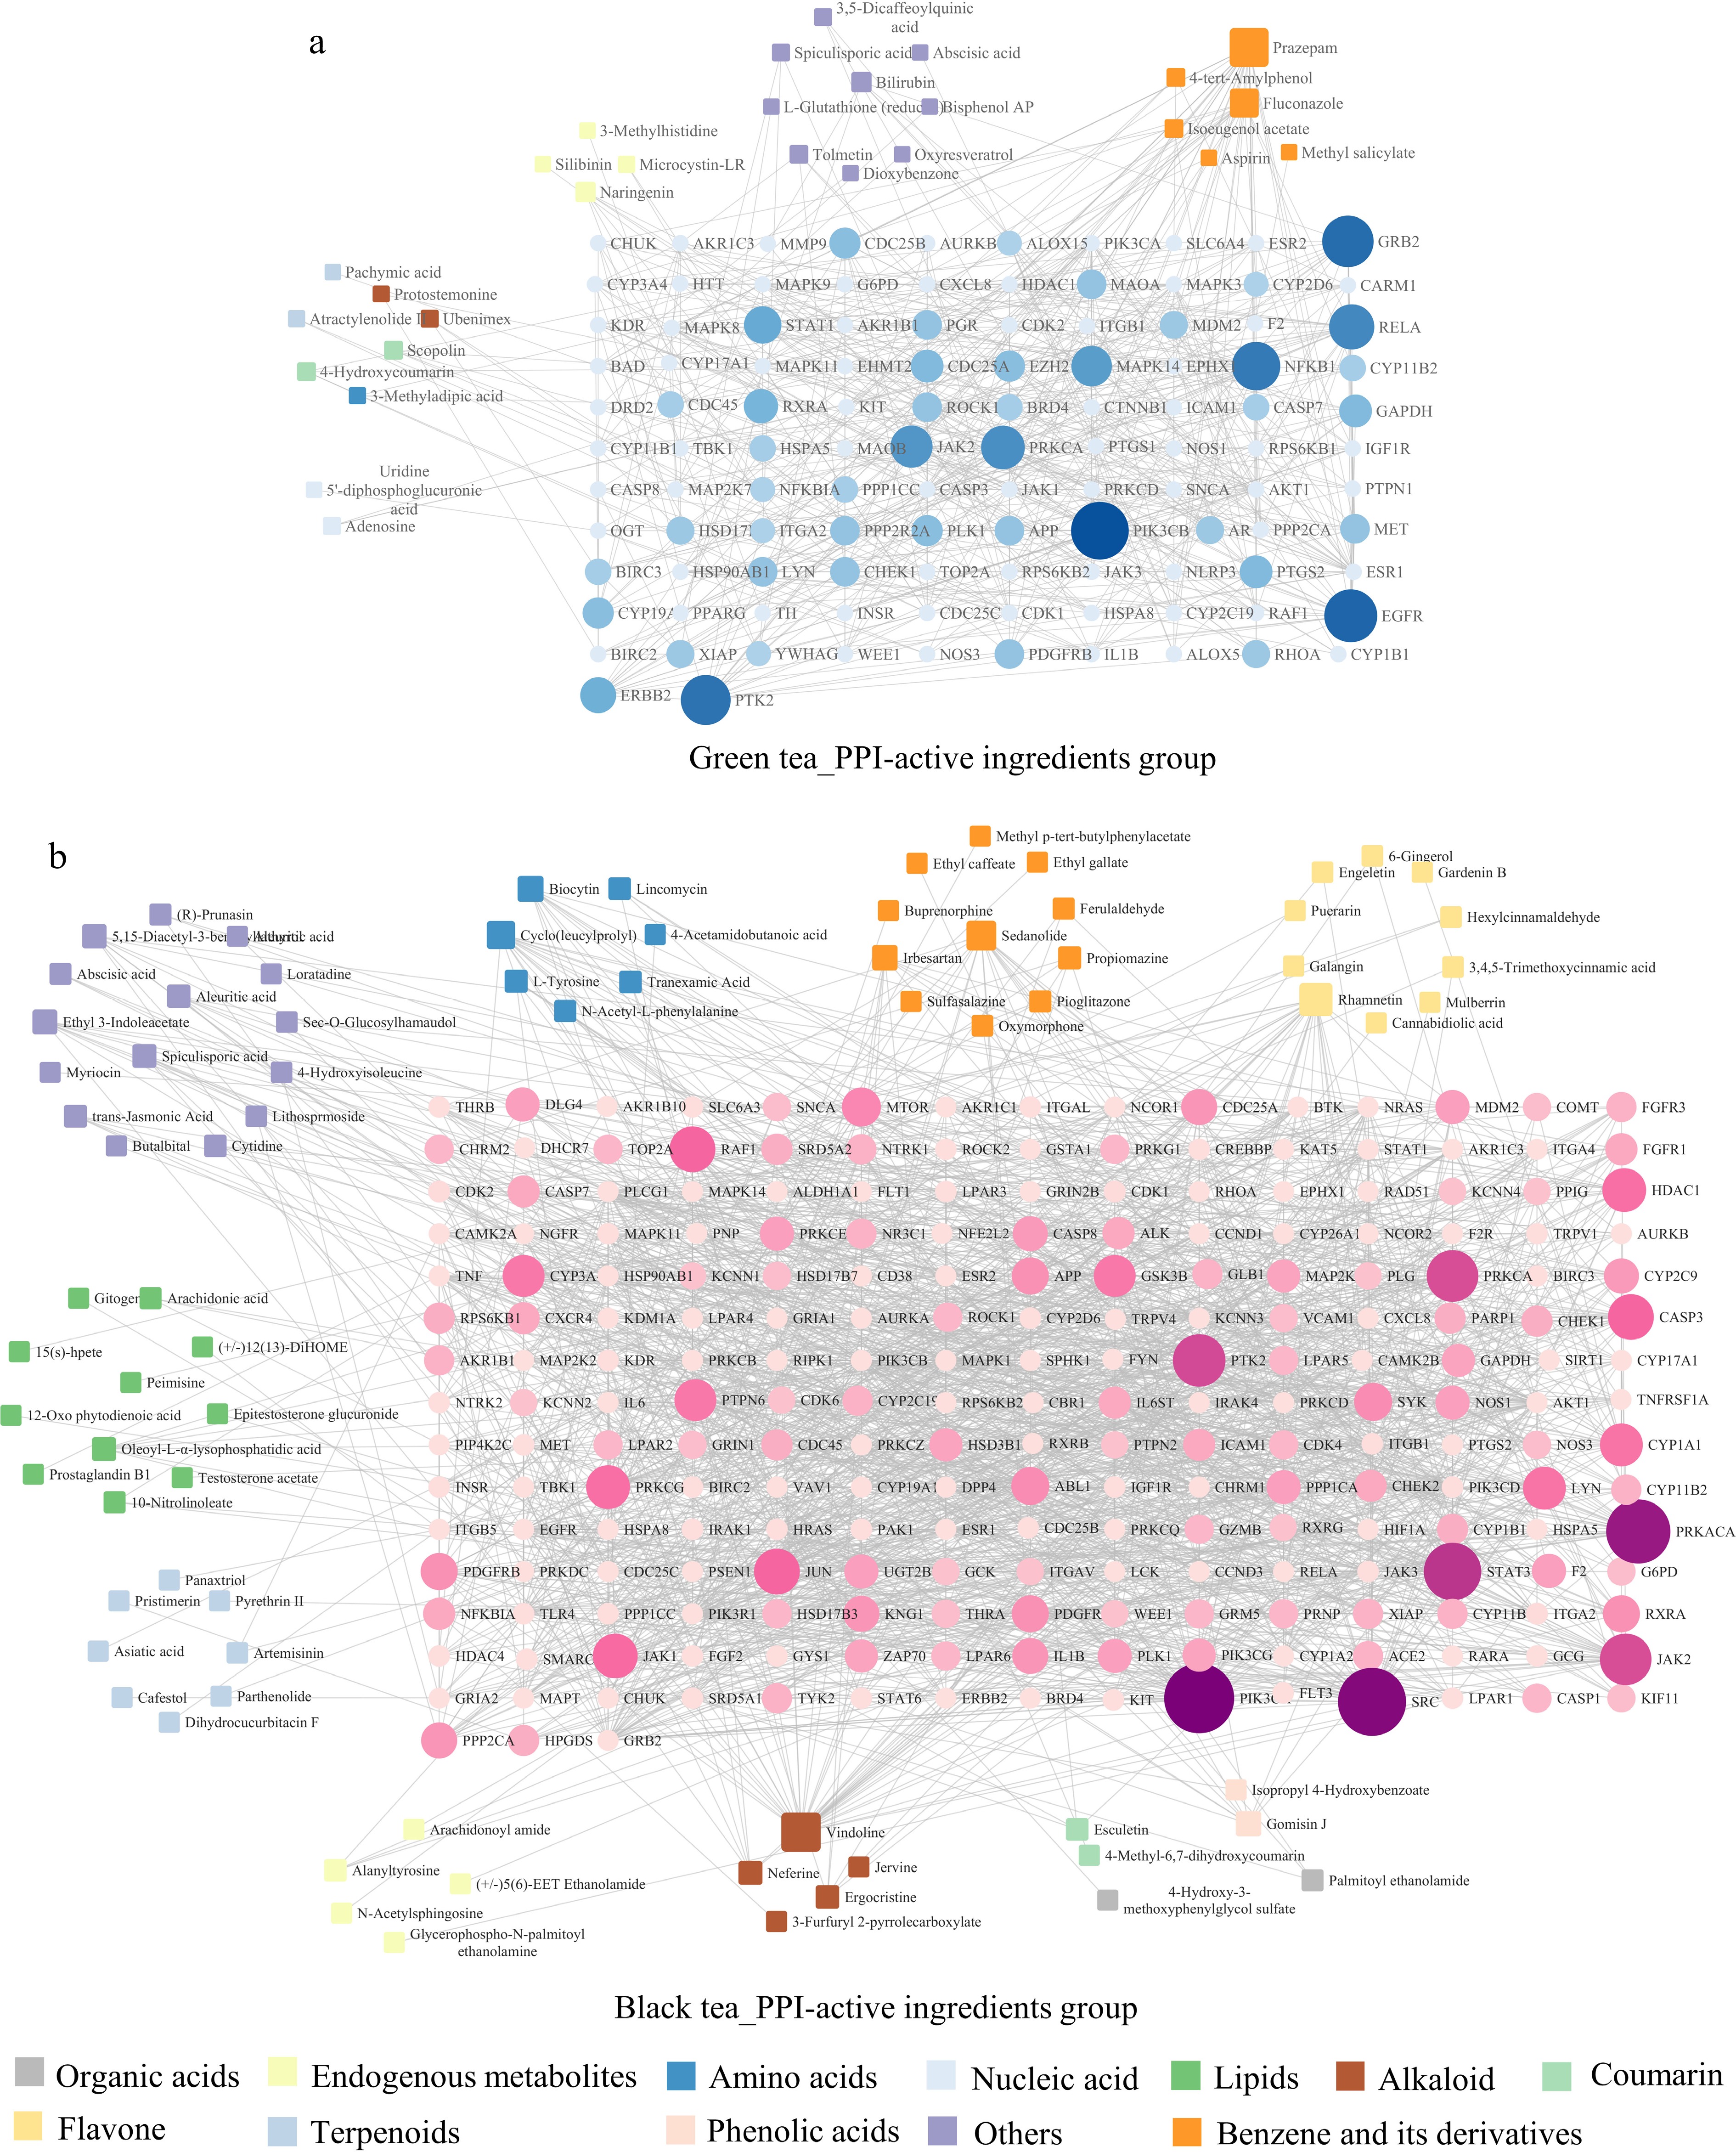
Figure 6.
Network diagram of the active component-key target of green tea and black tea in the intervention of neurodegenerative changes. (a) Association analysis plot for green tea's differential active components with protein-protein interactions (PPI). (b) Similar plot for black tea. Circles in the diagram now represent target genes, with their size and color intensity indicating the extent of their network connections and interaction strength, respectively. Quadrilaterals represent active components, with their size reflecting the degree of linkage to other genes.
Figures
(6)
Tables
(0)