-
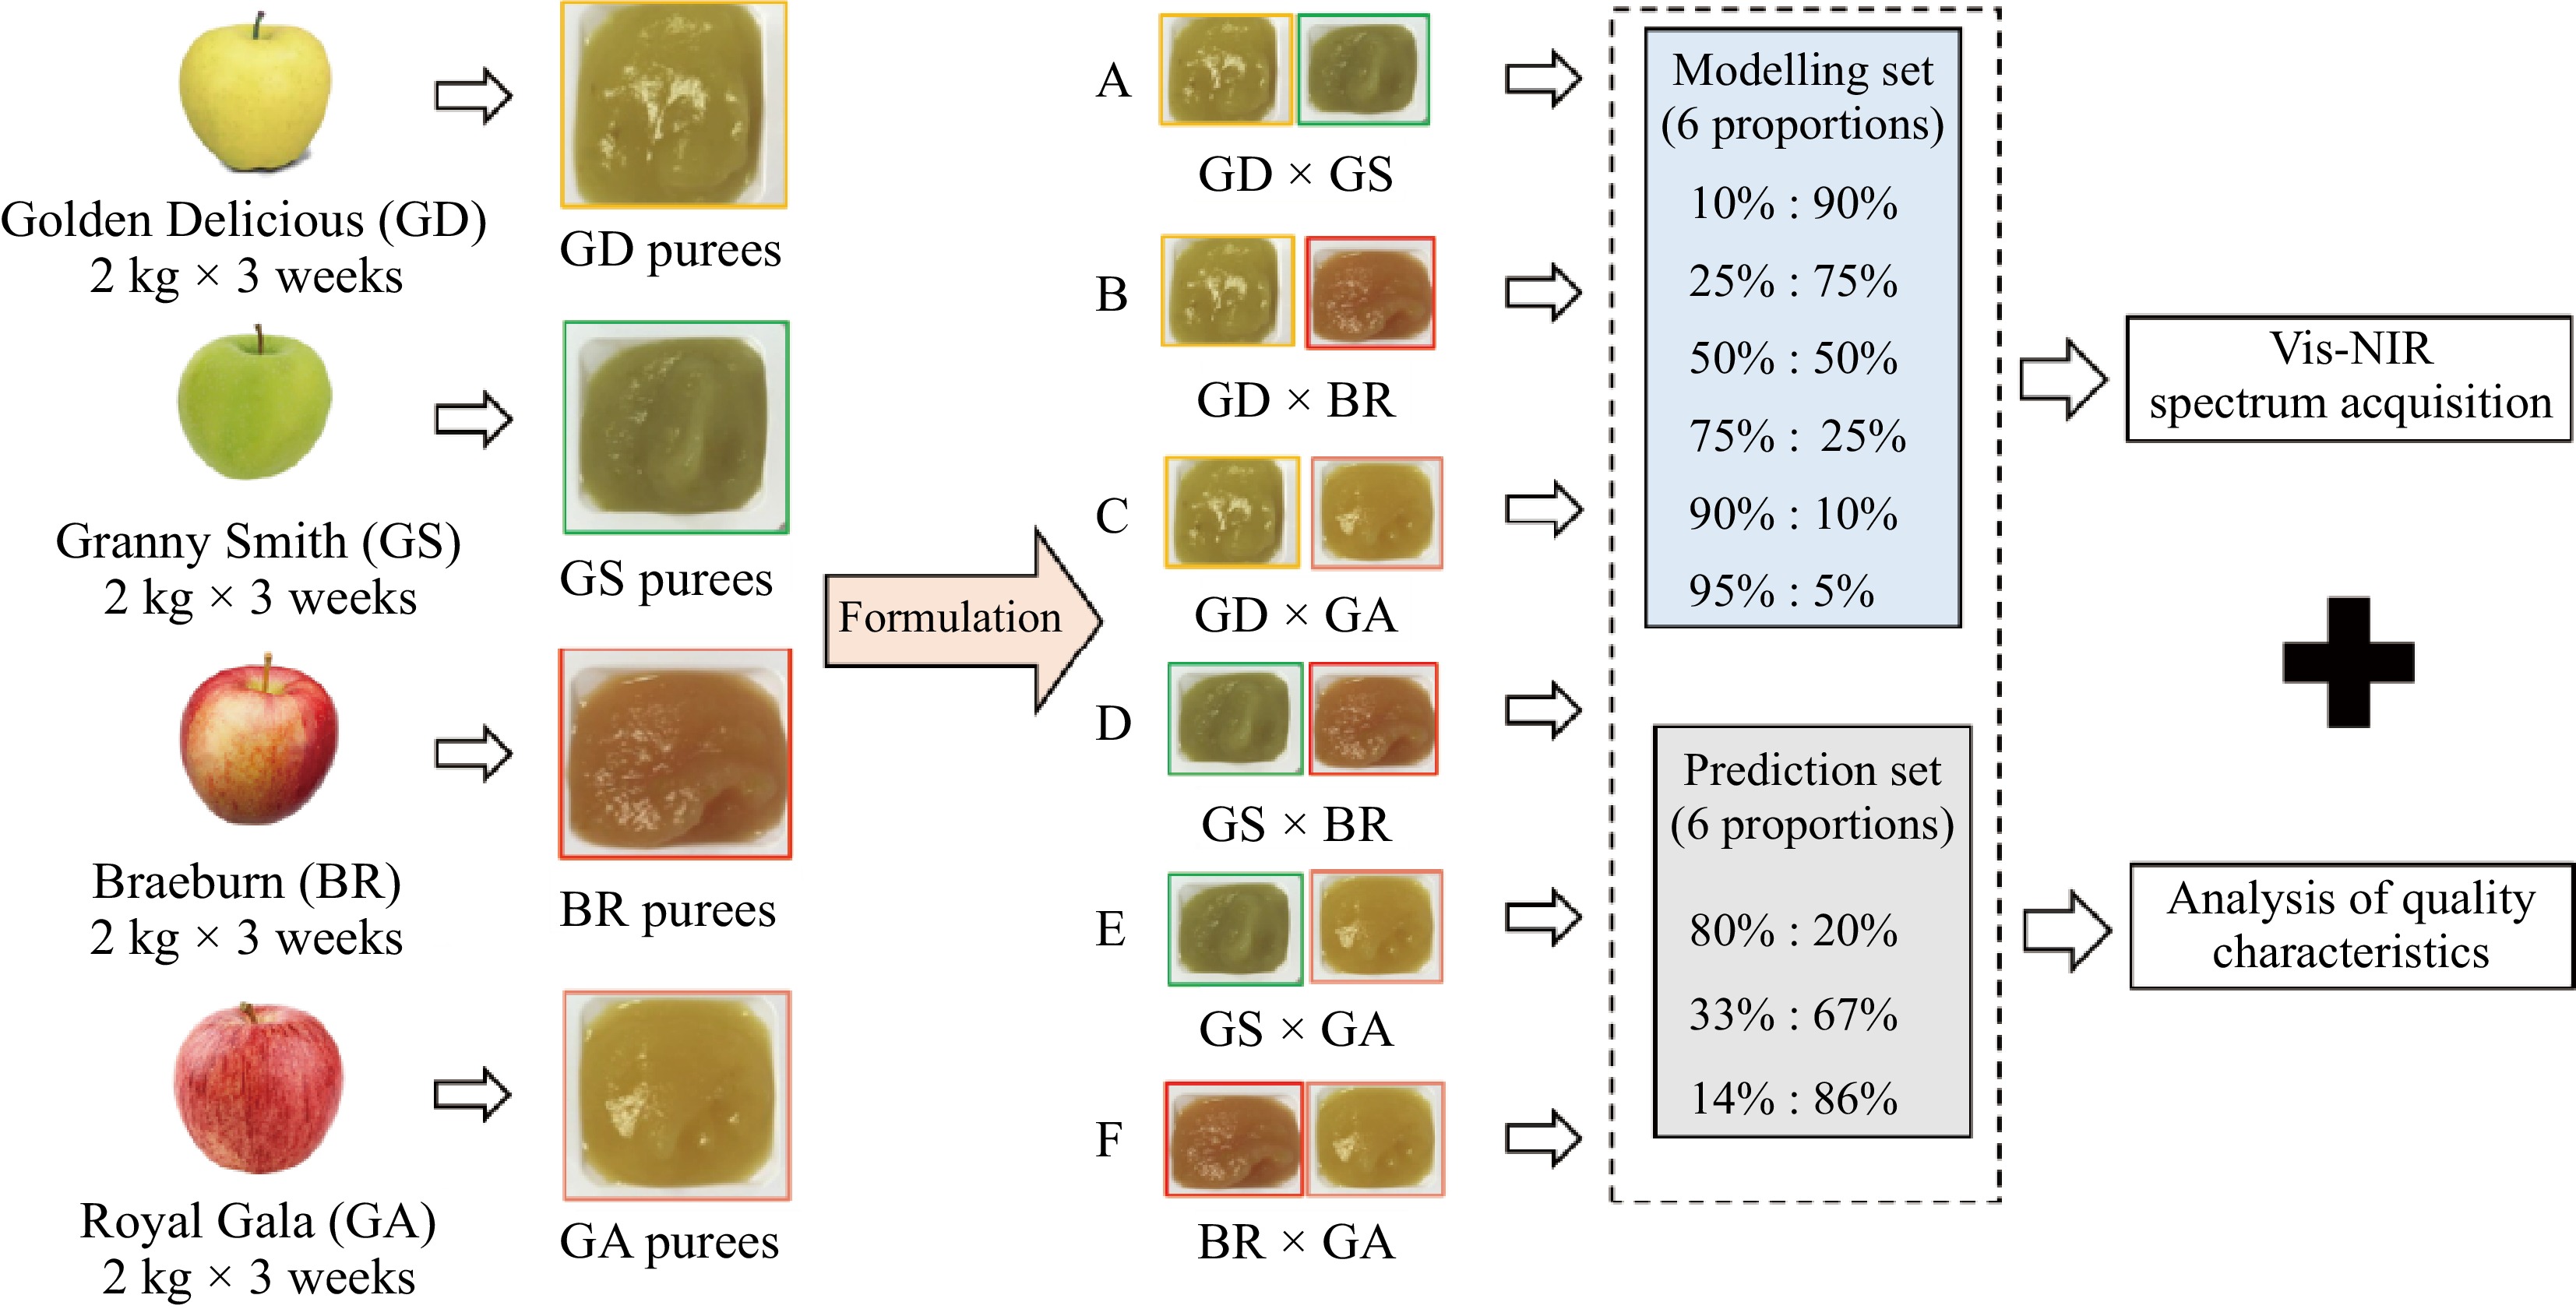
Figure 1.
Experimental scheme of puree reformation, quality characterizations, and spectral acquisition.
-

Figure 2.
Boxplot of colors (a* and b*), rheological parameters (η50), total sugars (TSC), titratable acidity (TA) and fructose of different formulated puree groups.
-

Figure 3.
Process of Vis-NIR spectral data by multivariate resolution alternative least square (MCR-ALS) and spectral reconstruction of formulated purees.
-
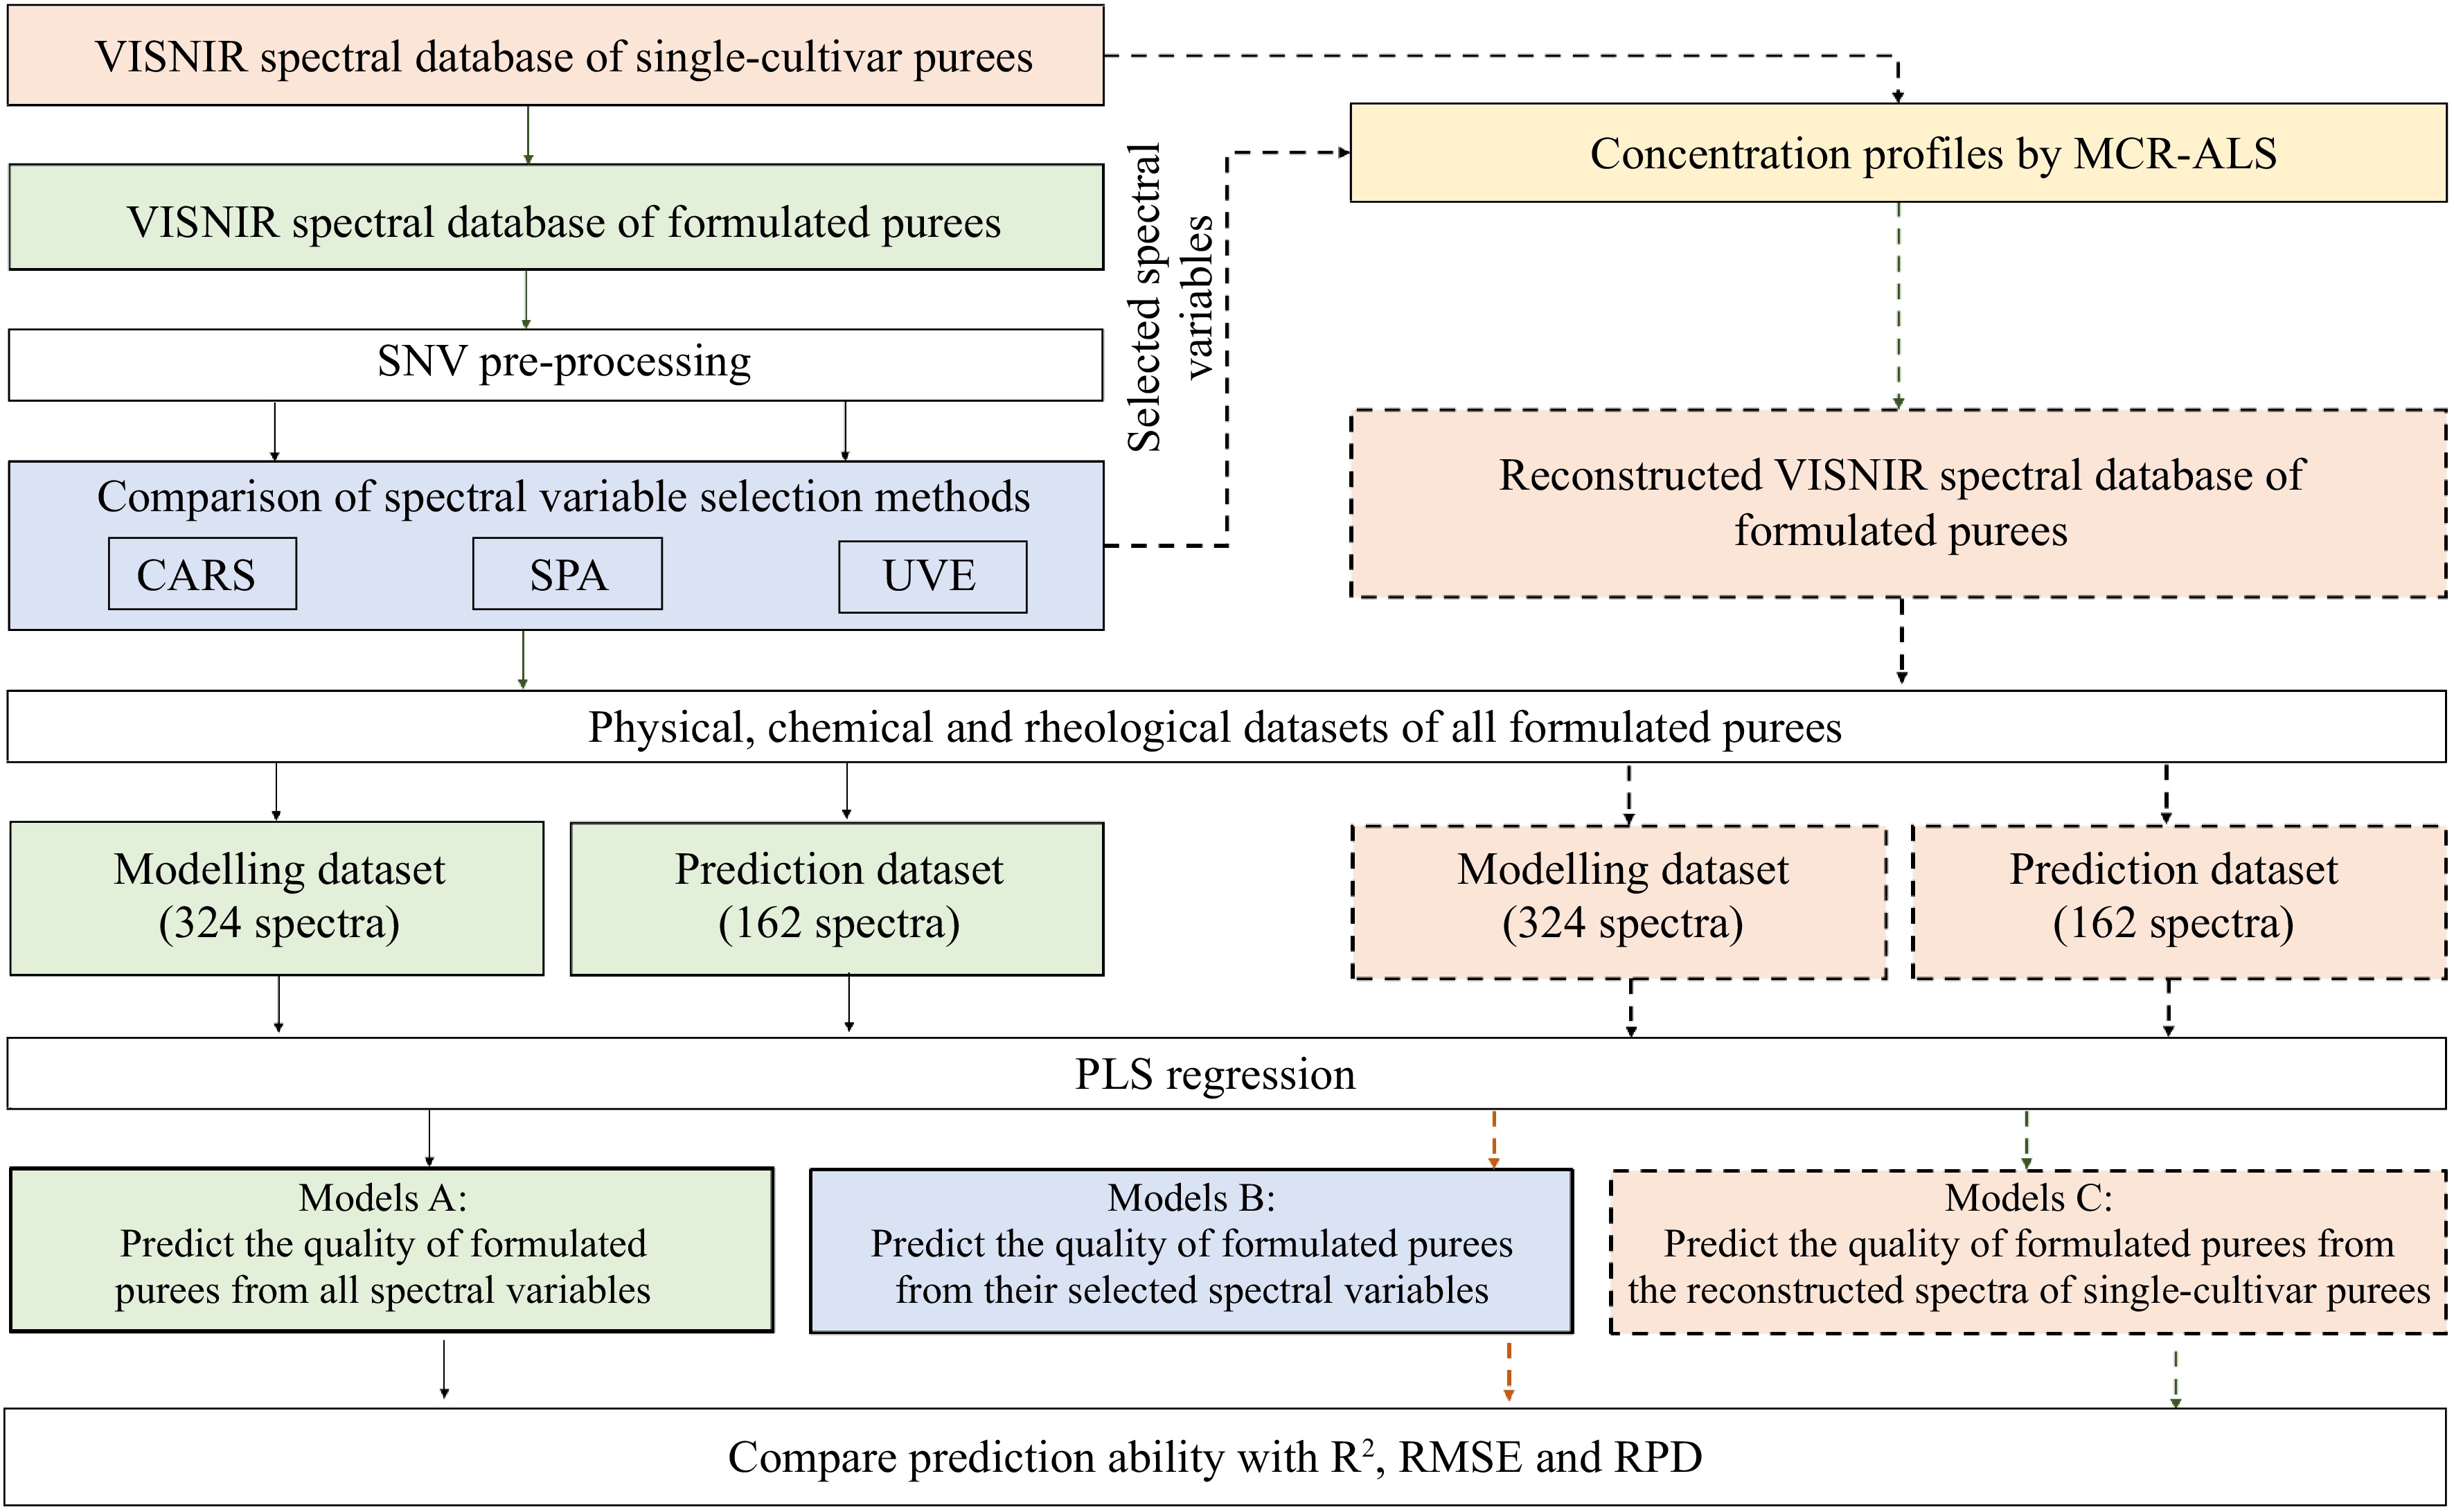
Figure 4.
Overview of the applied methodology of Vis-NIR spectra pre-processing, spectral variable selection, spectral reconstruction and multivariate regression.
-

Figure 5.
Principal component analysis (PCA) of the SNV pre-treated Vis-NIR spectra of four single cultivar purees. (a) Discrimination map of four apple cultivars. (b) Beta-coefficients of first principal component (PC1). (c) Beta-coefficients of second principal component (PC2).
-

Figure 6.
ANOVA results of the SNV pre-treated (a) visible (500–780 nm) spectra and (b) NIR (780–2,500 nm) spectra of all formulated apple purees.
-
Parameters Range SD Methods Variables PLSR $\rm R_c^2 $ RMSEC $\rm R_p^2 $ RMSEP RPD L* 41.6−48.9 1.5 FULL 2,722 0.87 0.6 0.73 0.7 1.76 SPA 6 0.83 0.6 0.81 0.6 2.13 CARS 51 0.87 0.6 0.81 0.6 2.14 UVE 1,259 0.88 0.5 0.80 0.6 2.06 a* (−4.8)−2.4 2.0 FULL 2,722 0.98 0.3 0.96 0.4 5.17 SPA 6 0.98 0.3 0.96 0.4 5.24 CARS 33 0.98 0.3 0.97 0.3 5.56 UVE 1,596 0.98 0.3 0.97 0.4 5.38 b* 9.6−18.4 1.7 FULL 2,722 0.71 0.9 0.54 1.2 1.48 SPA 7 0.73 0.9 0.58 1.2 1.54 CARS 143 0.75 0.8 0.57 1.2 1.53 UVE 997 0.75 0.8 0.59 1.2 1.55 Viscosity η100 834−1,721 210 FULL 2,722 0.83 84.6 0.79 98.2 2.17 SPA 9 0.79 95.5 0.82 92.4 2.30 CARS 44 0.84 83.3 0.82 91.2 2.33 UVE 1,193 0.87 76.0 0.85 85.4 2.49 Viscosity η50 526−1,029 119 FULL 2,722 0.88 40.2 0.83 50.8 2.38 SPA 11 0.82 49.0 0.82 51.5 2.35 CARS 166 0.86 43.6 0.85 47.1 2.57 UVE 1,133 0.88 40.9 0.87 44.5 2.73 DMC (g/g FW) 0.14−0.17 0.01 FULL 2,722 0.74 0.004 0.49 0.006 1.39 SPA 9 0.56 0.006 0.50 0.006 1.42 CARS 92 0.75 0.004 0.58 0.005 1.56 UVE 1,497 0.80 0.004 0.63 0.005 1.66 TSC (g/kg FW) 93.2−145.4 12.6 FULL 2,722 0.96 2.7 0.90 3.6 3.57 SPA 9 0.96 2.8 0.92 3.6 3.53 CARS 101 0.97 2.7 0.92 3.5 3.66 UVE 1,531 0.96 2.7 0.92 3.6 3.63 TA (meq/kg FW) 28.0−94.8 16.2 FULL 2,722 0.96 0.3 0.91 0.5 3.31 SPA 10 0.94 0.4 0.90 0.5 3.12 CARS 92 0.96 0.3 0.91 0.5 3.37 UVE 1061 0.96 0.3 0.91 0.5 3.34 pH 3.39−4.47 0.23 FULL 2722 0.90 0.07 0.86 0.09 2.57 SPA 8 0.69 0.13 0.69 0.14 1.76 CARS 51 0.88 0.08 0.88 0.09 2.69 UVE 1,385 0.88 0.08 0.87 0.09 2.73 Glucose (g/kg FW) 13.2−28.3 3.7 FULL 2,722 0.86 1.2 0.85 1.3 2.42 SPA 5 0.85 1.3 0.84 1.4 2.51 CARS 38 0.87 1.1 0.86 1.3 2.58 UVE 1,181 0.86 1.2 0.85 1.3 2.54 Fructose (g/kg FW) 40.2−80.3 9.1 FULL 2,722 0.71 4.9 0.54 6.0 1.46 SPA 12 0.59 5.8 0.57 6.2 1.42 CARS 92 0.64 5.5 0.61 5.5 1.61 UVE 1,235 0.63 5.6 0.61 5.5 1.61 Sucrose (g/kg FW) 33.2−57.3 5.5 FULL 2,722 0.74 2.8 0.66 3.1 1.72 SPA 16 0.67 3.2 0.64 3.2 1.65 CARS 92 0.73 2.9 0.63 3.3 1.61 UVE 1,279 0.67 3.2 0.64 3.4 1.60 Malic acid (g/kg FW) 3.0−8.8 1.3 FULL 2,722 0.93 0.3 0.91 0.4 3.33 SPA 20 0.91 0.4 0.90 0.4 3.16 CARS 92 0.92 0.4 0.91 0.4 3.34 UVE 952 0.92 0.4 0.92 0.4 3.36 $\rm R_c^2 $ $\rm R_p^2 $ Table 1.
PLS prediction of physical, chemical and rheological parameters of all formulated purees using Vis-NIR (500–2,500 nm) spectra or their selected spectral variables based on SPA, CARS and UVE methods.
-
Parameters Range SD LVs PLSR $\rm R_c^2 $ RMSEC $\rm R_p^2 $ RMSEP RPD L* 41.6−48.9 1.5 10 0.77 0.7 0.62 0.8 1.57 a* (−4.8)−2.4 2.0 8 0.91 0.6 0.92 0.6 3.30 b* 9.6−18.4 1.7 9 0.58 1.0 0.42 1.4 1.31 Viscosity η100 834−1721 210 10 0.81 87 0.81 96 2.22 Viscosity η50 526−1029 119 10 0.82 48 0.82 54 2.26 DMC (g/g FW) 0.14−0.17 0.01 10 0.57 0.005 0.43 0.006 1.38 TSC (g/kg FW) 93.2−145.4 12.6 10 0.91 3.6 0.86 4.8 2.64 TA (meq/kg FW) 28.0−94.8 16.2 8 0.92 0.4 0.85 0.6 2.55 pH 3.39−4.47 0.23 10 0.84 0.09 0.85 0.10 2.47 Glucose (g/kg FW) 13.2−28.3 3.7 10 0.85 1.3 0.82 1.5 2.25 Fructose (g/kg FW) 40.2−80.3 9.1 10 0.68 5.0 0.60 5.6 1.58 Sucrose (g/kg FW) 33.2−57.3 5.5 13 0.82 2.3 0.77 2.6 2.08 Malic acid (g/kg FW) 3.0−8.8 1.3 8 0.93 0.3 0.86 0.5 2.67 $\rm R_c^2 $ $\rm R_p^2 $ Table 2.
Prediction results of chemical and rheological parameters of all formulated purees from the reconstructed spectra computed by the concentration of MCR-ALS and the selected spectral variables of single-cultivar purees.
Figures
(6)
Tables
(2)