-

Figure 1.
Effect of different varieties and fertilizers on the economics of cowpea production.
-

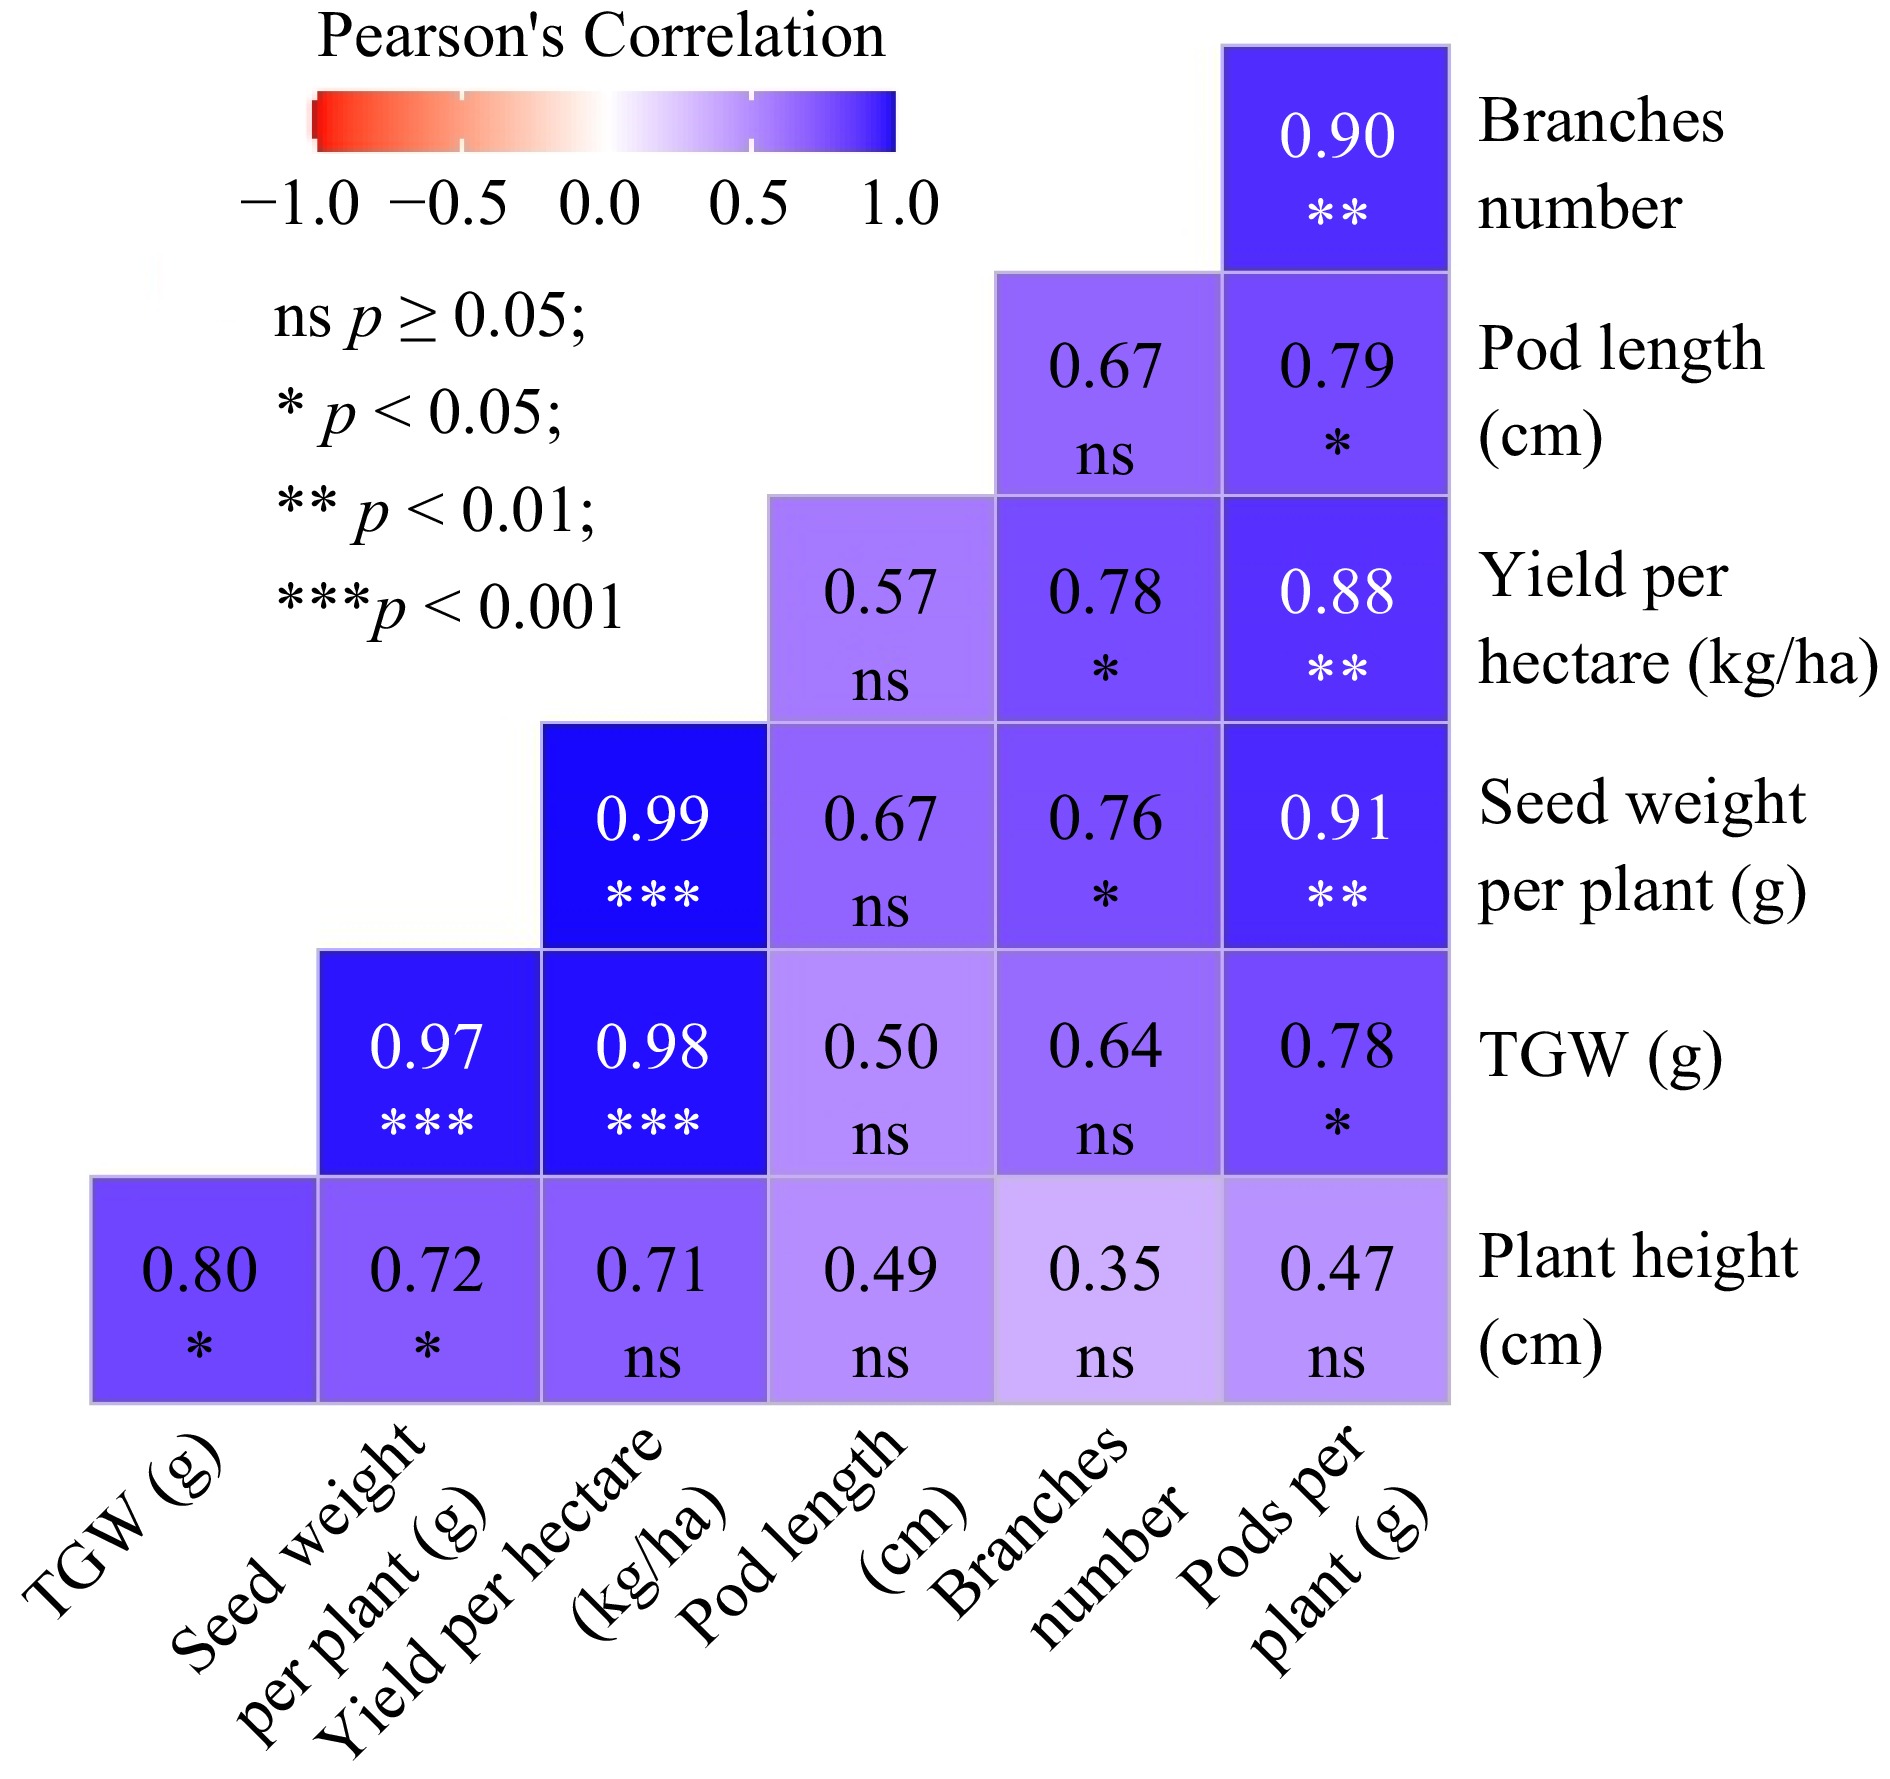
Figure 2.
Correlation among various growth and yield parameters of cowpea.
-
S. N. Soil properties Values 1. Textural class Clay loam (Alluvial) 2. Chemical properties 2.1 pH 7.7 (Alkaline) 2.2 Nitrogen (%) 0.09 (Low) 2.3 Phosphorus, P2O5 (kg·ha−1) (Low) 2.4 Potash, K2O (kg·ha−1) (Low) 2.5 Organic matter (%) 1.95 (Low) Table 1.
Physico-chemical characteristics of soil in the experimental field.
-
Treatment Plant height (cm) 30 DAS 45 DAS 60 DAS Variety Malepatan-1 (V1) 40.06b 77.56a 125.73a Stickless (V2) 42.72a 64.37b 86.19b LSD (0.05) 1.26 1.26 7.30 SEM (±) 0.21 0.44 1.24 F-test *** *** *** CV (%) 4.42 2.57 9.96 Fertilizer Control 37.06d 60.16e 86.46c Mycorrhiza 40.58c 68.60d 101.79bc Rhizobium 40.99bc 67.89cd 98.40b RDF 41.45bc 72.97bc 109.86b Mycorrhiza + Rhizobium 43.15ab 74.27b 111.38b Mycorrhiza + Rhizobium + RDF 45.10a 81.90a 127.85a LSD (0.05) 2.19 4.56 12.64 SEM (±) 0.12 0.25 0.71 F-test *** *** *** CV (%) 4.42 5.37 9.96 Grand mean 41.39 70.96 105.96 Data in columns with the same letters in DMRT are not significantly different (p = 0.05), SEM = Standard Errors of Means, CV = Coefficient of Variation, LSD = Least Significant Difference, *** = significant at p < 0.001. Table 2.
Effect of different varieties and fertilizers on the plant height of cowpea.
-
Treatment Number of branches plant−1 30 DAS 45 DAS 60 DAS Variety Malepatan-1 2.71a 4.09b 5.39b Stickless 2.03b 4.49a 6.36a LSD (0.05) 0.26 0.34 0.45 SEm (±) 0.044 0.059 0.078 F-test *** * *** CV (%) 15.90 11.74 11.12 Fertilizer Control 2.03c 3.72b 5.25c Mycorrhiza 2.13c 4.13b 5.34bc Rhizobium 2.28bc 3.80b 5.61bc RDF 1.94c 4.13b 5.94bc Mycorrhiza + Rhizobium 2.69b 4.33b 6.14b Mycorrhiza + Rhizobium + RDF 3.16a 5.63a 6.97a LSD (0.05) 0.45 0.604 0.78 SEM (±) 0.025 0.034 0.045 F-test *** *** ** CV (%) 15.90 11.74 11.12 Grand mean 2.37 4.29 5.87 Data in columns with the same letters in DMRT are not significantly different (p = 0.05), SEM = Standard Errors of Means, CV = Coefficient of Variation, LSD = Least Significant Difference, * = significant at p < 0.05, ** = significant at p < 0.01, *** = significant at p<0.001. Table 3.
Effect of different varieties and fertilizers on the branches per plant of cowpea.
-
Treatment Pods plant-1 Seed weight plant−1 (g) Pod length (cm) Variety Malepatan-1 27.50b 72.29a 25.39 Stickless 31.34a 66.08b 26.31 LSD (0.05) 2.62 4.85 SEM (±) 0.44 0.82 F-test ** * NS CV (%) 12.92 10.15 Fertilizer Control 24.61c 47.92d 23.47 Mycorrhiza 28.47bc 62.21c 27.01 Rhizobium 27.86bc 57.01c 25.25 RDF 26.52c 57.65c 25.81 Mycorrhiza + Rhizobium 31.86b 88.98b 25.71 Mycorrhiza + Rhizobium + RDF 37.19a 101.35a 27.84 LSD (0.05) 4.55 8.41 SEM (±) 0.25 0.47 F-test *** *** NS CV (%) 12.92 10.15 Grand mean 29.42 69.19 Data in columns with the same letters in DMRT are not significantly different (p = 0.05), SEM = Standard Errors of Means, CV = Coefficient of Variation, LSD = Least Significant Difference, * = significant at p < 0.05, ** = significant at p < 0.01, *** = significant at p < 0.001, NS = Non-significant. Table 4.
Effect of different varieties and fertilizers on the pods per plant, seed weight and pod length of cowpea.
-
Treatment Yield plot−1
(g)Yield hectare
(kg ha−1)1,000 seed weight
(g)Variety Malepatan-1 1,273.24a 3,536.83a 151.62a Stickless 1,173.21b 3,258.94b 125.46b LSD (0.05) 92.82 257.86 13.06 SEM (±) 15.82 43.96 2.23 F-test * * *** CV (%) 10.97 10.97 13.64 Fertilizer Control 933.27b 2,592.43b 116.38b Mycorrhiza 1,024.27b 2,845.21b 123.08b Rhizobium 1,061.67b 2,949.10b 123.03b RDF 1,067.35b 2,964.90b 124.71b Mycorrhiza + Rhizobium 1,555.69a 4,321.41a 167.19a Mycorrhiza + Rhizobium + RDF 1,697.12a 4,714.26a 176.83a LSD (0.05) 160.78 446.62 22.62 SEM (±) 9.13 25.38 1.28 F-test *** *** *** CV (%) 10.97 10.97 13.64 Grand mean 1,223.23 3,397.89 138.54 Data in columns with the same letters in DMRT are not significantly different (p = 0.05), SEM = Standard Errors of Means, CV = Coefficient of Variation, LSD = Least Significant Difference, * = significant at p < 0.05, *** = significant at p < 0.001. Table 5.
Effect of different varieties and fertilizers on the yield and test weight of cowpea.
-
S.N. New condition New total cost (NRs.) New gross return (NRs.) Net return (NRs.) BCR Remarks 1 Total cost increased by 10% 119625 518569.2 398944.2 3.33 Still feasible 2 Gross benefit decreased by 10% 108750 466712.3 357962.3 3.29 Still feasible 3 Total cost increased by 10% and
gross benefit decreased by 10%119625 466712.3 347087.3 2.90 Still feasible Table 6.
Sensitivity analysis of cowpea with the application of mycorrhiza + rhizobium treatment.
Figures
(2)
Tables
(6)