-

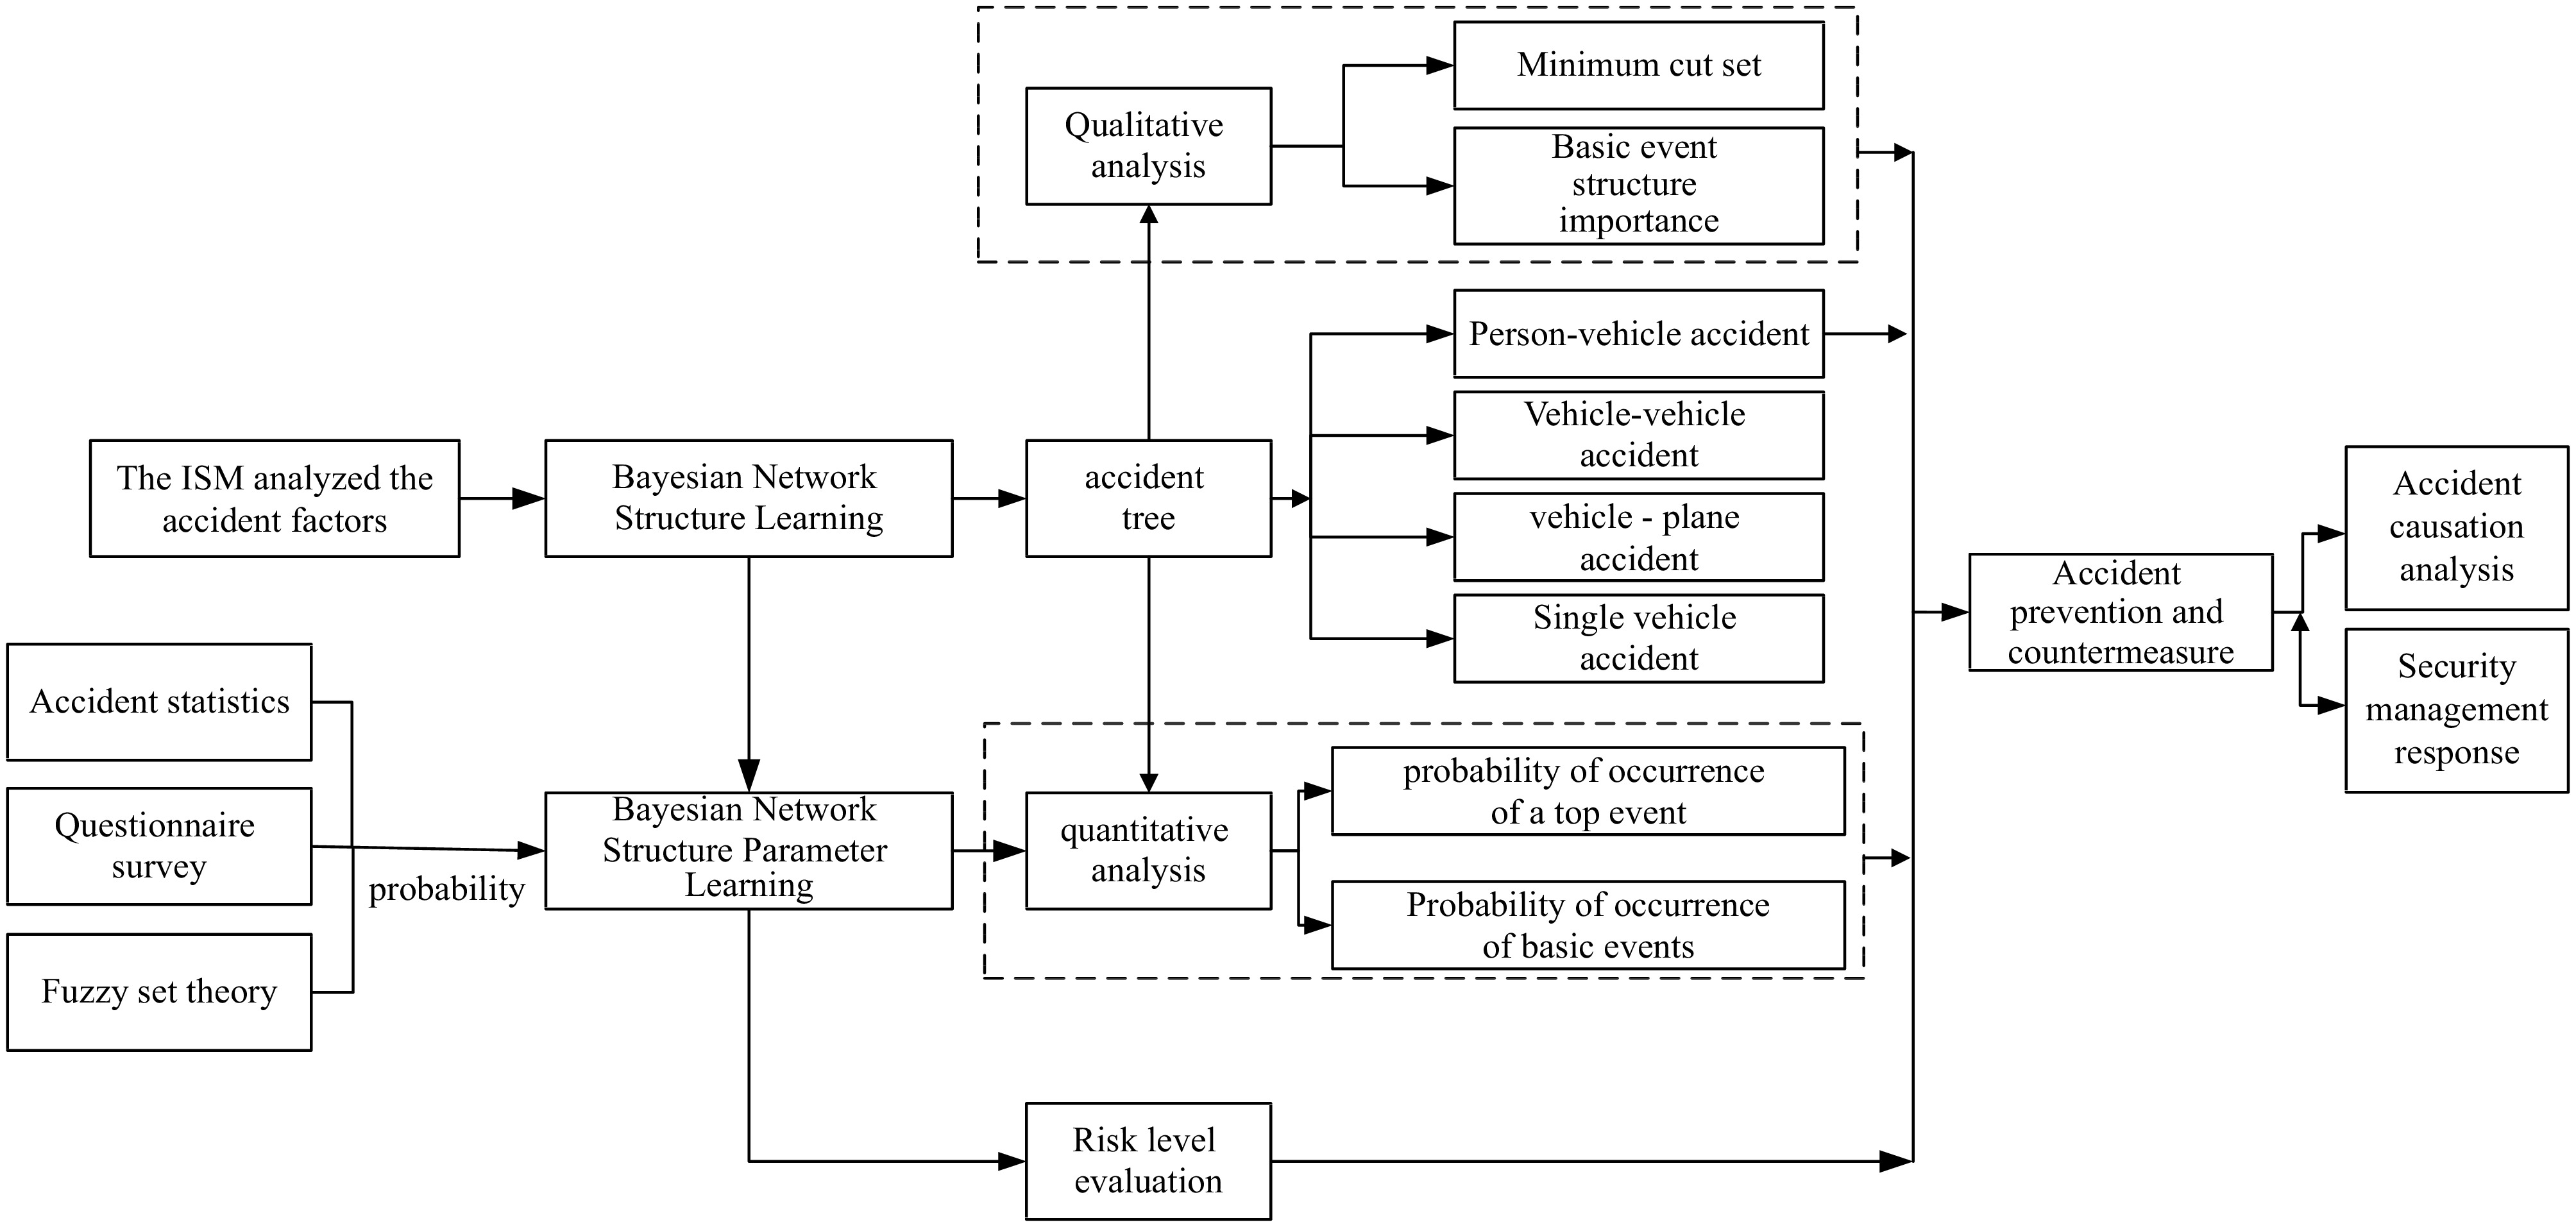
Figure 1.
Technical route.
-

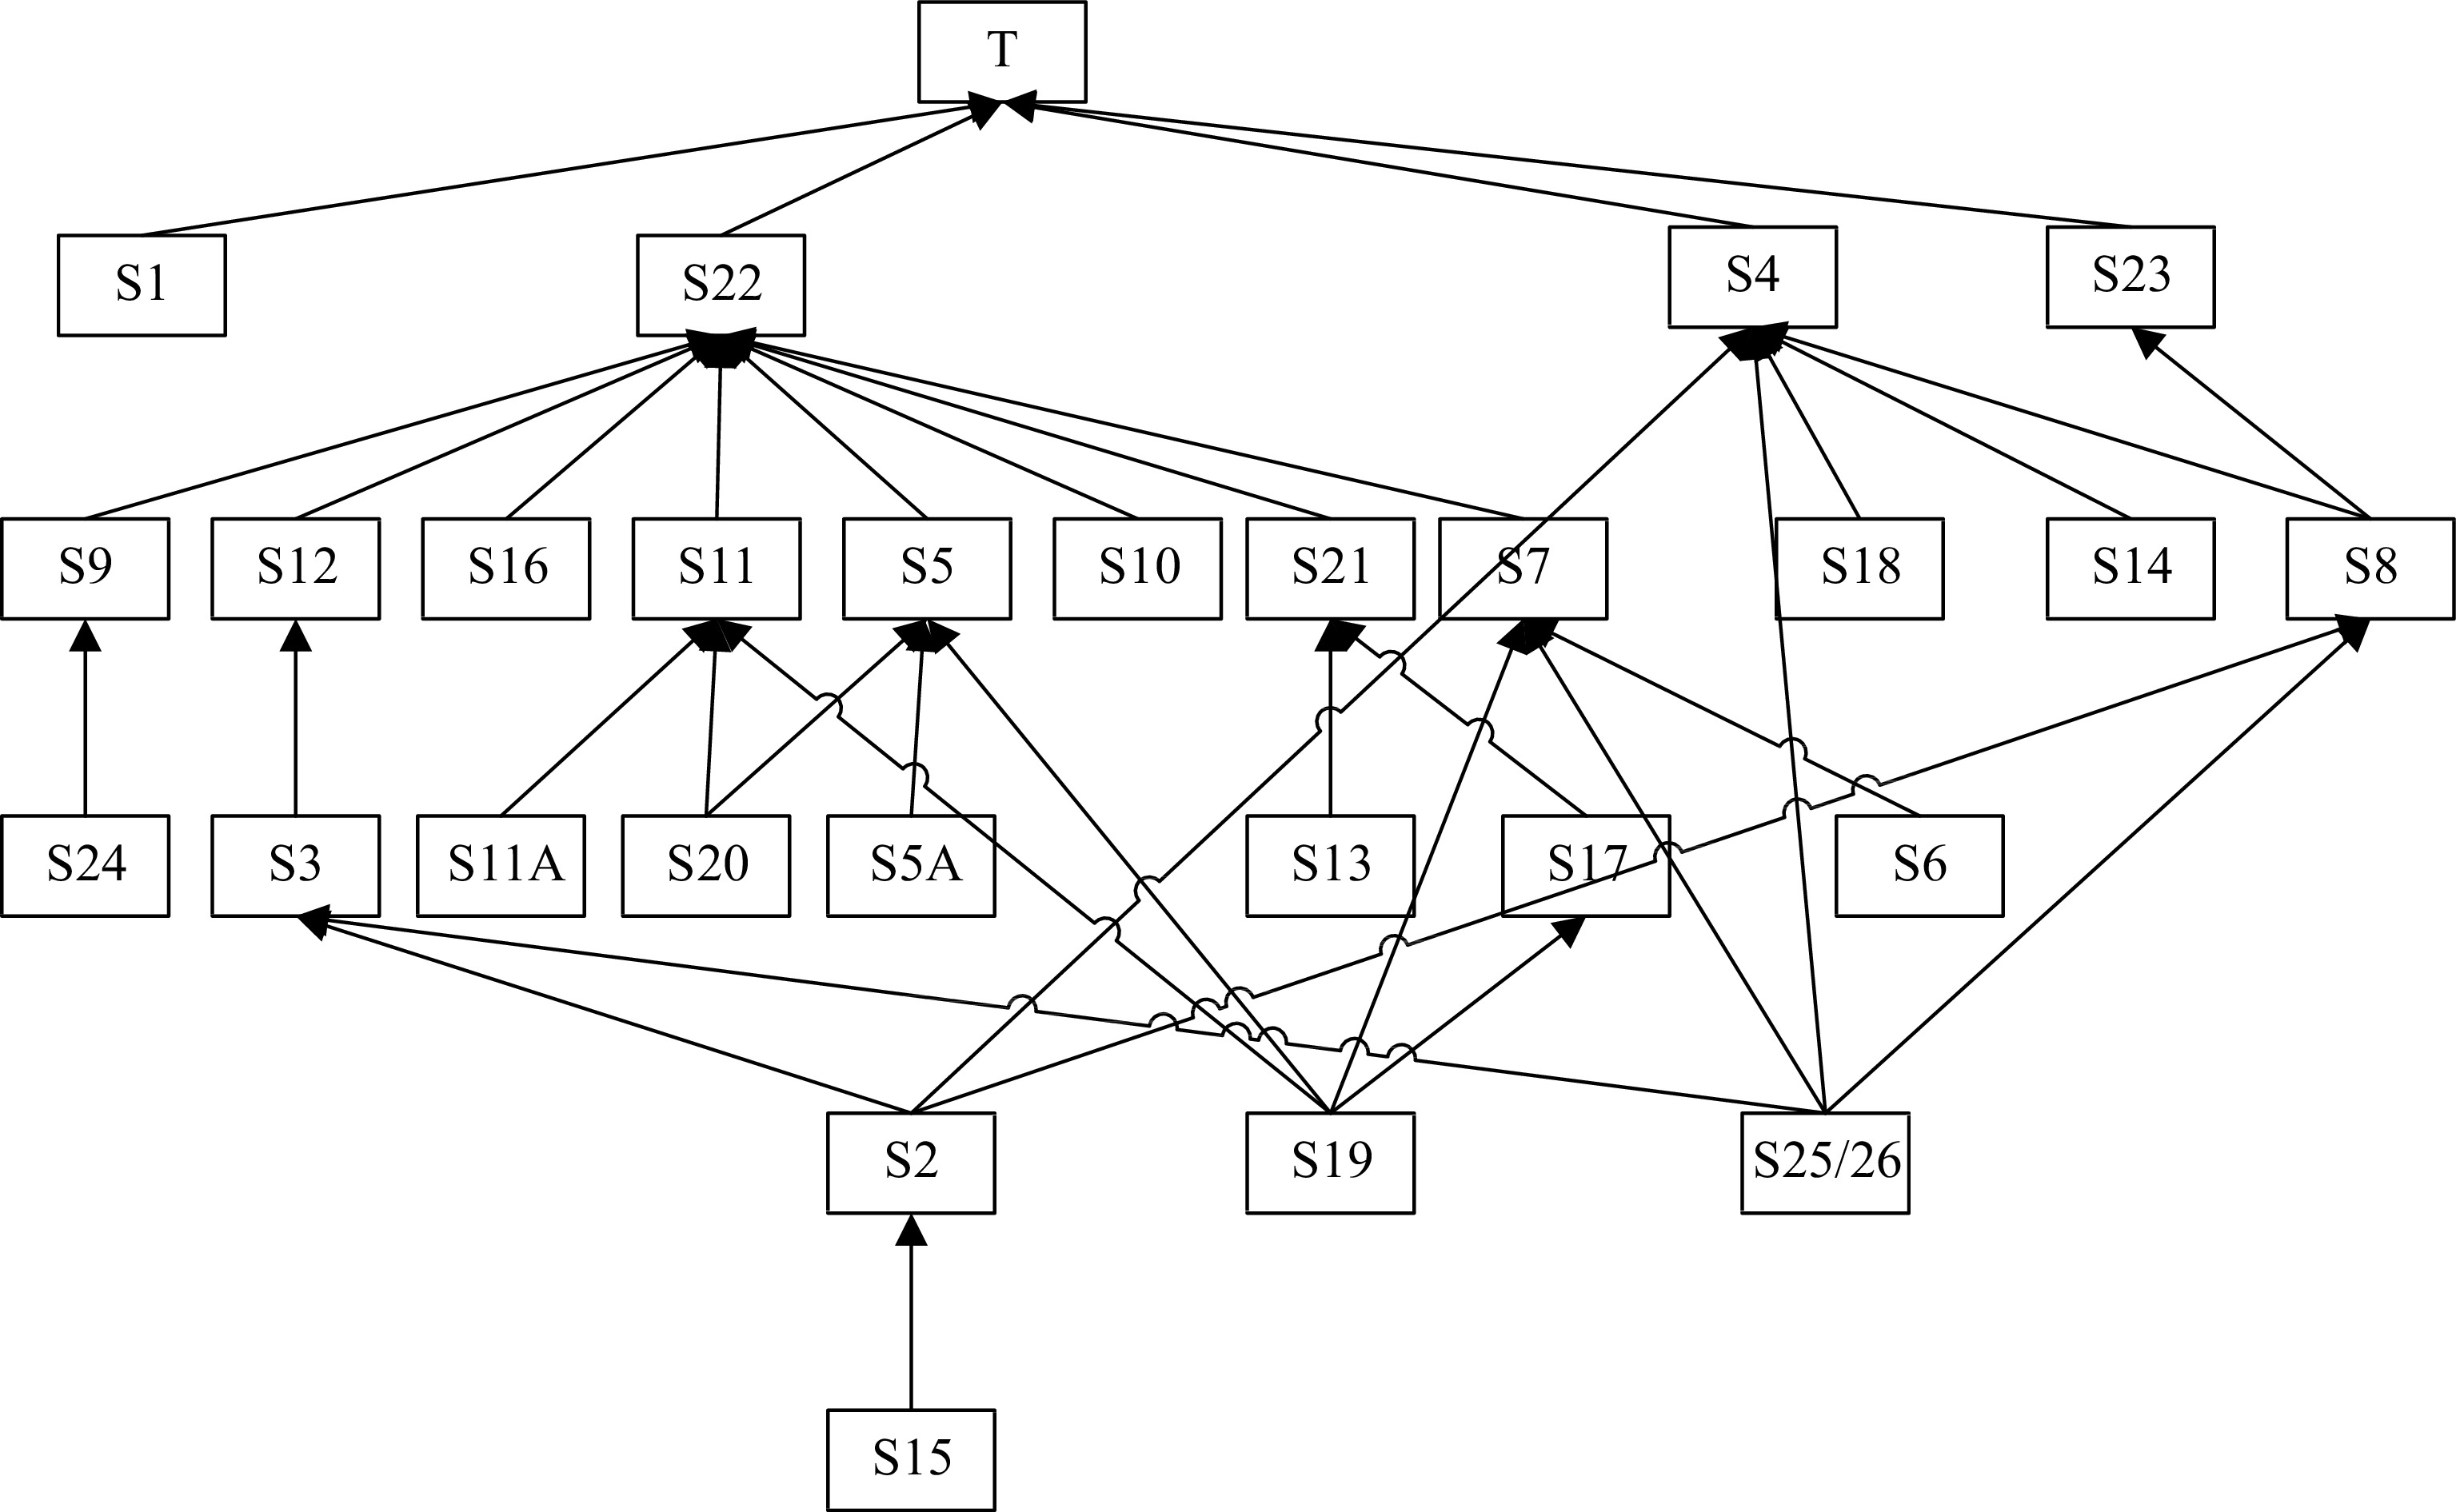
Figure 2.
Explanatory structure model constructed from various influencing factors.
-

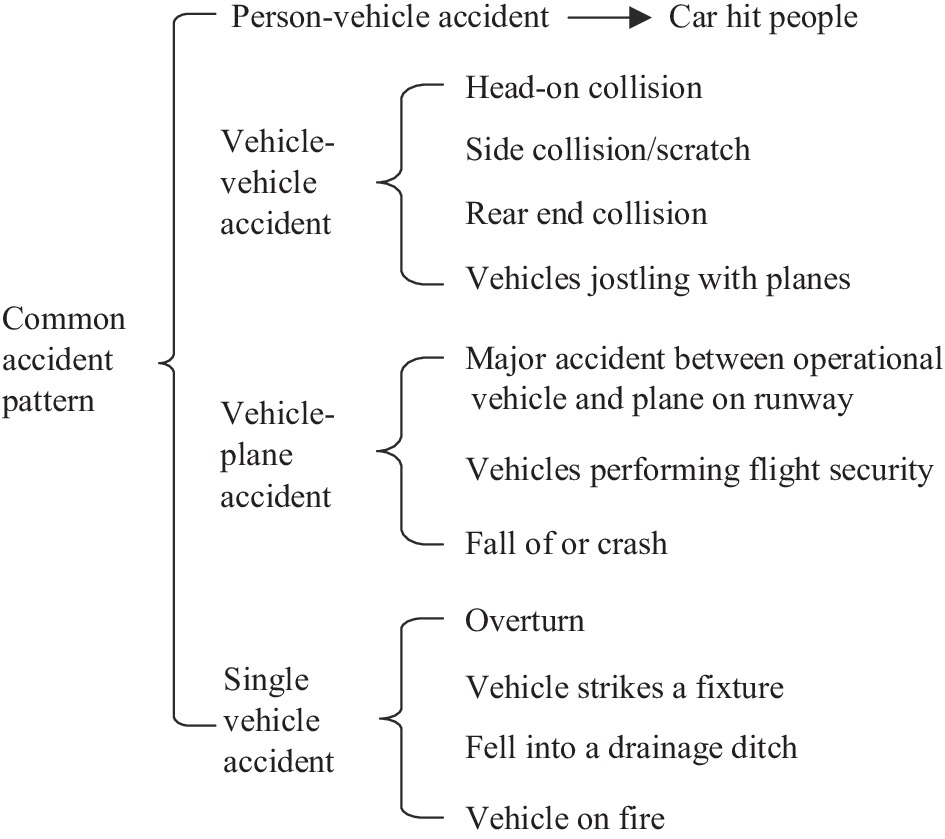
Figure 3.
Classification of common accident patterns in aircraft movement areas.
-

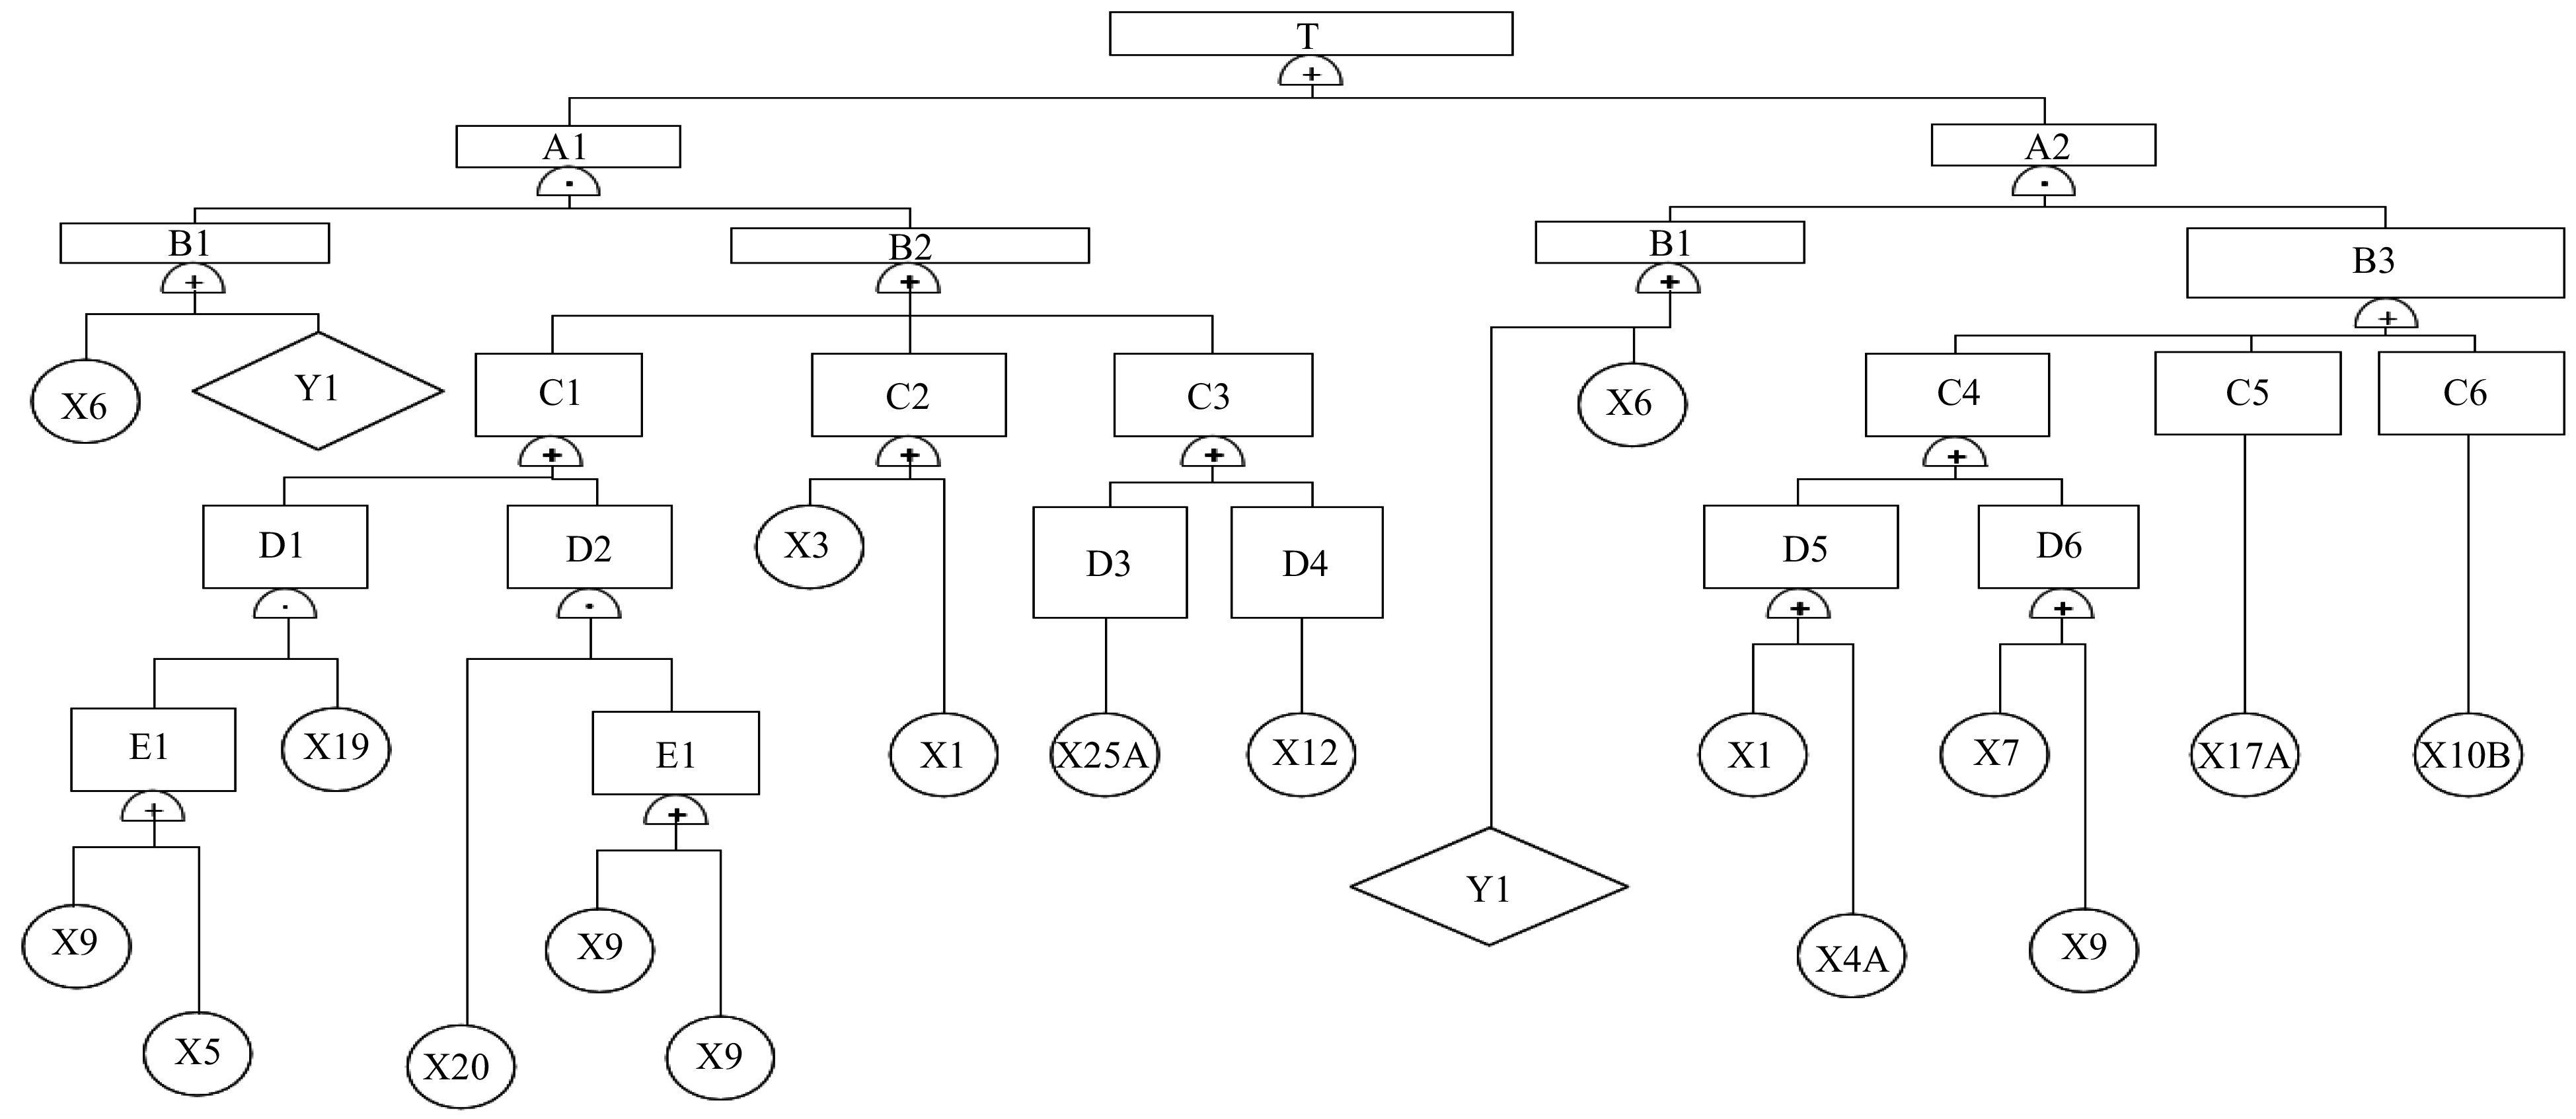
Figure 4.
Person-vehicle fault tree model.
-
Type Influencing factor Explanation Variable setting Driver S1 Fatigue factor Fatigue of the driver 0: negligible; 1: acceptable;
2: unacceptable.S2 Time pressure factor Situations where pilots are under time pressure to secure flights 0: acceptable; 1: unacceptable; S3 Correct operation of special equipment factors Whether the driver has violated the law or operated the vehicle's special equipment improperly 0: acceptable; 1: illegal operation of special vehicle equipment S4 Driving violation factor Whether the driver in the process of driving does not follow the prescribed route, speeding and other violations 0: acceptable; 1. illegal driving Pedestrian S5 Pedestrian visibility factor Whether pedestrians on the road can attract the attention of drivers in time 0: good visibility; 1: poor visibility S5A Pedestrians wearing reflective vests Pedestrians who wear reflective vests as required can greatly improve their own visibility 0: yes; 1: no S6 Physiological factor The physical condition of the pedestrian 0: acceptable; 1: not acceptable S7 The choice of walking route The walking of pedestrians in accordance with the prescribed route 0: acceptable; 1: not walking on the prescribed route S8 Unqualified illegal operation Whether unqualified personnel illegally drive motor vehicles or illegally operate special equipment 0: acceptable; 1: illegal operation of unqualified personnel Other personnel S9 Passengers or non-staff Whether passengers or other non-staff members stray into the aircraft activity area and become uncontrolled 0: acceptable; 1: there were passengers straying into the activity area and it was not controlled Vehicle S10 Vehicle technical status Including vehicle steering system, driving system, braking system, electrical system and so on 0: in good condition; 1: poor state S11 Vehicle identification Visibility of vehicles on the road 0: in good condition; 1: poor state S11A Vehicle installation of reflective warning signs Refers to whether the vehicle is equipped with safety warning lights and reflective warning signs as required 0: yes; 1: no S12 Vehicle dimensions Whether the shape of the special vehicle itself is too wide and too high, and whether the cargo are too long, too wide or too high 0: in good condition; 1: size overran S13 Stability of vehicle cargo Whether the vehicle and the cargo in its trailer are securely secured 0: in good condition;
1: the goods were unstableS14 Vehicle communication equipment Whether the communication equipment equipped with the vehicle is in good condition 0: in good condition; 1: poor state Airport road S15 Geometric property Including the road plane alignment, transverse and longitudinal section layout, visual distance assurance 0: in good condition; 1: poor state S16 Road crossing Including road level intersections, parking entrances and exits 0: in good condition; 1: poor state S17 Pavement condition Including flatness, snow and water on pavement, road collapse, etc. 0: in good condition; 1: poor state S18 Indicator marking line Whether the road indication signs in the airport are clear and reasonable, and whether the road markings are clearly visible 0: in good condition; 1: poor state Natural environment S19 Weather Rain, fog, snowstorms and other bad natural weather 0: negligible; 1: acceptable;
2: unacceptableTransportation (artificial) environment S20 Night lighting Whether the night lighting facilities are good 0: in good condition; 1: poor state S21 FOD (Foreign Object Debris) Presence of FOD in the carriageway 0: acceptable (normal road without fod); 1: unacceptable (fod on the road) S22 Driving environment An environment composed of various road traffic participants such as motor vehicles, non-motor vehicles and pedestrians 0: acceptable; 1: unacceptable S23 Roadside environment Various facilities and special equipment for aircraft maintenance and flight protection along the carriageway 0: acceptable; 1: unacceptable Management S24 Management of airport operation department The management level of the airport operation management department 0: acceptable; 1: unacceptable S25 Supervise the setting of reward and punishment system The supervision and punishment mechanism of the airport management department for violations of regulations 0: acceptable; 1: unacceptable S26 Integrity and implementation of safety education content Whether the content of personnel safety training is complete and comprehensive, and whether it is in place 0: acceptable; 1: unacceptable Table 1.
Road traffic safety risk assessment index system in the aircraft activity area of civil aviation airports.
-
No. Natural language variable Triangular fuzzy function (li, mi, ni) 1 Very low (0, 0, 0.1) 2 Low (0, 0.1, 0.3) 3 On the low side (0.1, 0.3, 0.5) 4 Medium (0.3, 0.5, 0.7) 5 High (0.5, 0.7, 0.9) 6 On the high side (0.7, 0.9, 1) 7 Very high (0.9, 1, 1) Table 2.
Correspondence between natural language variables and triangular fuzzy numbers.
-
State variable S1 S2 S3 S4 S5 S6 S7 S8 S9 S10 S11 S12 S13 0 4.4% 92.2% 99.7% 99.0% 96.9% 98.6% 96.7% 99.9% 99.9% 93.7% 97.4% 93.8% 97.3% 1 93.4% 7.8% 0.3% 1.0% 3.1% 1.4% 3.3% 0.1% 0.1% 6.3% 2.6% 6.2% 2.7% 2 2.2% State variable S14 S15 S16 S17 S18 S19 S20 S21 S22 S23 S24 S25/S26 0 98.5% 97.3% 94.7% 98.0% 97.4% 76.0% 97.2% 99.4% 81.1% 98.0% 97.6% 97.9% 1 1.5% 2.7% 5.3% 2.0% 2.6% 21.3% 2.8% 0.6% 18.9% 2.0% 2.4% 2.1% 2 2.7% Table 3.
Initial probability.
-
Aspect Event No. Person (a) Driver Fatigue driving X1 Greater time pressure X2 Illegal operation of vehicle special equipment X3 Driving violations: (1) Overspeed X4A (2) To maintain a safe distance X4B (3) Illegal overtaking (or side-by-side) X4C (4) Failure to stop at a stop line for observation X4D (b) Pedestrian No reflective vest X5 Poor physical condition X6 Not following the prescribed route X7 Inadvertent entry by non-staff such as travellers X9 Vehicle Vehicles in substandard technical condition: (1) Steering failure X10A (2) Brake failure X10B (3) Tire burst X10C (4) Parts aging X10D Vehicles not fitted with reflective signs or warning lamps X11 Vehicle (including cargo) oversized length (width, height) X12 Vehicle load not properly secured X13 Vehicle communication equipment failed X14 Road Road curves too quickly X15 Failure to provide facilities at intersections to eliminate blind areas X16 Poor road condition: Slippery roads X17 Road signs were not clearly marked X18 Environment Low visibility weather X19 Poor lighting at night X20 FOD on the road X21 Complex roadside environment X23 Management Inadequate road design: (1) Poorly designed road alignment X25A (2) Excessive intersections of carriageways with aircraft taxiways X25B Other Incorrect command (when the tower directed the wrong vehicle to enter the runway) X29 Driver misinterpreted the commander's instructions X30 Staff members brought fire into the airport in violation of the law X31 Inadvertent fire while using fire X32 Vehicles not equipped with effective fire extinguishing equipment X33 Personnel did not use fire extinguishing equipments X34 Omitted event: (1) Traffic coming from behind could not attract the attention of pedestrians Y1 (2) Vehicles overtaking oncoming traffic on a borrowed lane Y2 (3) Vehicles passing taxiway intersections with aircraft taxiing Y3 (4) Air Traffic Control failed in its duty Y4 (5) The car in front suddenly slowed down Y5 Table 4.
Basic cause events.
-
No. Event T Person-vehicle accident A1 Scenario 1 A2 Scenario 2 B1 Pedestrians failed to yield B2 Driver did not notice the pedestrian B3 Driver noticed the pedestrian braking, but the vehicle did not stop C1 Poor pedestrian visibility C2 Driver unsafe state 1 C3 Objective unsafe state C4 Human insecurity 1 C5 Environment is unsafe C6 Unsafe state of vehicle D1 Unsafe state 1 D2 Unsafe state 2 D3 Blind areas exist at road junctions D4 Large vehicles had visual blind areas D5 Driver unsafe state 2 D6 Pedestrian burst out E1 Human insecurity 2 Table 5.
Resulting events of the person-vehicle fault tree.
-
No. Minimum cut set Description 1 {X6, X5, X19} In low visibility and bad weather, pedestrians without reflective vests were less noticeable to vehicle drivers, and those with poor physical condition reacted slowly and were unable to avoid vehicles. 2 {X6, X5, X20} In poorly lit road environments at night, pedestrians without reflective vests were less noticeable to vehicle drivers, and those with poor physical condition reacted slowly and were unable to avoid vehicles. 3 {X6, X3} Drivers illegally operated special on-board equipment, and pedestrians with poor physical condition reacted slowly and were unable to avoid vehicles. 4 {X6, X1} Drivers drove fatigued, and pedestrians with poor physical condition reacted slowly and were unable to avoid vehicles. 5 {X6, X25A} The road alignment was not reasonably designed, and there were blind areas at corners that made it difficult for drivers to spot pedestrians, and pedestrians in poor physical condition reacted slowly to avoid vehicles. 6 {X6, X12} Vehicles were too large with blind areas, and pedestrians in poor physical condition reacted slowly to avoid vehicles. 7 {X6, 4A} The driver was speeding and the pedestrian in poor physical condition reacted slowly to avoid vehicles. 8 {X6, X7} Pedestrians failing to follow the prescribed route and pedestrians in poor physical condition with slow reaction time failing to yield to vehicles. 9 {X6, X9} Passengers or other outsiders mistakenly entered the aircraft's area of operation and was in poor physical condition and slowed to avoid the vehicle. 10 {X6, X17A} Slippery road surfaces and slow reaction time of pedestrians in poor physical condition to avoid vehicles. 11 {X6, X10B} Vehicle brakes failed and pedestrians in poor physical condition reacted slowly to avoid the vehicle. 12 {Y1, X5, X19} Vehicles approaching from behind pedestrians and pedestrians not wearing reflective vests were not easily detected by vehicle drivers in bad weather with low visibility. 13 {Y1, X5, X20} Vehicles approaching from behind pedestrians and pedestrians not wearing reflective vests in poorly lit road environments at night were not easily detected by vehicle drivers. 14 {Y1, X3} Vehicle approaching from behind pedestrians and driver's unauthorised operation of on-board special equipment. 15 {Y1, X1} Vehicle approaching from behind pedestrians and driver fatigue. 16 {Y1, X25A} The road design was not optimal, with blind areas at the bends that made it difficult for the driver to spot the pedestrian. As the vehicle was behind the pedestrian, they couldn't detect and avoid it in time. 17 {Y1, X12} Vehicles approaching from behind pedestrians with blind areas due to the size of the vehicle. 18 {Y1, 4A} Vehicle approaching from behind pedestrians and driver speeding. 19 {Y1, X7} Pedestrian deviated from the prescribed route, and as the vehicle was behind them, they couldn't identify and avoid it on time. 20 {Y1, X9} There were accidental entries of an outside people, and with a vehicle approaching from behind the pedestrians, they couldn't detect and avoid it in time. 21 {Y1, X17A} Slippery road surface and vehicles behind pedestrians, pedestrians were unable to spot and avoid vehicles in time. 22 {Y1, X10B} Vehicle brakes fail and vehicles behind pedestrians, pedestrians were unable to spot and avoid vehicles in time. Table 6.
Minimum cut set of person-vehicle fault tree.
-
Importance ranking Basic cause event 1 X6, Y1 2 X1, X3, X4A, X7, X9, X10B, X12, X17, X25A 3 X5 4 X19, X20 Table 7.
Ranking of importance of basic event structure in person-vehicle fault tree model.
-
No. Minimal
cut setCut set probability
(per million)Top event probability
(per million)Accident pattern description 1 {X6, X5, X19} 12 2,558 Traffic accidents involving pedestrians who failed to yield to vehicles due to their physiological condition when vehicles were approaching them 2 {X6, X5, X20} 12 3 {X6, X3} 42 4 {X6, X1} 308 5 {X6, X25A} 378 6 {X6, X12} 868 7 {X6, 4A} 3 8 {X6, X7} 462 9 {X6, X9} 14 10 {X6, X17A} 280 11 {X6, X10B} 182 Table 8.
Probability calculation value of person-vehicle fault tree.
-
Theoretical model calculation and analysis The important hazard sources were identified by
accident causation analysisFormulate security management countermeasures Bayesian Network Model Pedestrian traffic
characteristicsUnder the influence of inclement natural weather, it could lead to pedestrians have poor visibility and do not follow prescribed routes, poor vehicle recognition and slippery roads. (1) Driver traffic characteristics Driver fatigue, high time pressures (2) Fault Tree Model Quantitative calculation
resultsDriver fatigue, high time pressures (2) Complex roadside environment (3)(4) Special vehicles have visual blind areas. (5) Qualitative analysis of
person-vehicle fault treeSpecial vehicles have visual blind areas. (5) The driver illegally operated special equipment, speeding. (6) Pedestrians not wearing reflective undershirts and not following the prescribed route. (6) Passengers mistakenly entering the aircraft activity area. (7) Blind areas at intersections. (8) Table 9.
Security management countermeasures.
Figures
(4)
Tables
(9)