


-
Airports are large and complex systems and aircraft activity areas are important airport facilities. Roads in the aircraft activity area of the airport are used for the take-off, landing, parking of aircraft and the movement of people and vehicles in the area of the ground activity marked in connection with this[1]. It is very different from social traffic: many facilities and equipment for aircraft maintenance and protection are stored on both sides of the road in the aircraft activity area, as well as the existence of many intersections, the traffic environment and the roadside environment are complex. Any error in pilot judgement is likely to jeopardize the safety of aircraft operations. Therefore, the traffic accident risk in airport is higher than that of the social traffic environment.
For the safety of civil aviation airports, the International Civil Aviation Organization (ICAO) had established a unified safety management system (SMS) among its member states. The authoritative reference and guidelines for aviation safety management were embodied in the 'ICAO Safety Management Manual', which defined a safety management system and proposed safety management strategies[1]. In 1975, the SHELL model was proposed, which focused on the comprehensive influence of factors on people, including hardware, environment and interpersonal relations, leading to insecure factors[2]. In 1990, the REASON model was proposed, which compared aviation to a comprehensive production system of high complexity and identified factors of decision makers, grassroots managers, organizational culture, production activities, and defense lines, which were all related to each other in the event of a safety problem[3]. Organizational factors affecting flight safety and possible differences in organizational factors based on differences in organisational performance were determined, and implications for safety research and management in the Chinese civil aviation industry were discussed[4].The introduction of safety management systems (SMS) in the actual operating environment was considered an important factor in flight safety, and the practical implementation of the risk assessment process played a guiding role in reviewing and evaluating the flight operating environment[5]. An SMS scale for evaluating the performance of a company's safety management system was developed from the perspectives of aviation experts and airline managers, and its implications for practitioners and future research were discussed[6]. Safety risk management was considered of great significance in air transport, and a quantitative evaluation model of aviation safety risk factors was established to improve the effectiveness of the safety risk management system[7]. The grey correlation model was established to identify the factors affecting the safety of civil aviation flights and create an inducing factor system, but the internal relationship between each inducing factor was not further analyzed[8]. The neural network modeling technology was introduced into the aviation accident prediction field, and neural network based aviation supplies accident prediction and its BP algorithm model were proposed[9]. The safety management of Taiwan airport was evaluated using network analysis methods and the approximate ideal solution ranking method, providing directions for risk management in Taiwan aviation management[10]. A quantitative risk assessment method based on airport runway deviation accidents was established, consisting of cumulative probability distribution and damage models, which had a significant impact on airport risk management[11].
In China, the Civil Aviation Administration of China issued Order No. 170, formulating and adopting the 'Civil Airport Aircraft Activity Area Road Traffic Safety Management Rules' (CCAR-331SB-R1), which took effect on August 12, 2006[12]. The ROSE model, a safety management model for China's civil aviation, was constructed. Combined with the dissipative structure theory and synergetic knowledge, the dialectical relationship between the governmental and corporate levels, as well as the sub-elements in the system, was studied in depth from the perspective of system safety[13]. Social network analysis was used to objectively and quantitatively analyze the current research status and trends in aviation safety management systems[14]. According to the system theory, the safety of the civil aviation system should be continuous safety, and it was necessary to establish a perfect self-supervision mechanism for continuous safety management, which would be enriched and improved over time with the development of science and technology[15]. It was suggested to start from the source of risks, adopt risk control technology to avoid risks from the source, and attach importance to building a risk defense system, standing in the risk defence system of the interaction and synergy and the construction of the safety culture of the two aspects of the civil aviation safety management system construction strategy is proposed[16]. According to the accident cause '2-4' model, this paper analyzed the causes of unsafe actions in general aviation flight accidents in China through accident statistics, case analysis and case enumeration methods. The causes of their occurrence were analyzed, and their action paths to other accident causes were listed, providing references for the general aviation accidents prevention[17]. To explore the reference development of models in civil aviation safety management, the SHELL model and REASON model in the ICAO management manual were compared and analyzed based on comparative safety law. According to the research model of comparative security studies, two models were constructed based on the three-dimensional comparative research model of time dimension, knowledge dimension and spatial dimension[18]. Combining actual data, SPSS, Excel data analysis tools and risk management methods, comprehensive statistical data on civil aviation safety in China were analyzed from three perspectives: civil aviation safety operation, accidents and safety information. The relationship between management system and influencing factors of actual civil aviation accidents in China was explored[19]. Based on the conceptual model of tripartite interaction, an evolutionary game model of general aviation safety regulation was constructed, and its stability strategy was analyzed[20]. In calculating the possibility of civil aviation safety risks, the concept of exponential weight was proposed. By analyzing the possibility and severity of the risk, the civil aviation safety risk was quantitatively evaluated[21].
Foreign research on airport security management began with the establishment of security management systems, followed by the development of various models for analysis, focusing on the interrelationship between comprehensive factors, so as to enhance the importance of security risk management and achieve more quantitative and accurate risk assessment. Domestic airport safety management followed closely, formulating and implementing relevant safety management policies. From the perspective of system safety, continuous efforts have been made to enrich and improve the civil aviation safety management system, conduct in-depth studies on the causal pathways of accidents, and achieve self-supervision. At present, scholars at home and abroad often use the Logit model, clustering model, negative binomial distribution model and Bayesian network to carry out in-depth research on the mechanism and cause of accidents. Among them, Bayesian network, proposed by Pearl in 1985[22], has gradually become the mainstream of artificial intelligence, predictive analytics and data science. Compared with the above methods, Bayesian networks were widely used in the field of safety management because of their high computational efficiency, absence of hypothetical constraints, strong logical reasoning function, and the ability to dig deeper into the correlations of input variables. You et al.[23] analyzed the causes of accidents on mountainous highways and constructed a Bayesian network model based on fault trees to identify the basic factors and their contributions to accidents. Li et al.[24] combined grey relational analysis with Bayesian networks to analyze 14 factors related to major traffic accidents, and ranked them based on their hazard levels. The results showed that Bayesian networks could identify the true relationships between factors and had higher prediction accuracy. Han et al.[25] proposed a risk assessment method based on accident trees and Bayesian networks to evaluate the risk of railway oversize cargo transportation. This method could quantitatively analyze the importance of each event and determine that the key events were the management of clearance limits and the quality of the railway line, thus playing a significant role in safety risk prevention and control. At present, accident causation analysis has been changed from 'single factor' to 'multi-factor', focusing on the interrelationship between the factors, at this time, the combination of accident tree and Bayesian network can play a good role, so as to put forward a reasonable proposal for the safety of the active prevention and control system to reduce the safety risk.
In general, due to the professionalism, complexity and importance of aviation operation safety, domestic and foreign studies mainly focused on the overall security of the aviation system, including flight safety, personnel management, maintenance, airport public safety and other fields. In terms of road traffic safety in the aircraft activity area at airports, due to the particularity and isolation from the outside world of the aircraft activity area, coupled with strict aviation security measures, in addition to the airport staff, there is a general lack of awareness and understanding of the actual situation inside airports to be aware of the special features of their traffic environment. Therefore, researchers in the transportation field find it challenging to pay attention to the special traffic scene of road traffic in the aircraft activity area of airports. Currently, research on road safety in the aircraft activity area is relatively scarce. The study examined 20 accidents in the airport activity area over the past five years, based on official reports. It was found that these accidents were not solely caused by individual factors such as people, vehicles, or the environment, but rather resulted from the combined effect of multiple factors. Among them, 5% of the accidents were caused by unreasonable behaviors of passengers, 25% were the result of the combined influence of people, vehicles, and the environment, and a significant 70% were attributed to operational errors by staff, involving the factors of people and vehicles. Therefore, it is crucial to focus on in-depth analysis of human-vehicle accidents and identify the sources of risks leading to accidents.
Therefore, starting from the limitations of current research, this paper focuses on the intersection between civil aviation airports and road transportation, specifically addressing the often overlooked traffic scenario of the aircraft movement area in the airport. It took the road traffic system in the aircraft activity area of civil aviation airports as the research object and conducted traffic safety management research. The influencing factors of road traffic safety in the aircraft movement area were identified, and a Bayesian network was used to construct a model for road traffic safety in the aircraft movement area. A fault tree was constructed to analyze the common accident forms in road traffic within the aircraft movement area qualitatively and quantitatively. Important hazards that led to accidents were identified, and corresponding countermeasures were proposed to prevent accidents from occurring. The technical roadmap is illustrated in Fig. 1. In terms of quantitative analysis, the commonly used methods currently involve regression analysis or neural network methods using multi-year data to predict the probability of accidents. However, this study adopted a different approach by obtaining the probability of event occurrence through accident statistics, questionnaire surveys, and fuzzy set theory. This approach is not directly comparable to traditional methods. In terms of qualitative analysis, this study utilized the minimum cut sets and basic event importance derived from the Analytic Hierarchy Process(AHP) and Bayesian networks to accurately identify the key factors and their significance in accident occurrence.
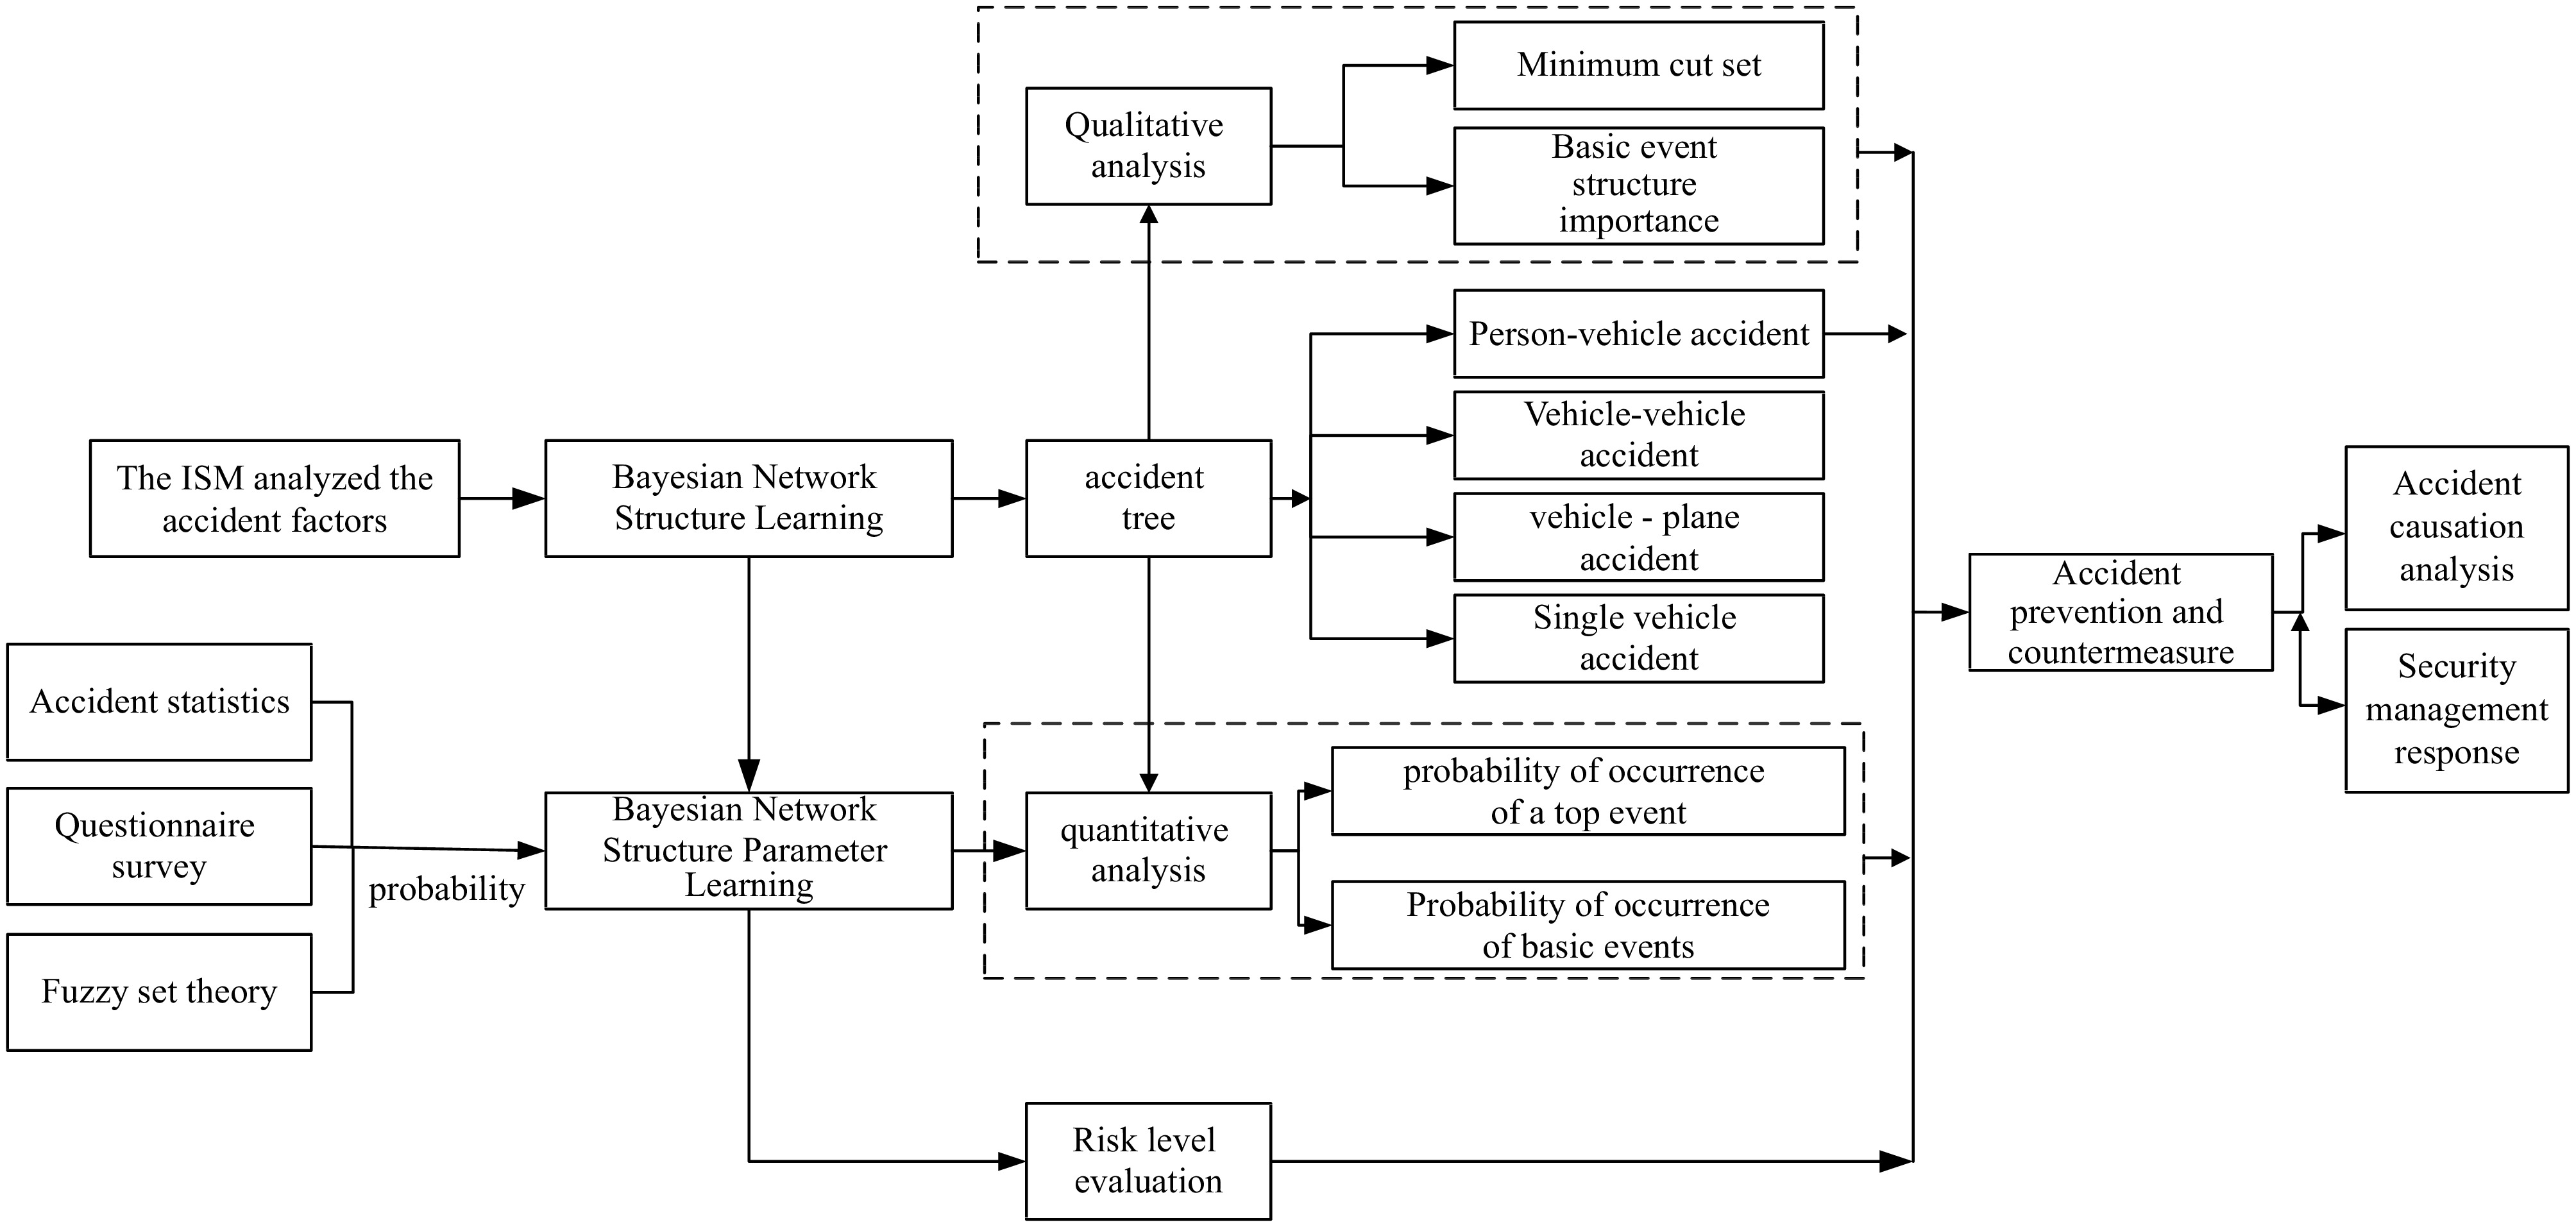
Figure 1.
Technical route.
-
The road traffic safety in the aircraft activity area of a 4F airport in China was the focus of this research. The specific airport, referred to as X Airport, had a high annual passenger throughput and ranked among the top ten airports in China. It consisted of three terminals and two runways, capable of accommodating the take-off and landing of large aircraft such as the Airbus A380. In accordance with the long-term target of 83 million passengers per annum, Airport X was undergoing the construction of a new terminal building and the expansion of the third phase. As the annual passenger throughput of Airport X continued to rise, the ground support departments faced unprecedented pressure to provide services. This, in turn, led to increased security risks in the road traffic system within the aircraft activity area of the airport.
Security risk assessment index system
-
The influencing factors of road traffic safety in Airport X were analyzed, and combined with the actual situation, the influencing factors of road traffic operation safety in 26 civil aviation airports were identified from five aspects of person-vehicle-road-environment-management, and the risk evaluation index system of road traffic safety in the airport was established, as shown in Table 1.
Table 1. Road traffic safety risk assessment index system in the aircraft activity area of civil aviation airports.
Type Influencing factor Explanation Variable setting Driver S1 Fatigue factor Fatigue of the driver 0: negligible; 1: acceptable;
2: unacceptable.S2 Time pressure factor Situations where pilots are under time pressure to secure flights 0: acceptable; 1: unacceptable; S3 Correct operation of special equipment factors Whether the driver has violated the law or operated the vehicle's special equipment improperly 0: acceptable; 1: illegal operation of special vehicle equipment S4 Driving violation factor Whether the driver in the process of driving does not follow the prescribed route, speeding and other violations 0: acceptable; 1. illegal driving Pedestrian S5 Pedestrian visibility factor Whether pedestrians on the road can attract the attention of drivers in time 0: good visibility; 1: poor visibility S5A Pedestrians wearing reflective vests Pedestrians who wear reflective vests as required can greatly improve their own visibility 0: yes; 1: no S6 Physiological factor The physical condition of the pedestrian 0: acceptable; 1: not acceptable S7 The choice of walking route The walking of pedestrians in accordance with the prescribed route 0: acceptable; 1: not walking on the prescribed route S8 Unqualified illegal operation Whether unqualified personnel illegally drive motor vehicles or illegally operate special equipment 0: acceptable; 1: illegal operation of unqualified personnel Other personnel S9 Passengers or non-staff Whether passengers or other non-staff members stray into the aircraft activity area and become uncontrolled 0: acceptable; 1: there were passengers straying into the activity area and it was not controlled Vehicle S10 Vehicle technical status Including vehicle steering system, driving system, braking system, electrical system and so on 0: in good condition; 1: poor state S11 Vehicle identification Visibility of vehicles on the road 0: in good condition; 1: poor state S11A Vehicle installation of reflective warning signs Refers to whether the vehicle is equipped with safety warning lights and reflective warning signs as required 0: yes; 1: no S12 Vehicle dimensions Whether the shape of the special vehicle itself is too wide and too high, and whether the cargo are too long, too wide or too high 0: in good condition; 1: size overran S13 Stability of vehicle cargo Whether the vehicle and the cargo in its trailer are securely secured 0: in good condition;
1: the goods were unstableS14 Vehicle communication equipment Whether the communication equipment equipped with the vehicle is in good condition 0: in good condition; 1: poor state Airport road S15 Geometric property Including the road plane alignment, transverse and longitudinal section layout, visual distance assurance 0: in good condition; 1: poor state S16 Road crossing Including road level intersections, parking entrances and exits 0: in good condition; 1: poor state S17 Pavement condition Including flatness, snow and water on pavement, road collapse, etc. 0: in good condition; 1: poor state S18 Indicator marking line Whether the road indication signs in the airport are clear and reasonable, and whether the road markings are clearly visible 0: in good condition; 1: poor state Natural environment S19 Weather Rain, fog, snowstorms and other bad natural weather 0: negligible; 1: acceptable;
2: unacceptableTransportation (artificial) environment S20 Night lighting Whether the night lighting facilities are good 0: in good condition; 1: poor state S21 FOD (Foreign Object Debris) Presence of FOD in the carriageway 0: acceptable (normal road without fod); 1: unacceptable (fod on the road) S22 Driving environment An environment composed of various road traffic participants such as motor vehicles, non-motor vehicles and pedestrians 0: acceptable; 1: unacceptable S23 Roadside environment Various facilities and special equipment for aircraft maintenance and flight protection along the carriageway 0: acceptable; 1: unacceptable Management S24 Management of airport operation department The management level of the airport operation management department 0: acceptable; 1: unacceptable S25 Supervise the setting of reward and punishment system The supervision and punishment mechanism of the airport management department for violations of regulations 0: acceptable; 1: unacceptable S26 Integrity and implementation of safety education content Whether the content of personnel safety training is complete and comprehensive, and whether it is in place 0: acceptable; 1: unacceptable Interpretative structural model
-
Experts in charge of the airport resident unit were invited to refer to the pairwise relationship between each influencing factor Sij in the adjacency matrix table, and score according to Eqn (1) to obtain five initial adjacency matrices
${A_k} = {[{S_{kij}}]_{n \times n}}$ In order to reduce the influence of individual subjectivity, the matrix
$E = {[{S_{ij}}]_{n \times n}} = \sum\limits_{k = 1}^5 {{A_k}} $ $X = {[{x_{ij}}]_{n \times n}}$ $ \mathop {\text{x}}\nolimits_{ij} = \left\{ {\begin{array}{*{20}{l}} { 1,\;\;{\text{Denote that }}{{\text{S}}_i}{\text{ and }}{{\text{S}}_{\text{j}}}{\text{ have a relationship}}} \\ { 0,\;\;{\text{Denote that }}{{\text{S}}_i}{\text{ and }}{{\text{S}}_{\text{j}}}{\text{ have no relation }}} \end{array}} \right. $ (1) $ \mathop x\nolimits_{ij} = \left\{ {\begin{array}{*{20}{l}} { 1,\;\;{S_{ij}} \ge 4} \\ { 0,\;\;{S_{ij}} \lt 4} \end{array}} \right. $ (2) Boolean operation was performed on the new adjacency matrix to obtain the reachability matrix, and a directed graph was drawn in the analysis step, as shown in Fig. 2. The hierarchical distribution results of these 26 influencing factors were as follows: the first level L1 = (S1, S4, S22, S23); the second level L2 = (S5, S7, S8, S9, S10, S11, S12, S14, S16, S18, S21); the third level L3 = (S3, S6, S13, S17, S20, S24); the fourth level L4 = (S2, S25, S19, S26); the fifth level L5 = (S15).
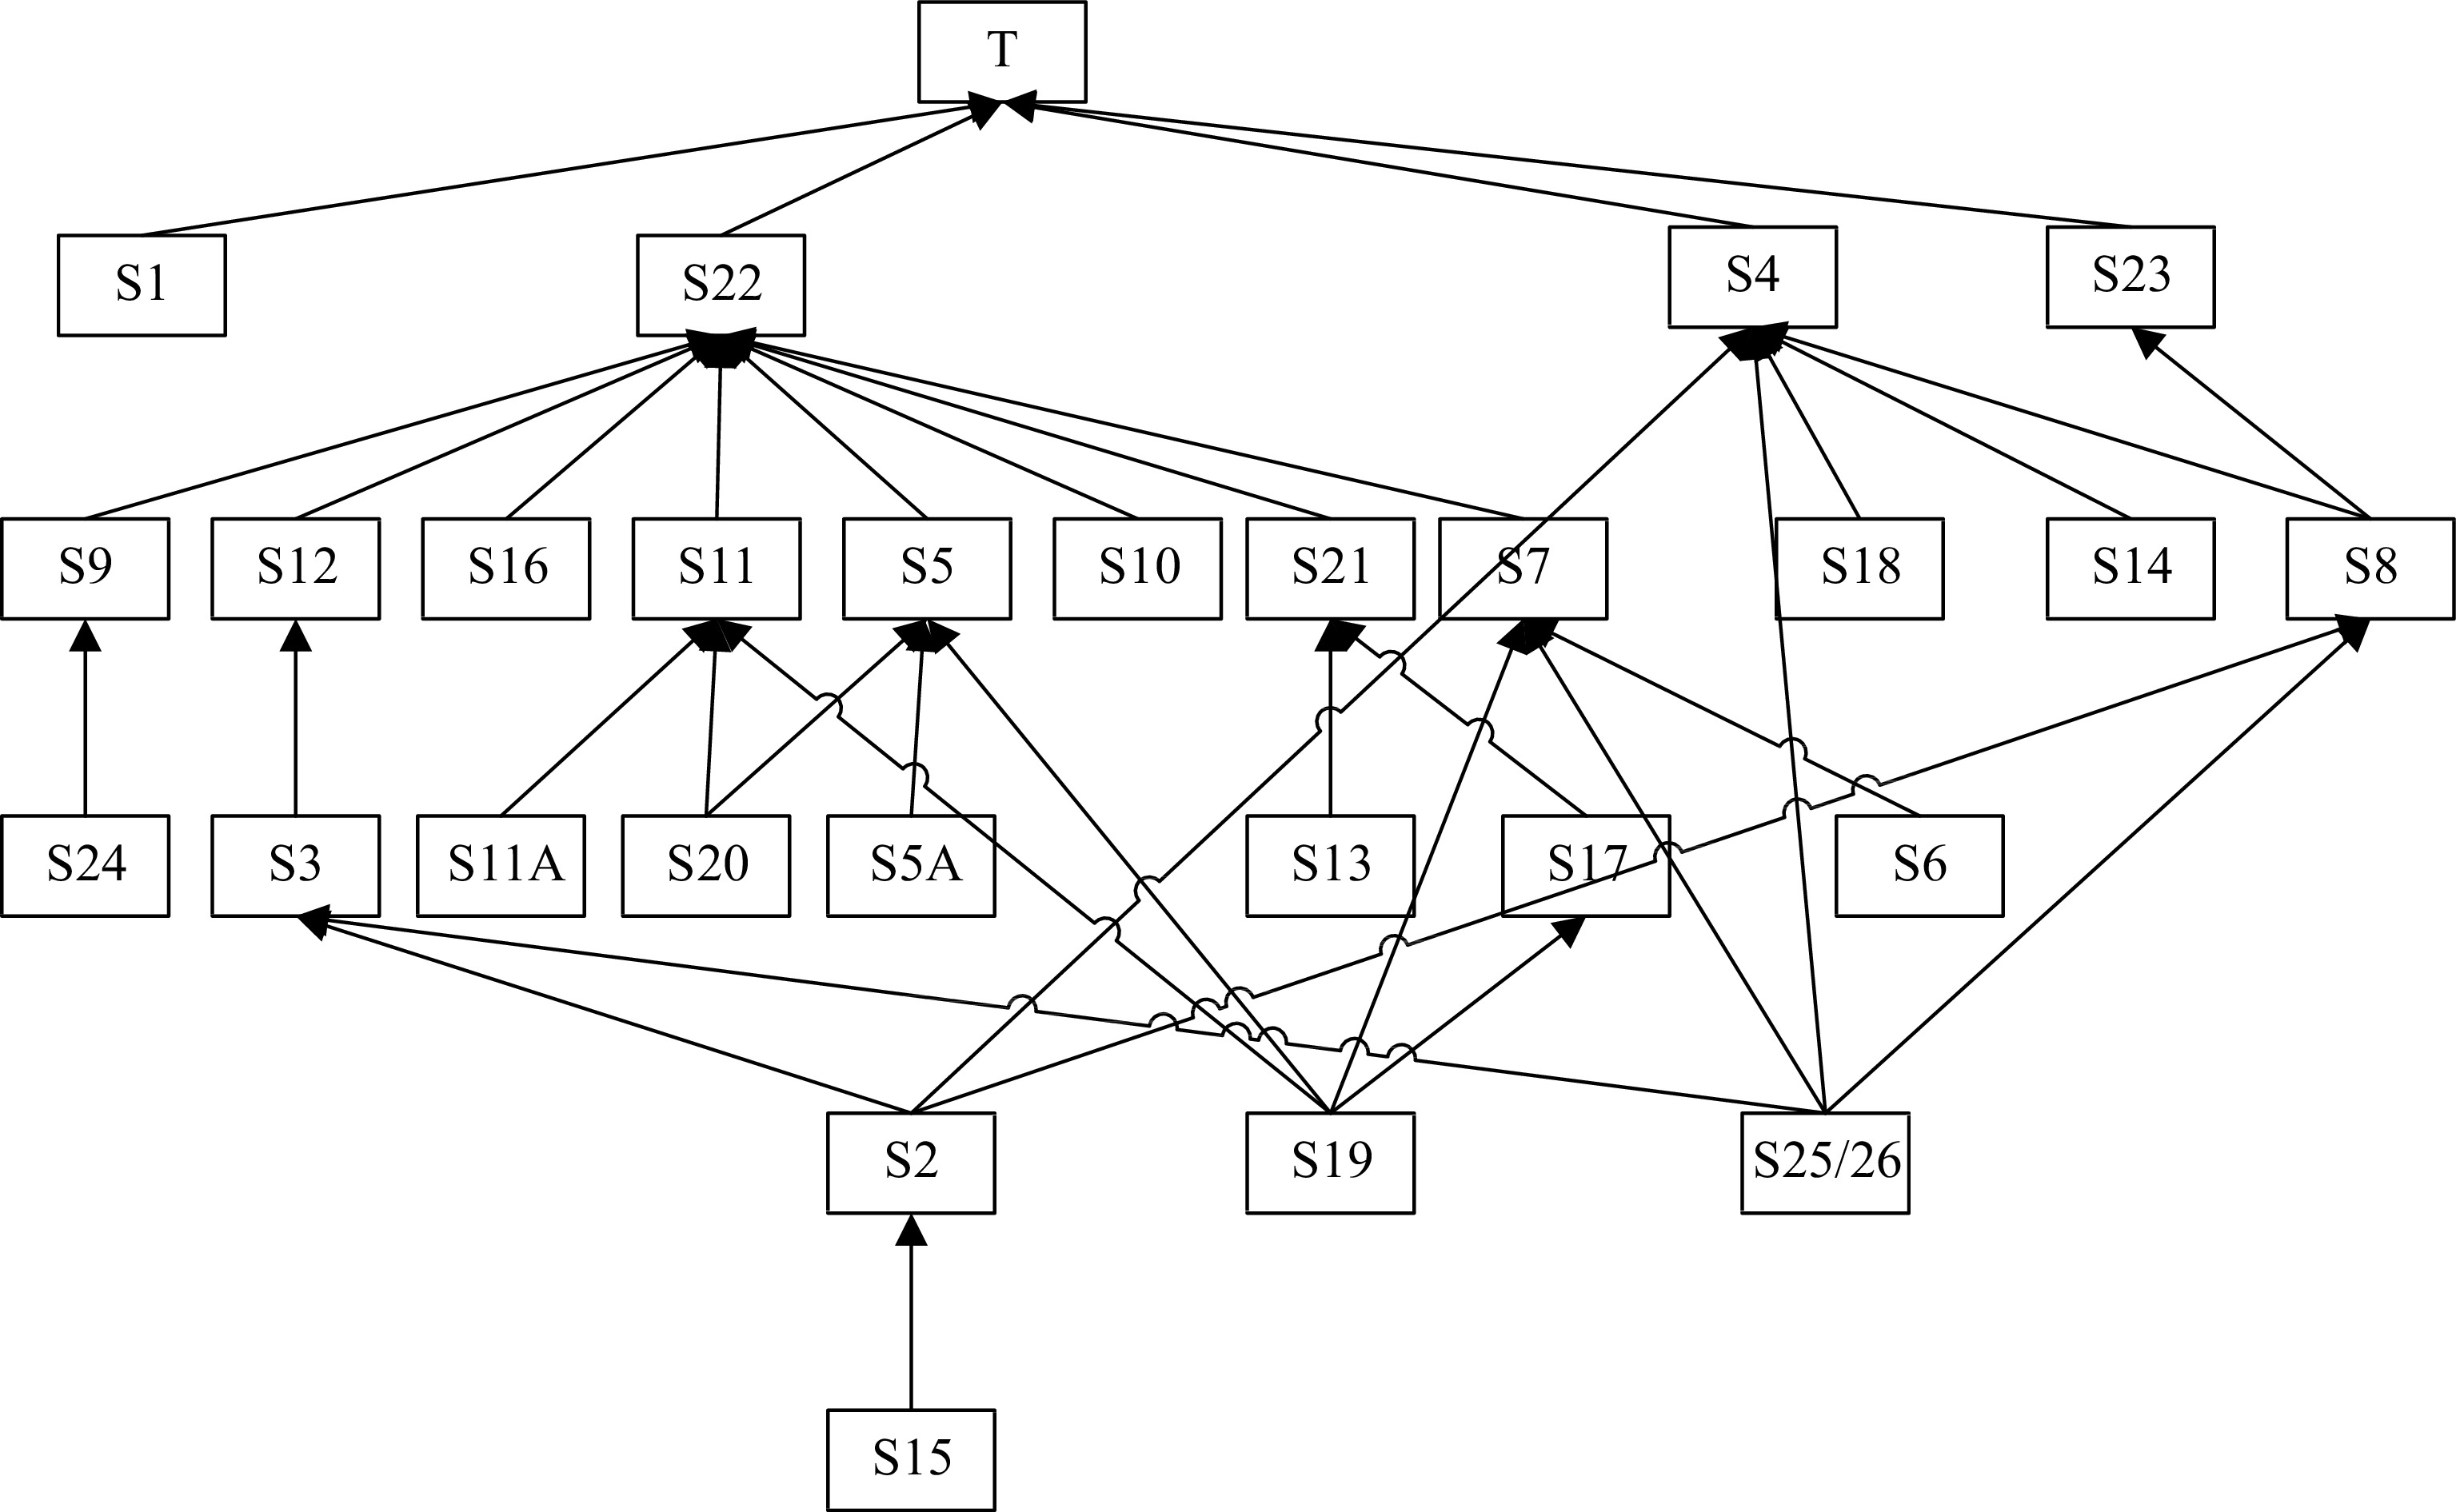
Figure 2.
Explanatory structure model constructed from various influencing factors.
In Fig. 2, the target node T represented the road traffic safety level. The root node meant that there were no other nodes below the current node, and it was not affected by other nodes, such as S1, S10, S18 and other nodes. The rest of the nodes were intermediate nodes, such as the S5 pedestrian visibility factor which was affected by factors like S20 night lighting factors, S19 weather factors and S5A pedestrian wearing reflective vest factors. The root node in the bottom layer was generally the deep reason for system security, such as S15 and S19. The intermediate nodes that were affected by multiple nodes and could affect multiple nodes were generally critical nodes that affected the security level of the system, such as S11 and S7.
-
There were 26 factors in the security risk assessment index system, and the data sources mainly included questionnaire surveys, questionnaire surveys combined with fuzzy set theory, historical data statistics and field survey statistics. Among them, S1, S2, S3, S5A, S6, S7, S8, S10, S11A, S12, S13 and S14 were used in questionnaire surveys. S4, S5, S11, S15, S16, S18, S20, S21, S22, S24, S25 and S26 were adopted through questionnaire surveys combined with fuzzy set theory. S9 and S19 were adopted from historical statistical data. S17 and S23 were obtained from methods of field investigation and statistics. Due to the relatively small number of road traffic accident cases in the aircraft activity area of the airport, especially the scarcity and difficulty in statistical analysis of accidents in a specific airport activity area, it was challenging to obtain data for each factor through case analysis or data compilation. Therefore, questionnaire surveys were conducted to gather data on some influencing factors.
A total of 600 questionnaires were distributed and 549 valid questionnaires were collected. The survey respondents included staff from relevant units and airlines at Airport X, covering various support departments such as maintenance, ground service, aviation food and catering, so as to ensure the objectivity, impartiality and accuracy of the survey results.
Bayesian network model
-
The Bayesian network is a directed acyclic graph network that utilizes conditional probability to express the correlation between each information element. It effectively addresses the problem of uncertain reasoning in real life.
Initial data arrangement and calculation
-
The influencing factors of the data were obtained through questionnaire surveys, such as S1, S2, S3 and so on. Since the three options in the questionnaire correspond to the three state variables of each node, the probability of each state for these risk influencing factors is the proportion of each option in the questionnaire.
The influencing factors of the data, such as S4, S5, S11 and so on, were obtained through means of questionnaire surveys and fuzzy set theory. Considering the influence of multiple variables, the data from the questionnaire survey was processed using fuzzy set theory. Natural language variables were introduced into the questionnaire design, with each natural language variable corresponding to a triangular fuzzy number. The fuzzy descriptive language was quantified as a data index, with the specific corresponding relationship shown in Table 2. Next, it was necessary to handle the quantized triangular fuzzy numbers. The main processes involved normalization, defuzzification, and renormalization, which were expressed by formulas (3), (4), and (5), respectively.
Table 2. Correspondence between natural language variables and triangular fuzzy numbers.
No. Natural language variable Triangular fuzzy function (li, mi, ni) 1 Very low (0, 0, 0.1) 2 Low (0, 0.1, 0.3) 3 On the low side (0.1, 0.3, 0.5) 4 Medium (0.3, 0.5, 0.7) 5 High (0.5, 0.7, 0.9) 6 On the high side (0.7, 0.9, 1) 7 Very high (0.9, 1, 1) Equalization:
$ \left[ {\begin{array}{*{20}{c}} {{l_1}}&{{l_2}}&{ \cdots {l_i}} \\ {{m_1}}&{{m_2}}&{ \cdots {m_i}} \\ {{n_1}}&{{n_2}}&{ \cdots {n_i}} \end{array}} \right]\left[ {\begin{array}{*{20}{c}} {{p_1}} \\ {{p_2}} \\ \cdots \\ {{p_4}} \end{array}} \right] = \left[ {\begin{array}{*{20}{c}} a \\ b \\ c \end{array}} \right] $ (3) Where pi was the survey proportion of each option in the questionnaire, and a, b and c were the mean value of triangular fuzzy number obtained by averaging.
Deblurring:
$ {P_j} = \dfrac{{a + 2b + c}}{4} $ (4) Where pj was the conditional probability in a certain state of the influencing factors determined according to the questionnaire.
Normalization:
$ {P_j} = \dfrac{{{P_j}}}{{\sum\limits_{j = 0}^k {{P_j}} }} $ (5) Where pj was the conditional probability in another state of the influencing factors determined according to the questionnaire.
Taking the pedestrian visibility factor of the middle node S5 as an example, it was affected by the S20 night lighting factor, S19 the weather factor and S5A pedestrian wearing reflective vest factor. Therefore, it was necessary to consider the conditions of S20 = 1 (poor state of night lighting facilities), S19 (bad weather) and S5A = 1 (pedestrians not wearing reflective vests) respectively to determine the probability value of S5 = 1 (indicating poor pedestrian visibility factor). Taking the premise of S20 = 1, find the probability value of S5 = 1 as an example, the questionnaire question was set as how much does poor nighttime illumination or no illumination conditions of the roadway affect the visibility of pedestrians? Questionnaire survey data that from very low to very high in seven levels, respectively, the proportion of 1.6%, 8.3%, 19.8%, 42.1%, 19%, 6%, 3.2%. According to Eqn (3), the three triangular fuzzy numbers means were calculated as 0.3119, 0.4972 and 0.6832, respectively, and using Eqns (4) and (5), we obtained the probability values (S5 = 1|S20 = 1) = 0.497 and (S5 = 0|S20 = 1) = 0.503
Using Netica software for computational reasoning
-
The Bayesian network structure was identical to the interpretive structure model constructed in Fig. 2. After sorting and calculating the initial survey data, the prior probabilities and conditional probability distributions of each node were obtained. These data were then input into the Netica software for parameter learning, which obtained the initial probability values of each node under different risk levels. After the calculation of Netica software, the initial probability P(T = 0) = 72.3% of the target node T in the negligible state; the initial probability P(T = 1) = 24.8% in an acceptable state; in an unacceptable state P(T = 2) = 2.84%; the initial probability of each node was shown in Table 3, where S1−S26 were the influencing factors, and the state variables 0, 1 and 2 correspond to the state definitions of the influencing factors in Table 1.
Table 3. Initial probability.
State variable S1 S2 S3 S4 S5 S6 S7 S8 S9 S10 S11 S12 S13 0 4.4% 92.2% 99.7% 99.0% 96.9% 98.6% 96.7% 99.9% 99.9% 93.7% 97.4% 93.8% 97.3% 1 93.4% 7.8% 0.3% 1.0% 3.1% 1.4% 3.3% 0.1% 0.1% 6.3% 2.6% 6.2% 2.7% 2 2.2% State variable S14 S15 S16 S17 S18 S19 S20 S21 S22 S23 S24 S25/S26 0 98.5% 97.3% 94.7% 98.0% 97.4% 76.0% 97.2% 99.4% 81.1% 98.0% 97.6% 97.9% 1 1.5% 2.7% 5.3% 2.0% 2.6% 21.3% 2.8% 0.6% 18.9% 2.0% 2.4% 2.1% 2 2.7% Based on the above results, the probability that the risk probability level of the target node T was in an unacceptable state was 2.84%. Therefore, the overall road traffic safety level in the aircraft activity area of X airport was relatively high. Among them, the probability of poor performance or unacceptable state of all influencing factors was mostly within the acceptable range, and the probability of risk unacceptable state of individual influence factors was relatively high, especially S22 driving environment factor reached 18.9%, and S2 time pressure factor was close to 8%. It indicated that these factors were the key factors affecting road traffic safety in the aircraft activity area of Airport X.
-
There were many common road traffic accidents in the aircraft activity area of the airport. From the perspective of road traffic participants in the airport, four categories of person-vehicle accidents, vehicle-vehicle accidents, vehicle-aircraft accidents and single-vehicle accidents are determined, as shown in Fig. 3. This paper took common person-vehicle accidents as an example to analyze the safety risks of various traffic accidents.
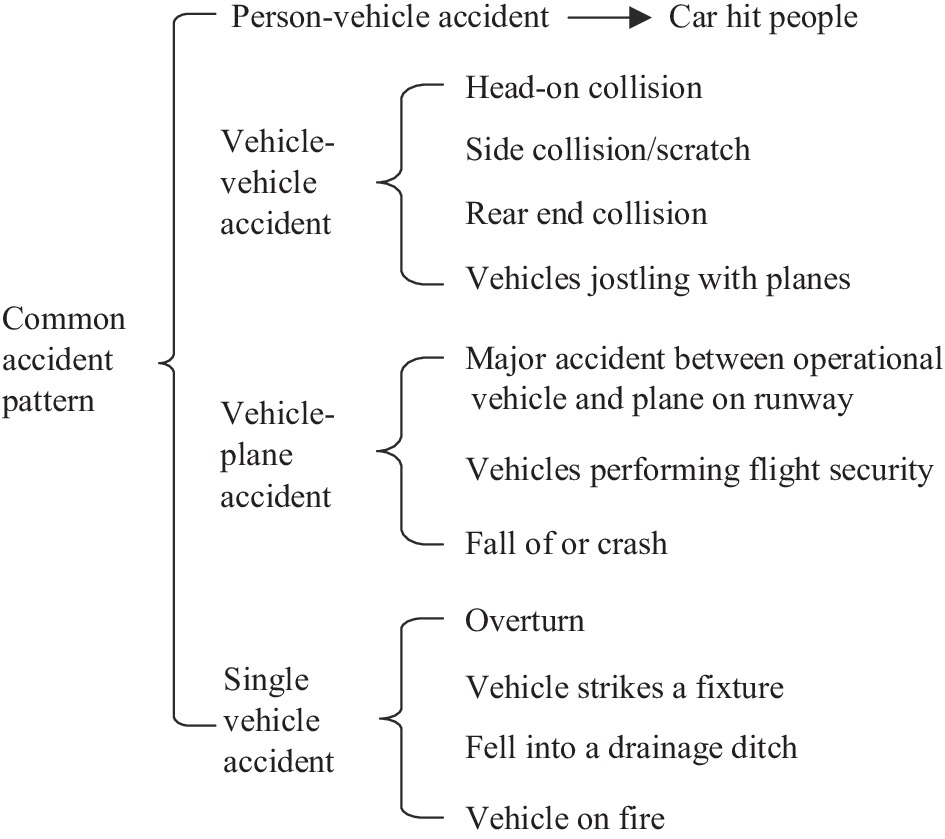
Figure 3.
Classification of common accident patterns in aircraft movement areas.
Determination of basic cause events
-
Based on the Bayesian network index system, 34 basic cause events and four omitted events of accidents were obtained from six aspects, including people, vehicles, roads, environment, management and other aspects, aiming at the manifestations and causes of common accident forms, as shown in Table 4.
Table 4. Basic cause events.
Aspect Event No. Person (a) Driver Fatigue driving X1 Greater time pressure X2 Illegal operation of vehicle special equipment X3 Driving violations: (1) Overspeed X4A (2) To maintain a safe distance X4B (3) Illegal overtaking (or side-by-side) X4C (4) Failure to stop at a stop line for observation X4D (b) Pedestrian No reflective vest X5 Poor physical condition X6 Not following the prescribed route X7 Inadvertent entry by non-staff such as travellers X9 Vehicle Vehicles in substandard technical condition: (1) Steering failure X10A (2) Brake failure X10B (3) Tire burst X10C (4) Parts aging X10D Vehicles not fitted with reflective signs or warning lamps X11 Vehicle (including cargo) oversized length (width, height) X12 Vehicle load not properly secured X13 Vehicle communication equipment failed X14 Road Road curves too quickly X15 Failure to provide facilities at intersections to eliminate blind areas X16 Poor road condition: Slippery roads X17 Road signs were not clearly marked X18 Environment Low visibility weather X19 Poor lighting at night X20 FOD on the road X21 Complex roadside environment X23 Management Inadequate road design: (1) Poorly designed road alignment X25A (2) Excessive intersections of carriageways with aircraft taxiways X25B Other Incorrect command (when the tower directed the wrong vehicle to enter the runway) X29 Driver misinterpreted the commander's instructions X30 Staff members brought fire into the airport in violation of the law X31 Inadvertent fire while using fire X32 Vehicles not equipped with effective fire extinguishing equipment X33 Personnel did not use fire extinguishing equipments X34 Omitted event: (1) Traffic coming from behind could not attract the attention of pedestrians Y1 (2) Vehicles overtaking oncoming traffic on a borrowed lane Y2 (3) Vehicles passing taxiway intersections with aircraft taxiing Y3 (4) Air Traffic Control failed in its duty Y4 (5) The car in front suddenly slowed down Y5 Analysis of person-vehicle fault tree
Building the fault tree model
-
The person-vehicle accident was considered as the top event in the fault tree, and the bottom basic event was selected from the basic cause events mentioned above. The resulting events of the person-vehicle fault tree are presented in Table 5, which combined accident cases and expert opinions. The person-vehicle fault tree model is depicted in Fig. 4.
Table 5. Resulting events of the person-vehicle fault tree.
No. Event T Person-vehicle accident A1 Scenario 1 A2 Scenario 2 B1 Pedestrians failed to yield B2 Driver did not notice the pedestrian B3 Driver noticed the pedestrian braking, but the vehicle did not stop C1 Poor pedestrian visibility C2 Driver unsafe state 1 C3 Objective unsafe state C4 Human insecurity 1 C5 Environment is unsafe C6 Unsafe state of vehicle D1 Unsafe state 1 D2 Unsafe state 2 D3 Blind areas exist at road junctions D4 Large vehicles had visual blind areas D5 Driver unsafe state 2 D6 Pedestrian burst out E1 Human insecurity 2 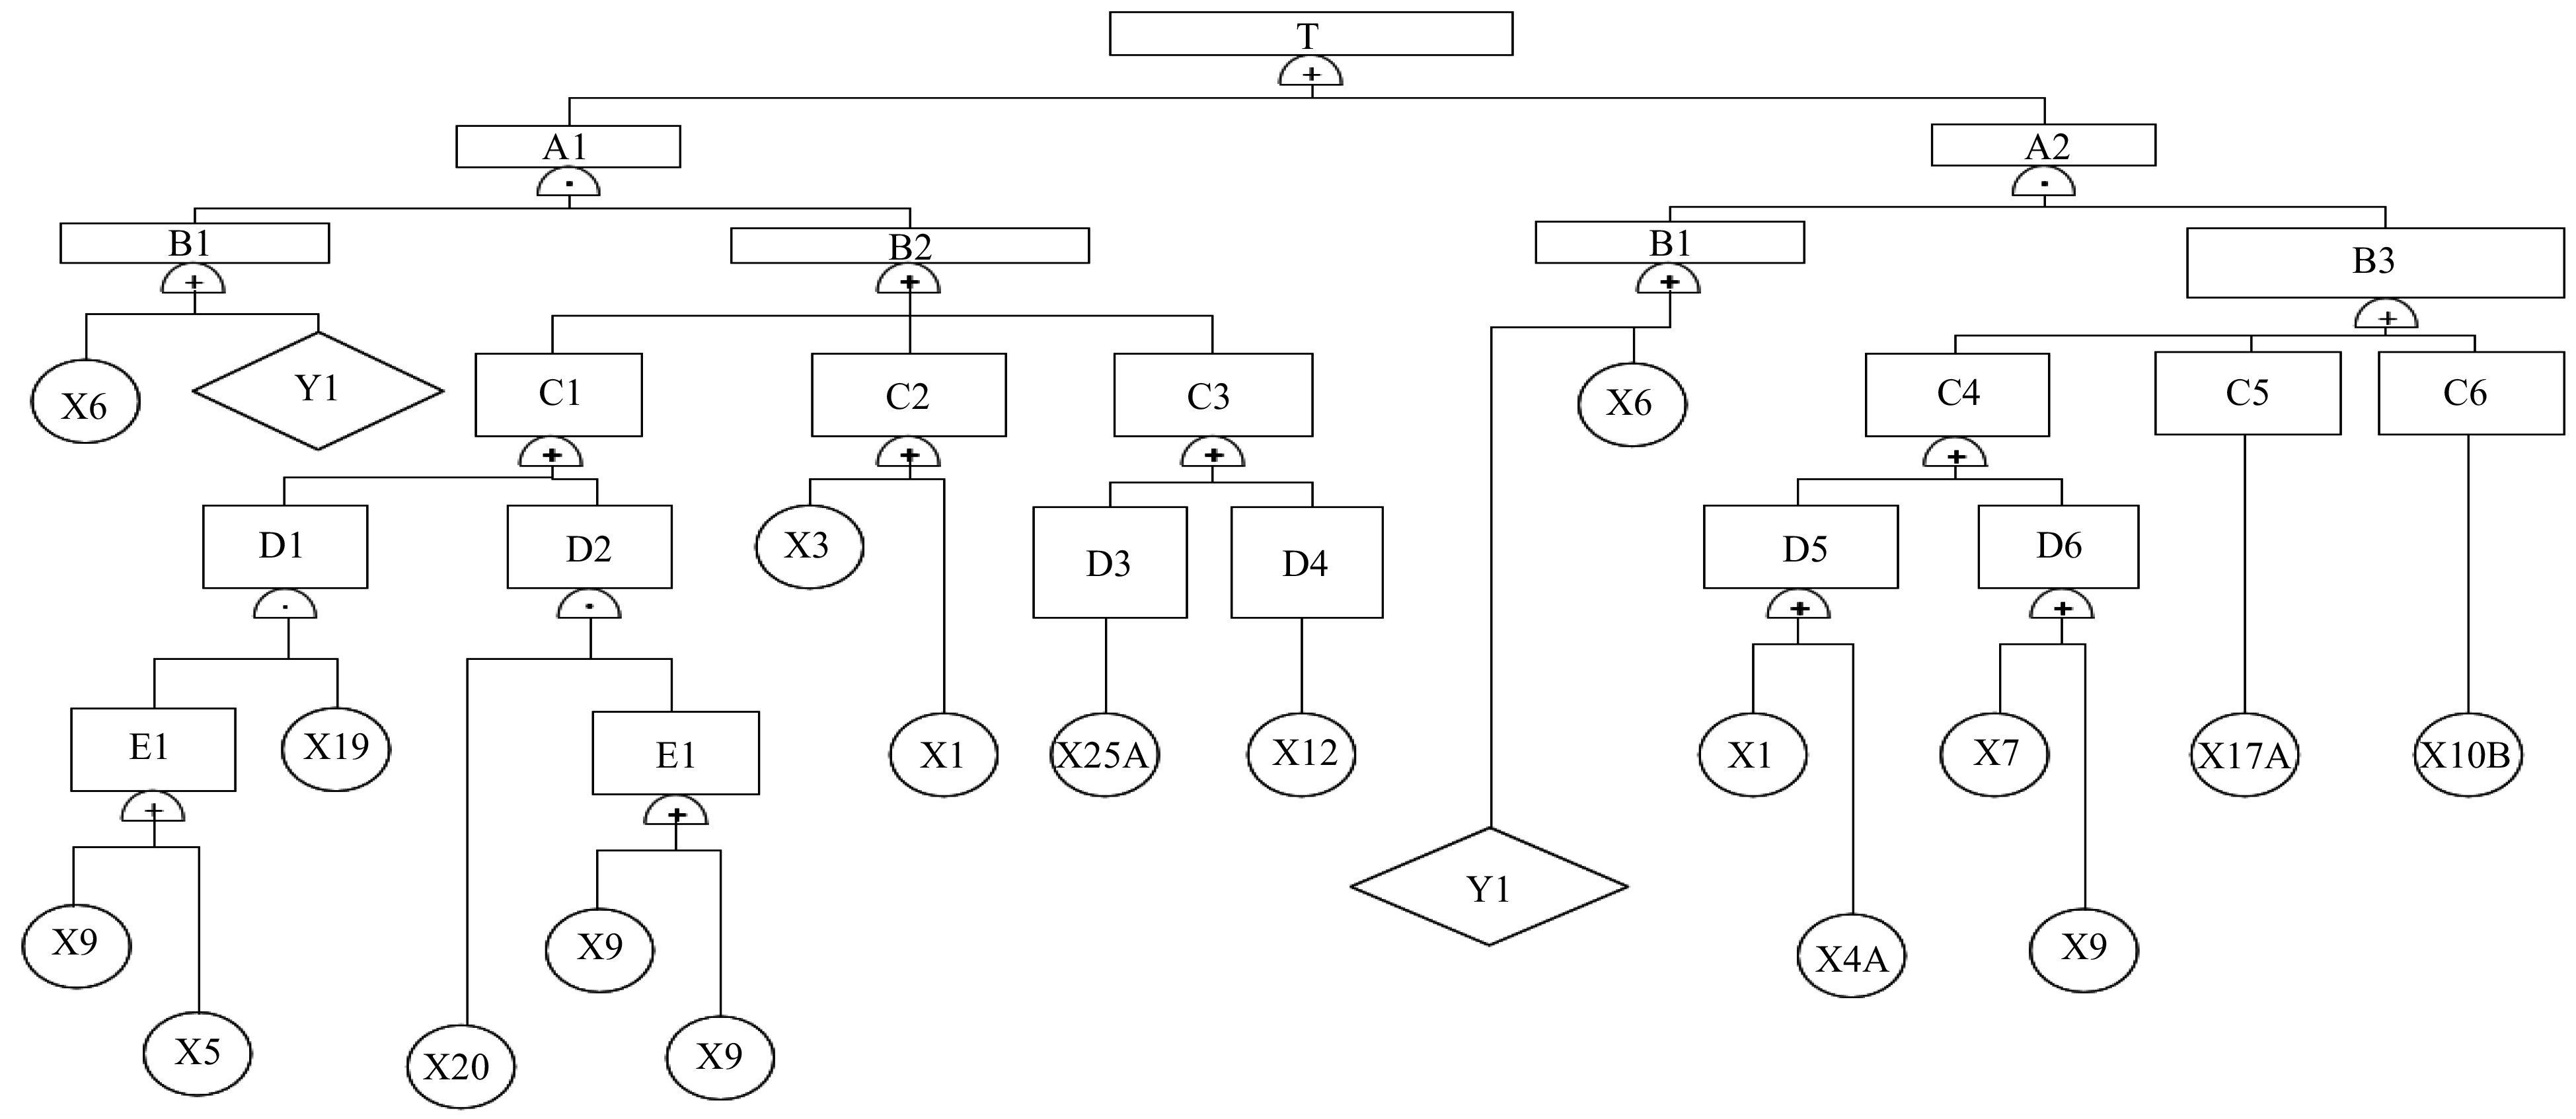
Figure 4.
Person-vehicle fault tree model.
Qualitative analysis of person-vehicle fault tree
-
The qualitative analysis of the fault tree involved two aspects. Firstly, it aimed to identify all the hazardous situations that contribute to the occurrence of the accident by determining the minimum cut set of the fault tree. Secondly, it sought to assess the impact of each basic event on the top event by calculating their structural importance.
Minimum cut set
-
The minimum cut set of a fault tree was the set of minimum fundamental events that led to the occurrence of the top event. Each fundamental event in the minimum cut set was necessary, and the common solution method was Boolean Algebra. The person-vehicle fault tree was analyzed using Boolean algebra, resulting in the identification of 22 sets of minimum basic events that led to the occurrence of the top event, as shown in Table 6.
Table 6. Minimum cut set of person-vehicle fault tree.
No. Minimum cut set Description 1 {X6, X5, X19} In low visibility and bad weather, pedestrians without reflective vests were less noticeable to vehicle drivers, and those with poor physical condition reacted slowly and were unable to avoid vehicles. 2 {X6, X5, X20} In poorly lit road environments at night, pedestrians without reflective vests were less noticeable to vehicle drivers, and those with poor physical condition reacted slowly and were unable to avoid vehicles. 3 {X6, X3} Drivers illegally operated special on-board equipment, and pedestrians with poor physical condition reacted slowly and were unable to avoid vehicles. 4 {X6, X1} Drivers drove fatigued, and pedestrians with poor physical condition reacted slowly and were unable to avoid vehicles. 5 {X6, X25A} The road alignment was not reasonably designed, and there were blind areas at corners that made it difficult for drivers to spot pedestrians, and pedestrians in poor physical condition reacted slowly to avoid vehicles. 6 {X6, X12} Vehicles were too large with blind areas, and pedestrians in poor physical condition reacted slowly to avoid vehicles. 7 {X6, 4A} The driver was speeding and the pedestrian in poor physical condition reacted slowly to avoid vehicles. 8 {X6, X7} Pedestrians failing to follow the prescribed route and pedestrians in poor physical condition with slow reaction time failing to yield to vehicles. 9 {X6, X9} Passengers or other outsiders mistakenly entered the aircraft's area of operation and was in poor physical condition and slowed to avoid the vehicle. 10 {X6, X17A} Slippery road surfaces and slow reaction time of pedestrians in poor physical condition to avoid vehicles. 11 {X6, X10B} Vehicle brakes failed and pedestrians in poor physical condition reacted slowly to avoid the vehicle. 12 {Y1, X5, X19} Vehicles approaching from behind pedestrians and pedestrians not wearing reflective vests were not easily detected by vehicle drivers in bad weather with low visibility. 13 {Y1, X5, X20} Vehicles approaching from behind pedestrians and pedestrians not wearing reflective vests in poorly lit road environments at night were not easily detected by vehicle drivers. 14 {Y1, X3} Vehicle approaching from behind pedestrians and driver's unauthorised operation of on-board special equipment. 15 {Y1, X1} Vehicle approaching from behind pedestrians and driver fatigue. 16 {Y1, X25A} The road design was not optimal, with blind areas at the bends that made it difficult for the driver to spot the pedestrian. As the vehicle was behind the pedestrian, they couldn't detect and avoid it in time. 17 {Y1, X12} Vehicles approaching from behind pedestrians with blind areas due to the size of the vehicle. 18 {Y1, 4A} Vehicle approaching from behind pedestrians and driver speeding. 19 {Y1, X7} Pedestrian deviated from the prescribed route, and as the vehicle was behind them, they couldn't identify and avoid it on time. 20 {Y1, X9} There were accidental entries of an outside people, and with a vehicle approaching from behind the pedestrians, they couldn't detect and avoid it in time. 21 {Y1, X17A} Slippery road surface and vehicles behind pedestrians, pedestrians were unable to spot and avoid vehicles in time. 22 {Y1, X10B} Vehicle brakes fail and vehicles behind pedestrians, pedestrians were unable to spot and avoid vehicles in time. Basic event structure importance
-
The importance of a basic event referred to the influence of a basic event on the occurrence of a top event. Structural importance analysis involved studying the influence of each basic event on the top event solely based on the fault tree's structure, without considering the difficulty level of each basic event's occurrence or assuming equal occurrence probabilities for each basic event.
In the fault tree analysis, each basic event had two states. One was happening, represented by Xi = 1; The other state was not happening, represented by Xi = 0. Different combinations of the basic event states formed different states of the top event, indicating
$\phi (X) = 1$ $\phi (X) = 0$ ${0_i} \to {1_i}$ 1. if ϕ(0i, X) = 0 → ϕ(1i, X) = 0, ϕ(1i, X) − ϕ(0i, X) = 0;
2. if ϕ(0i, X) = 0 → ϕ(1i, X) = 1, ϕ(1i, X) − ϕ(0i, X) = 1;
3. if ϕ(0i, X) = 1 → ϕ(1i, X) = 1, ϕ(1i, X) − ϕ(0i, X) = 0.
As was evident, only the second case illustrated the role of the basic event Xi. In this case, when the state of basic event Xi changed from 0 to 1, the states of other basic events remained unchanged, and the states of the top event transitioned from ϕ(0i, X) = 0 to ϕ(1i, X) = 1. The more this occurred, the more important the fundamental event Xi was. The importance of Xi was represented by the structural importance coefficient Iϕ(i), which was expressed as Eqn (6)[26].
$ {I_\phi }(i) = \dfrac{1}{{{2^{n - 1}}}}\sum\limits_{i = 1}^n {\left[ {\phi ({1_i},X) - \phi ({0_i},X)} \right]} $ (6) Based on the obtained minimum cut set, Eqn (6) was used to calculate the structural importance coefficient of each basic event. The order of structural importance for each basic event was then presented in Table 7.
Table 7. Ranking of importance of basic event structure in person-vehicle fault tree model.
Importance ranking Basic cause event 1 X6, Y1 2 X1, X3, X4A, X7, X9, X10B, X12, X17, X25A 3 X5 4 X19, X20 Quantitative analysis of person-vehicle fault tree
-
Quantitative analysis of the fault tree involved determining the probability of occurrence for each basic event, and then calculating the probability of the top event occurring based on these probabilities.
Determining the probability of basic event occurrence
-
The main methods used to determine the probability of basic events occurrence included experimental measurement, empirical values and statistical calculations from databases[27]. In the fault tree constructed in this paper, the basic cause events corresponded to the risk factors in the Bayesian network nodes. Therefore, the probability of the basic cause event was the initial probability of each risk influencing factor calculated using the Bayesian network model in the previous section, which corresponded to the initial probability specified in Table 3. Events that did not correspond to the events in the Bayesian network were considered as omitted events. Omitted events were those that did not require further downward analysis or had unclear causes, making their occurrence highly random and contingent, and therefore could not be quantified. Hence, in the quantitative analysis of the person-vehicle fault tree model, only the occurrence probability of the partial minimum cut set that did not contain omitted events was calculated, and the calculation results were shown in Table 8.
Table 8. Probability calculation value of person-vehicle fault tree.
No. Minimal
cut setCut set probability
(per million)Top event probability
(per million)Accident pattern description 1 {X6, X5, X19} 12 2,558 Traffic accidents involving pedestrians who failed to yield to vehicles due to their physiological condition when vehicles were approaching them 2 {X6, X5, X20} 12 3 {X6, X3} 42 4 {X6, X1} 308 5 {X6, X25A} 378 6 {X6, X12} 868 7 {X6, 4A} 3 8 {X6, X7} 462 9 {X6, X9} 14 10 {X6, X17A} 280 11 {X6, X10B} 182 Calculating the probability of top event occurrence
-
Based on the occurrence probability of the basic cause event, the probability value of each group of cut sets could be obtained using Eqn (7). Similarly, the probability of the top event occurrence could be obtained using Eqn (8).
$ {P_K}({X_1} \cap {X_2} \cap \cdots \cap {X_n}) = {q_1}{q_2} \cdots {q_n} = \prod\limits_{i = 1}^n {{q_i}} $ (7) Where Pk represented the cut-set group probability value, qi was the probability of the i th basic event, and n was the number of input events.
$ P({K_1} \cup {K_2} \cup \cdots \cup {K_n}) = 1 - (1 - {P_{k1}})(1 - {P_{k2}}) \cdots (1 - {P_{kn}}) = 1 - \prod\limits_{i = 1}^n {(1 - {P_{ki}}} ) $ (8) Where P represented the probability of occurrence of the top event, Ki was the i th group of cut sets, and PKi was the probability of the i th group of cut sets.
-
According to the quantitative analysis results of the fault tree model, the probability values for the occurrence of top event of the person-vehicle accident pattern were generally small. This indicated that the overall safety state of the road traffic system in the aircraft activity area of Airport X was good, and the risk level was low.
According to the structural importance ranking of the basic cause events determined in the qualitative analysis of the person-vehicle fault tree, the major hazard sources were identified as the X6 pedestrian in poor physical condition and Y1 vehicle coming from behind the pedestrian. However, based on the classification of danger sources, these two events belonged to the first type of danger sources, which were difficult to control. The more important second type of danger sources included driver fatigue driving, driver illegal operation, speeding, pedestrians not wearing reflective vests, pedestrians not walking according to the prescribed route, passengers entering the aircraft activity area, vehicle brake failure, large blind areas due to vehicle size, slippery road surface conditions and blind vision areas at road intersections.
For passengers, once they strayed into the aircraft activity area and were in an uncontrolled state, it was easy for danger to occur because they did not understand the various sources of danger in the aircraft activity area and could not avoid risks correctly and in a timely manner.
Security management countermeasures
-
According to the Bayesian network model and the fault tree model, the important hazard sources in the aircraft activity area were identified, and safety management countermeasures were formulated, as shown in Table 9.
Table 9. Security management countermeasures.
Theoretical model calculation and analysis The important hazard sources were identified by
accident causation analysisFormulate security management countermeasures Bayesian Network Model Pedestrian traffic
characteristicsUnder the influence of inclement natural weather, it could lead to pedestrians have poor visibility and do not follow prescribed routes, poor vehicle recognition and slippery roads. (1) Driver traffic characteristics Driver fatigue, high time pressures (2) Fault Tree Model Quantitative calculation
resultsDriver fatigue, high time pressures (2) Complex roadside environment (3)(4) Special vehicles have visual blind areas. (5) Qualitative analysis of
person-vehicle fault treeSpecial vehicles have visual blind areas. (5) The driver illegally operated special equipment, speeding. (6) Pedestrians not wearing reflective undershirts and not following the prescribed route. (6) Passengers mistakenly entering the aircraft activity area. (7) Blind areas at intersections. (8) In the table, the specific contents of safety management countermeasures (1)−(8) are as follows:
(1) When dealing with severe weather (such as haze, summer lightning storm, winter blizzard, cold and low temperatures):
a. Enhancement of safety awareness and education for staff by conducting safety campaigns during pre-shift meetings to strengthen staff safety awareness;
b. Strengthening humanistic care for staff. For example, if staff are suffering from cold fever and other physical discomfort to give appropriate arrangements for leave, reduce their work intensity, and in bad weather conditions as far as possible to arrange for vehicles to transport staff travel, to provide a good travel environment for staff at the same time to protect the safety of the staff transportation;
c. Strengthen the inspection of the road surface, timely clean the water, snow, ice accumulation on the road surface to ensure that the road surface is smooth and dry.
(2) If conditions permit, increase the resources required for flight support, such as purchasing more vehicles and expanding the number of drivers. This will alleviate the pressure on the unit's flights while reducing the work pressure on vehicle drivers, thereby reducing road traffic safety hazards.
(3) Arrange the facilities and equipment placed on the side of the road, designate a special equipment placement area for different uses of equipment, and require the staff to put it neatly in the specified position after use.
(4) Posting or painting yellow reflective warning signs on mobile or non-mobile facilities and equipment on the side of the road, so as to attract the attention of drivers at night and reduce the probability of accidents.
(5) For large special vehicles, on the one hand, the rearview mirror is added to the blind area of the body, and on the other hand, the driver is reminded to drive slowly and observe frequently.
(6) Strengthen the safety regulation education of the airport staff, improve the safety awareness and compliance awareness of all types of staff, and at the same time, the airport traffic control department should strengthen the supervision, recording and punishment of road violations to avoid the occurrence of personnel violations.
(7) Strengthen the awareness of responsibility of the ground service personnel, when organizing passengers to enter the aircraft activity area to get on and off the aircraft, it should ensure that each passenger activities in the prescribed area, to avoid passengers missing in the aircraft activity area and uncontrolled incidents.
(8) If there is a blind area of vision at the sharp bend of the road, the blind area can be eliminated by installing convex mirrors.
-
(1) According to the accident causation theory, road traffic safety accidents in airports were divided into five categories: person-vehicle-road-environment-management. Taking into account the differences between civil aviation airports and the external environment, the influencing factors of each category were analyzed, and a risk assessment index system for road traffic safety in airports was established. This system comprehensively and systematically reflected the characteristics of road traffic safety in civil aviation airports.
(2) Four common accident patterns in the road traffic system within the aircraft activity area of the airport were identified, with a focus on the analysis of human-vehicle accidents. Starting from road traffic accidents, the accident tree analysis and qualitative and quantitative analysis were conducted for this accident pattern. The minimum cut sets, basic event importance sequence, and the probability of top events were determined for each accident tree. The top event probability was found to be 0.2558%, indicating a relatively good overall safety status of the system. The key factors and vulnerable areas affecting the safety of road traffic in the airport aircraft activity area were identified. Accident prevention measures were primarily focused on the second category of hazards, providing objective evidence for the safety management of the airport aircraft activity area.
(3) The combination of Bayesian network with fault tree analysis effectively addresses the probability of different accidents and provides corresponding solutions, thereby contributing to the safety management of road traffic in airports. The practical application of this combination of methods in various types of airports, summarizing the pattern of accidents and the underlying causes, helps to prevent the occurrence of road traffic accidents in aviation airports, and to strengthen the safe and reliable operation of road traffic in the aircraft activity zones of airports in China.
-
The authors confirm contribution to the paper as follows: study conception and design: Guo RJ; data collection: Wu JW; analysis and interpretation of results: Yin Y; Wang WX; draft manuscript preparation: Ji F. All authors reviewed the results and approved the final version of the manuscript.
-
The data that support the findings of this study are available in the Web of Science (WoS) repository.
-
The authors declare that they have no conflict of interest.
- Copyright: © 2024 by the author(s). Published by Maximum Academic Press, Fayetteville, GA. This article is an open access article distributed under Creative Commons Attribution License (CC BY 4.0), visit https://creativecommons.org/licenses/by/4.0/.
-
About this article
Cite this article
Guo R, Wu J, Ji F, Wang W, Yin Y. 2024. Analysis of traffic safety in airport aircraft activity areas based on bayesian networks and fault trees. Digital Transportation and Safety 3(1): 8−18 doi: 10.48130/dts-0024-0002 

Analysis of traffic safety in airport aircraft activity areas based on bayesian networks and fault trees
- Received: 02 November 2023
- Revised: 06 February 2024
- Accepted: 20 February 2024
- Published online: 28 March 2024
Abstract: To assess road traffic safety risk in civil aviation airports and develop effective accident prevention measures, this study proposed a risk assessment method based on accident tree and Bayesian network for airport aircraft activity areas. It identified influencing factors in the aircraft activity area from the perspectives of person-vehicle-road-environment-management and analyzed their relationships. The Bayesian network was utilized to determine initial probabilities for each influencing factor. Findings indicated a relatively high overall safety level in the airport's road traffic system. Accident trees were employed to qualitatively and quantitatively analyze common human-vehicle accident patterns. The initial probabilities obtained from the Bayesian network served as basic event probabilities in the accident tree to determine the occurrence probability of the top event. Taking a 4F airport in China as an example, accident cause analysis identified five important risk sources in human-vehicle accidents, including blind spots for special vehicles, illegal driving by drivers, pedestrians violating regulations, passengers entering restricted areas, and blind spots at intersections. Corresponding safety management measures were formulated. The study concluded that the integration of Bayesian networks and accident trees effectively determines accident probabilities and offers specific solutions, thus playing a crucial role in enhancing road traffic safety management within aviation airports.