-
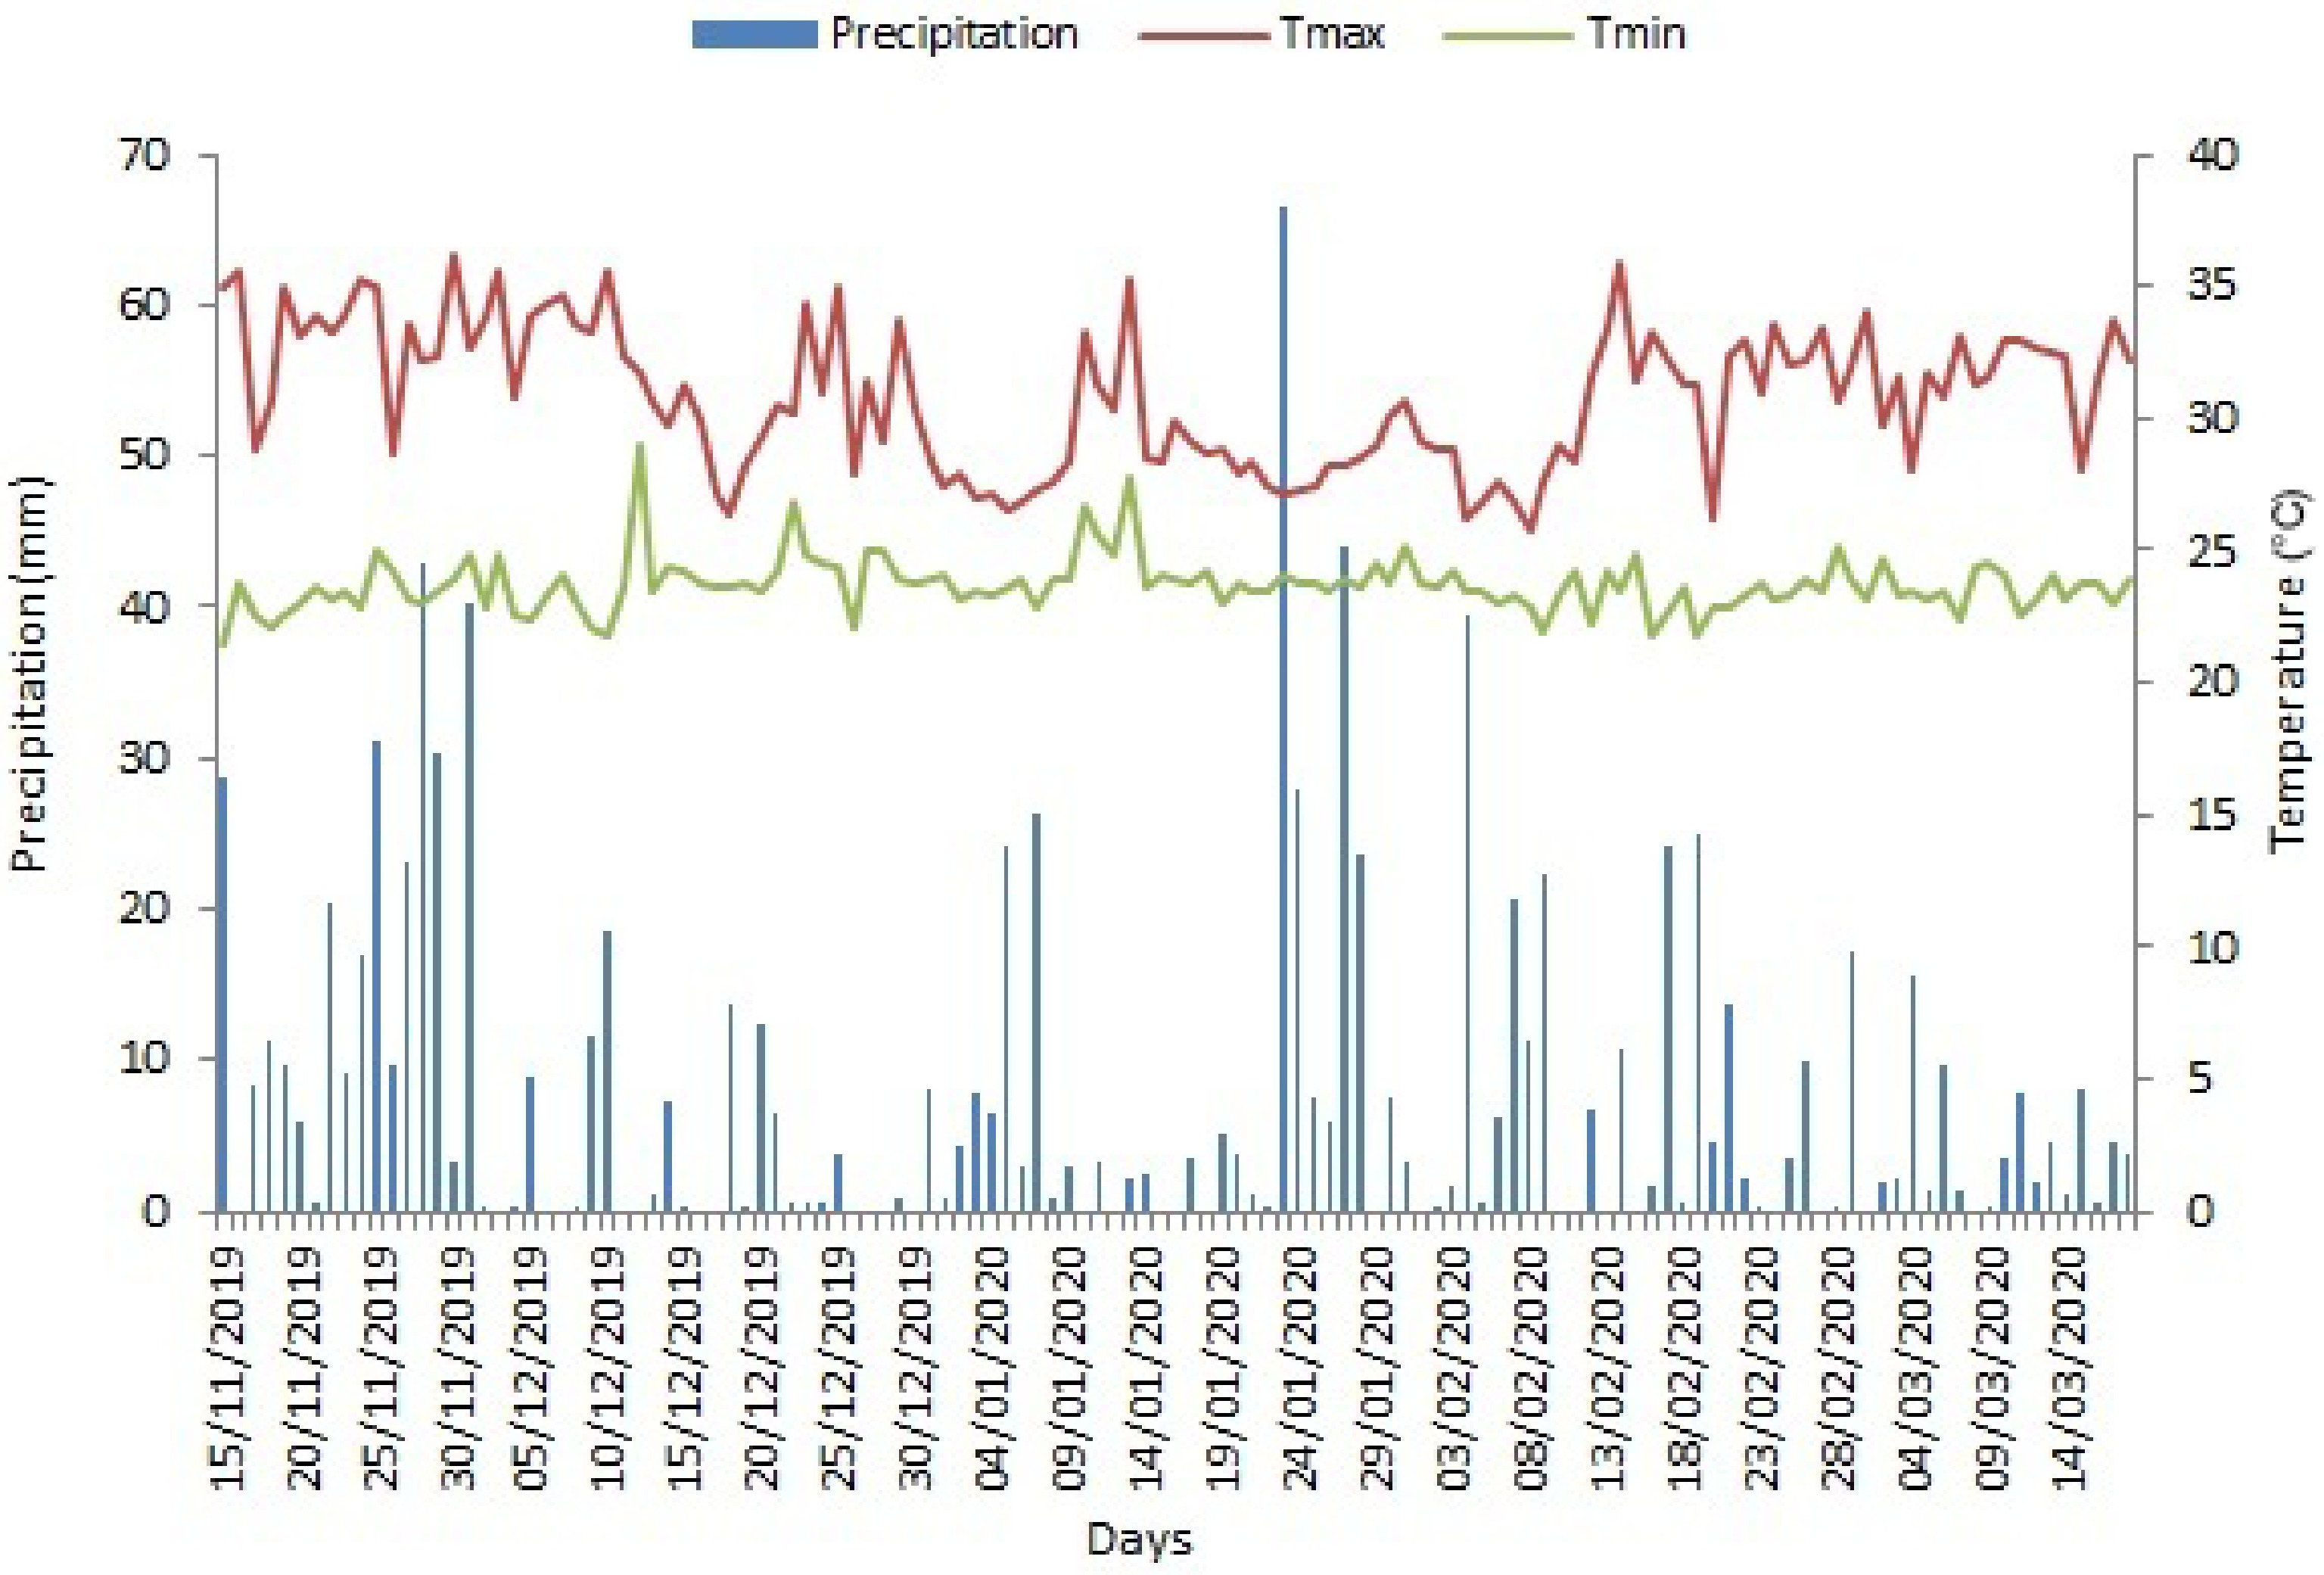
Figure 1.
Mean values of maximum (Tmax) and minimum (Tmin) temperature (°C), and precipitation (mm).
-
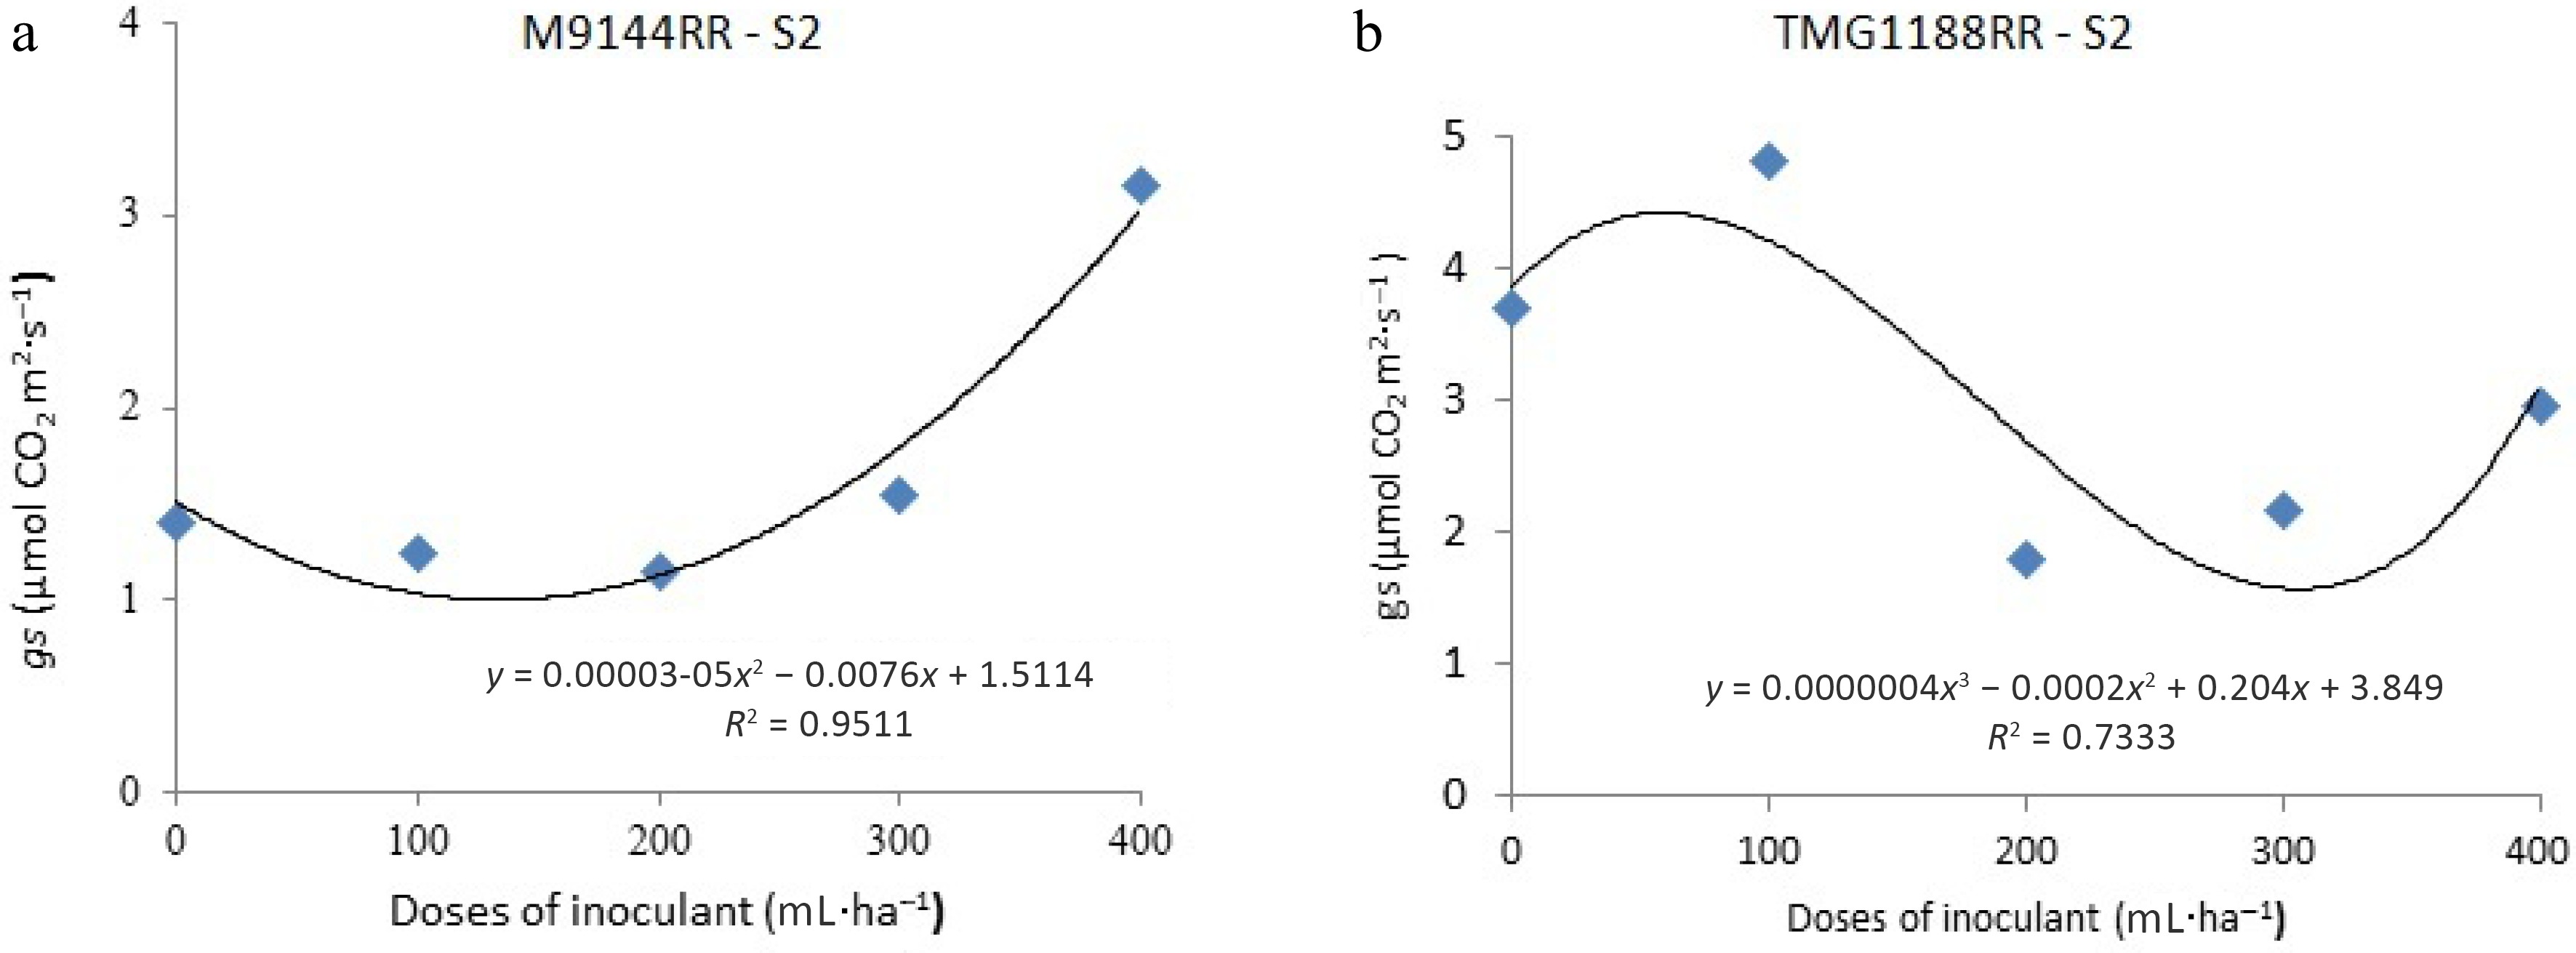
Figure 2.
Stomatal conductance (gs) as a function of foliar application of different doses of A. brasilense in soybean at vegetative stage V5, on three sowing dates.
-
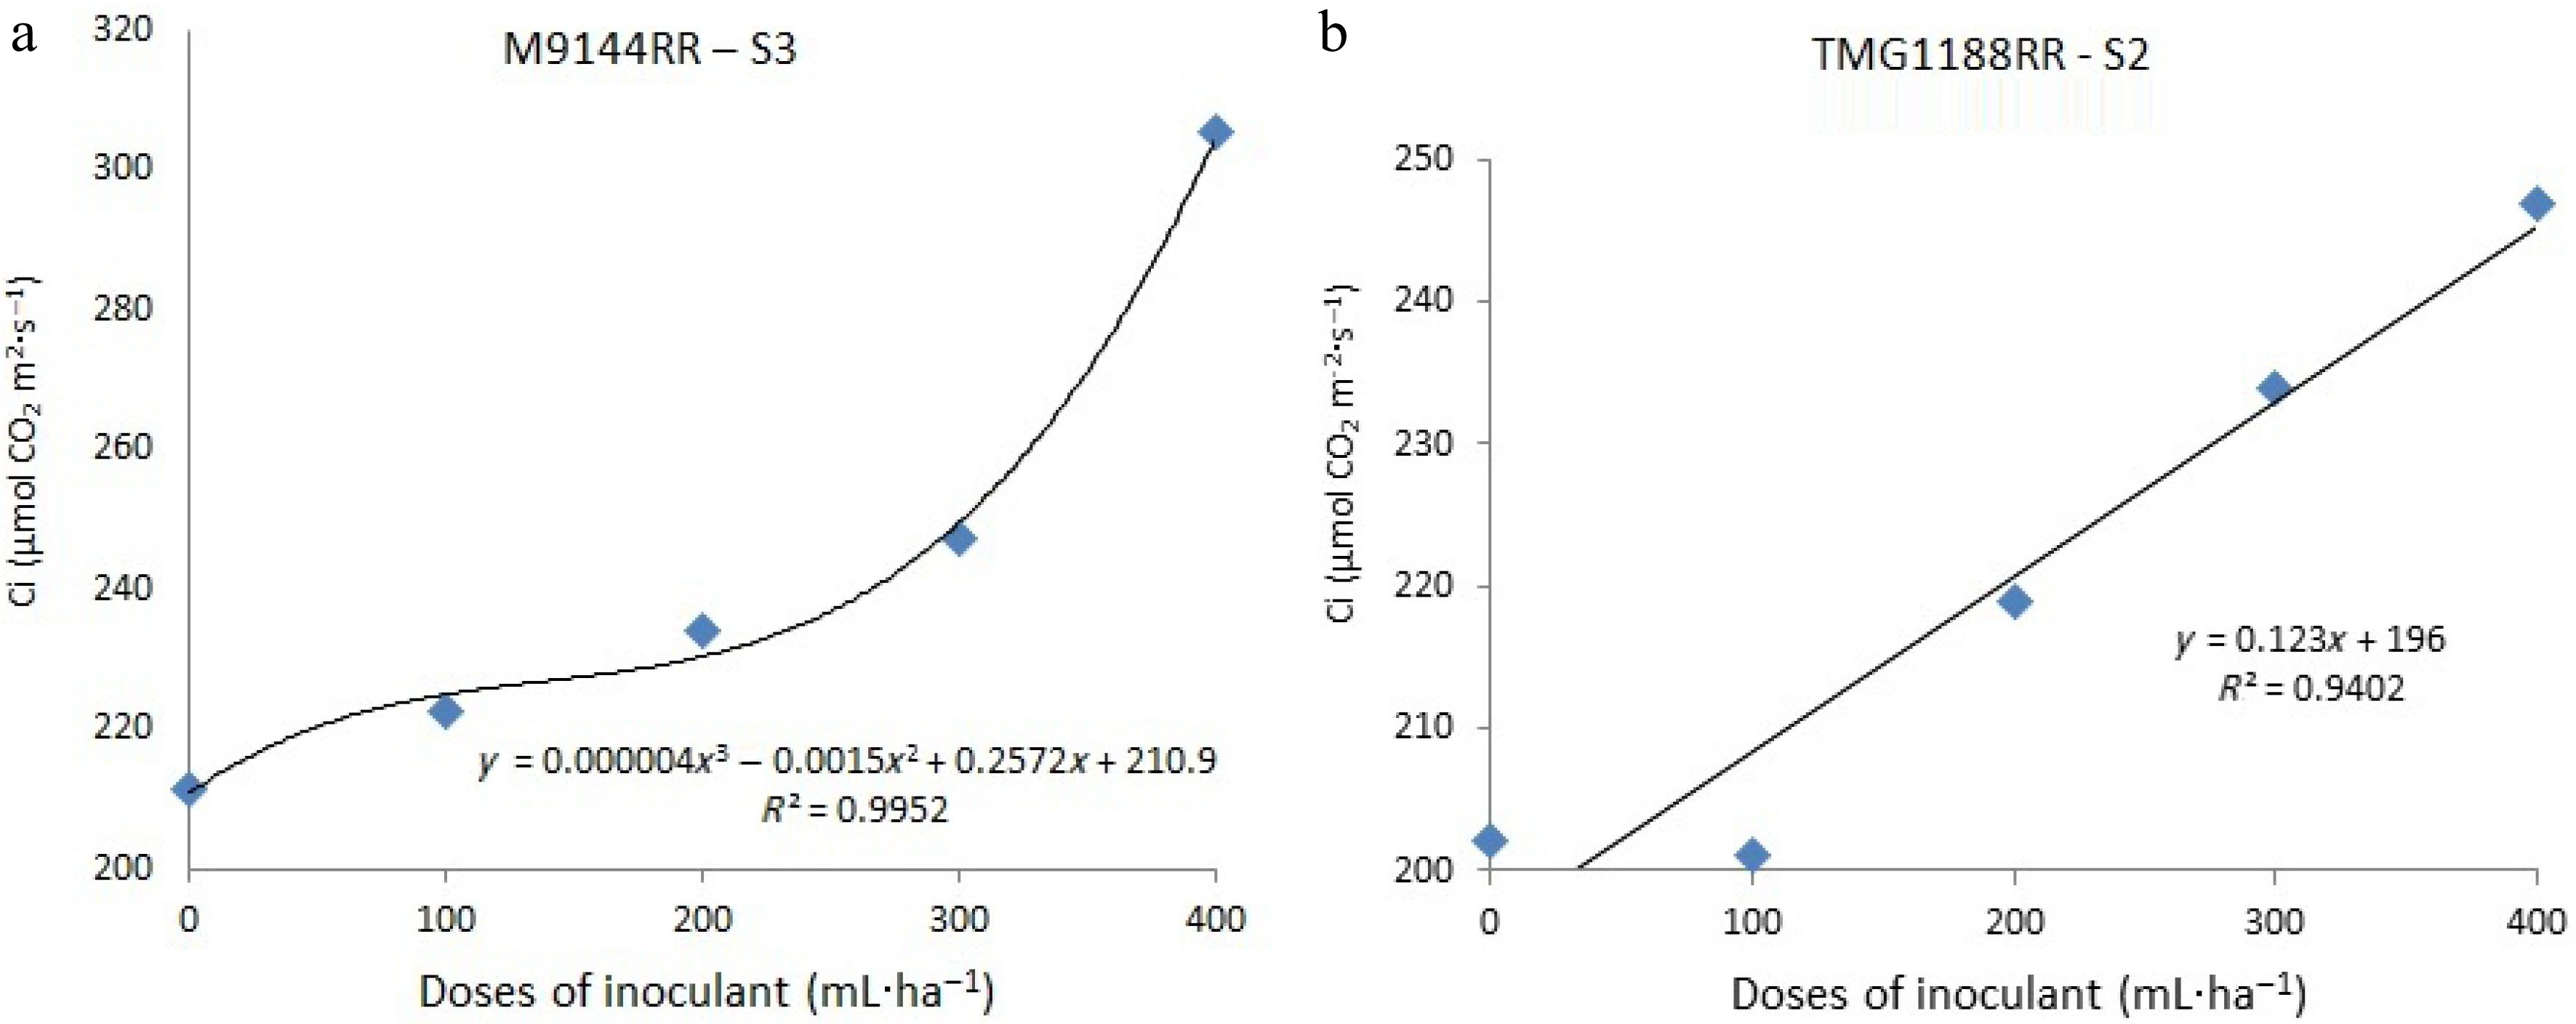
Figure 3.
Intercellular CO2 concentration as a function of foliar application of different doses of A. brasilense in soybean phenology stage V5, on three sowing dates.
-
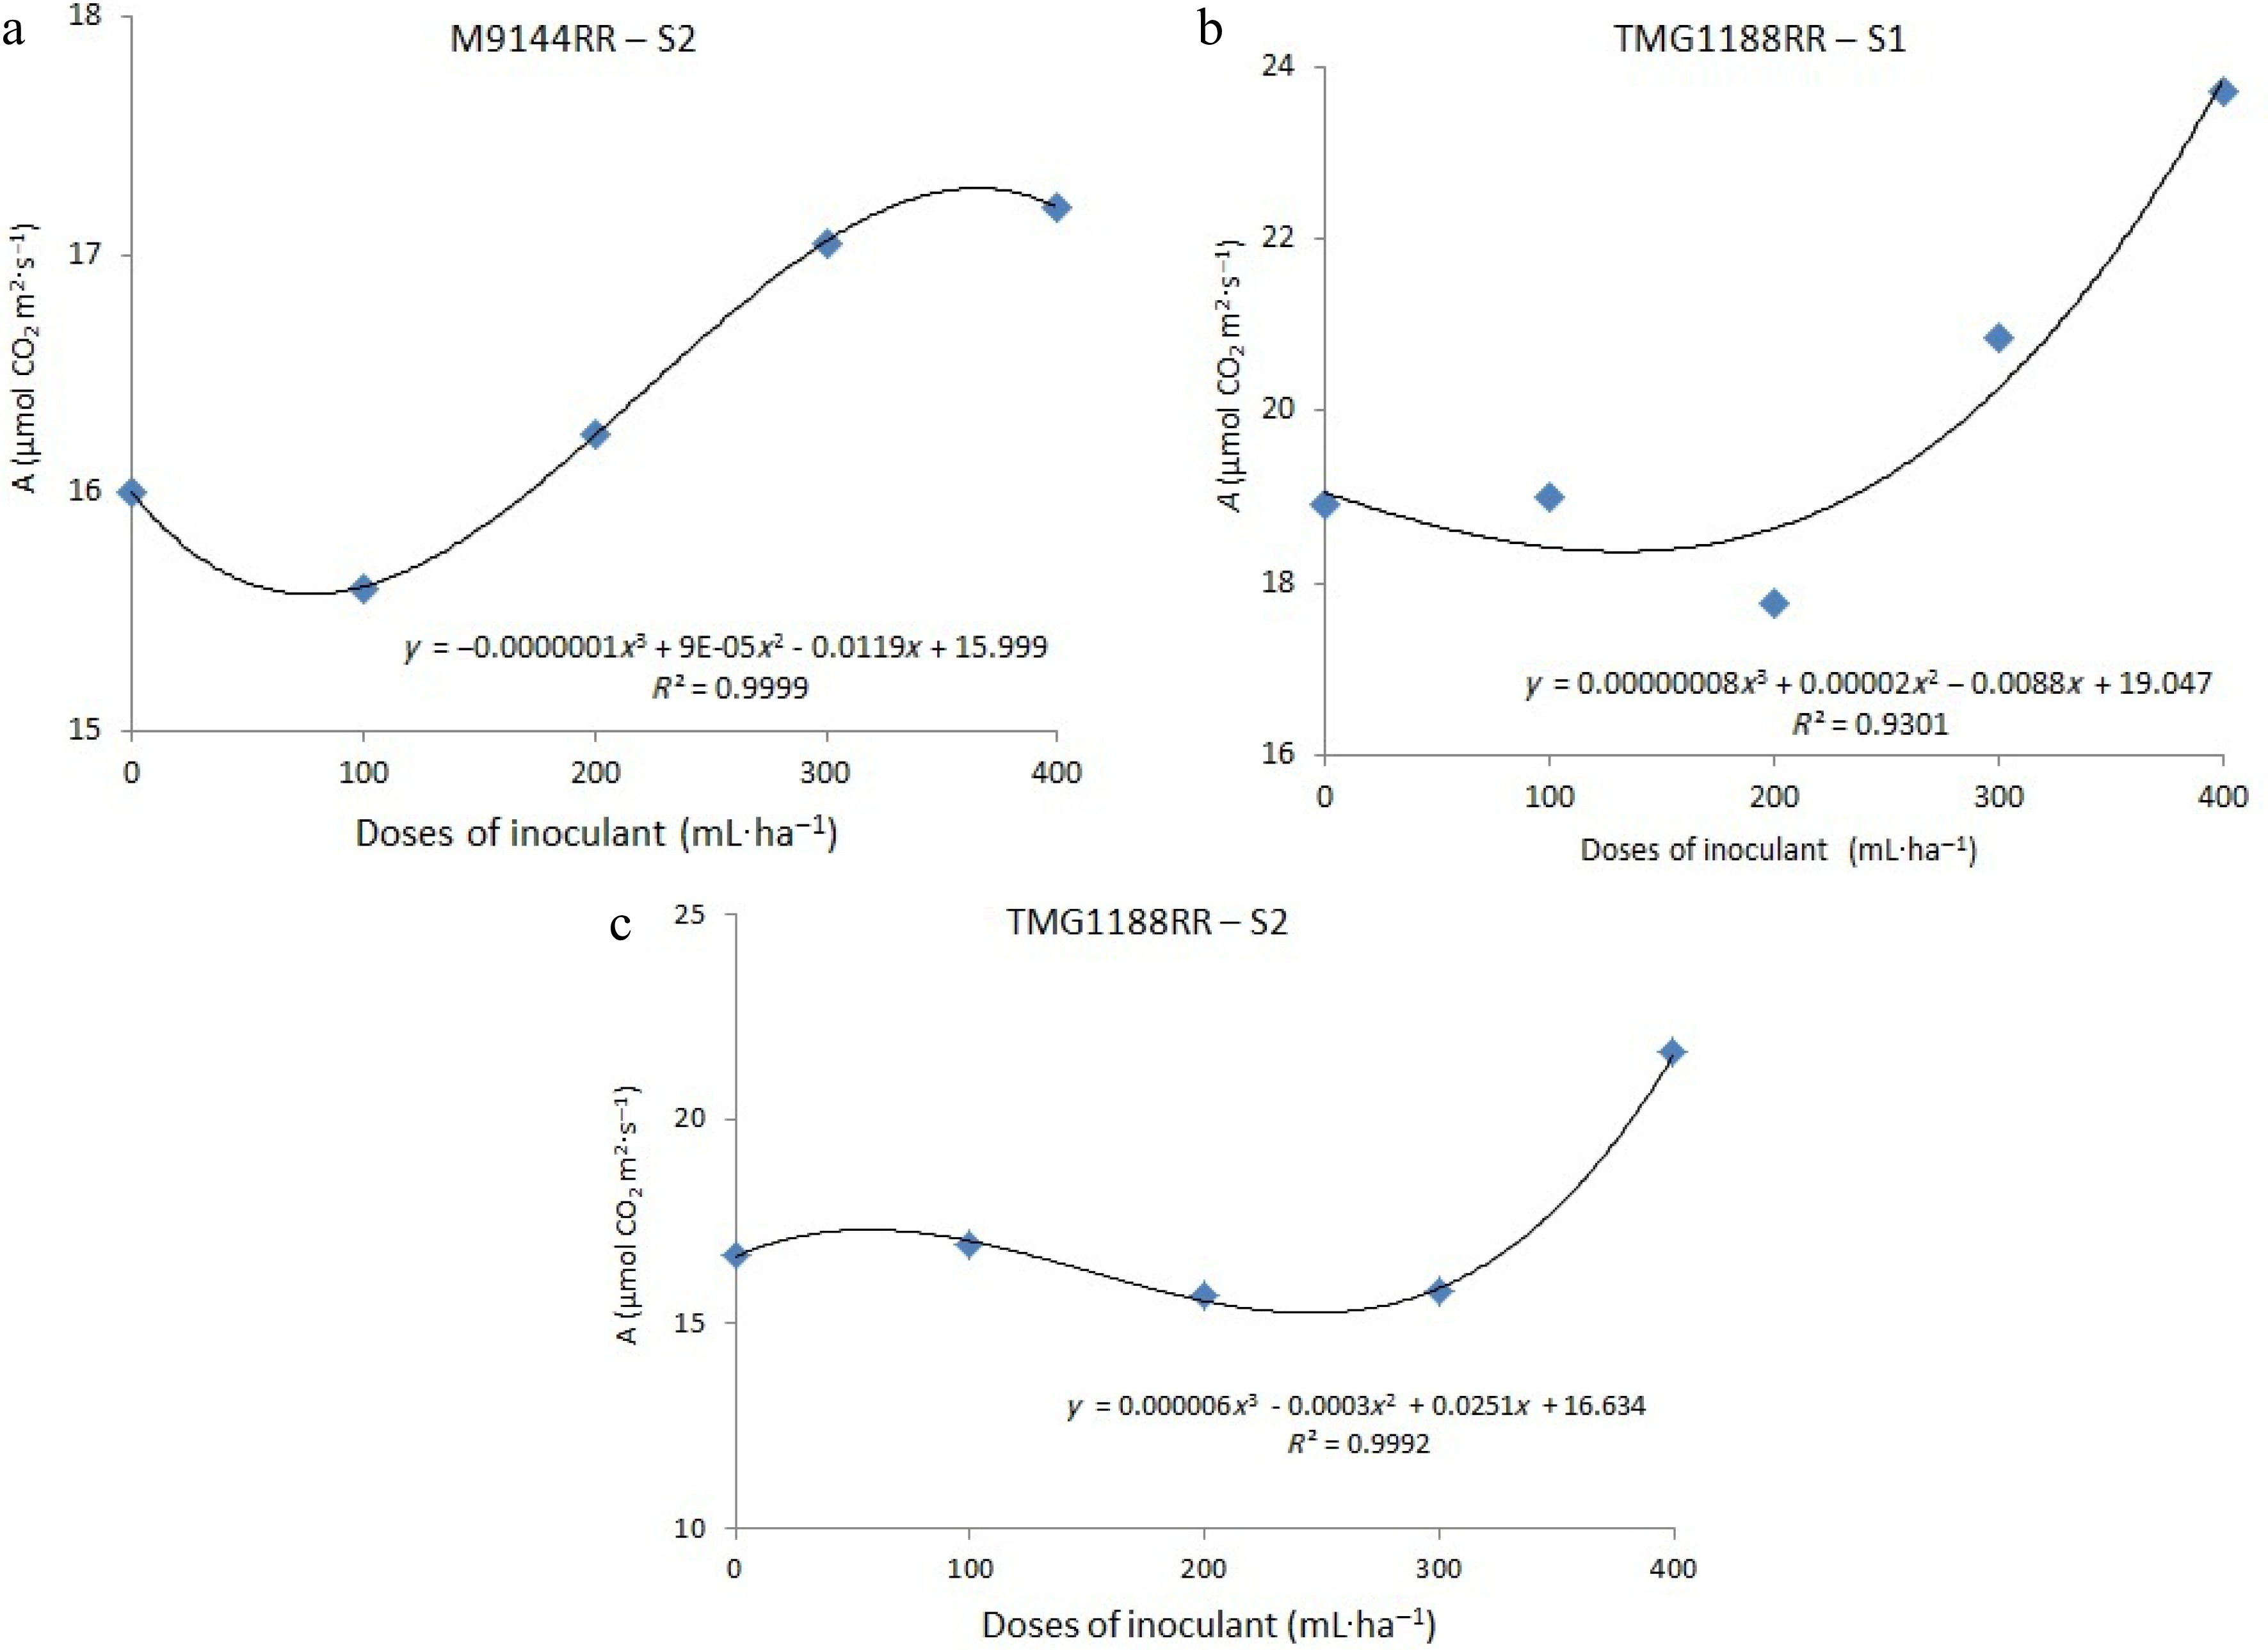
Figure 4.
Net photosynthesis rate as a function of foliar application of different doses of A. brasilense in soybean at phenological stage V5, on three sowing dates.
-
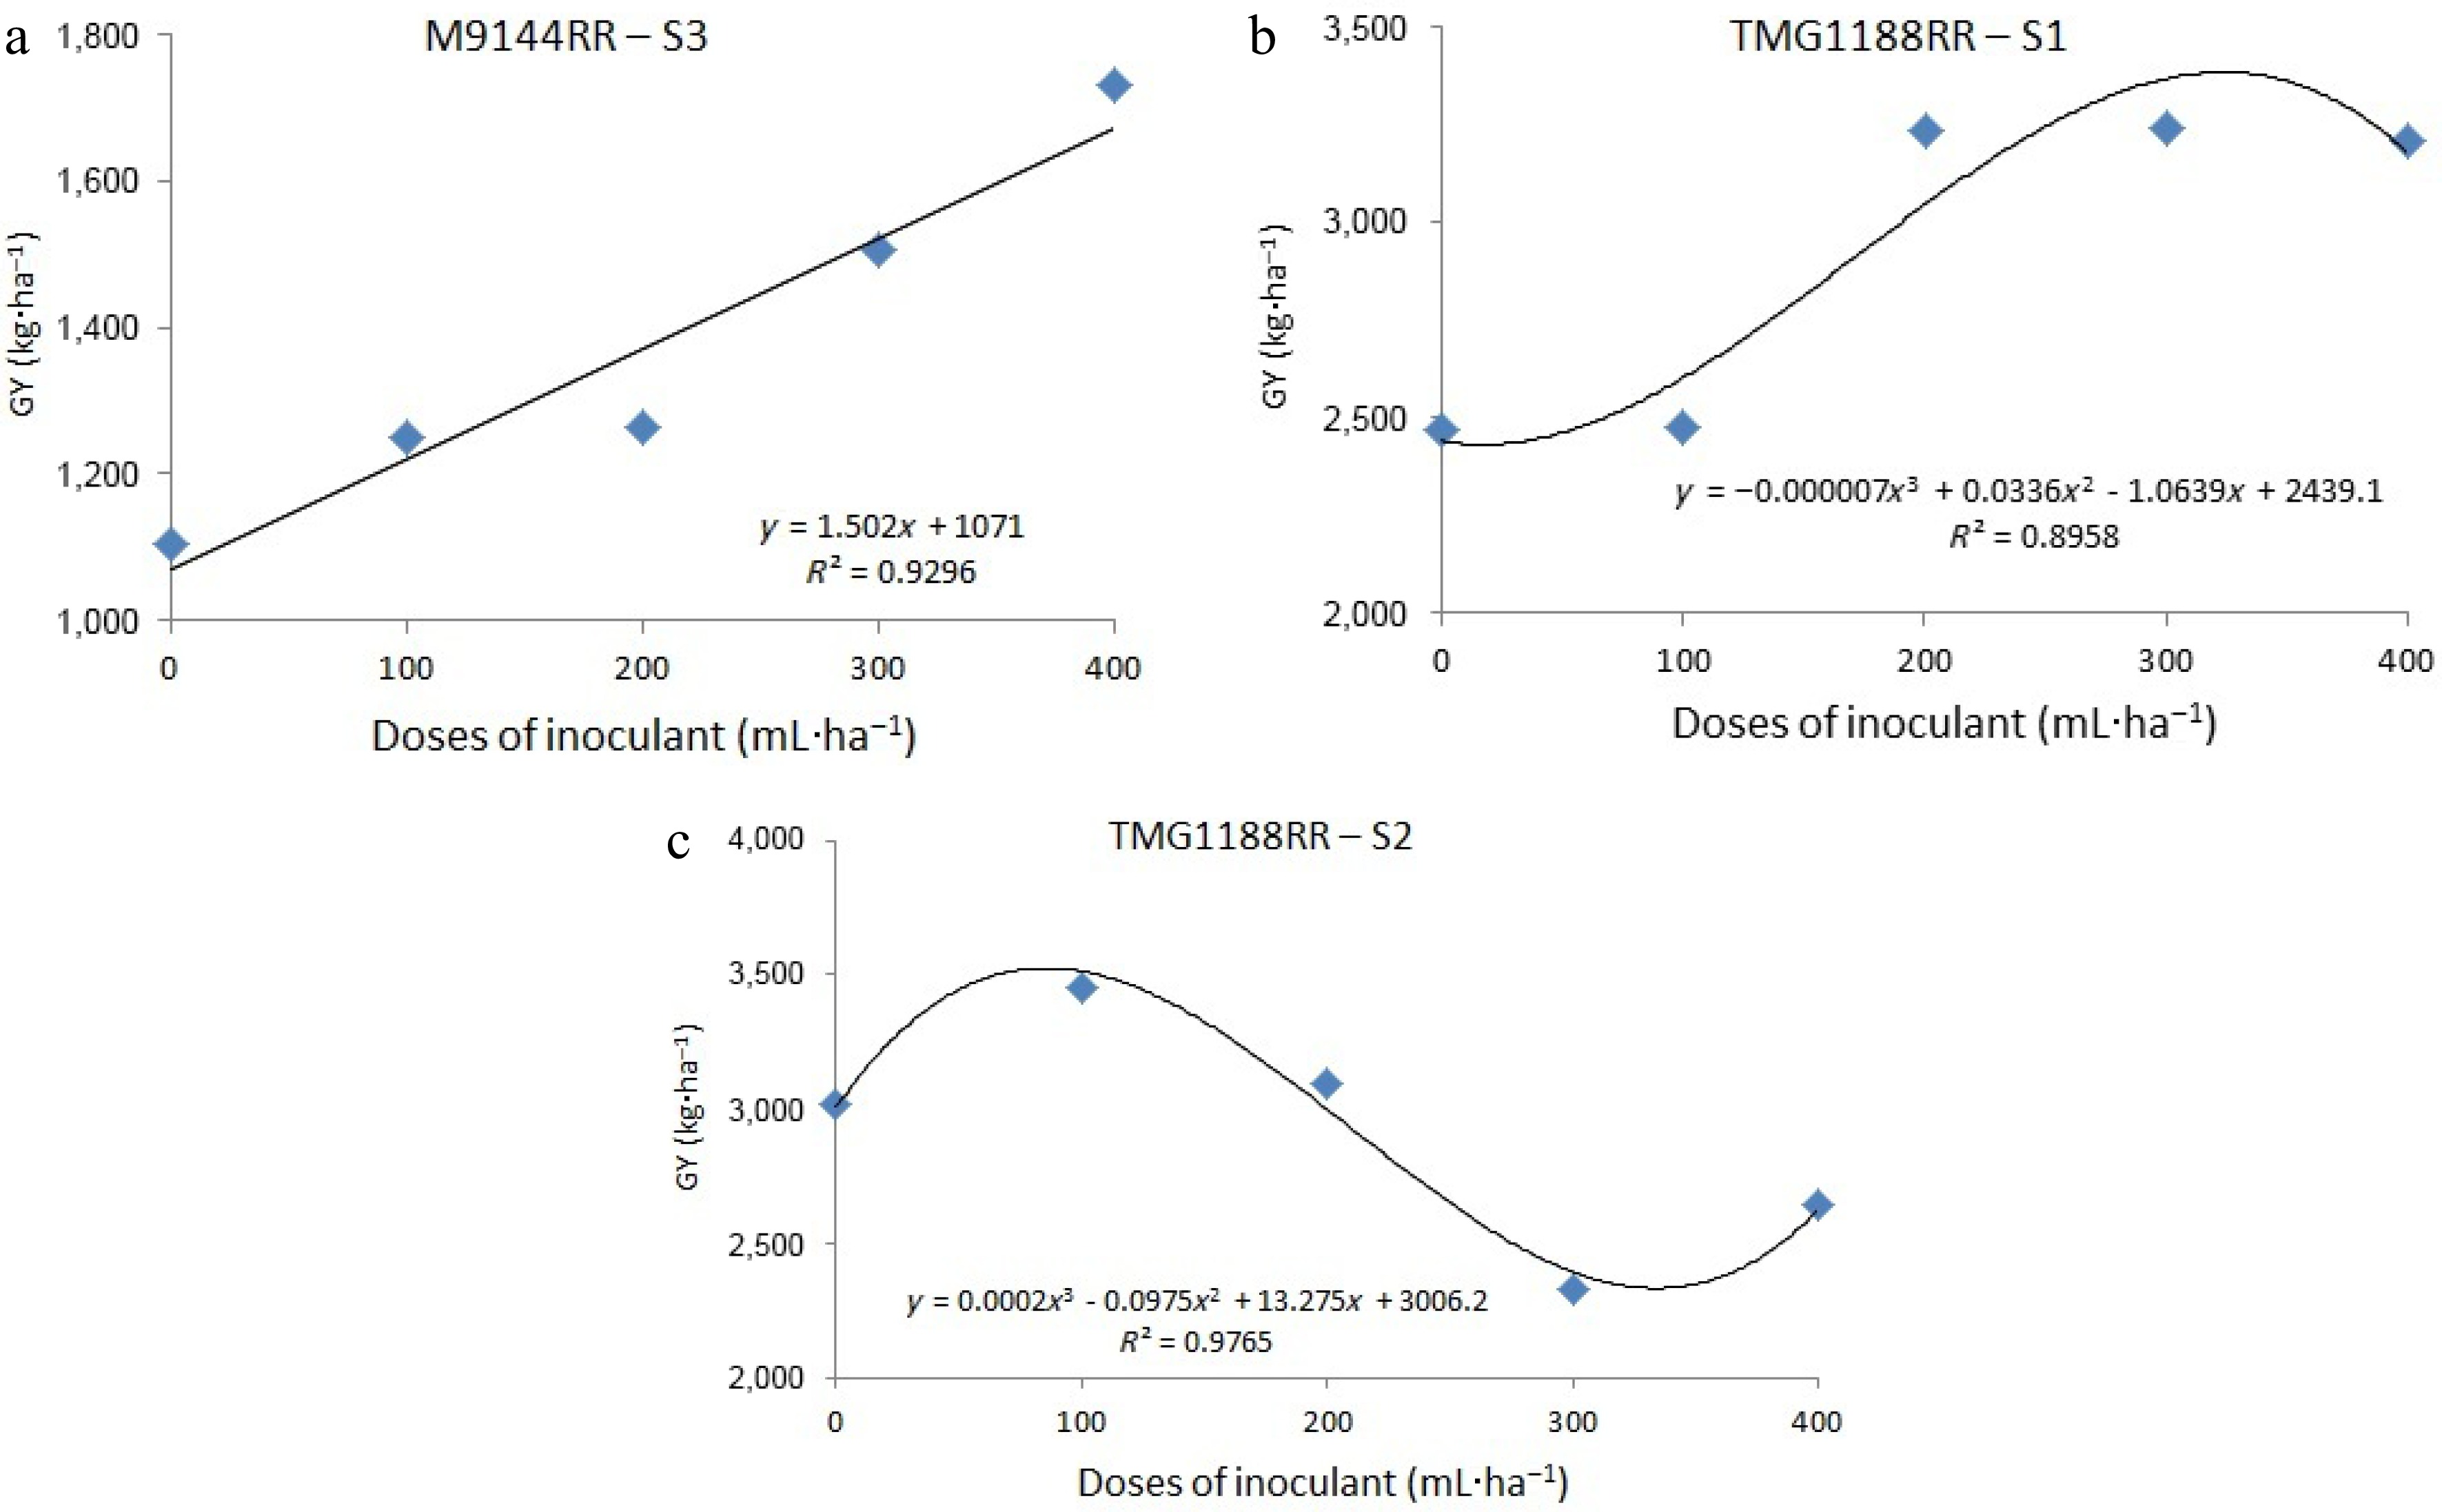
Figure 5.
Grain yield as a function of foliar application of different doses of A. brasilense in soybean at phenological stage V5, on three sowing dates.
-
SV DF Mean square gs E iC A GY S 2 36.0* 2.0* 394858.7* 504.7* 2667545.8* C 1 69.0* 2.4* 6200.2* 213.9* 290306.9* D 4 12.1* 2.4* 4320.4* 27.5* 301862.8ns R (S) 9 1.2ns 0.1ns 261.4ns 1.2ns 54749.0ns S × C 2 18.6* 3.2* 27846.9* 108.2* 543547.6* S × D 8 8.7* 1.1* 1623.9* 12.4* 307563.6* C × D 4 25.4* 2.2* 702.3* 3.3* 321298.1* S × D × C 8 9.9* 0.5* 3313.1* 7.5* 507260.0* Error 81 1.0 0.2 122.1 1.2 90896.9 Total 119 CV (%) 16.87 6.59 4.33 6.25 12.69 *: Significant at p ≤ 0.05 by F test; ns: Not significant. DF: Degrees of freedom; SV: Source of variation; S: sowing dates; C: cultivars; D: doses of Azospirillum brasilense; R: Replications. Table 1.
Analysis of variance related to the characteristics: net photosynthesis rate (A µmol CO2 m2·s−1), stomatal conductance (gs µmol CO2 m2·s−1), transpiration rate (E mmol H2O m2·s−1), internal CO2 concentration (iC µmol CO2 m2·s−1) and grain yield (GY kg·ha−1) of the soybean cultivars (C), M9144RR and TMG1188RR, produced on three sowing dates (S).
-
Sowing dates Cultivars gs (µmol CO2 m2·s−1) Dose (mL·ha−1) 0 100 200 300 400 S1 M9144RR 1.70Ab 1.65Aa 1.85Aa 3.1Aa 2.45Aa TMG132RR 1.25Ba 1.50Ba 1.50Aa 1.55Bb 1.95Bb S2 M9144RR 1.40Ab 1.25Ab 1.15Ab 1.55Bb 3.15Aa TMG132RR 3.70Aa 4.80Aa 1.80Aa 2.17Aa 2.95Aa S3 M9144RR 1.40Aa 1.35Aa 1.55Aa 1.35Ba 1.90Ba TMG132RR 1.45Ba 1.45Ba 1.60Aa 1.70Ba 1.60Ba Means between seasons, within the same cultivar, followed by the same capital letter in the column do not differ by the Scott Knott test at 5% probability. Means between cultivars, within the same season, followed by the same lowercase letter in the column do not differ by the Scott Knott test at 5% probability. * S1: sowing date 1; S2: sowing date 2; S3: sowing date 3. Table 2.
Means of S × C × D interaction for stomatal conductance (gs) of two soybean cultivars, in three sowing dates and different doses of A. brasilense.
-
Sowing dates Cultivar E (mmol H2O m−2·s−1) Dose mL·ha−1 0 100 200 300 400 S1 M9144RR 7.60Aa 7.35Aa 7.00Aa 7.10Aa 7.30Aa TMG132RR 7.15Aa 6.95Ba 6.90Ba 6.00Aa 7.00Aa S2 M9144RR 7.00Aa 6.25Bb 6.80Aa 7.60Aa 7.50Aa TMG132RR 7.25Aa 7.30Aa 6.65Ba 6.80Aa 7.25Aa S3 M9144RR 7.25Aa 6.95Ba 7.05Aa 7.10Aa 7.50Aa TMG132RR 7.00Aa 7.75Aa 7.25Aa 6.90Aa 7.55Aa Means between seasons, within the same cultivar, followed by the same capital letter in the column do not differ by the Scott Knott test at 5% probability. Means between cultivars, within the same season, followed by the same lowercase letter in the column do not differ by the Scott Knott test at 5% probability. * S1: sowing date 1; S2: sowing date 2; S3: sowing date 3. Table 3.
Means of S × C × D interaction for transpiration (E) of two soybean cultivars, on three sowing dates and different doses of A. brasilense.
-
Sowing dates Cultivars iC (μmol CO2 m−2·s−1) Dose mL·ha−1 0 100 200 300 400 S1 M9144RR 331.00Aa 338.50Aa 329.00Aa 343.00Aa 347.00Aa TMG132RR 332.50Aa 344.00Aa 327.50Aa 336.50Aa 328.50Aa S2 M9144RR 202.50Ba 198.50Ba 193.00Ba 198.50Bb 195.00Bb TMG132RR 202.50Ba 201.50Ba 219.00Ba 234.50Ba 247.50Ba S3 M9144RR 211.50Ba 222.50Ba 234.00Ba 247.00Ba 305.00Aa TMG132RR 190.50Ba 196.00Ba 194.00Ba 192.00Ba 196.00Bb Means between seasons, within the same cultivar, followed by the same capital letter in the column do not differ by the Scott Knott test at 5% probability. Means between cultivars, within the same season, followed by the same lowercase letter in the column do not differ by the Scott Knott test at 5% probability. * S1: sowing date 1; S2: sowing date 2; S3: sowing date 3. Table 4.
Means of S × C × D interaction for internal CO2 concentration (iC) of two soybean cultivars, on three sowing dates and different doses of A. brasilense.
-
Sowing dates Cultivars A (µmol CO2 m−2·s−1) Dose mL ha−1 0 100 200 300 400 S1 M9144RR 20.35Aa 21.05Aa 20.10Aa 21.70Aa 23.10Aa TMG132RR 18.90Ab 19.00Aa 17.75Ab 20.85Aa 23.70Aa S2 M9144RR 16.0Ba 15.60Ca 16.25Ca 17.05Ba 17.20Cb TMG132RR 16.55Ba 16.95Ba 15.65Ba 15.80Bb 21.60Ba S3 M9144RR 17.15Ba 18.75Ba 18.55Ba 17.40Ba 20.00Ba TMG132RR 14.30Cb 14.65Cb 13.50Cb 14.00Cb 12.75Cb Means between seasons, within the same cultivar, followed by the same capital letter in the column do not differ by the Scott Knott test at 5% probability. Means between cultivars, within the same season, followed by the same lowercase letter in the column do not differ by the Scott Knott test at 5% probability. * S1: sowing date 1; S2: sowing date 2; S3: sowing date 3. Table 5.
Means of S × C × D interaction for net photosynthesis rate (A) of two soybean cultivars, on three sowing dates and different doses of A. brasilense.
-
Sowing dates Cultivars GY (kg·ha−1) Doses (mL·ha−1) 0 100 200 300 400 S1 M9144RR 2,512 Aa 2,438 Aa 2,578 Bb 2,737 Ab 2,529 Bb TMG1188RR 2,471 Ba 2,472 Ba 3,235 Aa 3,239 Aa 3,210 Aa S2 M9144RR 2,792 Aa 2,658 Ab 3,212Aa 2,844 Aa 3,441 Aa TMG1188RR 3,022 Aa 3,450 Aa 3,094 Aa 2,331 Bb 2,644 Bb S3 M9144RR 1,106 Ba 1,508 Ba 1,265 Cb 1,251 Bb 1,730 Ca TMG1188RR 1,553 Ca 1,506 Ca 1,609 Ba 1,562 Ca 1,311 Cb Means between seasons, within the same cultivar, followed by the same capital letter in the column do not differ by the Scott Knott test at 5% probability. Means between cultivars, within the same season, followed by the same lowercase letter in the column do not differ by the Scott Knott test at 5% probability. * S1: sowing date 1; S2: sowing date 2; S3: sowing date 3. Table 6.
Means of S × C × D interaction for grain yield (GY) of two soybean cultivars, on three sowing dates and different doses of A. brasilense.
Figures
(5)
Tables
(6)