-
Soybean (Glycine max (L.) Merrill) is the most cultivated grain in the State of Tocantins, being the largest producer in the North region of Brazil[1]. The climate in the region is favorable for planting during the rainy season, however, dry periods have been observed frequently, affecting soybean development through changes in physiological parameters, resulting from unfavorable weather conditions[2].
Water deficiency is responsible for causing changes from molecular to morphophysiological levels, limiting plant growth and development[3]. One of the first physiological signs in response to increased temperature and reduced soil moisture is related to stomatal conductance, where a series of coordinated responses occur, preventing and/or hindering gas exchange[4]. Thus, there is a change in the photosynthetic apparatus with effects on carbon assimilation, nitrogen fixation and water use efficiency[5].
Studies conducted by Wang et al.[6] with soybean under water deficit conditions indicated a reduction in photosynthetic activity due to stomatal closure, causing a drop in productivity. Therefore, ensuring that, even under stress conditions, the plant manages to reduce cell damage, avoiding drastic losses in productivity, is a challenge.
Some strategies, such as the use of plant growth-promoting bacteria, have shown promising results. Kasim et al.[7] observed a reduction in the effects of severe water stress on the relative water content of wheat plants inoculated with A. brasilense. In addition, the authors also found a decrease in reactive oxygen species and a reduction in the inhibitory effects of drought on chlorophylls a and b. Bulegon et al.[8] also observed positive effects in the removal of reactive oxygen species and in the protection of chlorophyll a in Urochloa ruziziensis plants inoculated with A. brasilense.
Studies conducted by Armanhi et al.[9] verified that the inoculation of corn plants with colonizing microorganisms optimized water use in plants under water stress, in addition to reducing leaf temperature. Naoe et al.[10] also found an increase in water use efficiency in soybean under water deficit and inoculated with A. brasilense.
Thus, inoculation with A. brasilense seems to bring benefits to crops under unfavorable environmental conditions[8, 11]. In addition, in soybeans, its use associated with Bradirhyzobium japonicum is indicated as a management technique that increases crop productivity[12] and contributes to improving morphological characteristics of plants[13]. Another important point in studies with A. brasilense is in relation to the best dose and forms of application, as there is still no consensus in the literature, since the beneficial effects attributed to plants are multifactorial and difficult to understand.
Therefore, considering the frequent extreme drought and temperature events, especially in the State of Tocantins, it is necessary to seek alternatives that reduce losses in the productivity of crops. Therefore, the present study aimed to evaluate the alterations resulting from the foliar application of Azospirillum brasilense in the physiological parameters and in the productivity of two soybean cultivars in the Savanna Tocantinense, cultivated in three sowing dates and five different doses of inoculant.
-
The study was conducted at the experimental fields of the Federal University of Tocantins, municipality of Palmas, TO, Brazil (10°10' S and 48°21' W, at 216 m of altitude), from November 2019 to March 2020. Consecutive seasons were carried out on three sowing sessions, November 15th, 2019 (S1); December 2nd, 2019 (S2) and December 20th, 2019 (S3). Figure 1 presents the climatic data observed throughout both experiments.
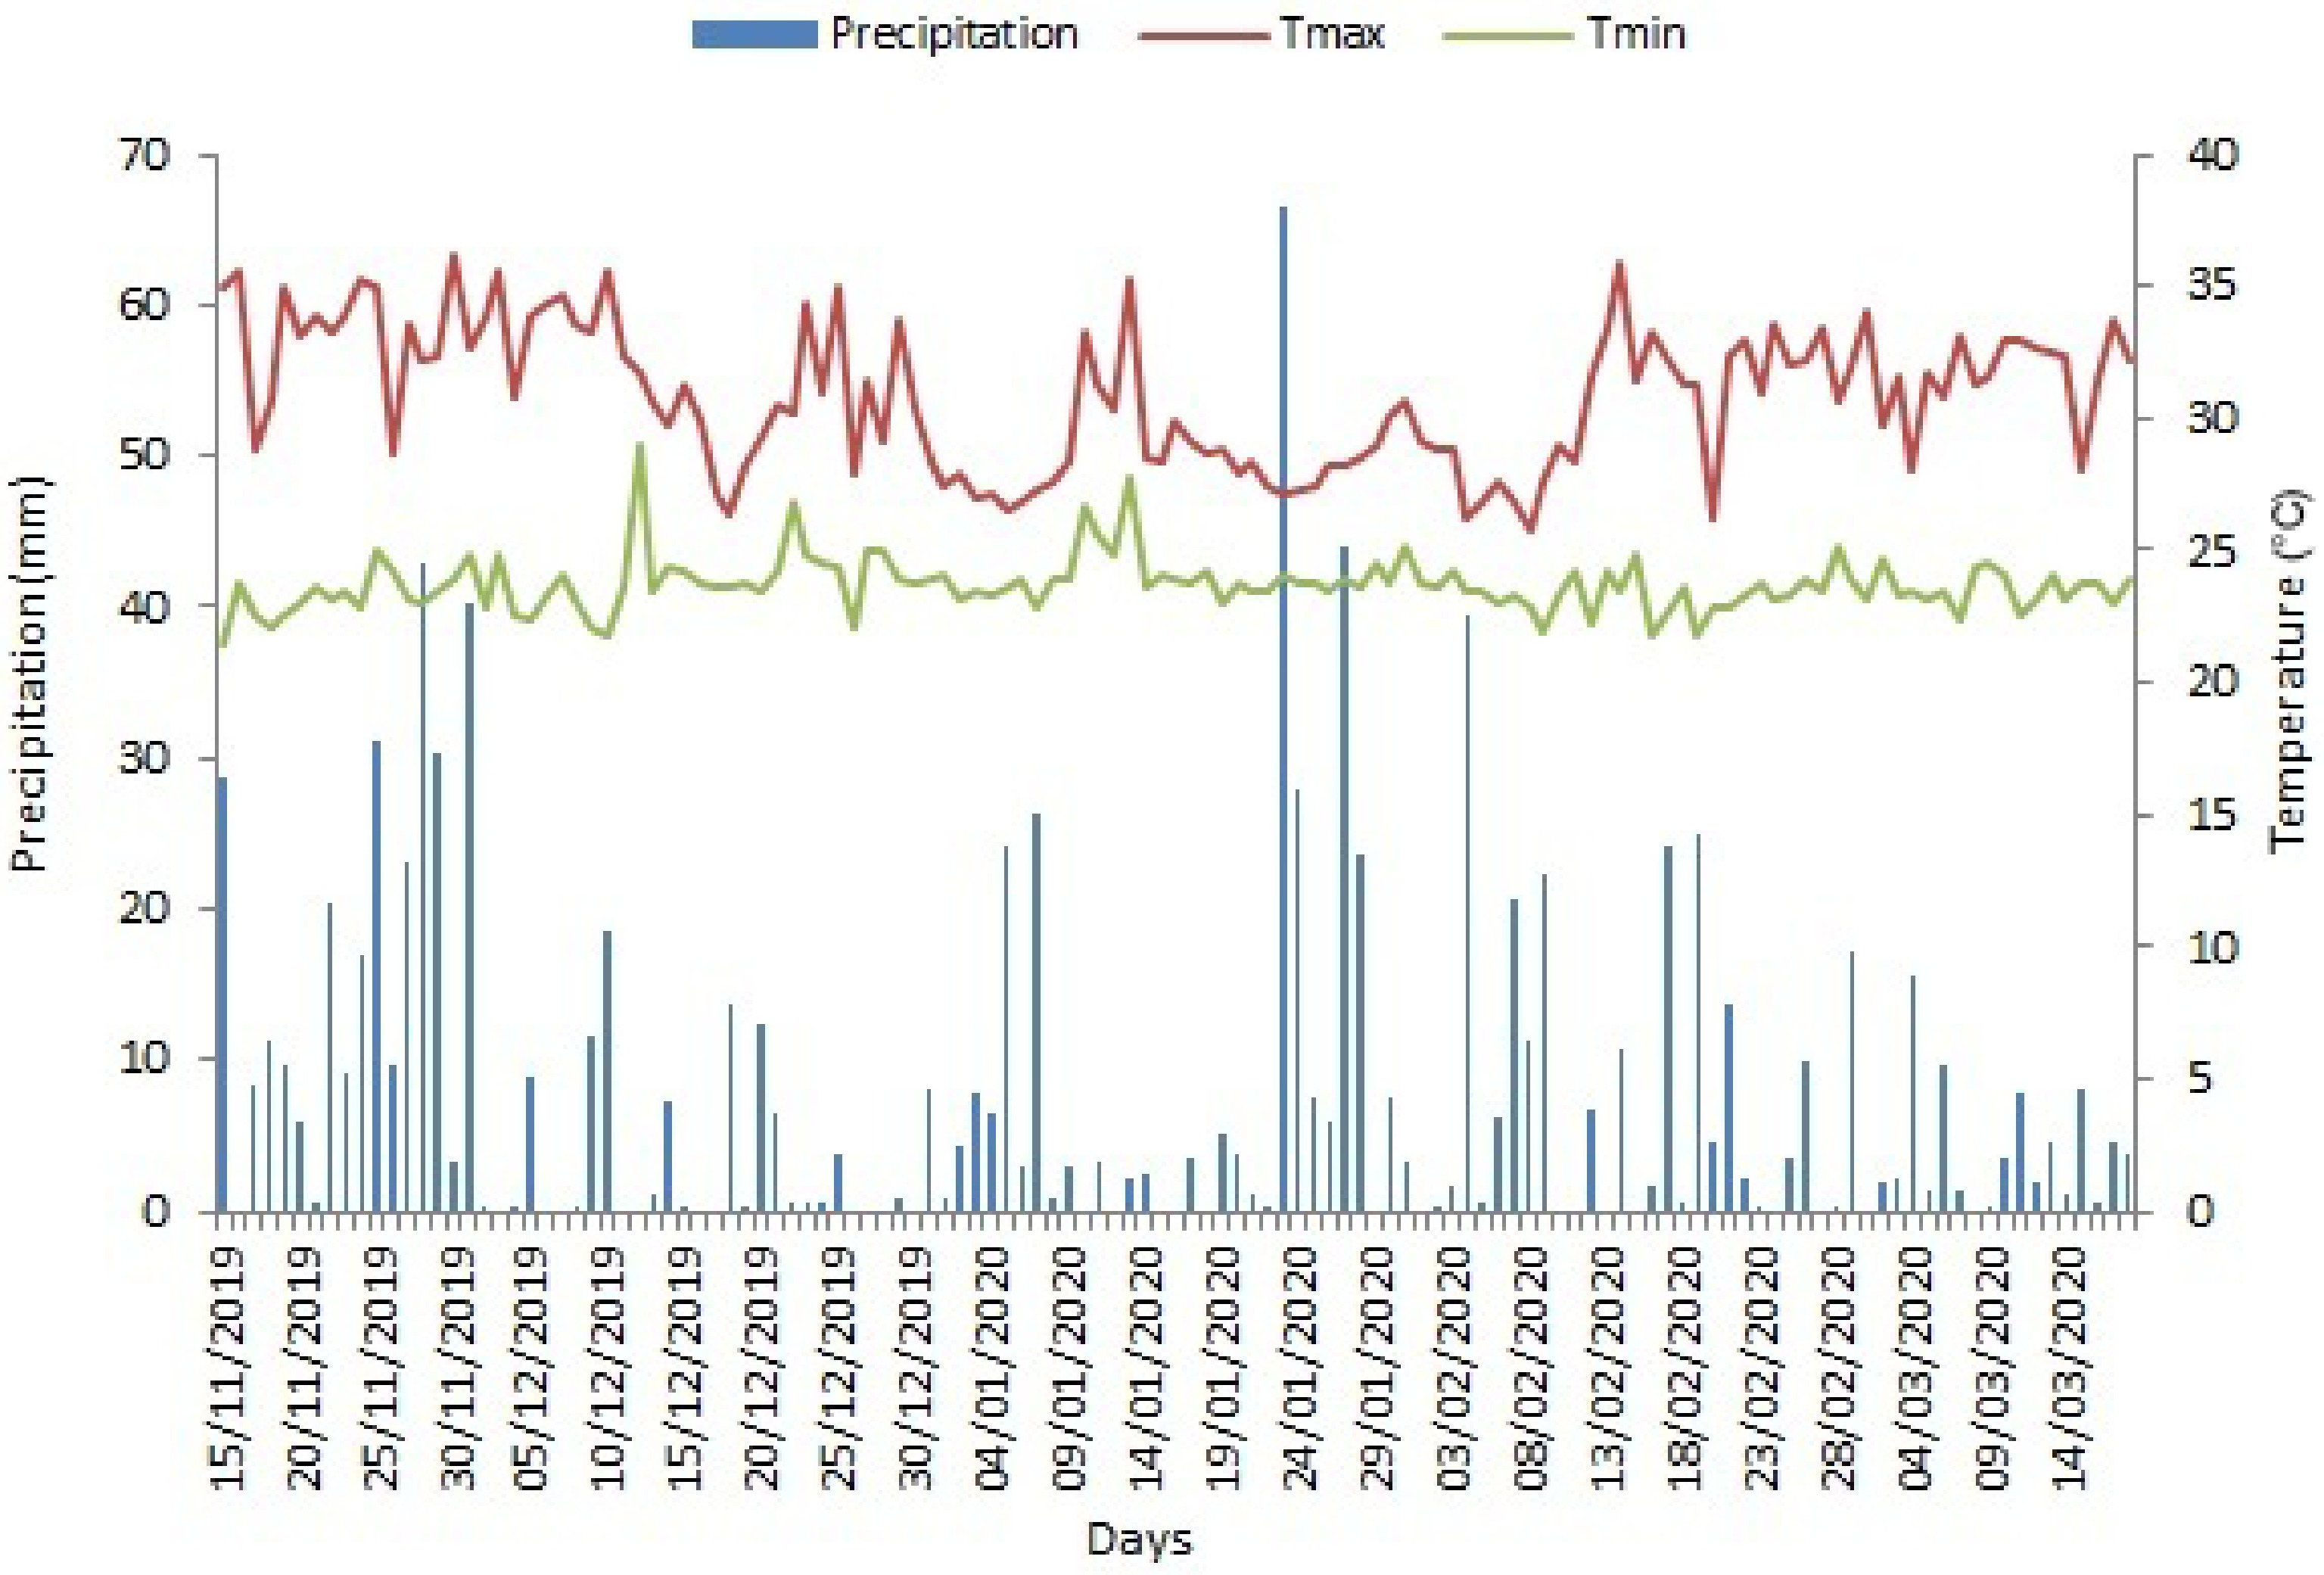
Figure 1.
Mean values of maximum (Tmax) and minimum (Tmin) temperature (°C), and precipitation (mm).
The soil of the experimental area was classified as Oxisol, with loamy sand texture, showing a pH of 4.9, available concentrations of P and K of 3.00 and 26.00 mg·dm−3, respectively; Ca and Mg concentrations of 1.5 and 0.7 cmolc·dm−3, respectively, and base saturation equal to 54.44%. The mean soil bulk density was 1.55 kg·dm−3, with sand, silt and clay percentage of 82, 13 and 5 dag·kg−1, respectively.
The cultivars M9144RR (Monsoy Ltda) and TMG1188RR (Tropical Genetic Improvement) were used, with maturation grade 9.1 and 8.8, respectively, both with determined growth habit and demanding in terms of fertility.
Installation and conduction of experiments
-
At each sowing date, the experiments were conducted in a randomized block design, consisting of five treatments and four replications. The treatments were arranged in a 2 × 5 factorial scheme, represented by the two cultivars (M9144RR and TMG1188RR) and five doses of A. brasilense (0, 100, 200, 300 and 400 mL·ha−1), applied via foliar.
At the time of sowing, the seeds were inoculated with strains of B. japonicum Semia 5079 and Semia 5080 (5.0 × 10⁹ CFU·mL−1) at a dose of 60 g/50 kg of seeds. When the plants reached the stage of growth V5 (Fifth fully developed trifoliate leaf), the foliar application of the treatments was realized with A. brasilense strains AbV5 and AbV6 (2.0 × 10⁸ CFU·mL−1) at doses 0, 100, 200, 300 and 400 mL·ha−1.
The experimental plot consisted of four 5-m-long rows at spacing of 0.50 m between rows and 1.0 m between treatments, with a density of 15 plants per linear meter.
Parameter measurements
-
To measure net photosynthesis rate [(A) µmol CO2 m2·s−1], stomatal conductance [(gs) µmol CO2 m2·s−1], transpiration [(E) mmol H2O m2·s−1)] and internal CO2 concentration [(iC) µmol CO2 m2·s−1], was used an infrared gas analyzer (IRGA; Li-COR CO2/H2O Gas analyzer 6400, Lincoln, NE, USA). Measurements were always performed in the morning, between 8:00AM and 10:00AM, on fully expanded leaves, at R1 and R5 stages.
Grain yield per hectare (GY) was calculated considering the observation area of the plot of 3 m2, eliminating the border effect.
Statistical analysis
-
The data were subjected to individual analysis of variance and, subsequently, to a joint analysis when the homogeneity of variances was verified. Means of yield were grouped by the test of Scott & Knott[14] at p ≤ 0.05. After that, the doses of A. brasilense were subjected to regression analysis, using first-, second-, and third-degree polynomial models. The statistical programs SISVAR 5.0[15] and OriginPro (2015) were used.
-
Table 1 presents the summary of the joint analysis of variance for physiological parameters and grain yield of two soybean cultivars, submitted to different doses of A. brasilense, at three different sowing dates.
Table 1. Analysis of variance related to the characteristics: net photosynthesis rate (A µmol CO2 m2·s−1), stomatal conductance (gs µmol CO2 m2·s−1), transpiration rate (E mmol H2O m2·s−1), internal CO2 concentration (iC µmol CO2 m2·s−1) and grain yield (GY kg·ha−1) of the soybean cultivars (C), M9144RR and TMG1188RR, produced on three sowing dates (S).
SV DF Mean square gs E iC A GY S 2 36.0* 2.0* 394858.7* 504.7* 2667545.8* C 1 69.0* 2.4* 6200.2* 213.9* 290306.9* D 4 12.1* 2.4* 4320.4* 27.5* 301862.8ns R (S) 9 1.2ns 0.1ns 261.4ns 1.2ns 54749.0ns S × C 2 18.6* 3.2* 27846.9* 108.2* 543547.6* S × D 8 8.7* 1.1* 1623.9* 12.4* 307563.6* C × D 4 25.4* 2.2* 702.3* 3.3* 321298.1* S × D × C 8 9.9* 0.5* 3313.1* 7.5* 507260.0* Error 81 1.0 0.2 122.1 1.2 90896.9 Total 119 CV (%) 16.87 6.59 4.33 6.25 12.69 *: Significant at p ≤ 0.05 by F test; ns: Not significant. DF: Degrees of freedom; SV: Source of variation; S: sowing dates; C: cultivars; D: doses of Azospirillum brasilense; R: Replications. Isolated effects of sowing dates (S), cultivars (C) and doses of A. brasilense (D) were observed in all evaluated physiological parameters and grain yield. In addition, there was interaction between all sources of variation studied.
For the double interaction D × S, the significant effect showed that environmental variations influenced the plant/bacteria system, which, in turn, reflected in gas exchange. Similarly, the C × D interaction shows that different cultivars present different behavior in response to A. brasilense, as already observed by Hungria[16].
In addition, the triple interaction S × C × D demonstrated that, under some conditions, A. brasilense exerts a direct influence on the photosynthetic apparatus and benefits plants in stress situations, resulting from environmental variations on different sowing dates.
Stomatal conductance
-
Table 2 presents the gs averages of two soybean cultivars, cultivated on three sowing dates and different doses of A. brasilense applied via foliar application.
Table 2. Means of S × C × D interaction for stomatal conductance (gs) of two soybean cultivars, in three sowing dates and different doses of A. brasilense.
Sowing dates Cultivars gs (µmol CO2 m2·s−1) Dose (mL·ha−1) 0 100 200 300 400 S1 M9144RR 1.70Ab 1.65Aa 1.85Aa 3.1Aa 2.45Aa TMG132RR 1.25Ba 1.50Ba 1.50Aa 1.55Bb 1.95Bb S2 M9144RR 1.40Ab 1.25Ab 1.15Ab 1.55Bb 3.15Aa TMG132RR 3.70Aa 4.80Aa 1.80Aa 2.17Aa 2.95Aa S3 M9144RR 1.40Aa 1.35Aa 1.55Aa 1.35Ba 1.90Ba TMG132RR 1.45Ba 1.45Ba 1.60Aa 1.70Ba 1.60Ba Means between seasons, within the same cultivar, followed by the same capital letter in the column do not differ by the Scott Knott test at 5% probability. Means between cultivars, within the same season, followed by the same lowercase letter in the column do not differ by the Scott Knott test at 5% probability. * S1: sowing date 1; S2: sowing date 2; S3: sowing date 3. The study between sowing times showed that, for the M9144RR cultivar, the highest gs averages were observed at S1 and S2, at the highest applied dose, while in the TMG1188RR cultivar, the highest average was observed only at S2 and at the lowest applied dose (Table 2).
Among the cultivars, within each sowing date, the materials behaved differently, demonstrating different responses to the imposed environmental conditions. With regards to doses, the study showed that there was only adjustment in the second sowing date, for both cultivars (Fig. 2).
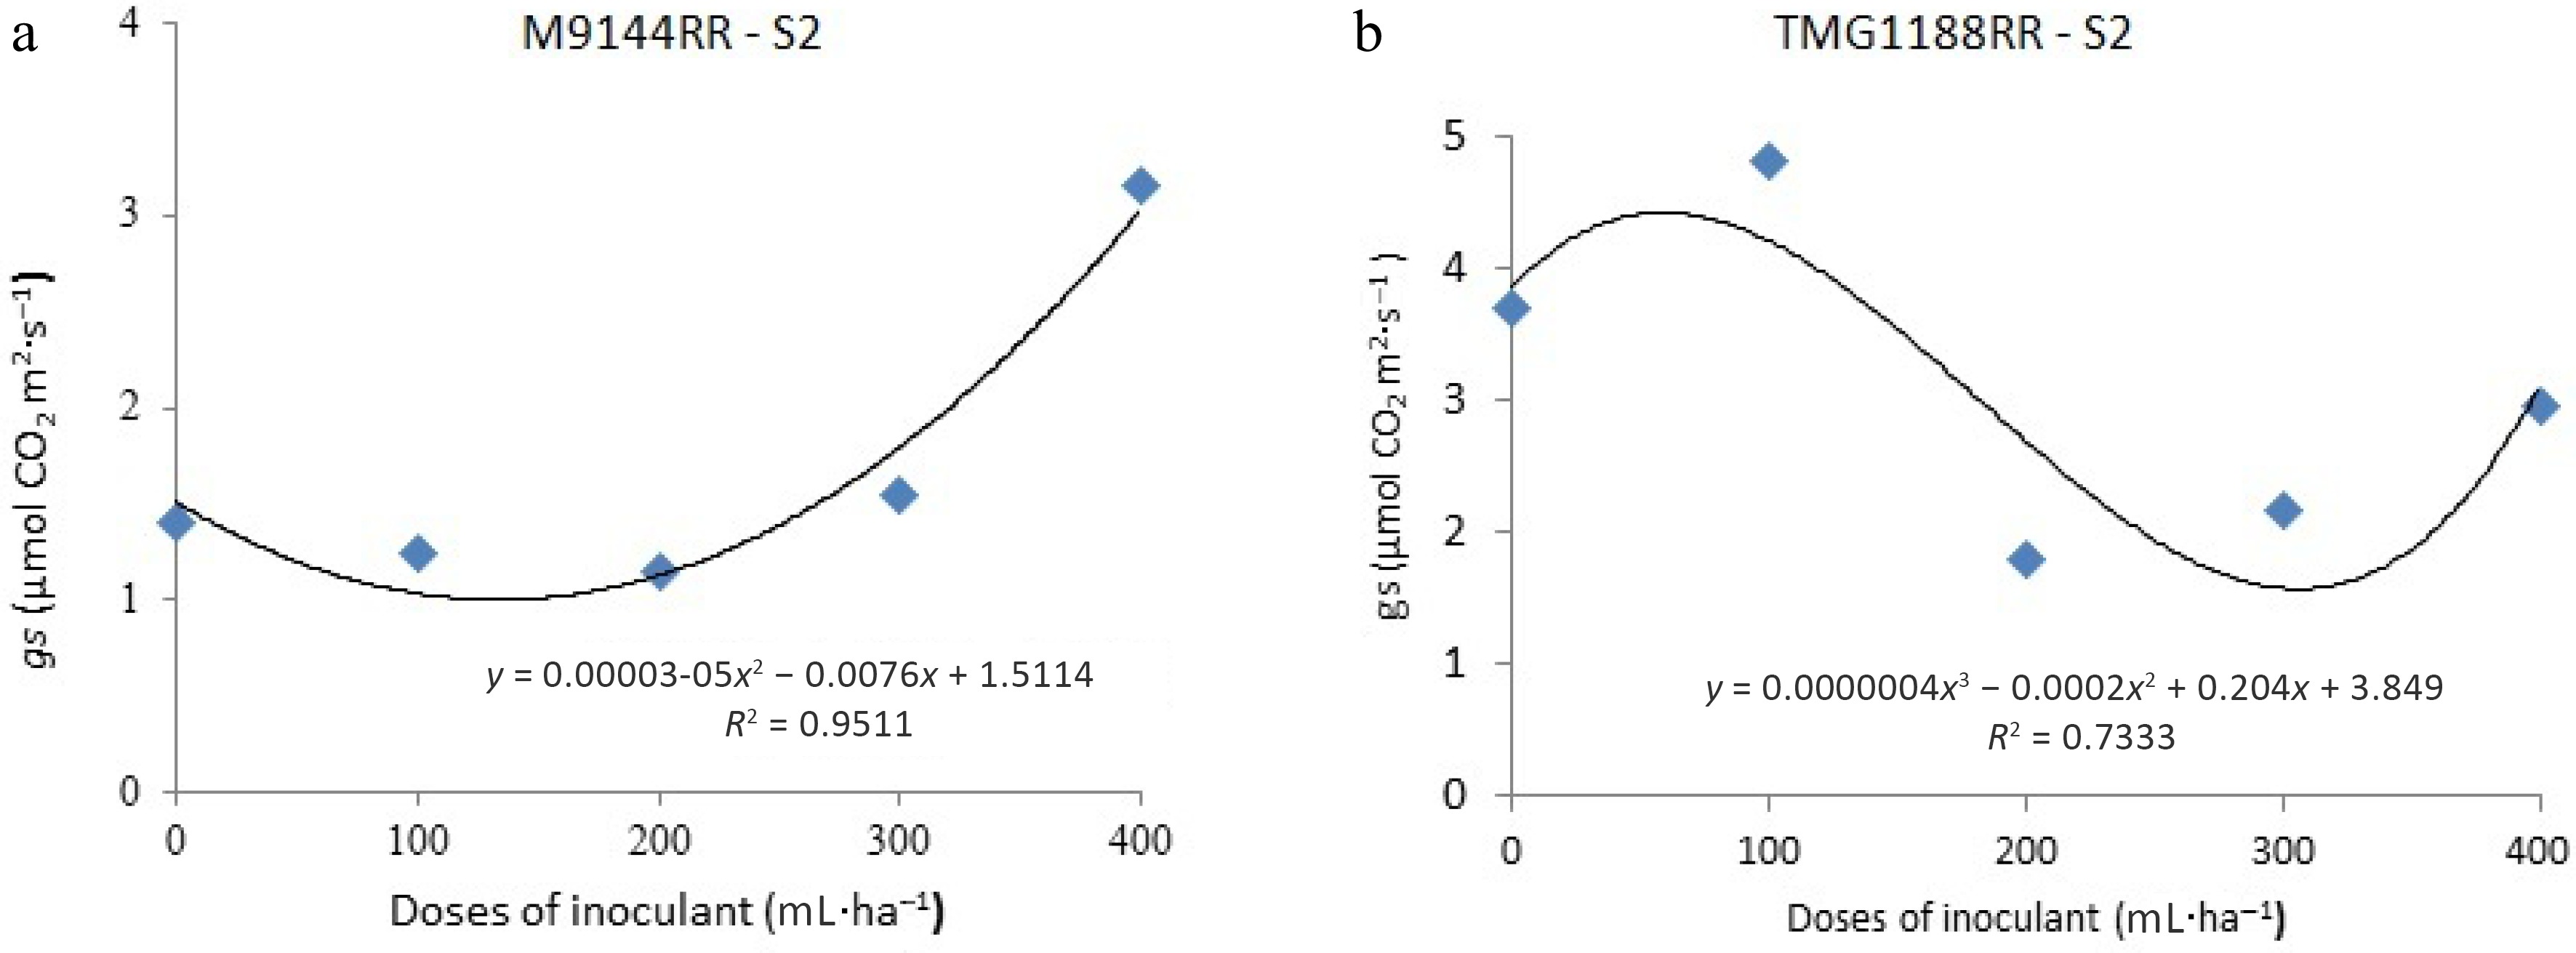
Figure 2.
Stomatal conductance (gs) as a function of foliar application of different doses of A. brasilense in soybean at vegetative stage V5, on three sowing dates.
For the M9144RR cultivar, the quadratic adjustment showed a higher gs rate (3.35 µmol CO2 m2·s−1) at the dose of 400 mL·ha−1 (Fig. 2a). In this case, the application of A. brasilense contributed to the increase in stomatal conductance.
Differently, for the TMG1188RR cultivar, the cubic adjustment showed that the highest gs (4.89 µmol CO2 m2·s−1) occurred at the lowest applied dose (120.52 mL·ha−1), followed by the control (Fig. 2b). The difference observed between the cultivars in relation to the gs possibly occurred due to the plant-bacterium interaction. According to Matsumura at al.[17], inoculation response may vary according to plant genotype, bacterial strain and environmental conditions, which may be related to the genetic traits intrinsic to each soybean genotype.
The literature has reported effects on the interaction of A. brasilense in plants under conditions of water restriction and high temperatures[11], which could partly explain the increase in gs in less favorable environmental conditions for cultivar M9144RR, like those observed in E2 (Fig. 1).
Marques et al.[18] also reported an increase in gs in corn plants inoculated with A. brasilense and subjected to water stress. According to the authors, the increase in gs in inoculated plants may be related to the improvement in water use efficiency, which, in this case, may have been mediated by the bacteria. Furthermore, Tonelli et al.[19] reported that genetic characteristics and climatic conditions are also responsible for different responses between cultivars and bacteria.
On the other hand, it is necessary to consider that the increase in gs also entails a higher cost of water loss via transpiration[20]. Furthermore, Cohen et al.[21] found a reduction in stomatal conductance in A. thaliana plants under water deficit and inoculated with A. brasilense. According to the authors, this process could be related to the greater presence of ABA in the plant-bacteria system, which would benefit the plants under temporary drought conditions, as may have occurred for the cultivar TMG1188RR.
Transpiration (E)
-
Table 3 presents the transpiration averages of two soybean cultivars, on three sowing dates and different doses of A. brasilense applied via foliar application.
Table 3. Means of S × C × D interaction for transpiration (E) of two soybean cultivars, on three sowing dates and different doses of A. brasilense.
Sowing dates Cultivar E (mmol H2O m−2·s−1) Dose mL·ha−1 0 100 200 300 400 S1 M9144RR 7.60Aa 7.35Aa 7.00Aa 7.10Aa 7.30Aa TMG132RR 7.15Aa 6.95Ba 6.90Ba 6.00Aa 7.00Aa S2 M9144RR 7.00Aa 6.25Bb 6.80Aa 7.60Aa 7.50Aa TMG132RR 7.25Aa 7.30Aa 6.65Ba 6.80Aa 7.25Aa S3 M9144RR 7.25Aa 6.95Ba 7.05Aa 7.10Aa 7.50Aa TMG132RR 7.00Aa 7.75Aa 7.25Aa 6.90Aa 7.55Aa Means between seasons, within the same cultivar, followed by the same capital letter in the column do not differ by the Scott Knott test at 5% probability. Means between cultivars, within the same season, followed by the same lowercase letter in the column do not differ by the Scott Knott test at 5% probability. * S1: sowing date 1; S2: sowing date 2; S3: sowing date 3. In the study between sowing dates, the cultivar M9144RR showed a distinct behavior at the lowest applied dose, in which the lowest E value was observed at S2 and S3. On the other hand, the TMG132RR cultivar had the lowest E value observed in S1 (Table 3).
Under conditions of water stress and high temperatures, such as those recorded in S2 (Fig. 1), plants may occasionally increase transpiration to reduce internal temperature. Armanhi et al.[9] found that inoculation with root-colonizing microorganisms reduced leaf temperature by up to 4 °C in maize plants subjected to thermal and water stress, which may also have occurred in the present study.
In this case, there would be a transient increase in stomatal conductance, mediated by A. brasilense and, consequently, an increase in transpiration.
Although the C × S × D interaction was significant for all evaluated parameters, there was no dose adjustment for E, indicating that there is no functional relationship between doses for this characteristic.
Internal CO2 concentration (iC)
-
Table 4 presents the iC averages of two soybean cultivars, on three sowing dates and different doses of A. brasilense applied via foliar application.
Table 4. Means of S × C × D interaction for internal CO2 concentration (iC) of two soybean cultivars, on three sowing dates and different doses of A. brasilense.
Sowing dates Cultivars iC (μmol CO2 m−2·s−1) Dose mL·ha−1 0 100 200 300 400 S1 M9144RR 331.00Aa 338.50Aa 329.00Aa 343.00Aa 347.00Aa TMG132RR 332.50Aa 344.00Aa 327.50Aa 336.50Aa 328.50Aa S2 M9144RR 202.50Ba 198.50Ba 193.00Ba 198.50Bb 195.00Bb TMG132RR 202.50Ba 201.50Ba 219.00Ba 234.50Ba 247.50Ba S3 M9144RR 211.50Ba 222.50Ba 234.00Ba 247.00Ba 305.00Aa TMG132RR 190.50Ba 196.00Ba 194.00Ba 192.00Ba 196.00Bb Means between seasons, within the same cultivar, followed by the same capital letter in the column do not differ by the Scott Knott test at 5% probability. Means between cultivars, within the same season, followed by the same lowercase letter in the column do not differ by the Scott Knott test at 5% probability. * S1: sowing date 1; S2: sowing date 2; S3: sowing date 3. Between the sowing dates, the two cultivars registered higher iC averages in S1, season that registered better environmental conditions (Fig. 1). Among the cultivars, there was a distinct response at S2 and S3, at the highest applied dose.
Regarding the doses, for the M9144RR cultivar, the adjustment occurred through a cubic equation, only in S3, responding with a greater accumulation of iC (328.65 μmol CO2 m−2·s−1), at the highest applied dose (400 mL·ha−1) (Fig. 3a).
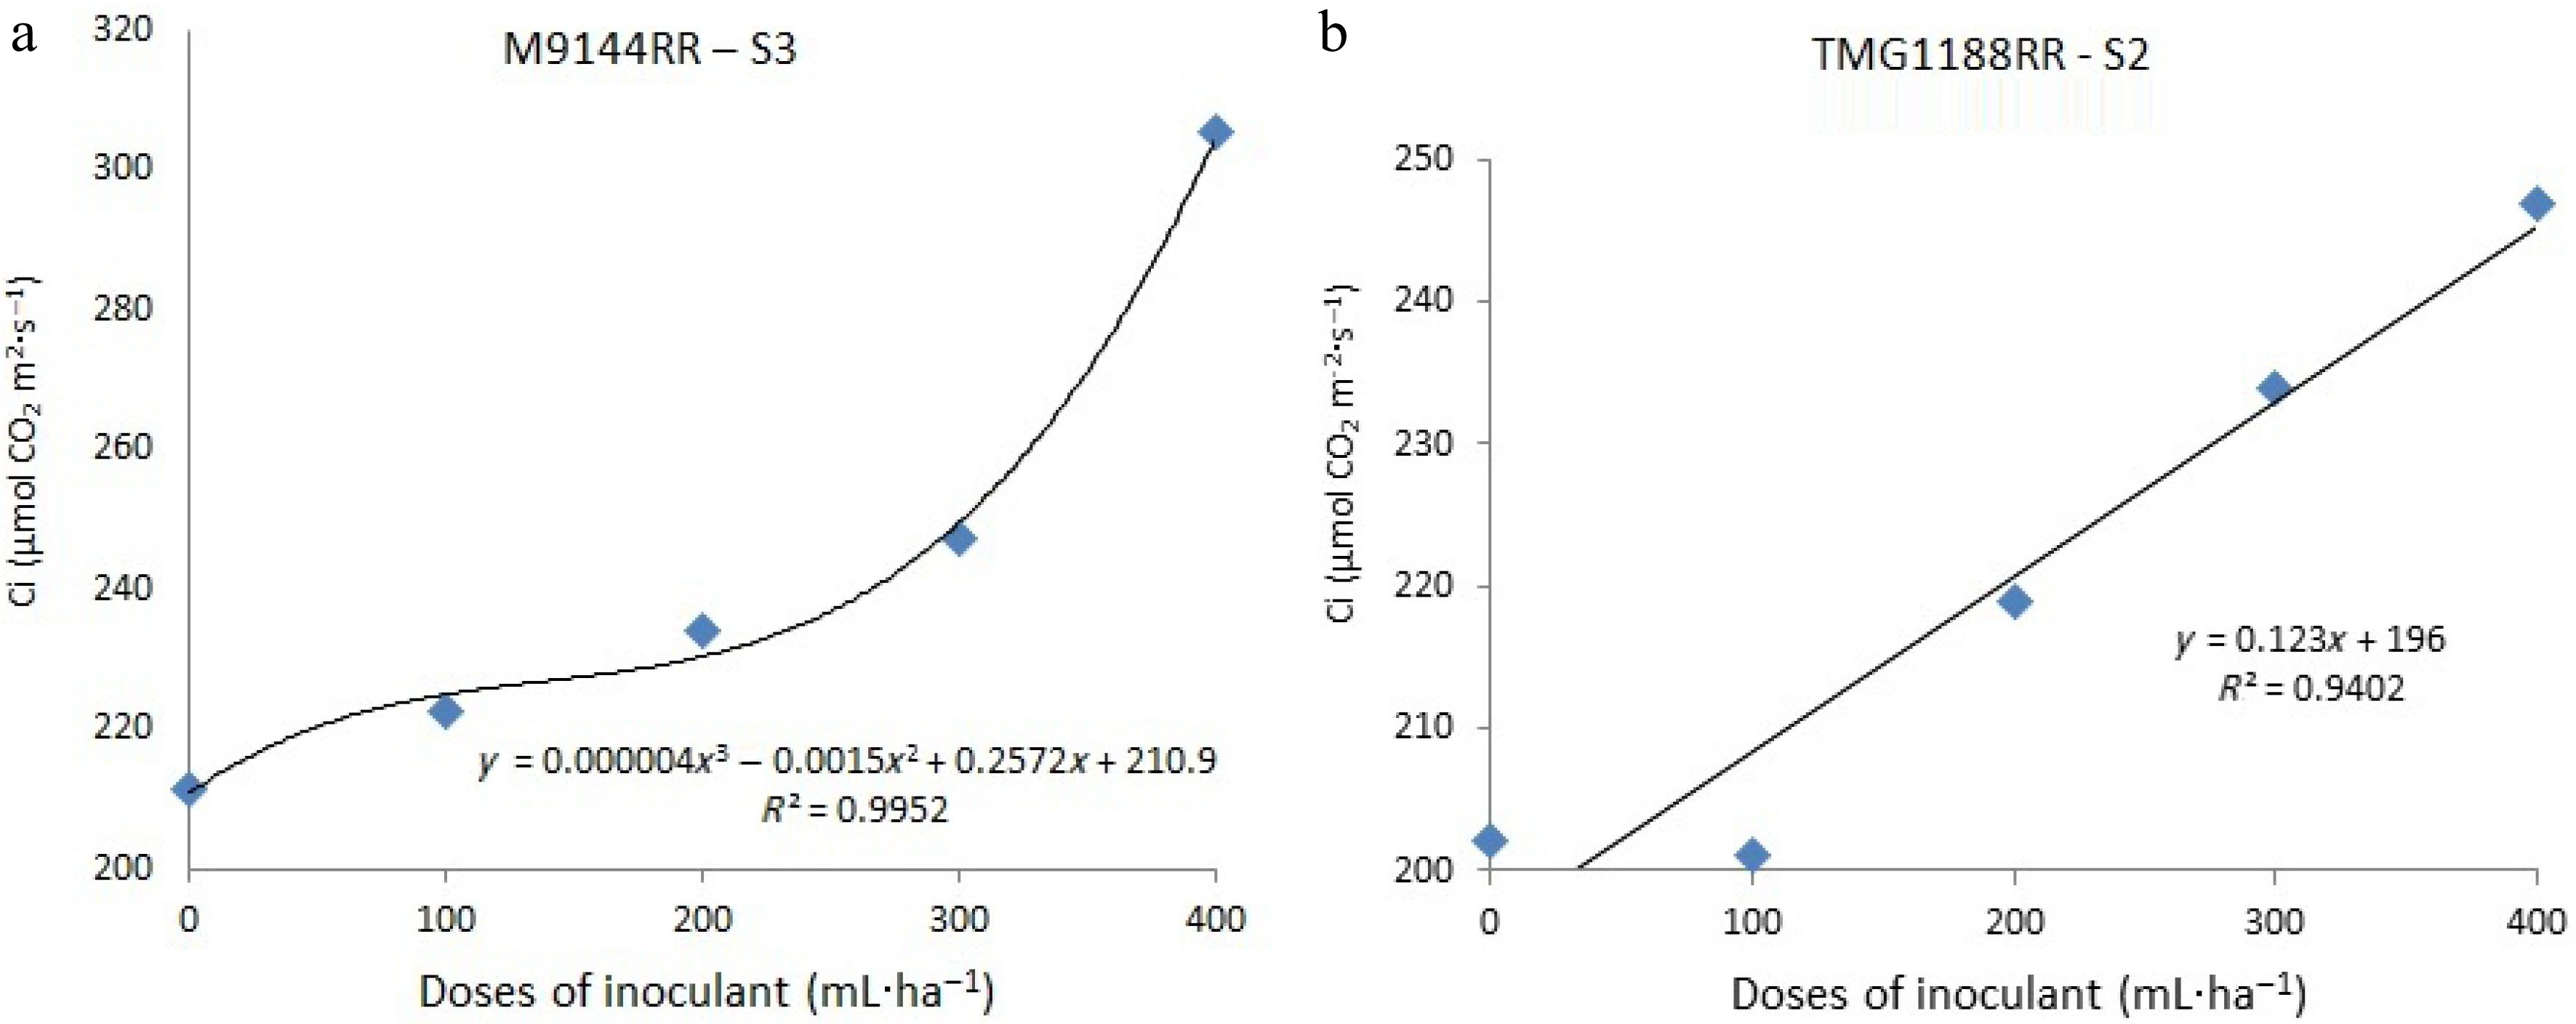
Figure 3.
Intercellular CO2 concentration as a function of foliar application of different doses of A. brasilense in soybean phenology stage V5, on three sowing dates.
Differently, for the cultivar TMG1188RR, the adjustment occurred only in S2, through a linear equation, with the highest dose providing accumulation of 247.26 mmol CO2 m−2·s−1 of iC. In both cultivars, the dose of 400 mL·ha−1 of A. brasilense favored the highest accumulation of iC. In this case of the M9144RR cultivar, this increase was accompanied by an increase in gs (Fig. 2a) and E (Table 3), which was expected under these conditions.
However, in the TMG1188RR cultivar, the linear increase was accompanied by a reduction in gs (Fig. 2b). Wei et al.[22]observed that in situations of low water availability, an increase in the internal carbon concentration in the substomatal chamber may occur, partially explaining the results obtained for this cultivar.
Net photosynthesis rate (A)
-
Table 5 presents the A averages of two soybean cultivars, in three sowing dates and different doses of A. brasilense applied via foliar application.
Table 5. Means of S × C × D interaction for net photosynthesis rate (A) of two soybean cultivars, on three sowing dates and different doses of A. brasilense.
Sowing dates Cultivars A (µmol CO2 m−2·s−1) Dose mL ha−1 0 100 200 300 400 S1 M9144RR 20.35Aa 21.05Aa 20.10Aa 21.70Aa 23.10Aa TMG132RR 18.90Ab 19.00Aa 17.75Ab 20.85Aa 23.70Aa S2 M9144RR 16.0Ba 15.60Ca 16.25Ca 17.05Ba 17.20Cb TMG132RR 16.55Ba 16.95Ba 15.65Ba 15.80Bb 21.60Ba S3 M9144RR 17.15Ba 18.75Ba 18.55Ba 17.40Ba 20.00Ba TMG132RR 14.30Cb 14.65Cb 13.50Cb 14.00Cb 12.75Cb Means between seasons, within the same cultivar, followed by the same capital letter in the column do not differ by the Scott Knott test at 5% probability. Means between cultivars, within the same season, followed by the same lowercase letter in the column do not differ by the Scott Knott test at 5% probability. * S1: sowing date 1; S2: sowing date 2; S3: sowing date 3. In general, between the sowing dates, the two cultivars had the highest rates of A in S1, as well as in iC (Table 4). However, they differed among themselves within each season, demonstrating their different behavior to the effects of inoculation in face of environmental variations resulting from sowing dates.
Regarding the doses, for the cultivar M9144RR, the adjustment occurred only in S2, through a cubic equation (Fig. 4a), with an A of 17.32 mmol CO2 m−2·s−1, at a dose of 400 mL·ha−1, which was also observed for gs (Fig. 2a) and iC (Fig. 3a).
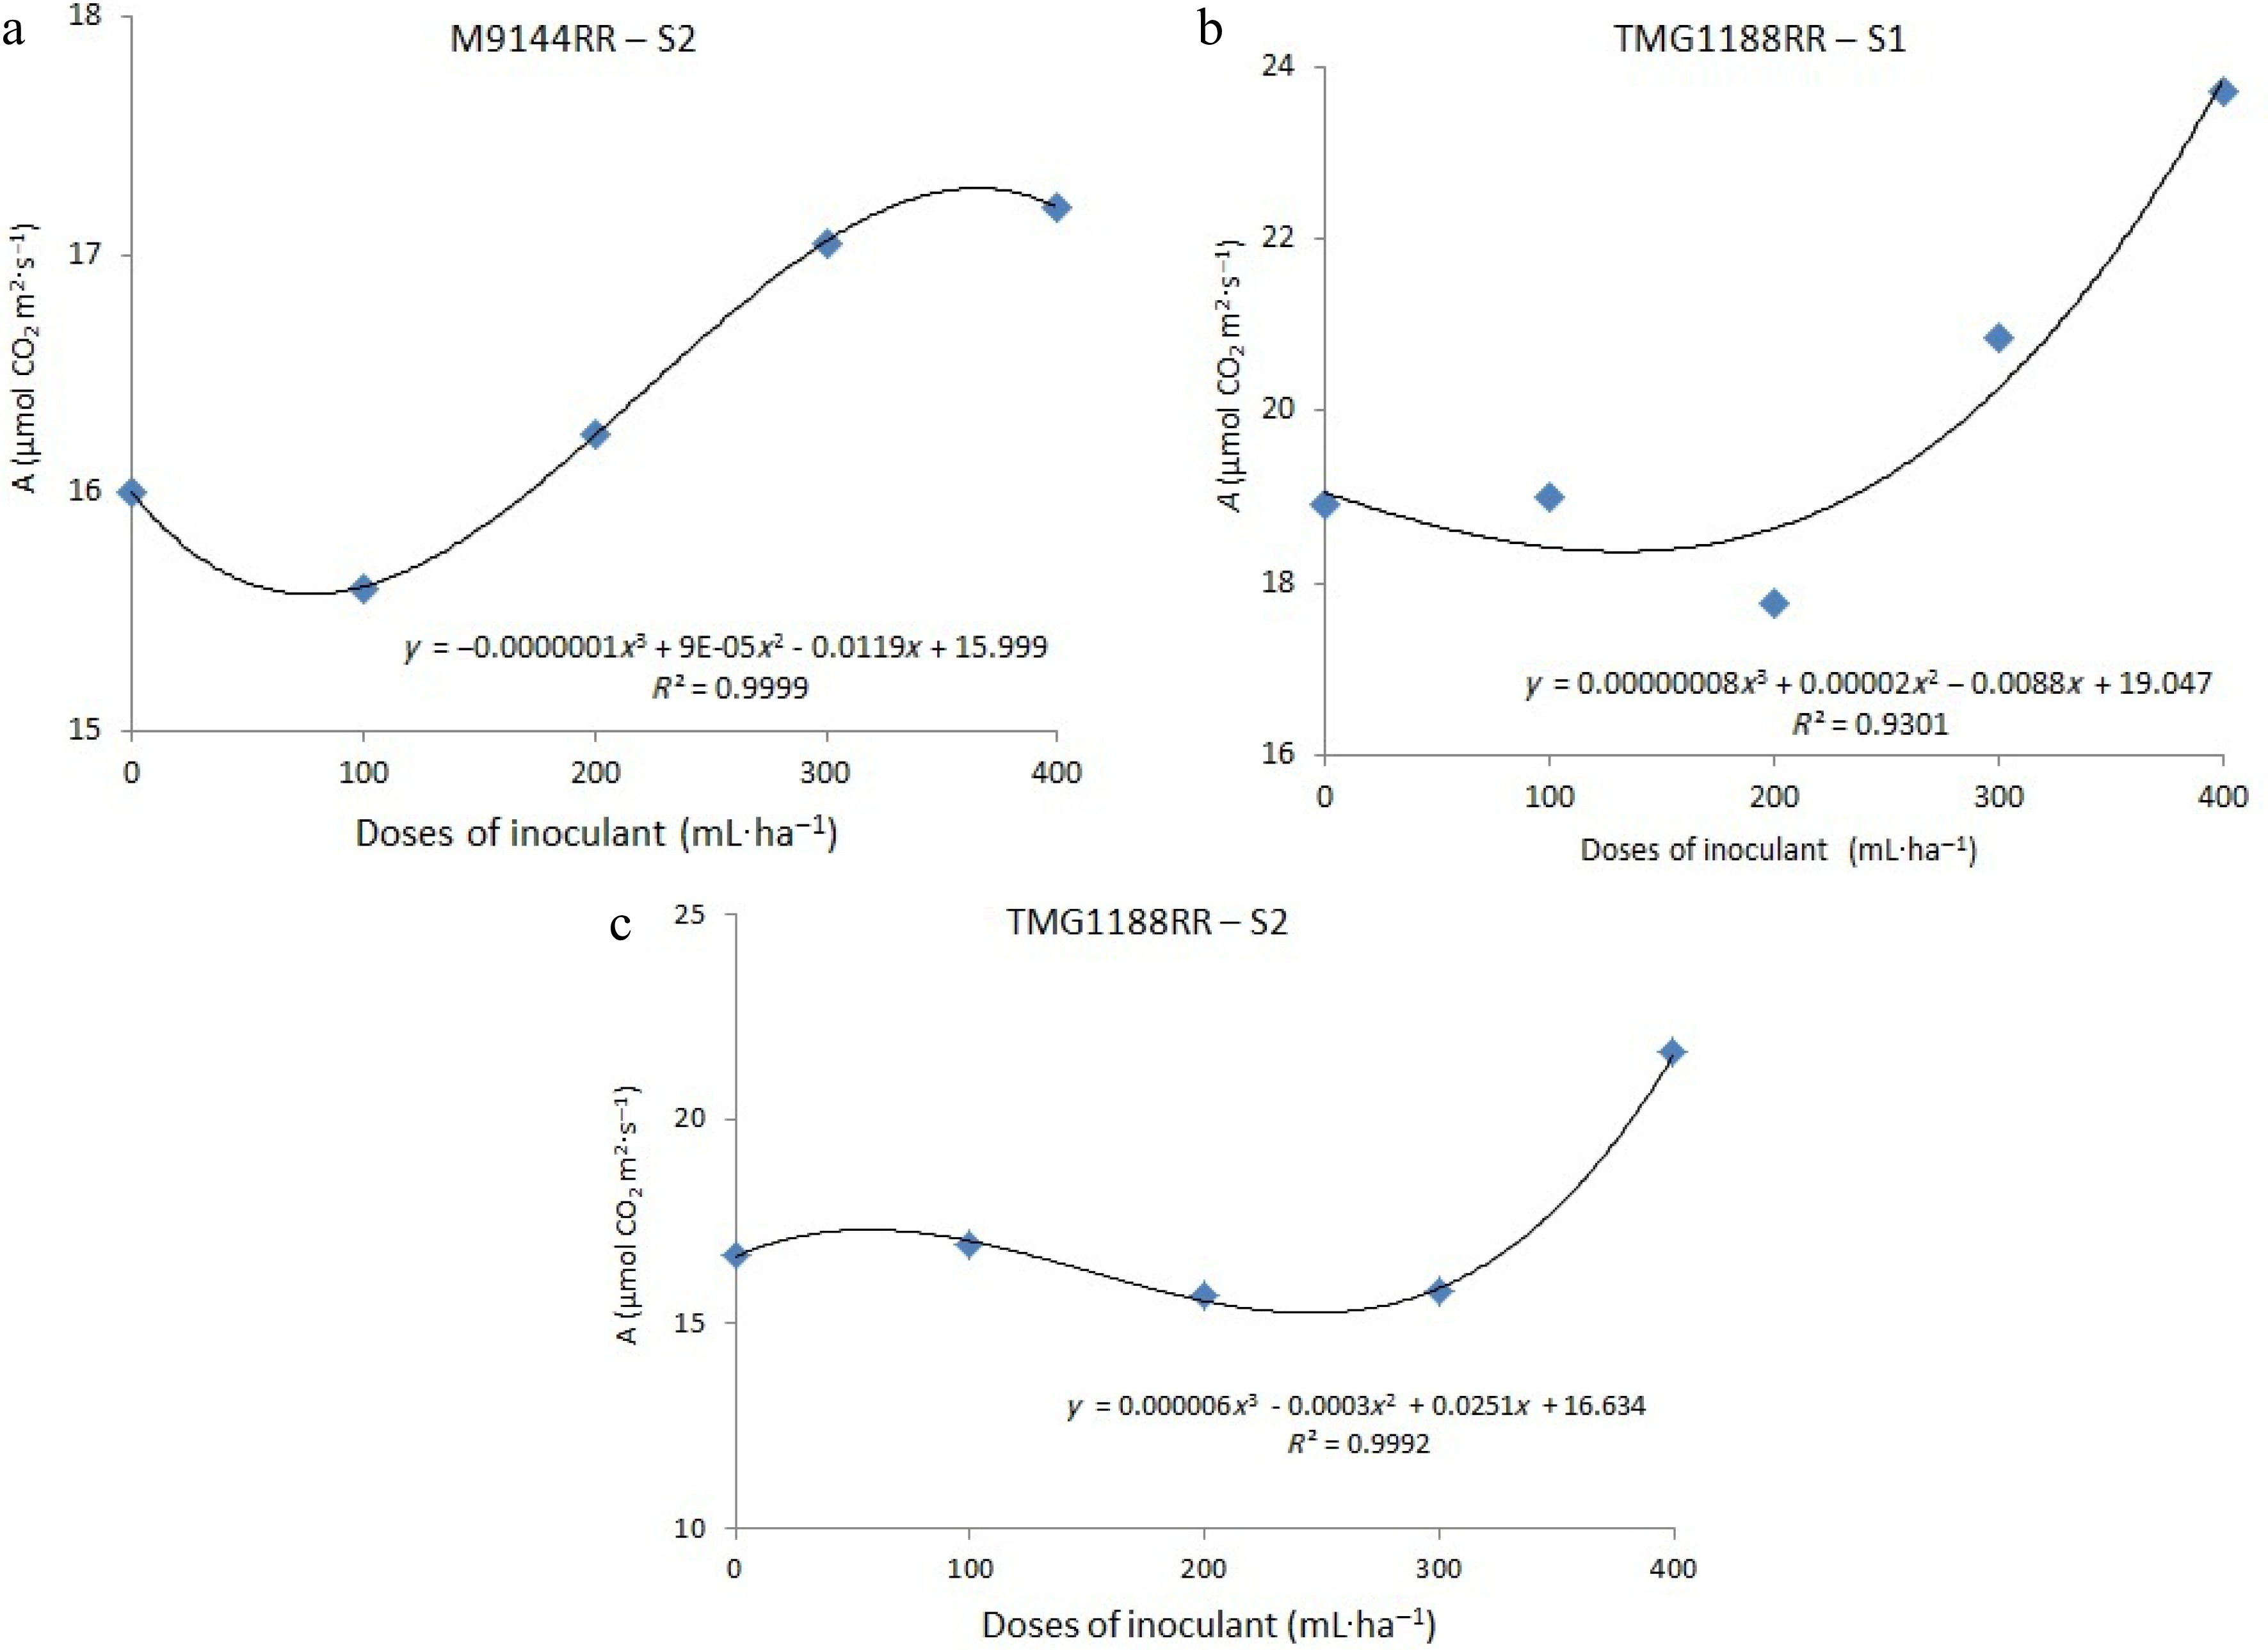
Figure 4.
Net photosynthesis rate as a function of foliar application of different doses of A. brasilense in soybean at phenological stage V5, on three sowing dates.
For the cultivar TMG1188RR, equation adjustment was obtained on the first and second sowing dates, also by means of cubic equation. In both seasons, the highest applied dose of A. brasilense provided a photosynthetic rate of 23.00 CO2 m−2·s−1 and 21.39 CO2 m−2·s−1 (Fig. 4b & c), respectively. On the other hand, in this same condition there was a reduction in gs (Fig. 2b) and an increase in iC (Fig. 3b).
The net photosynthetic rate can be considered as a product of gas exchange, which begins with stomatal conductance and is dependent on factors such as water availability, light and temperature. However, A can be compromised, not only by reducing gs, but also by reducing the rate of electron transport and photophosphorylation, both processes in the photochemical step of photosynthesis[23].
Costa & Marenco[24] found a low correlation between A and gs, explaining that both photosynthesis and stomatal conductance are plant parameters that respond to a set of factors that interact in a coordinated but highly complex manner.
Therefore, for cultivar TMG1188RR, what would possibly explain the increase in A, even with a reduction in gs, could be an additional external factor. Thus, the inoculation seems to have protected the photosynthetic apparatus, guaranteeing chain reactions, even with the plant under unfavorable environmental conditions.
Grain yield (GY)
-
When comparing the averages (Table 6), it was possible to observe that, between the sowing dates, the cultivar M9144RR obtained the highest average productivity value in S2, at the highest dose applied, differing from the control.
Table 6. Means of S × C × D interaction for grain yield (GY) of two soybean cultivars, on three sowing dates and different doses of A. brasilense.
Sowing dates Cultivars GY (kg·ha−1) Doses (mL·ha−1) 0 100 200 300 400 S1 M9144RR 2,512 Aa 2,438 Aa 2,578 Bb 2,737 Ab 2,529 Bb TMG1188RR 2,471 Ba 2,472 Ba 3,235 Aa 3,239 Aa 3,210 Aa S2 M9144RR 2,792 Aa 2,658 Ab 3,212Aa 2,844 Aa 3,441 Aa TMG1188RR 3,022 Aa 3,450 Aa 3,094 Aa 2,331 Bb 2,644 Bb S3 M9144RR 1,106 Ba 1,508 Ba 1,265 Cb 1,251 Bb 1,730 Ca TMG1188RR 1,553 Ca 1,506 Ca 1,609 Ba 1,562 Ca 1,311 Cb Means between seasons, within the same cultivar, followed by the same capital letter in the column do not differ by the Scott Knott test at 5% probability. Means between cultivars, within the same season, followed by the same lowercase letter in the column do not differ by the Scott Knott test at 5% probability. * S1: sowing date 1; S2: sowing date 2; S3: sowing date 3. Considering that S2 presented unfavorable environmental conditions (Fig. 2), this difference may be related to inoculation responses in plants under water stress, as observed by Cohen et al.[25] in corn plants grown under similar conditions. In addition, in S2, the same cultivar showed better response to gs (Fig. 2a) and A (Fig. 4a), at the highest applied dose.
In cultivar TMG1188RR, the highest yield occurred at the lowest dose applied, also in S2 (Table 6), in addition to an increase in gs (Fig. 2b), indicating an antagonistic response to that observed for cultivar M9144RR. In this case, it can be considered that the cultivar TMG1188RR was more sensitive to the effects of inoculation within the same sowing date. However, at the highest applied dose, productivity decreased.
It is important to note that, in the control treatment, there was no mean difference between the cultivars in each season (Table 6), that is, without the presence of A. brasilense, the behavior of the materials in the face of environmental variations was similar for productivity. However, after the control, this behavior changed, indicating that the response to inoculation really is multifactorial and dependent on factors such as the type of cultivar and the environmental conditions to which they are subjected.
For the M9144RR cultivar, dose adjustment occurred only in S3, using a linear equation (Fig. 5a), with the best response at the maximum dose applied (1,725.45 kg·ha−1). However, the effects of the bacteria were also observed in S2. The low productivity observed in S3 may have occurred due to multiple environmental factors. It is important to note that the averages observed in gs and A were also low in S3, especially for the cultivar TMG1188RR, which showed the lowest productivity. Furthermore, the low rainfall at the beginning of sowing, before inoculation with A. brasilense, may have been an additional factor that contributed to the low yield in this condition.
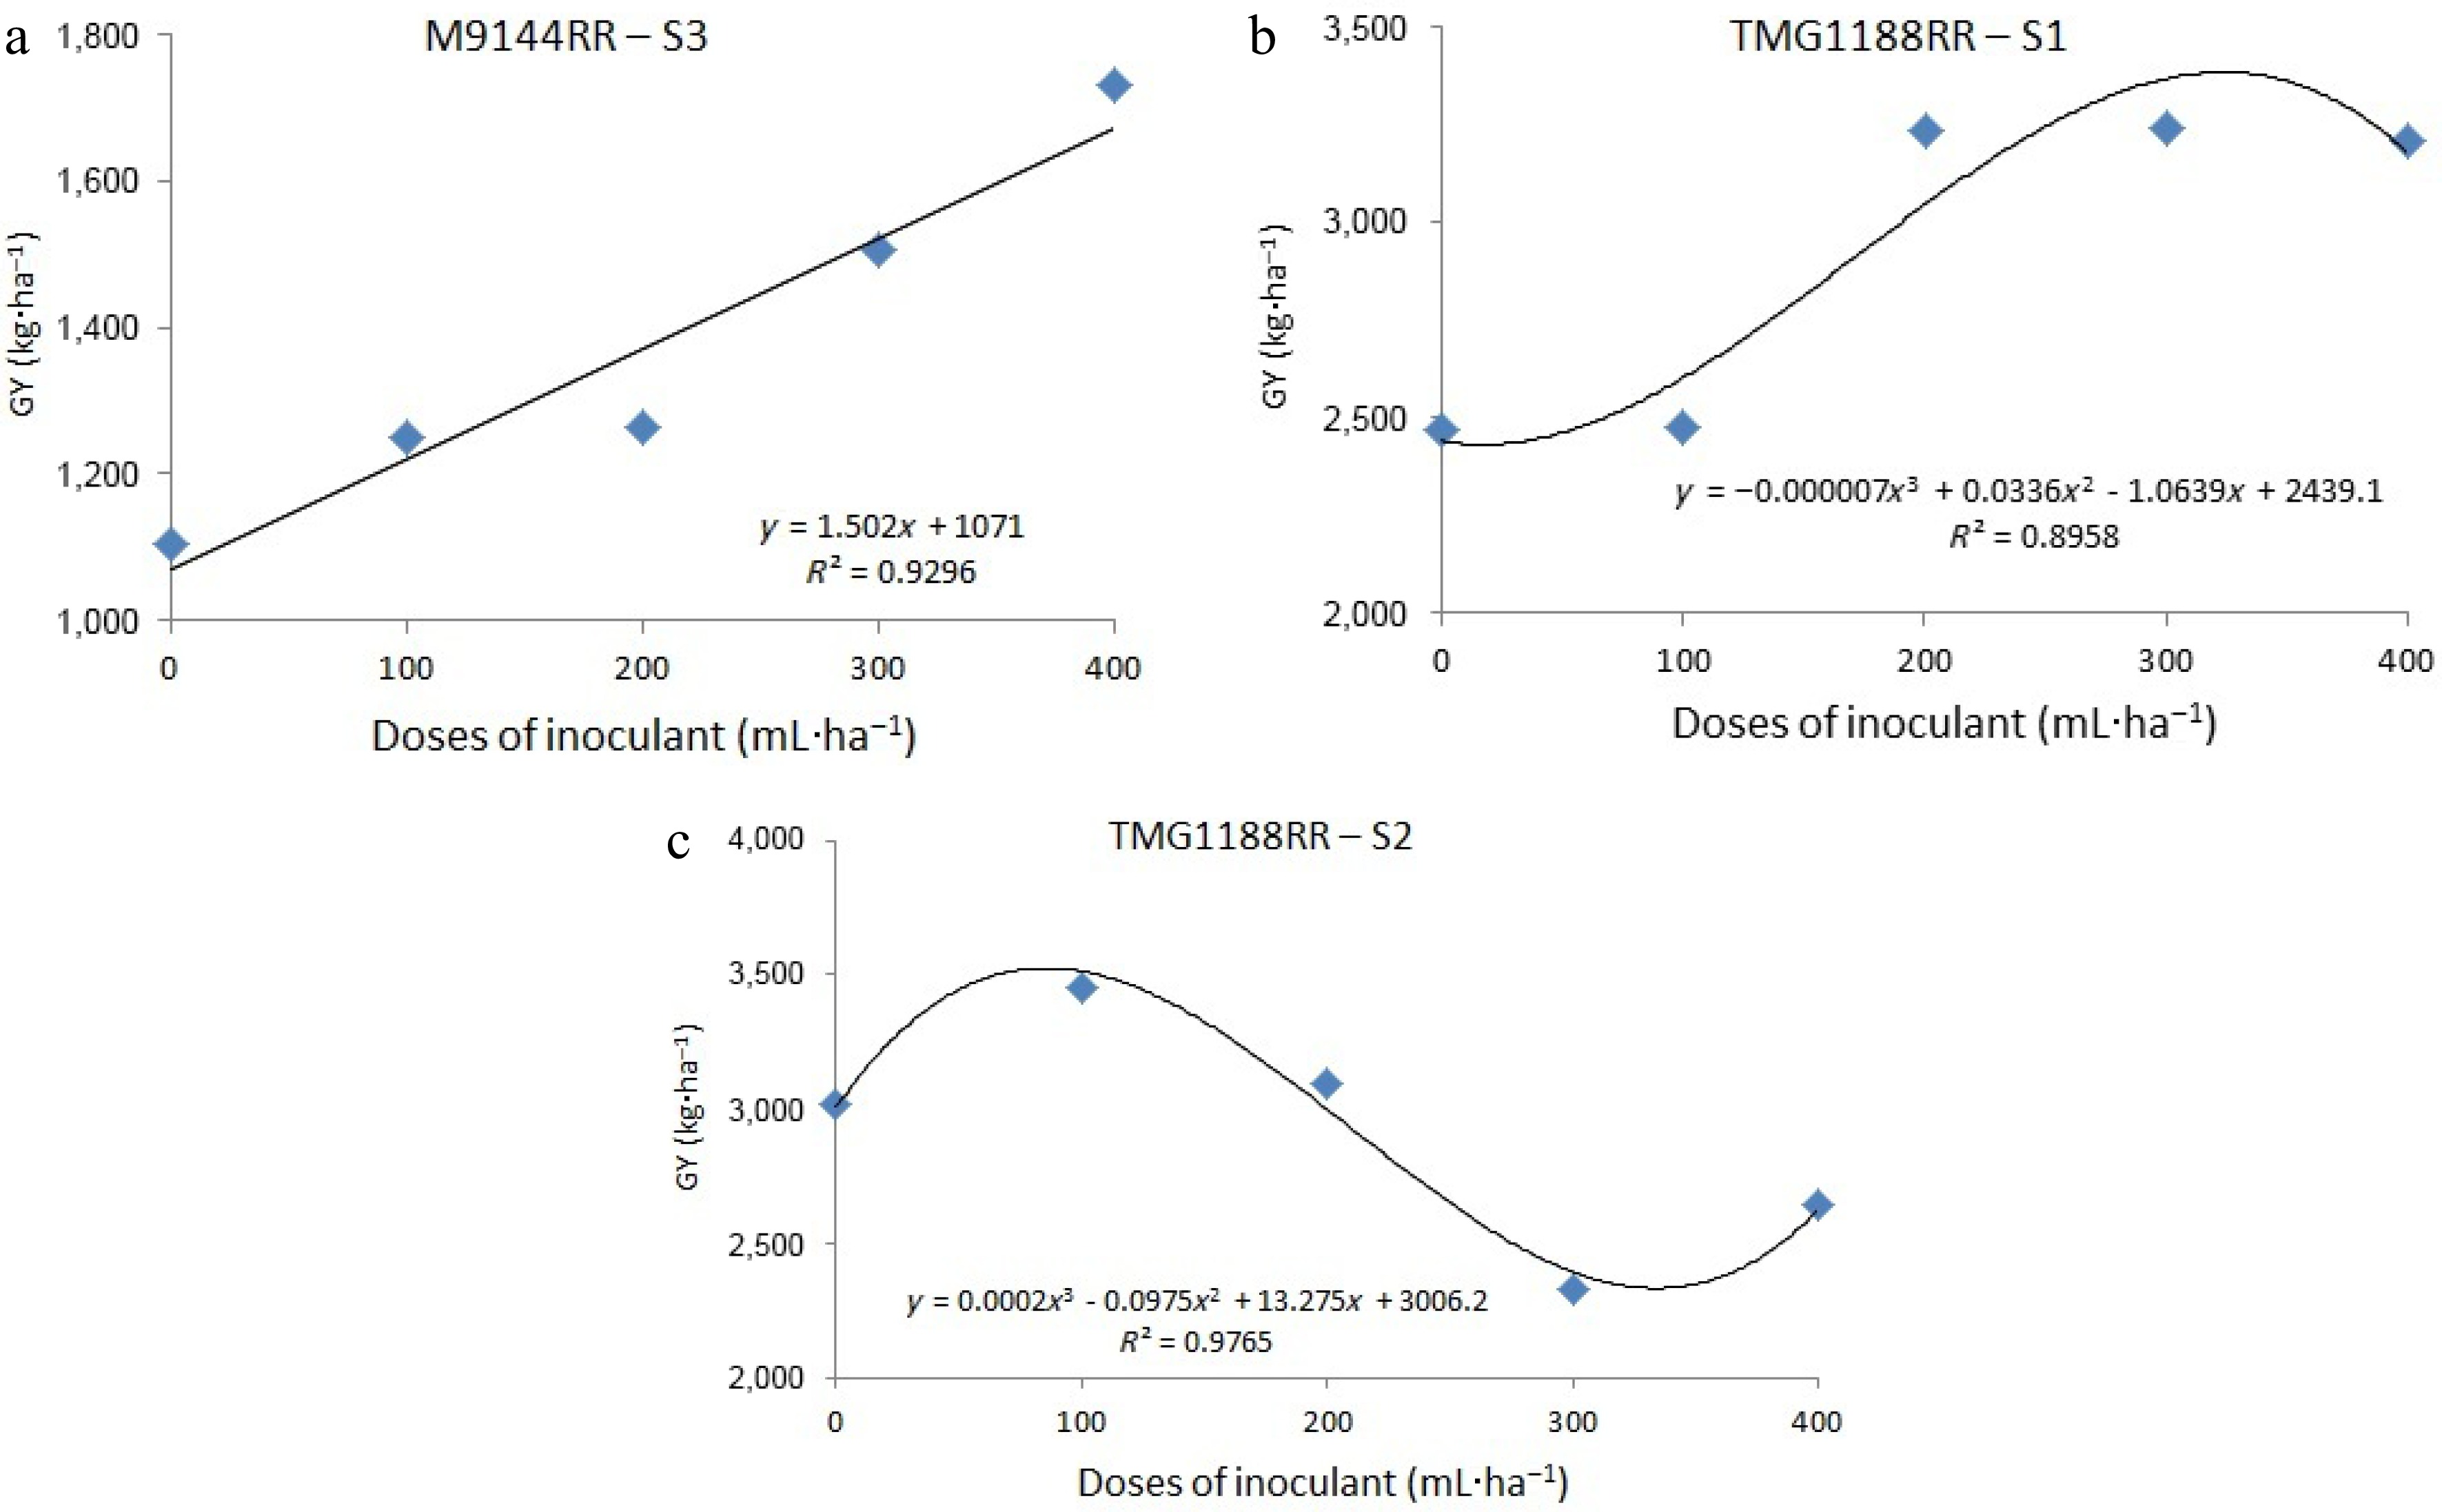
Figure 5.
Grain yield as a function of foliar application of different doses of A. brasilense in soybean at phenological stage V5, on three sowing dates.
For the cultivar TMG1188RR, the adjustment occurred in S1 and S2, by means of cubic equation (Fig. 5b & c). In the first sowing season, with the highest dose applied, the average yield reached was 3,339.71 kg·ha−1. This result shows how environmental conditions can interfere differently in the plant/bacteria relationship, even in the same cultivar.
Considering the second sowing date to be the one in which the environmental conditions were less favorable, the cultivar TMG1188RR showed greater sensitivity to the effects of the bacteria, responding at the lowest applied doses. This result was also observed for the physiological parameters. However, under more adequate conditions of water availability (S1), the benefits attributed to the inoculation were achieved in the highest doses applied.
That way, the productivity response can be attributed to the physiological parameters, which were influenced by the bacteria. Neto et al.[26] observed significant changes in dry biomass and root structure at different doses of A. brasilense in corn. Naoe et al.[11] also observed different responses in the productivity of soybean inoculated with A. brasilense under different environmental conditions. On the other hand, Zuffo et al.[27] did not observe beneficial effects on the productivity of soybean inoculated with the bacteria.
Thus, in unfavorable environmental conditions, A. brasilense seems to exert an additional benefit to the plants. However, in this study, the way in which the cultivars responded to this interaction was different, although both were favored directly and/or indirectly by inoculation.
-
The foliar application of A. brasilense on soybean plants influenced the physiological parameters and grain yield differently in the two evaluated cultivars.
At the dose of 100 mL·ha−1, the TMG1188RR cultivar showed greater yield (3,450 kg·ha−1) and gs (4.89 µmol CO2 m−2·s−1). While the cultivar M9144RR showed higher yield (3,441 kg·ha−1), gs (3.35 µmol CO2 m−2·s−1) and A (17.32 µmol CO2 m−2·s−1), at the dose of 400 mL·ha−1.
The foliar inoculation with A. brasilense can be recommended as a biotechnological technique that influences the physiological characteristics of soybeans and improves yield in unfavorable environmental conditions.
-
The authors confirm contribution to the paper as follows: Study conception and design: Reina E, Peluzio JM; data collection: Reina E, Monteiro FJF; analysis and interpretation of results: Reina E, Peluzio JM, Naoe AML; draft manuscript preparation: Naoe AML, Reina E ; review & editing: Naoe AML. All authors reviewed the results and approved the final version of the manuscript.
-
The data in this paper are free from any conflict of interest. The data that support the findings of this study are available from the corresponding author upon reasonable request.
The support rendered by the Federal University of Tocantins and Brazilian Agricultural Research Corporation is fully acknowledged.
-
The authors declare that they have no conflict of interest.
- Copyright: © 2024 by the author(s). Published by Maximum Academic Press, Fayetteville, GA. This article is an open access article distributed under Creative Commons Attribution License (CC BY 4.0), visit https://creativecommons.org/licenses/by/4.0/.
-
About this article
Cite this article
Reina E, Peluzio JM, Naoe AMdL, Monteiro FJF. 2024. Effect of Azospirillum brasilense in gas exchanges and production of soybean. Technology in Agronomy 4: e006 doi: 10.48130/tia-0024-0003
Effect of Azospirillum brasilense in gas exchanges and production of soybean
- Received: 17 November 2023
- Revised: 03 February 2024
- Accepted: 13 February 2024
- Published online: 19 March 2024
Abstract: The present study aimed to verify the photosynthetic responses and yield of soybean cultivars in relation to foliar inoculation with Azospirillum brasilense at different sowing dates. For this, three field experiments were carried out at the Federal University of Tocantins, Palmas campus, Brazil. Consecutive seasons were carried out on three sowing dates, November 15th, 2019, December 2nd, 2019 and December 20th, 2019. The experiment was conducted in a randomized block design with four replicates, in a 2 × 5 factorial scheme, represented by two soybean cultivars (M9144RR and TMG1188RR) and five doses of Azospirillum brasilense (0, 100, 200, 300 and 400 mL), applied via foliar at the stage of growth V5. Stomatal conductance rate (gs), internal CO2 concentration (iC), transpiration rate (E), net photosynthetic rate (A) and grain yield were evaluated. The cultivars showed different responses to sowing dates and to doses of A. brasilense in all evaluated parameters. The cultivar TMG1188RR showed higher yield (3,450 kg·ha−1) and gs (4.89 µmol CO2 m−2·s−1) at the lowest dose applied, while the cultivar M9144RR showed higher yield (3,441 kg·ha−1), gs (3.35 µmol CO2 m−2·s−1) and A (17.32 µmol CO2 m−2·s−1) at highest dose applied. The leaf inoculation with A. brasilense was more responsive in periods in which there were unfavorable environmental conditions for soybean cultivation and can be recommended as complementary management in these conditions.
-
Key words:
- Azospirillum brasilense /
- Exchanges /
- Production /
- Soybeans /
- Glycine max (L.) Merrill /
- Rhizobacteria /
- Drought Stress


