-
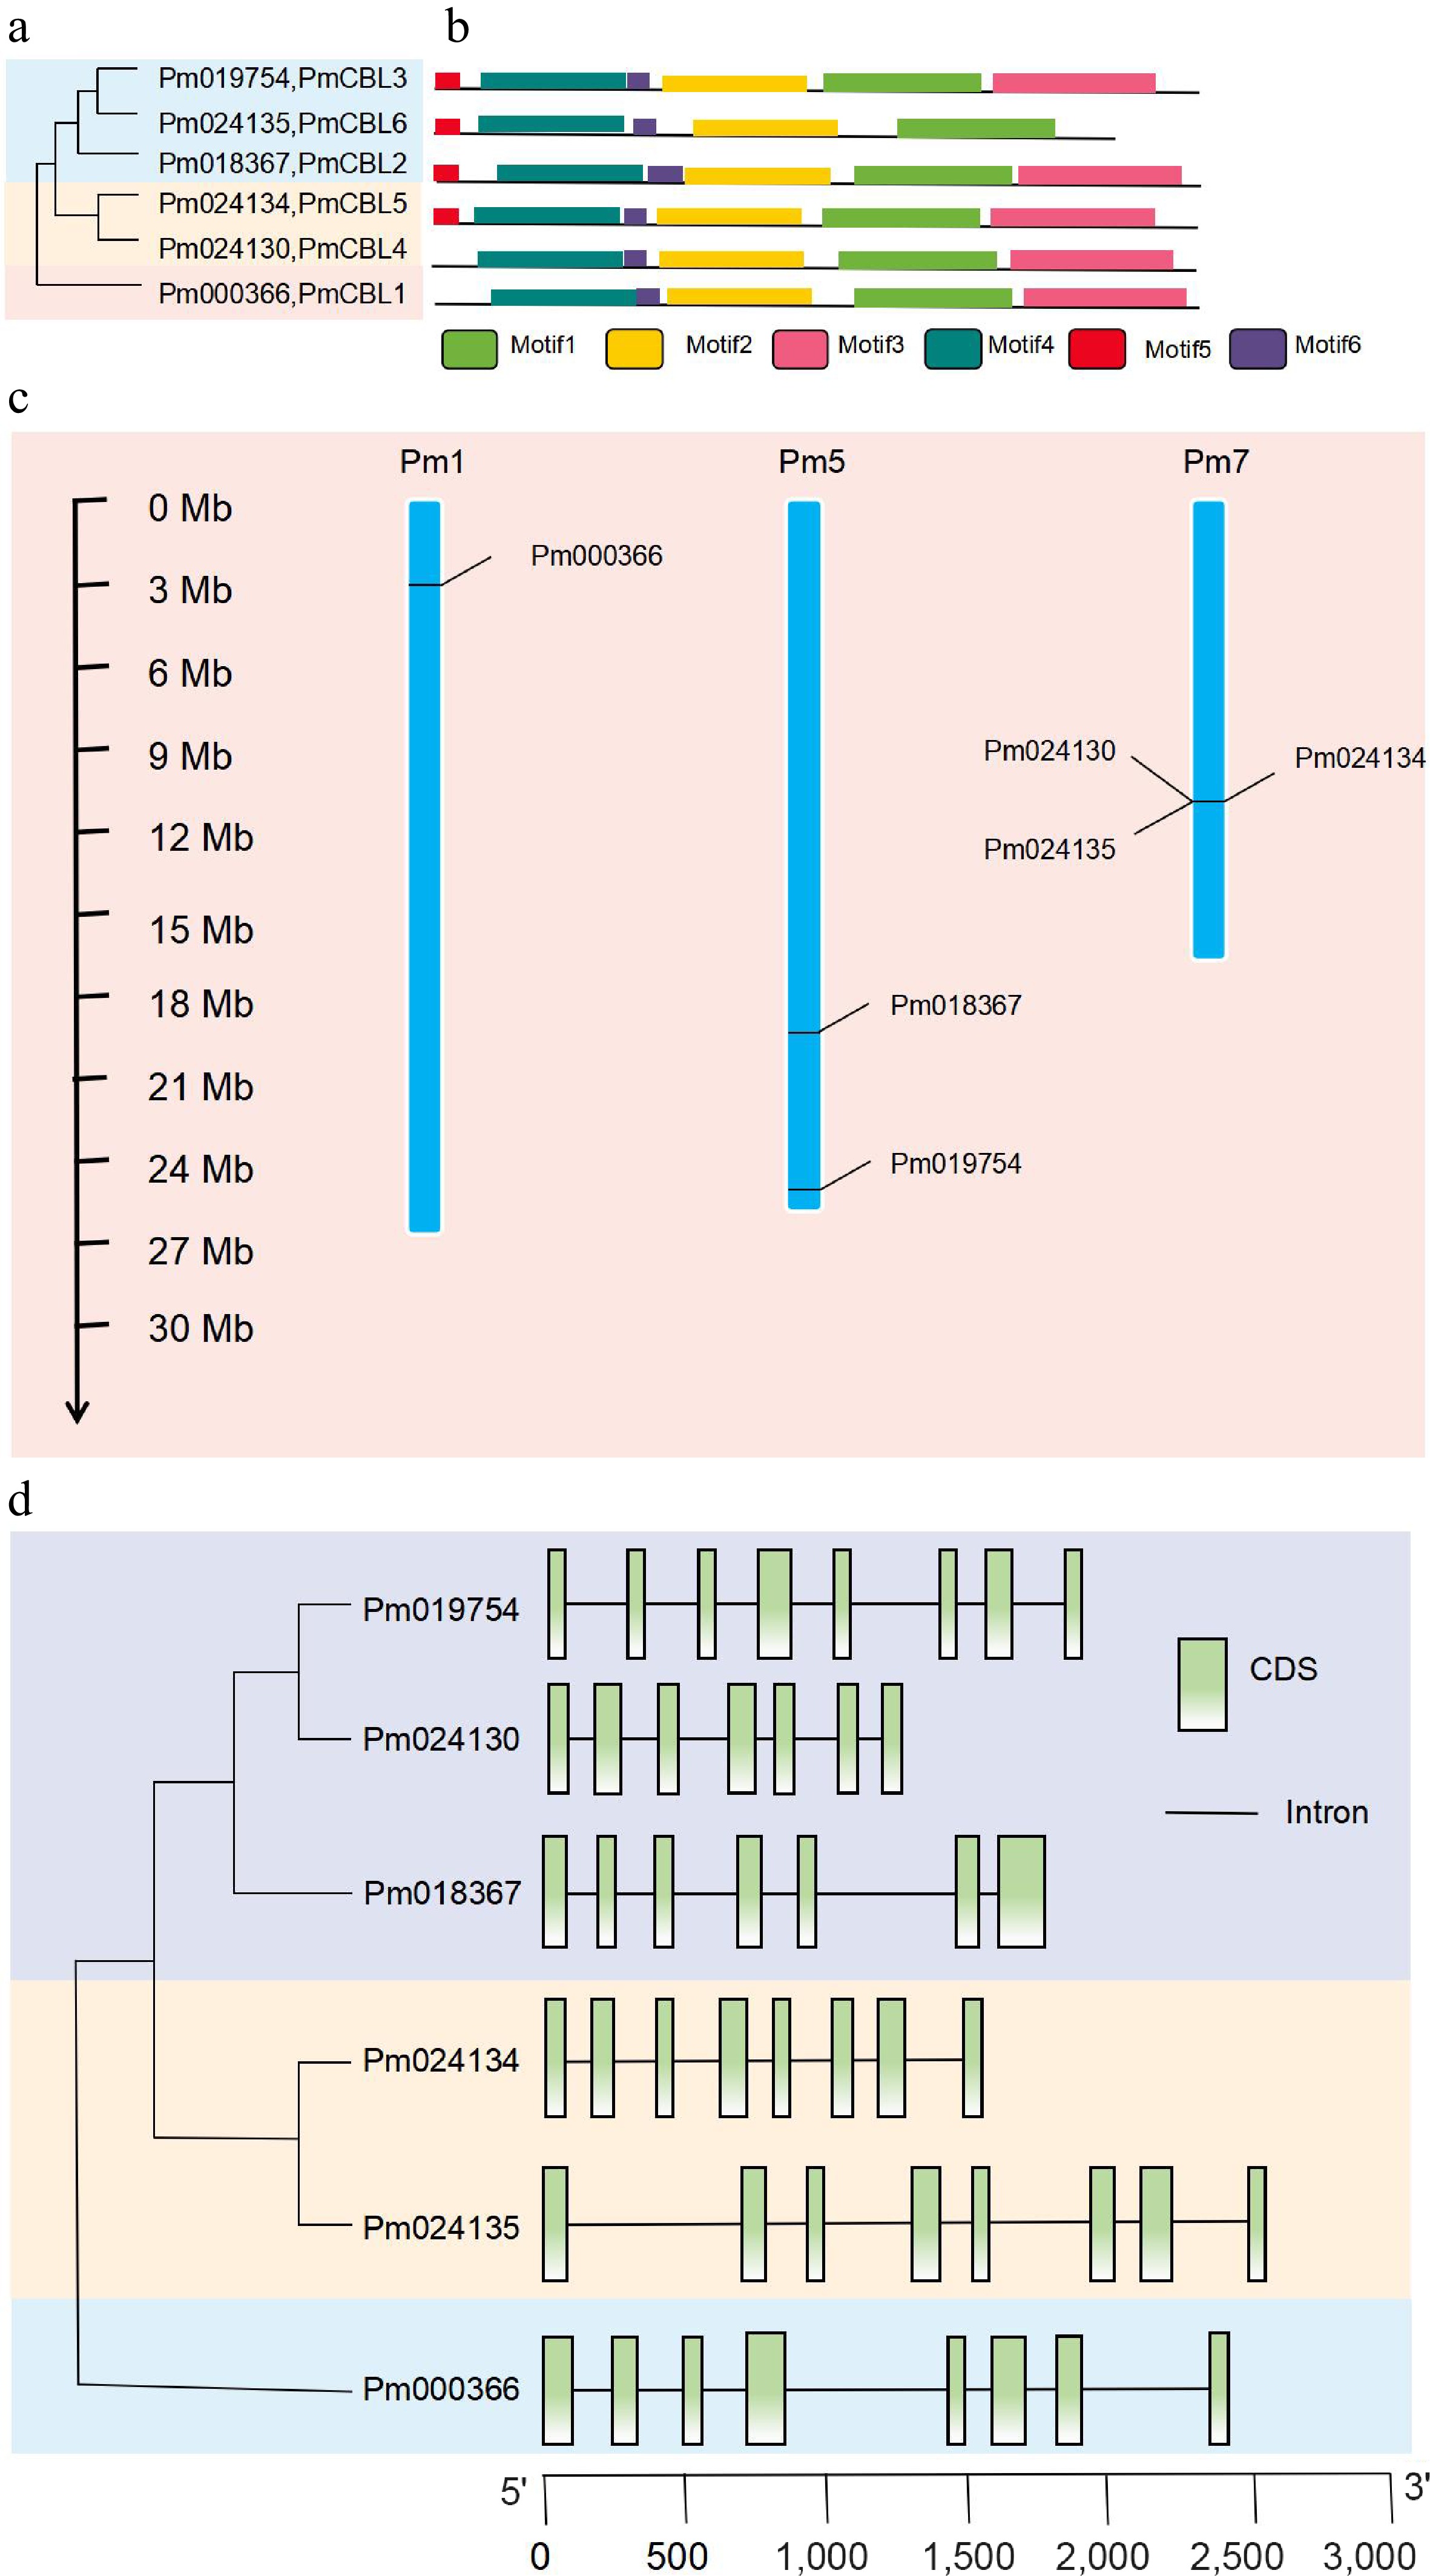
Figure 1.
Phylogenetic analysis, protein motif structure, chromosome localization, and gene structure analysis of PmCBL genes. (a) Phylogenetic analysis of PmCBL genes. (b) Protein motif structure of PmCBL genes. (c) Chromosome localization analysis of PmCBL genes. (d) Gene structure analysis of PmCBL genes.
-
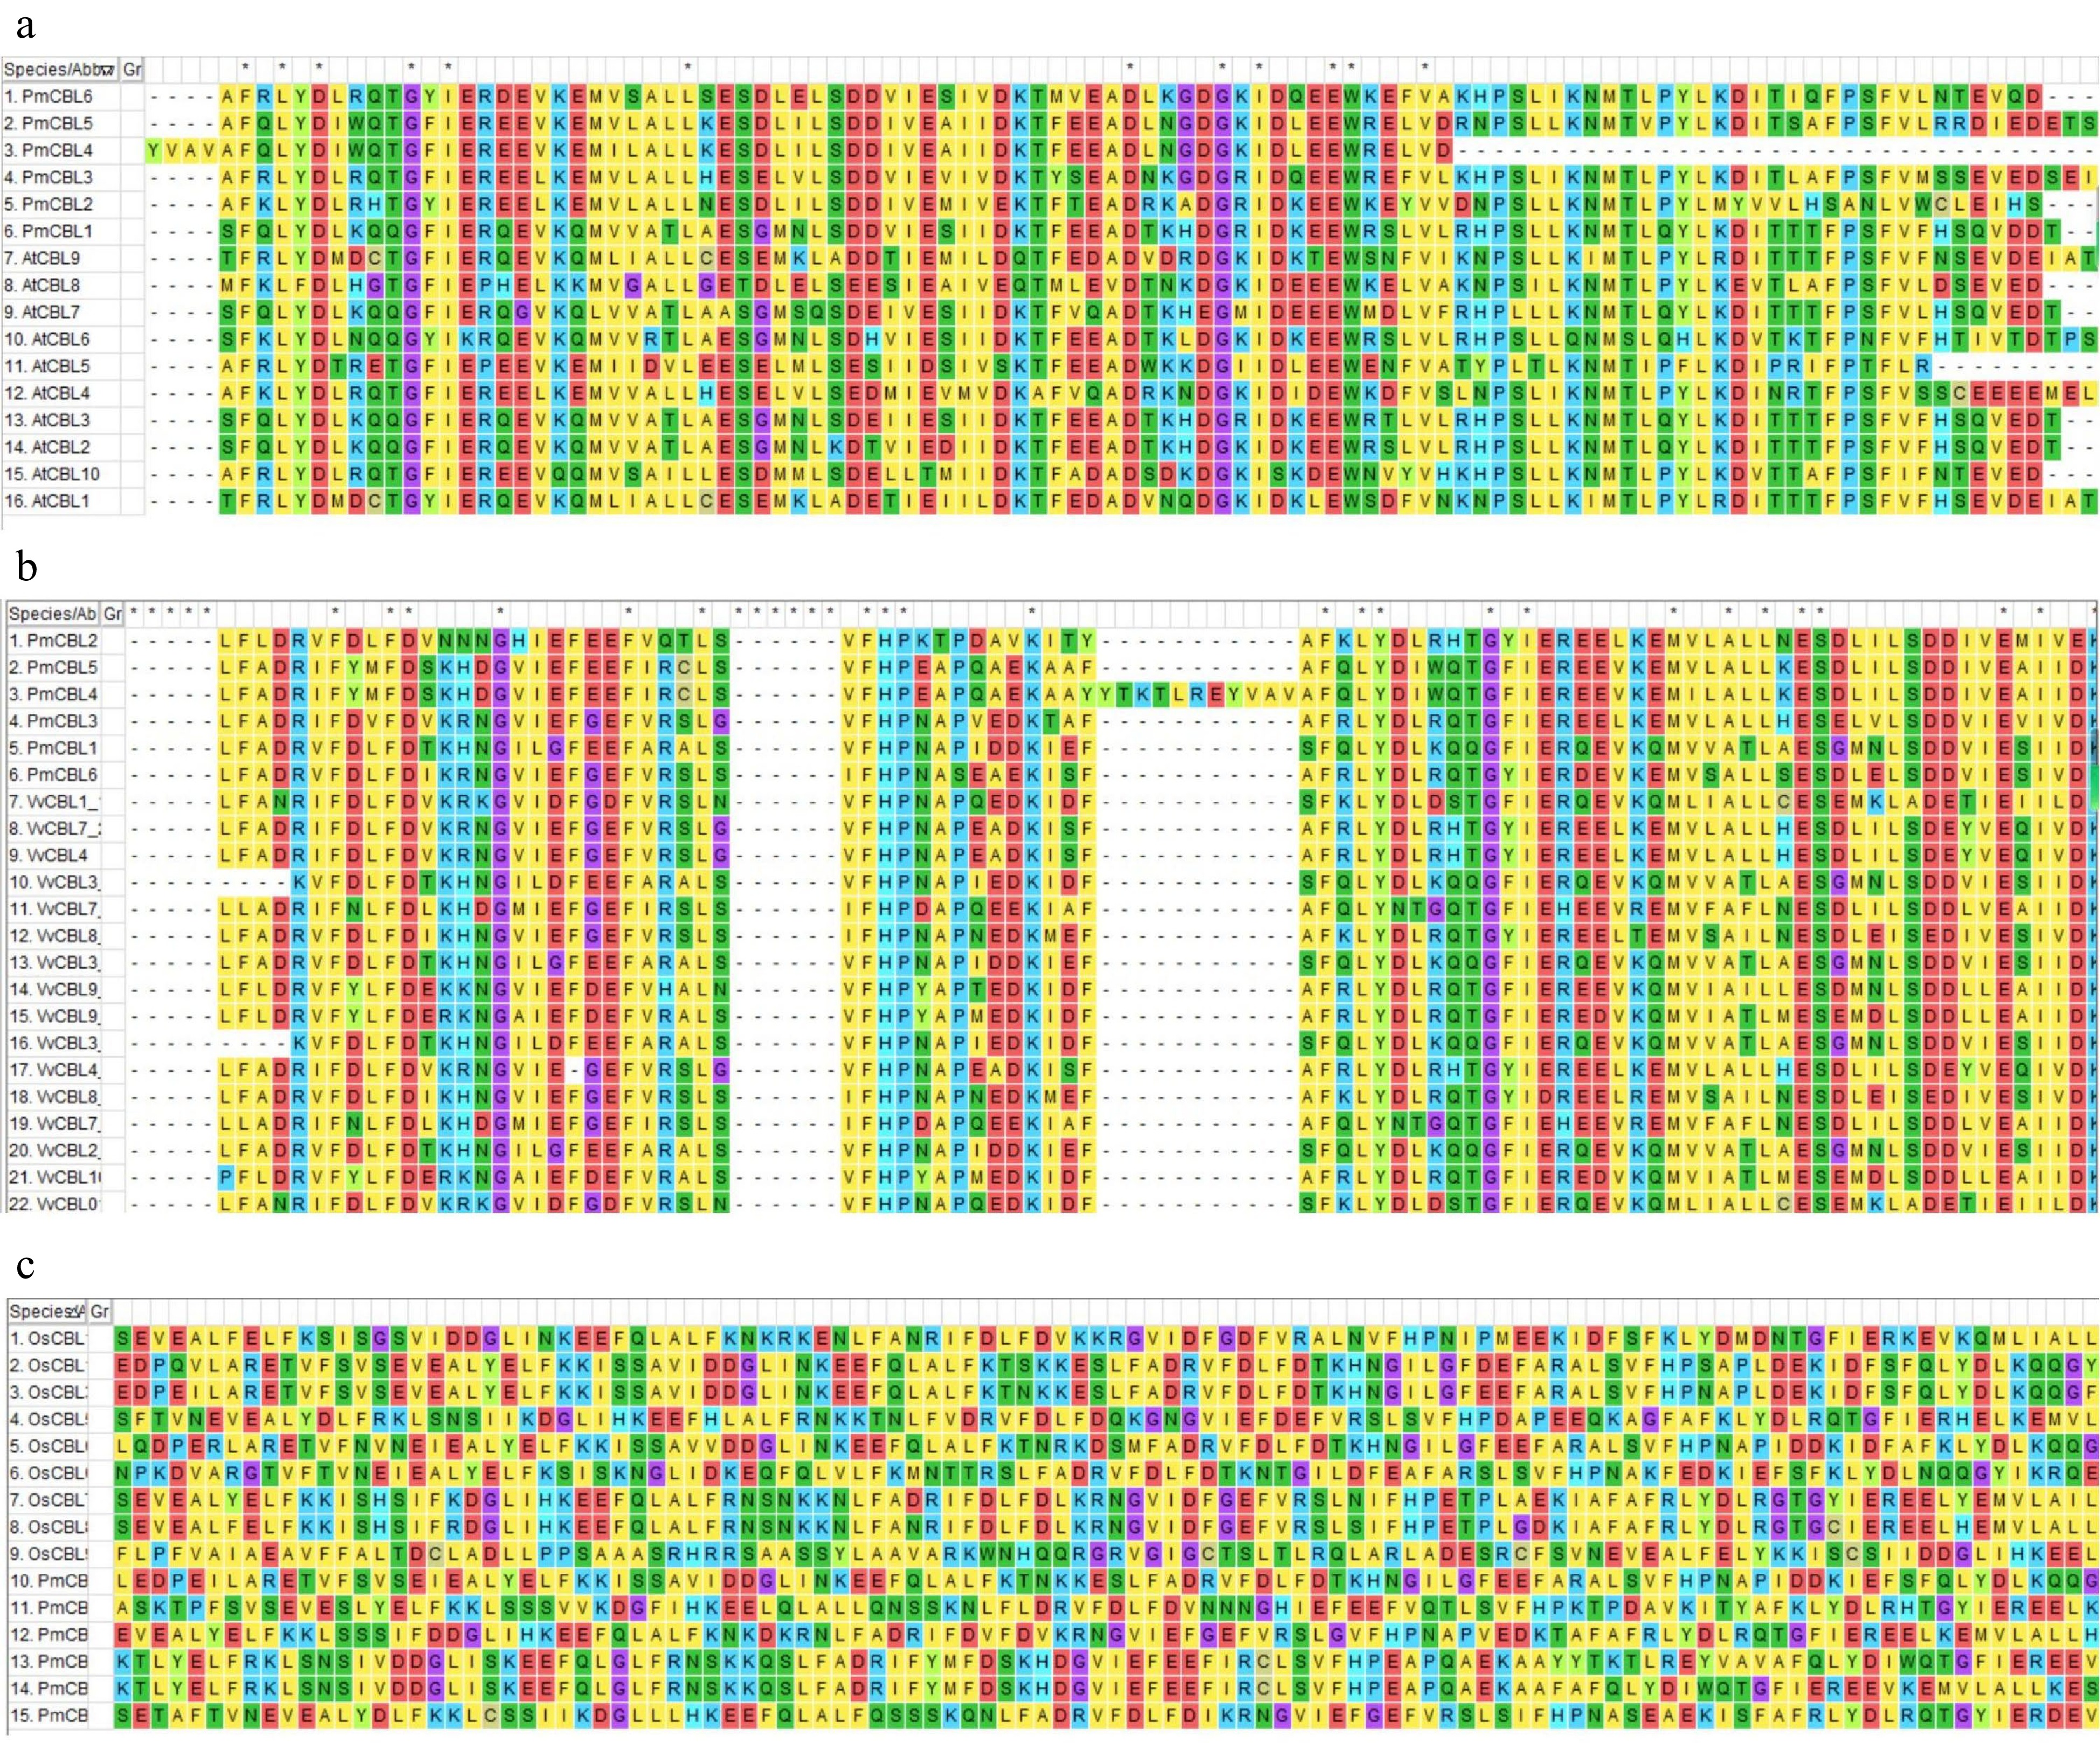
Figure 2.
Protein amino acid sequence comparison diagram. (a) Protein amino acid sequence comparison diagram between P. mume and A. thaliana. (b) Protein amino acid sequence comparison diagram between P. mume and V. vinifera. (c) Protein amino acid sequence comparison diagram between P. mume and O. sativa.
-

Figure 3.
Phylogenetic tree of P. mume, A. thaliana, O. sativa, N. tabacum and V. vinifera. The green checkmark represents V. vinifera, the black square represents O. sativa, the blue circle represents A. thaliana, the red star represents N. tabacum, and the purple triangle represents P. mume.
-
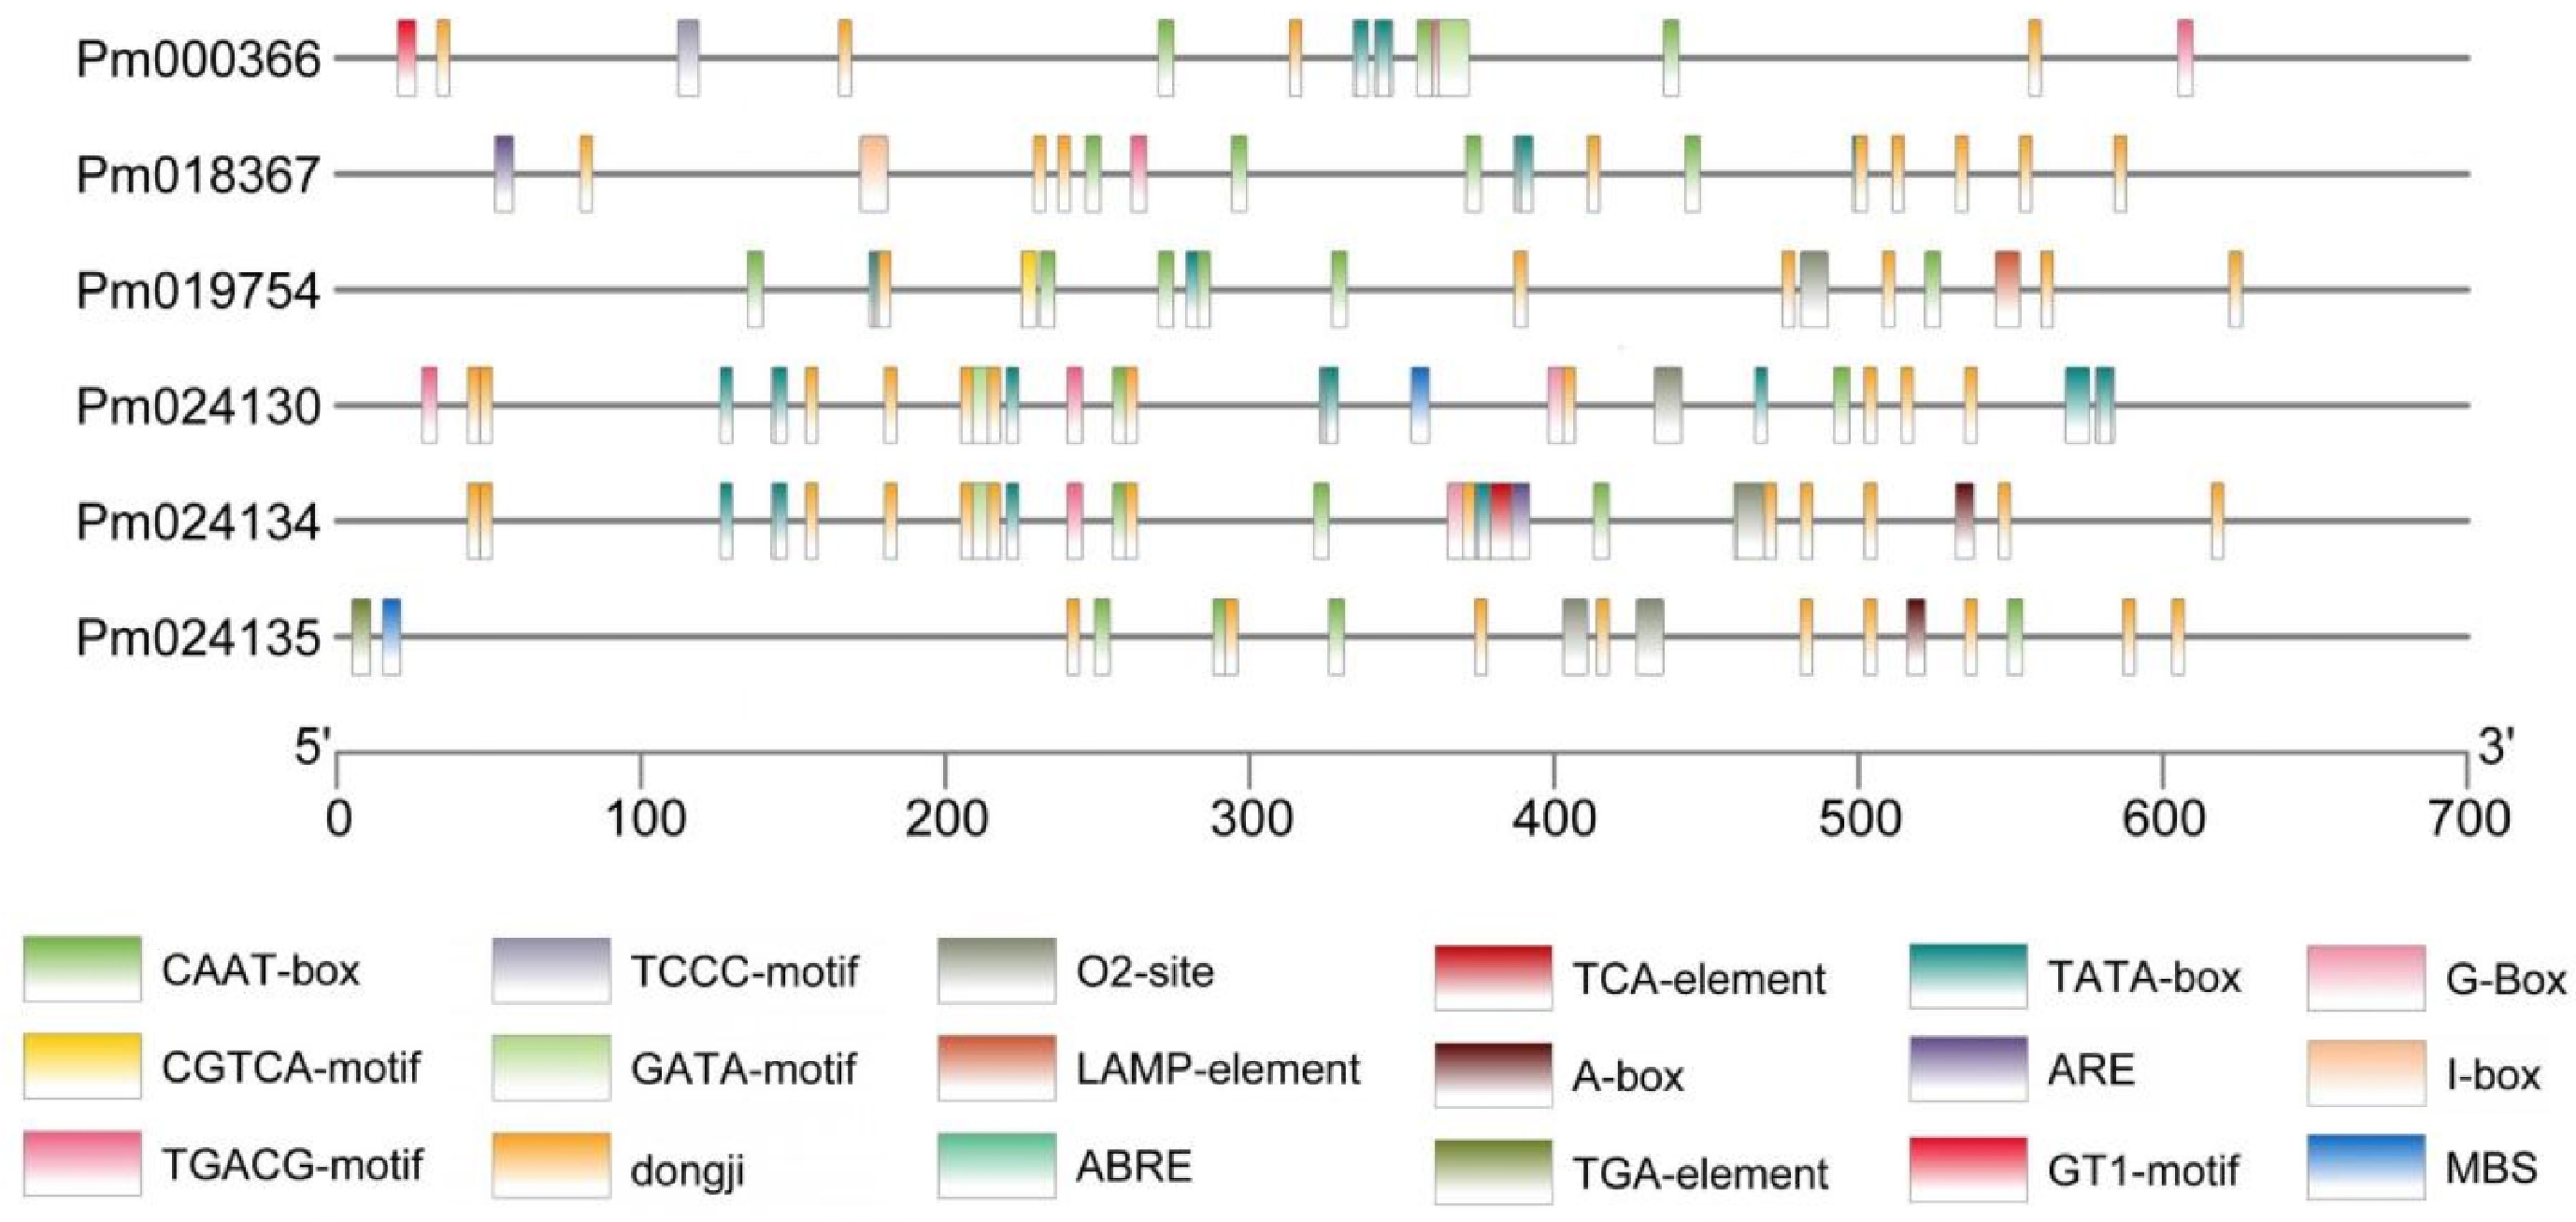
Figure 4.
Analysis of cis-acting elements in PmCBL genes.
-
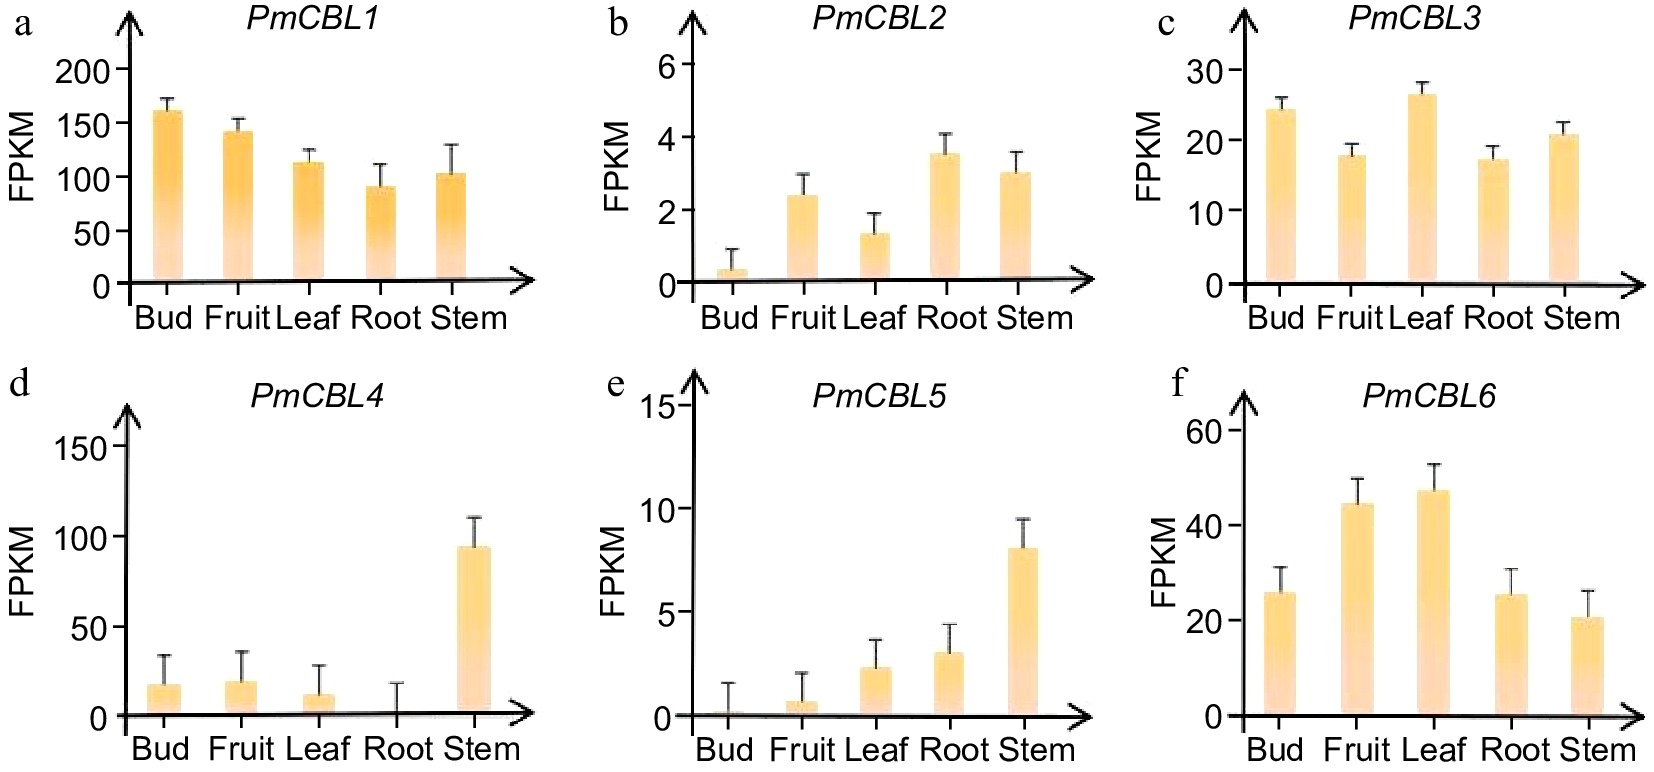
Figure 5.
Expression patterns of PmCBL genes in different tissue parts of P. mume.
-
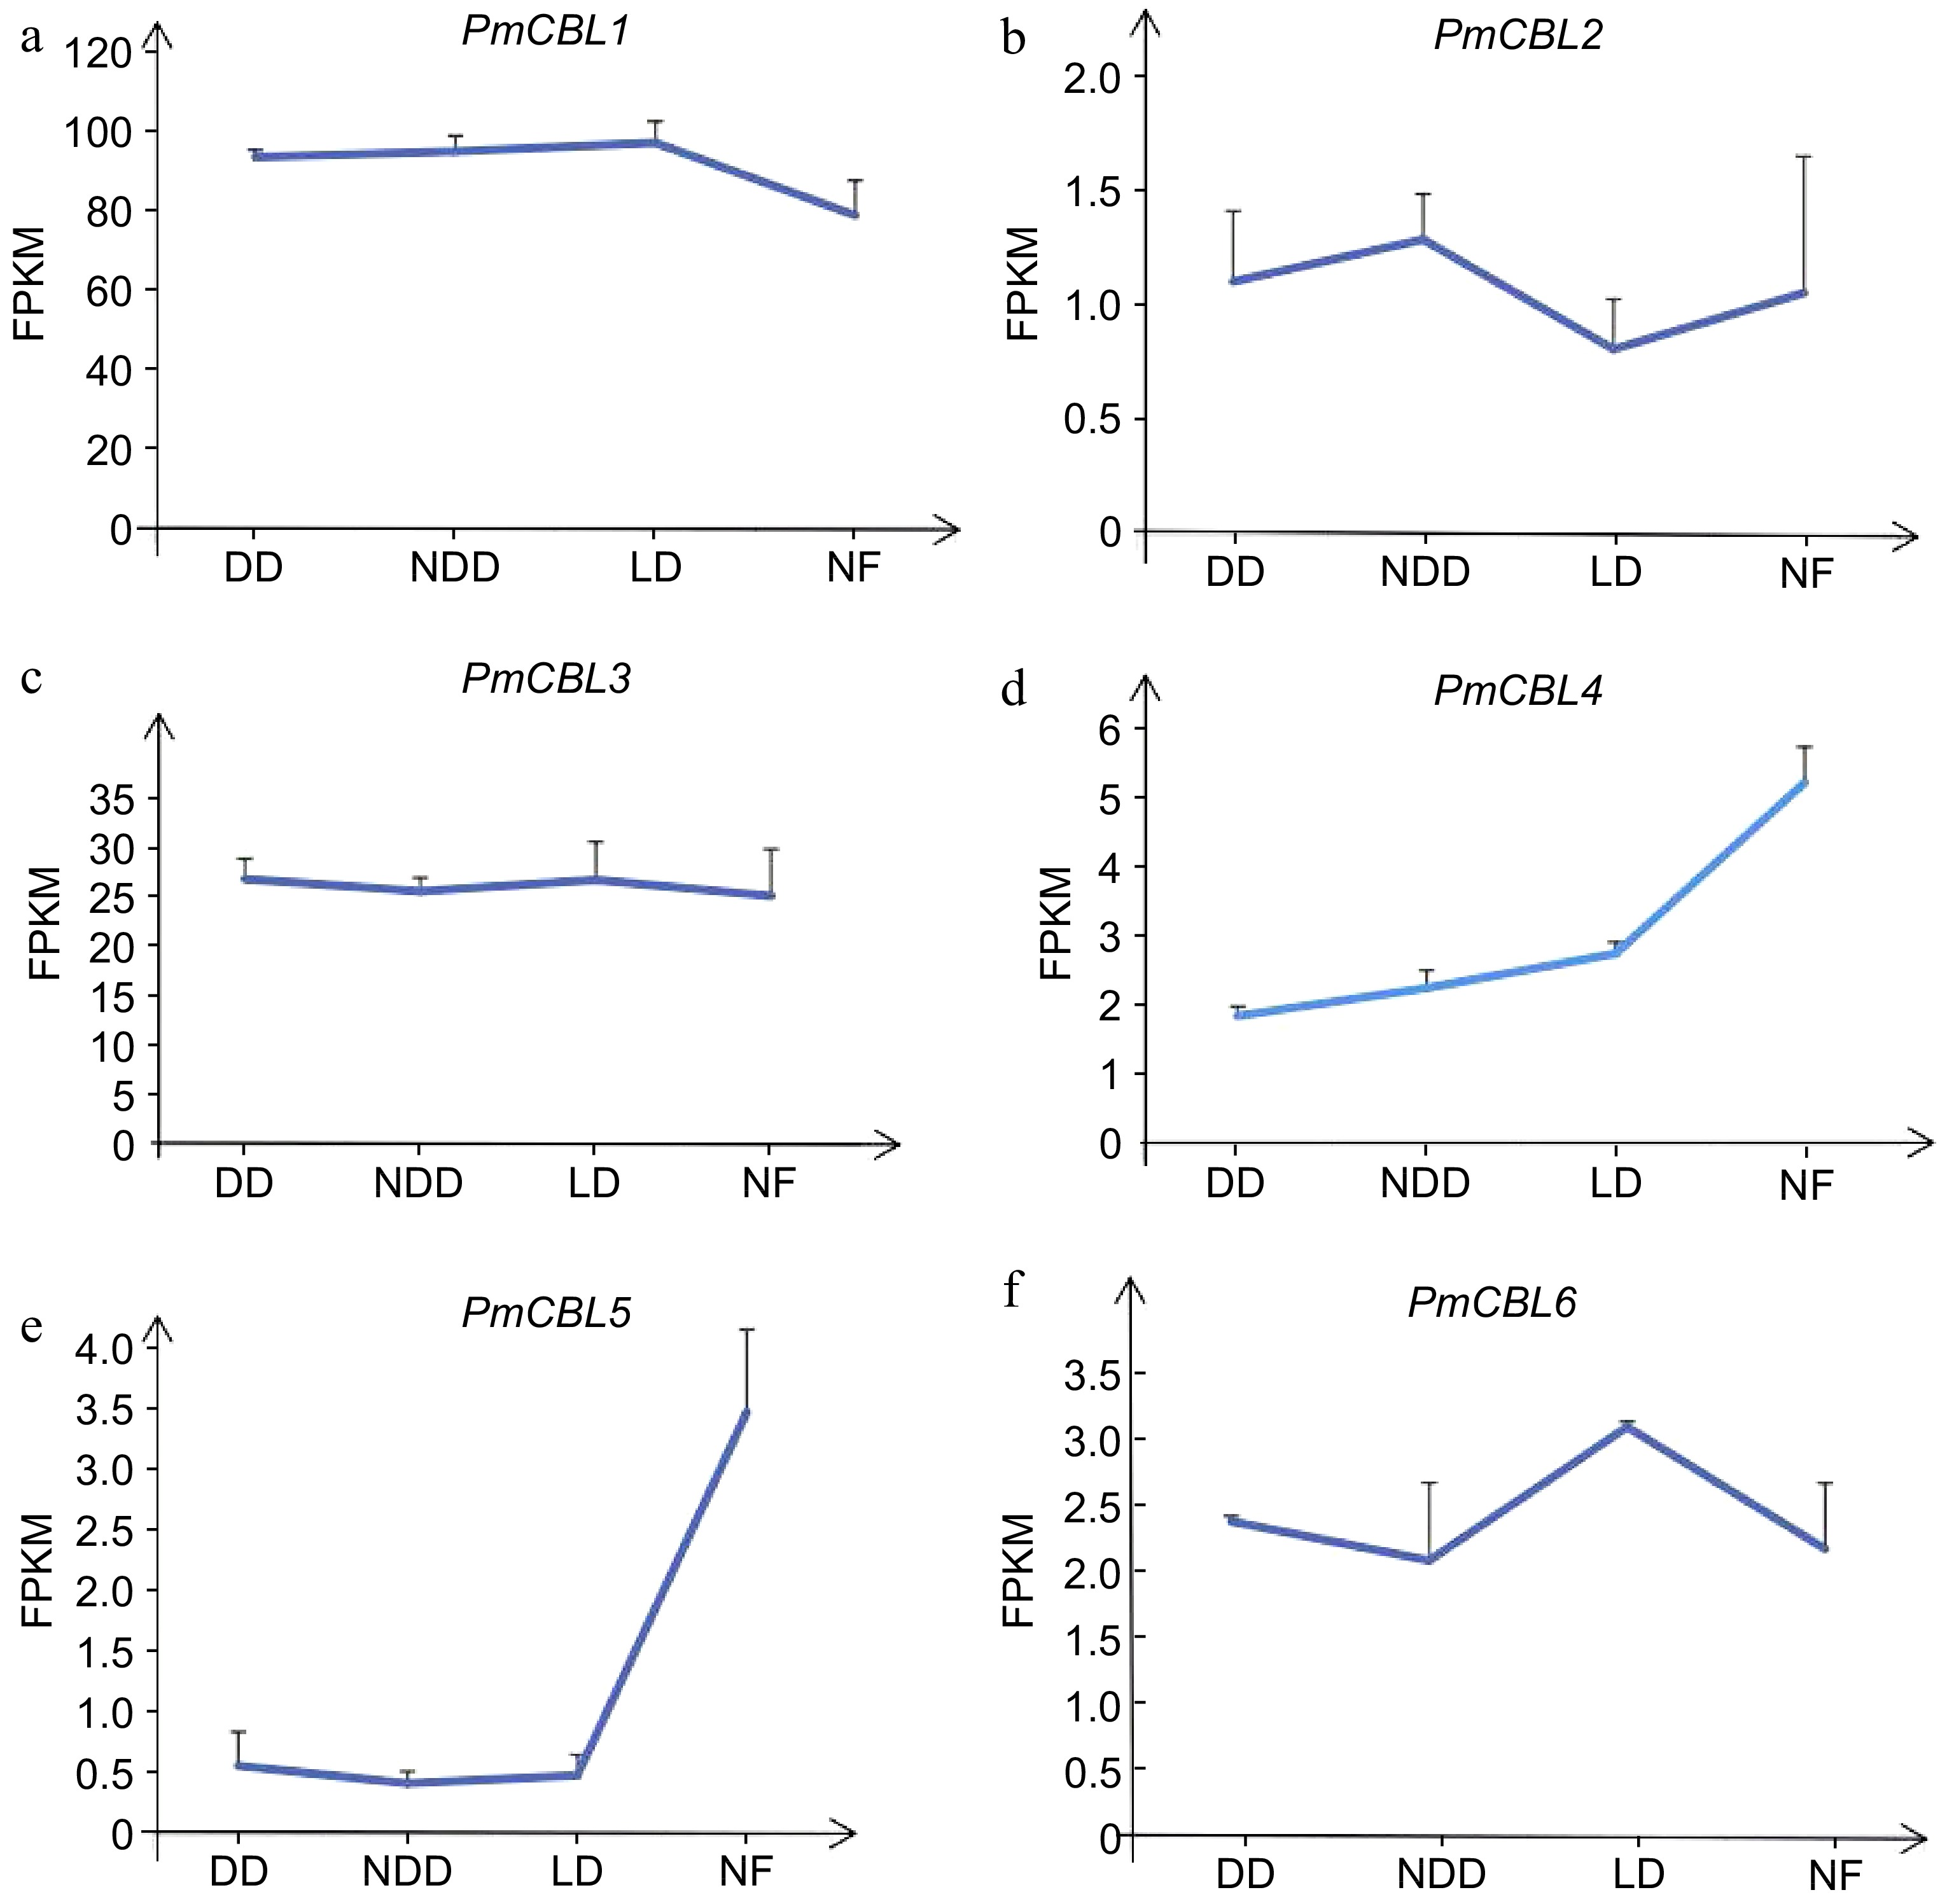
Figure 6.
The expression pattern of PmCBLs genes during overwintering. DD, November; NDD, December; LD, January; NF, February.
-
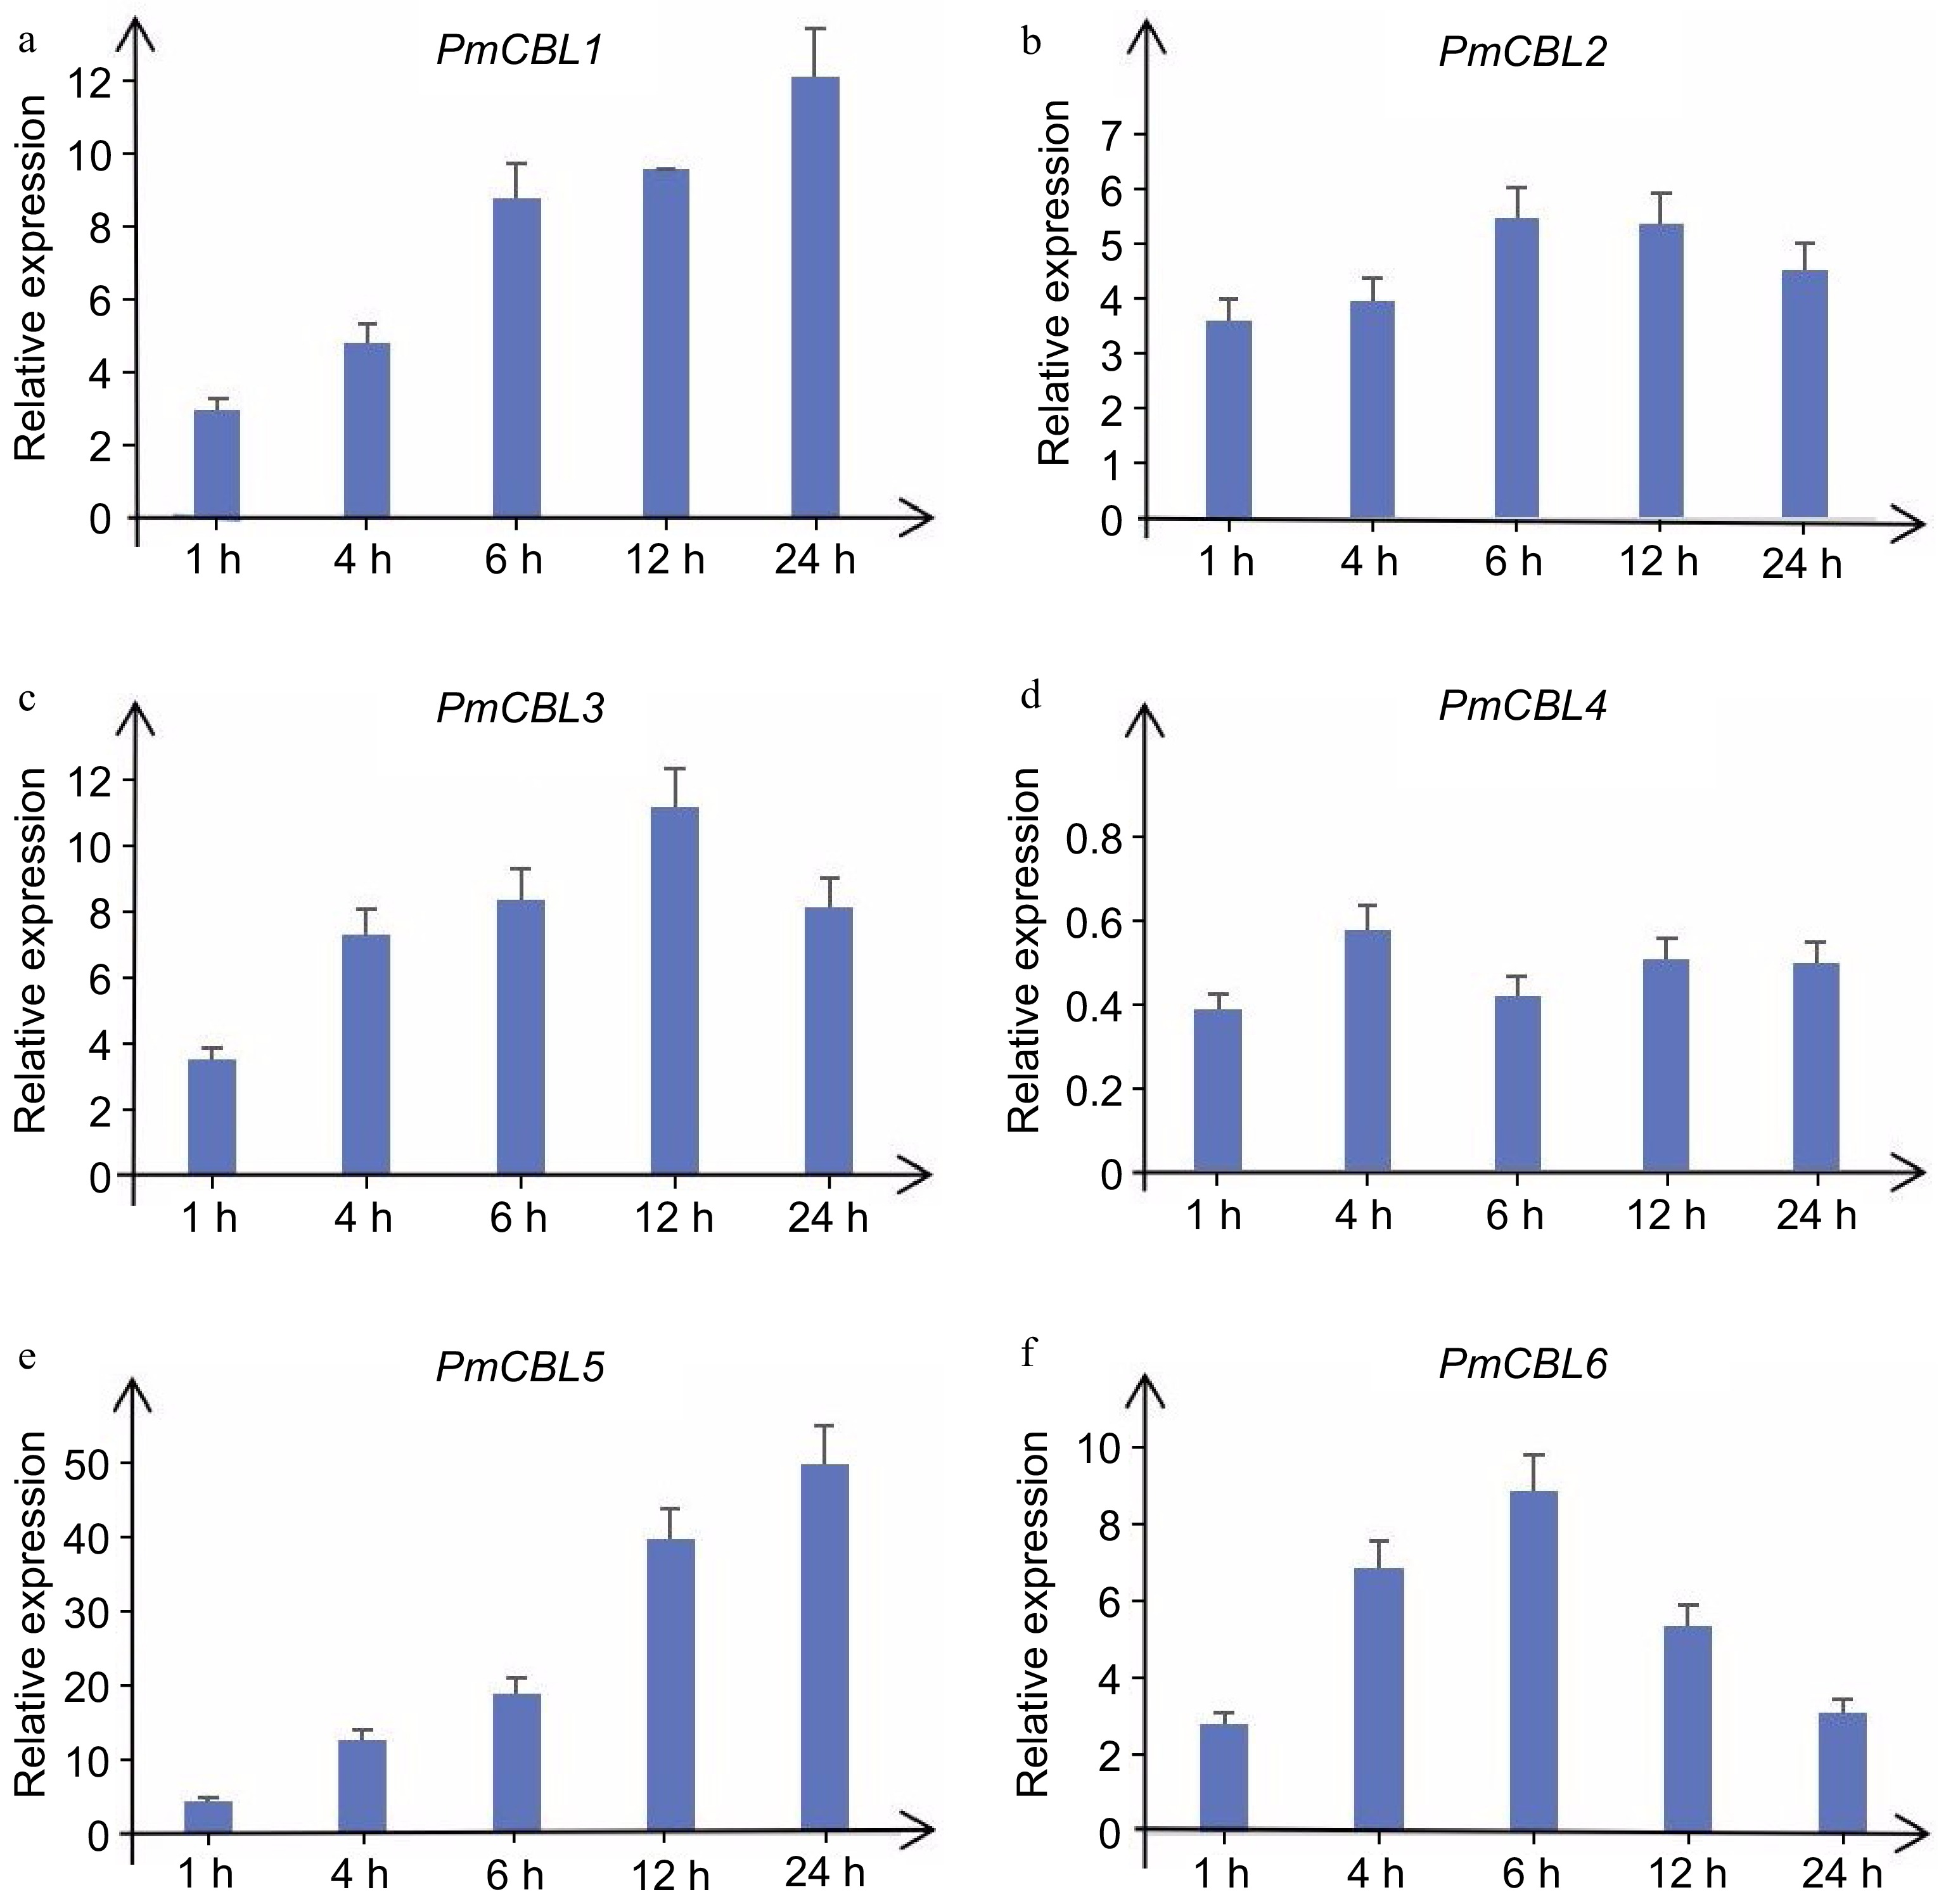
Figure 7.
Expression levels of PmCBL genes under 4 °C treatment.
-
Gene name Gene ID Chromosome Position Subcelllar localization CDS (bp) Intron PmCBL1 Pm000366 Chr01 2287536~2289774 Cell membrane 2,418 5 PmCBL2 Pm018367 Chr05 17870110~17871915 Cell membrane 1,805 4 PmCBL3 Pm019754 Chr05 25555186~25557079 Cell membrane 1,893 5 PmCBL4 Pm024130 Chr07 10584318~10585570 Cell membrane 1,252 4 PmCBL5 Pm024134 Chr07 10621981~10623545 Cell membrane 1,564 5 PmCBL6 Pm024135 Chr07 10622516~10628186 Cell membrane 2,474 5 Table 1.
Members of the P. mume PmCBL gene family and their main molecular characteristics and information.
-
Protein name Gene ID Number of amino acids Molecular weight Thereotical pI Instability index Signal peptide PmCBL1 Pm000366 226 26052.71 4.82 49.06 NO PmCBL2 Pm018367 217 24903.52 5.14 35.97 NO PmCBL3 Pm019754 212 24429.82 4.73 46.65 NO PmCBL4 Pm024130 186 21665.75 4.6 40.14 NO PmCBL5 Pm024134 213 24720.17 4.57 40.98 NO PmCBL6 Pm024135 218 25144.71 4.86 46.47 NO Table 2.
Physicochemical properties of P. mume CBL gene family members.
-
Gene PmCBL1 PmCBL2 PmCBL3 PmCBL4 PmCBL5 PmCBL6 Gene ID Pm000366 Pm018367 Pm019754 Pm024130 Pm024134 Pm024135 CAAT-box 3 4 6 2 4 4 CGTCA-motif 2 1 1 2 1 TGACG-motif 2 1 1 2 1 TATA-box 4 4 4 11 8 GT1-motif 1 TCCC-motif 1 GATA-motif 1 1 1 ARE 1 1 G-box 1 1 MBS 1 1 TGA-element 1 A-box 1 1 I-box 1 O2-site 1 1 1 2 LAMP-element 1 ABRE 1 1 TCA-element 1 CAAT-box was a common cis-acting element in the promoter and enhancer regions. CGTCA-motif/TGACG-motif was cis-acting regulatory elements involved in MeJA response. TATA-box was a core promoter element located around the transcription start site (-30). GT1-motif was a light-responsive element. TCA-element was a cis-acting element involved in salicylic acid response. TGA-element was an element involved in auxin response. ABRE was a cis-acting element involved in abscisic acid response. A-box was a cis-acting regulatory element. ARE was a cis-acting element required for anaerobic induction. G-box was a cis-acting element involved in light response. O2-site/MBS was cis-acting regulatory elements involved in zein protein metabolism regulation. TCCC-motif/GATA-motif/I-box/LAMP-element was part of light-responsive elements. Table 3.
Analysis of cis-acting elements in the P. mume CBL gene family members.
Figures
(7)
Tables
(3)