-
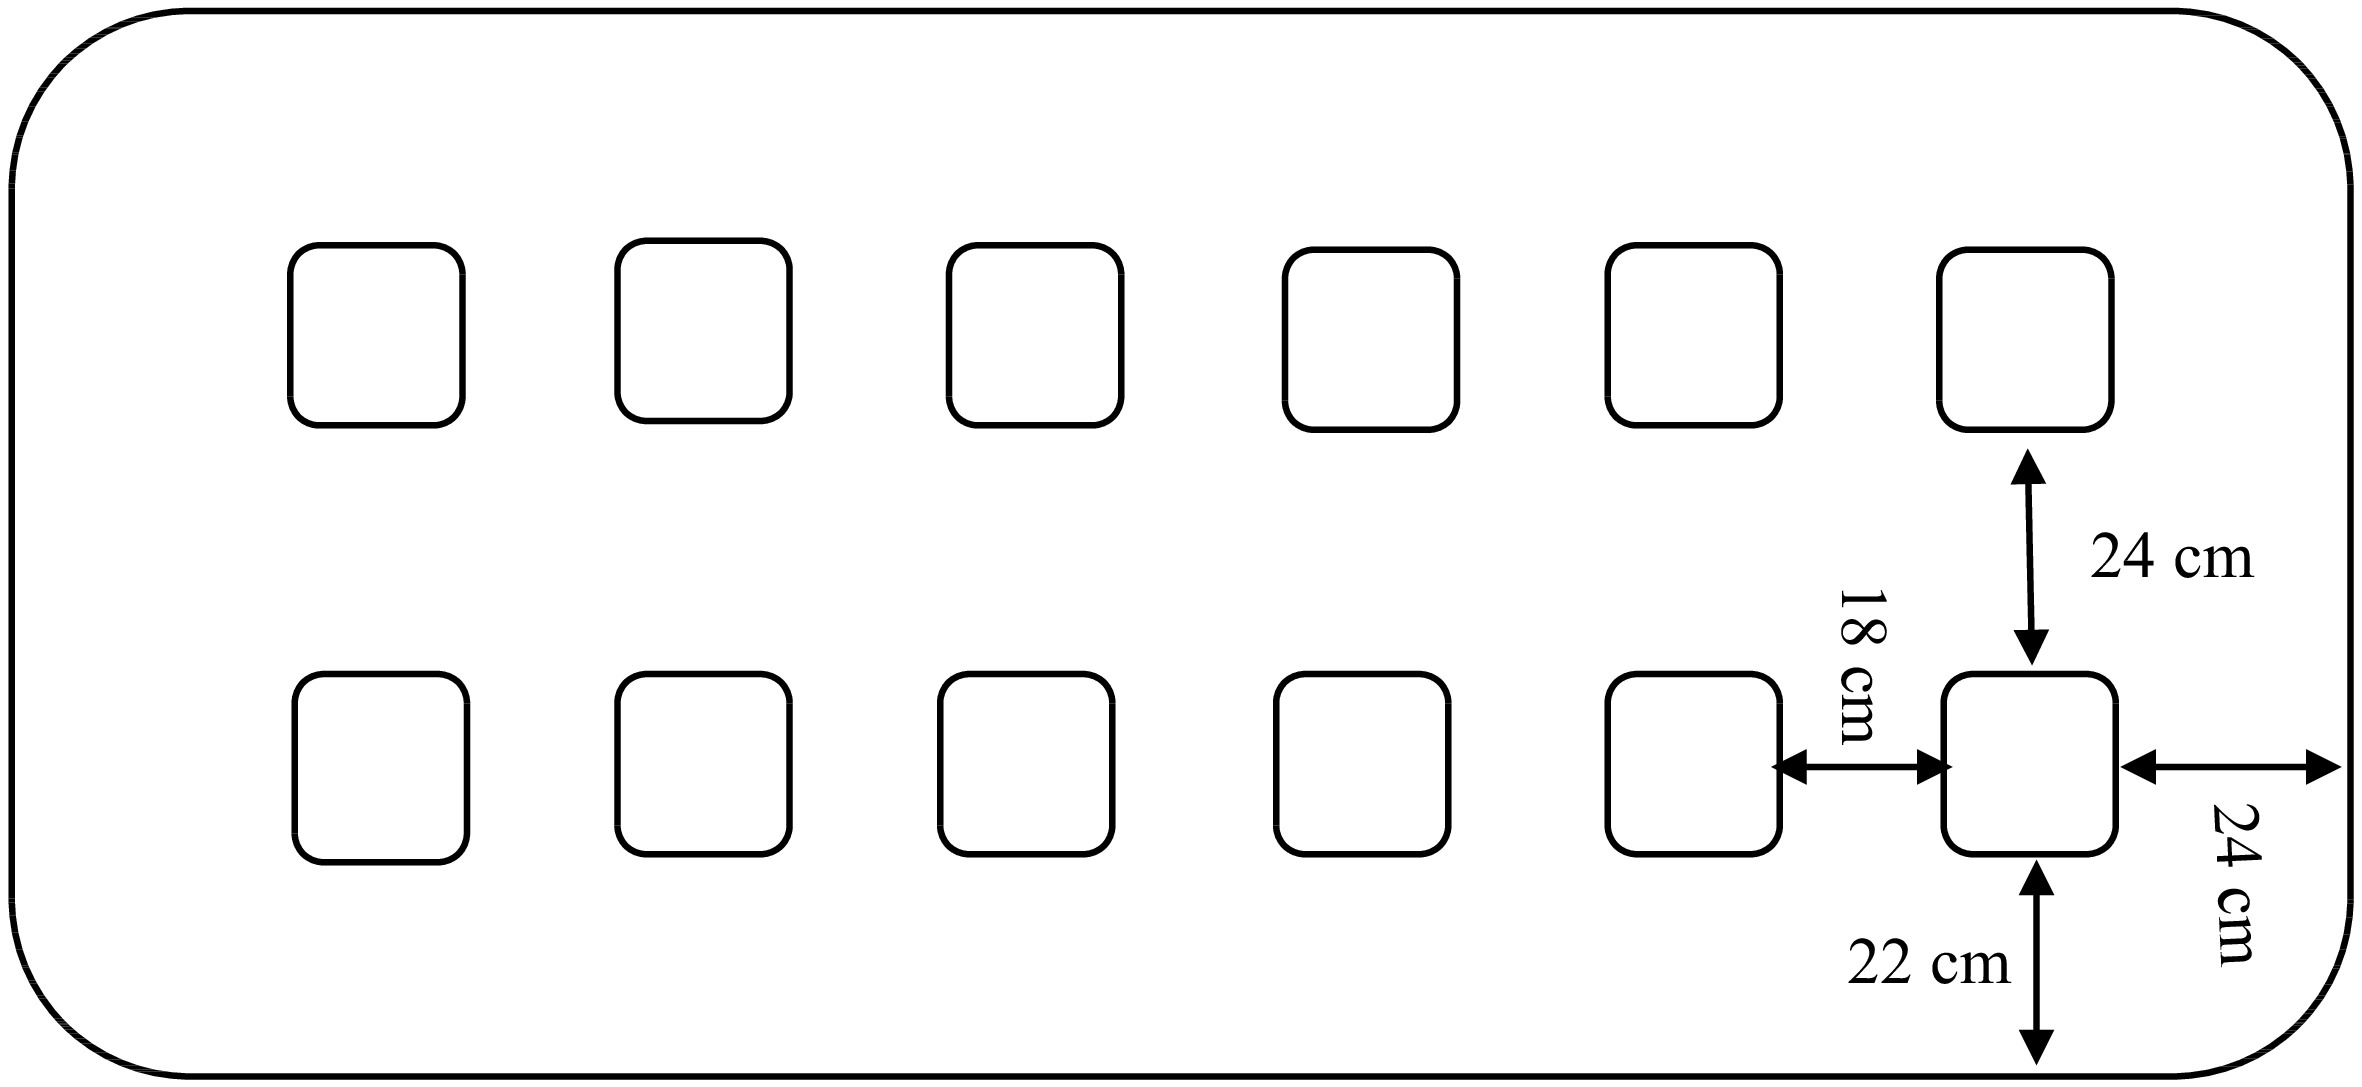
Figure 1.
Overview of the top lid of the device with the location of the openings for 12 glass jars containing produce.
-
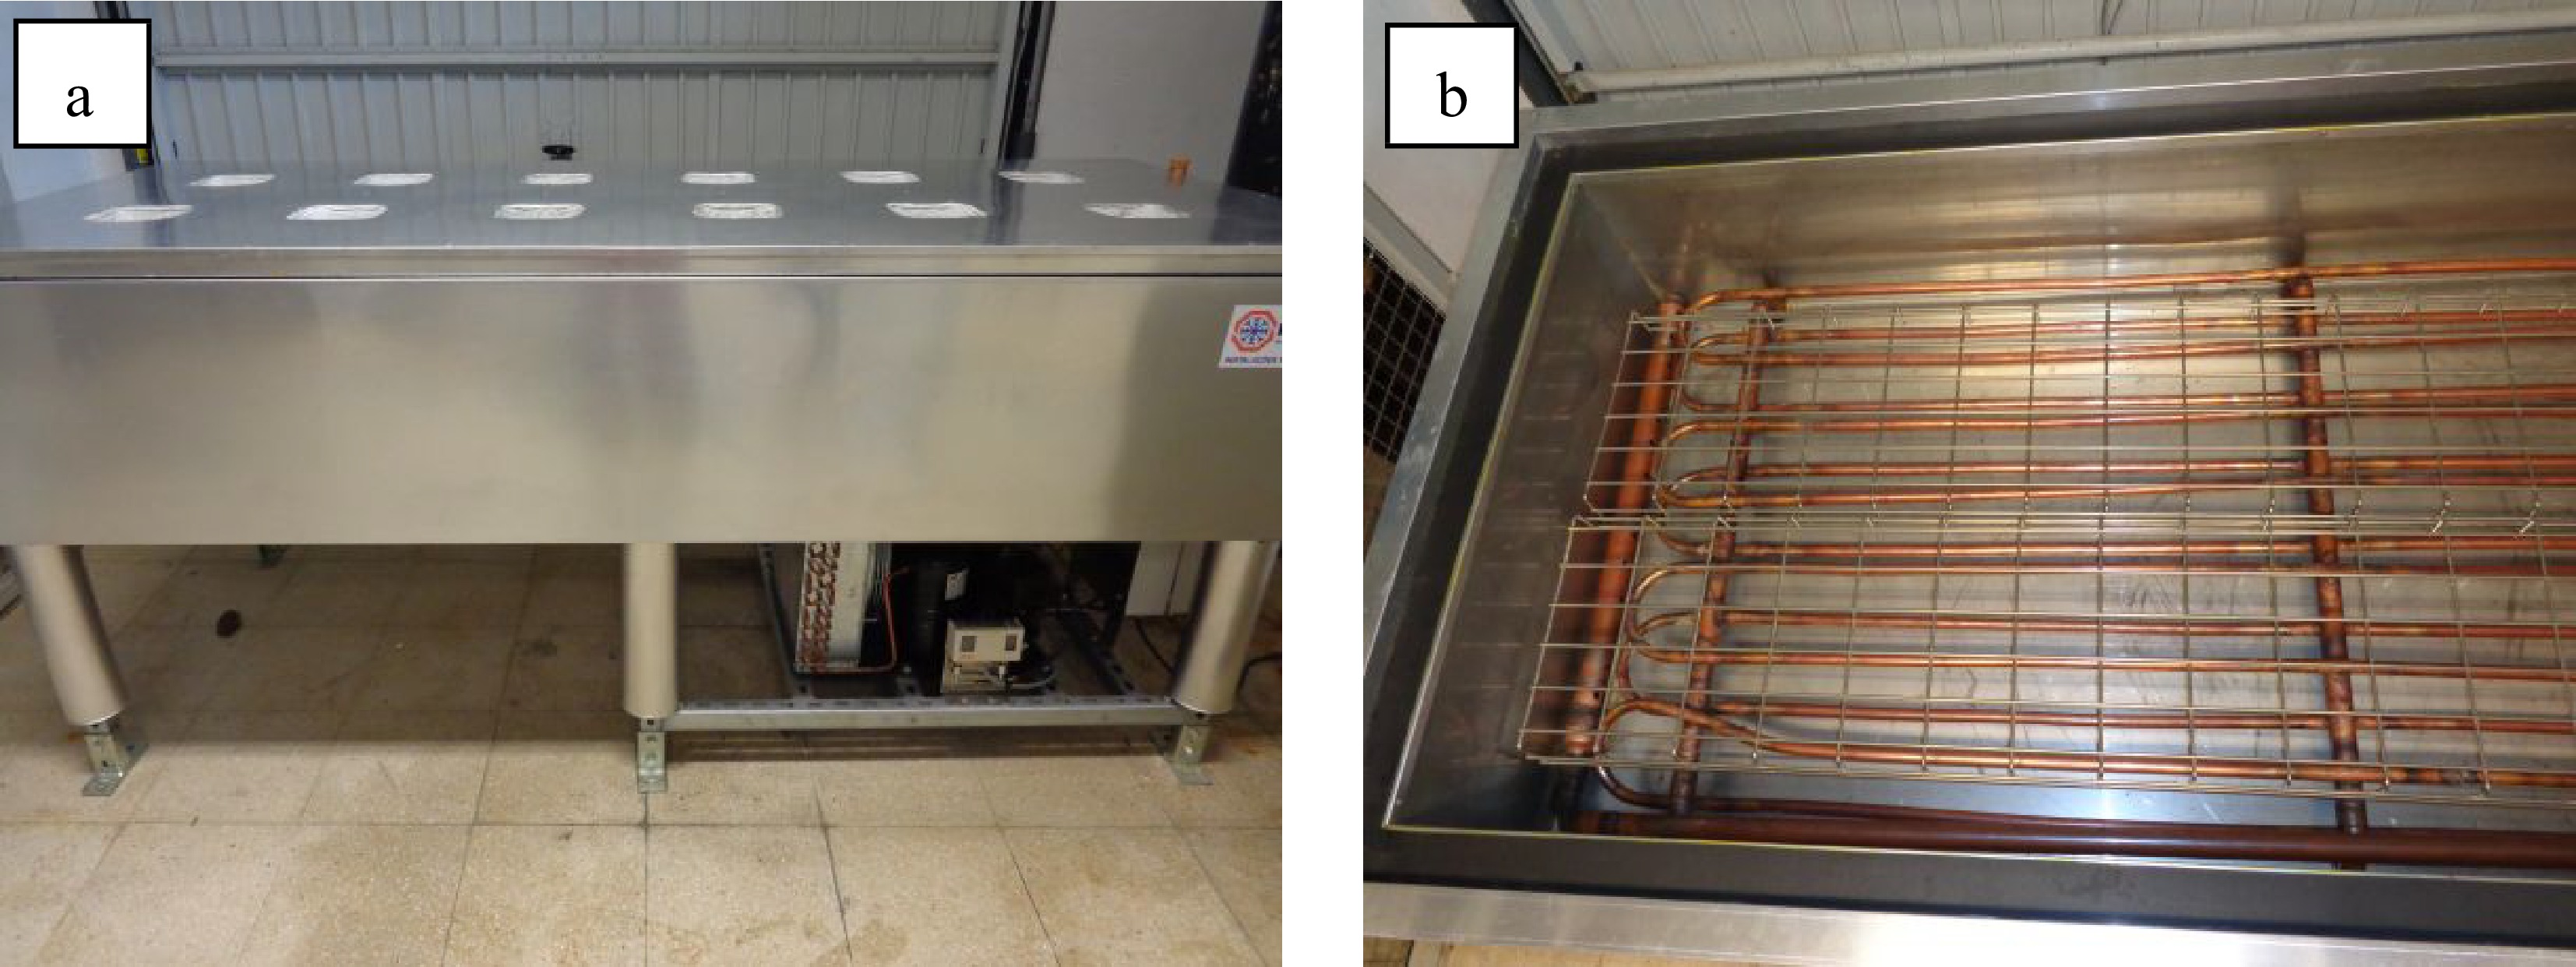
Figure 2.
(a) Overview of the device. (b) Internal view of the gas expansion tubes immersed in the glycol solution.
-
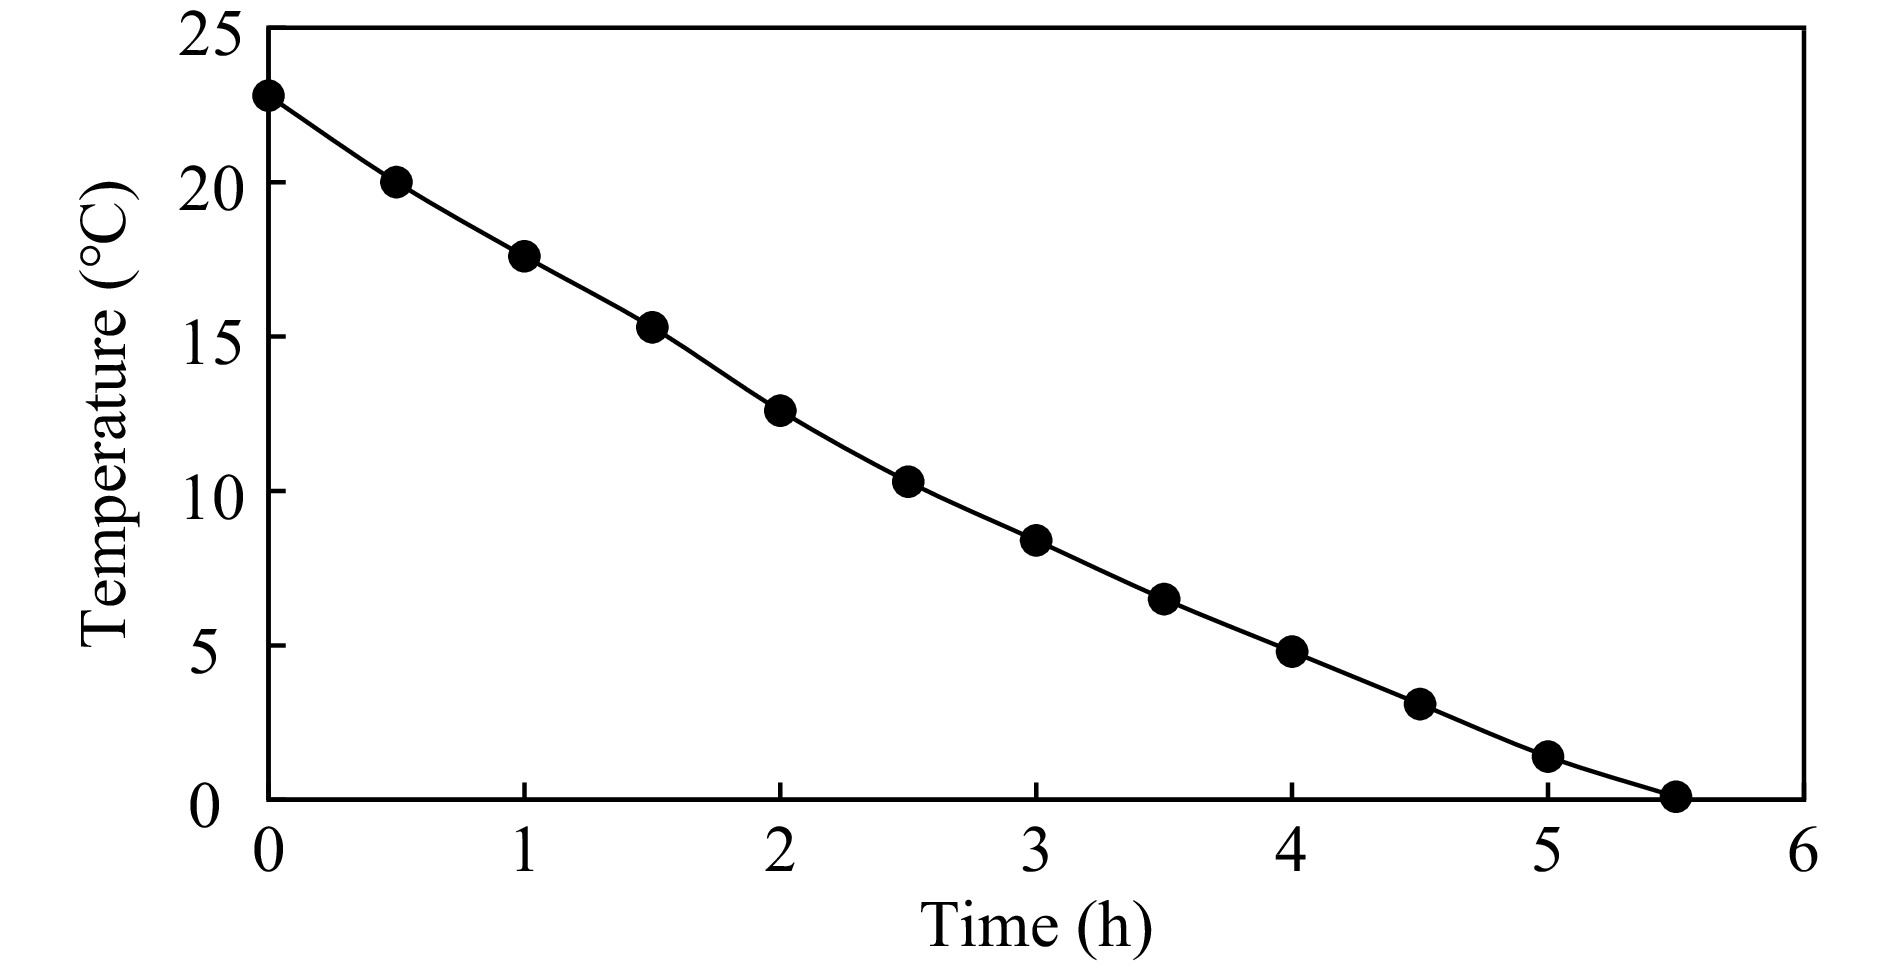
Figure 3.
Cooling rate of the glycol solution and uniformity of temperature inside the container.
-
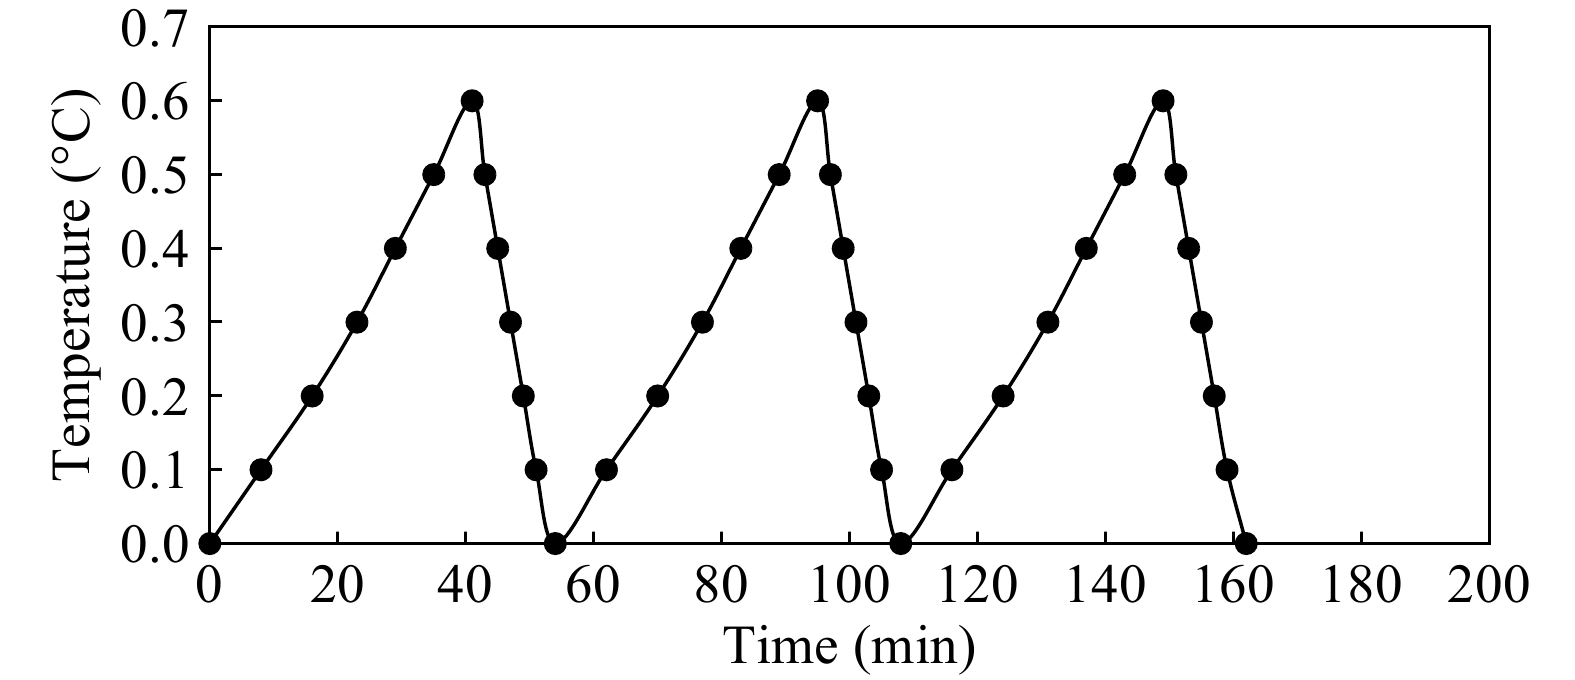
Figure 4.
Fluctuation of the temperature of the glycol solution around the set point of the refrigeration unit.
-
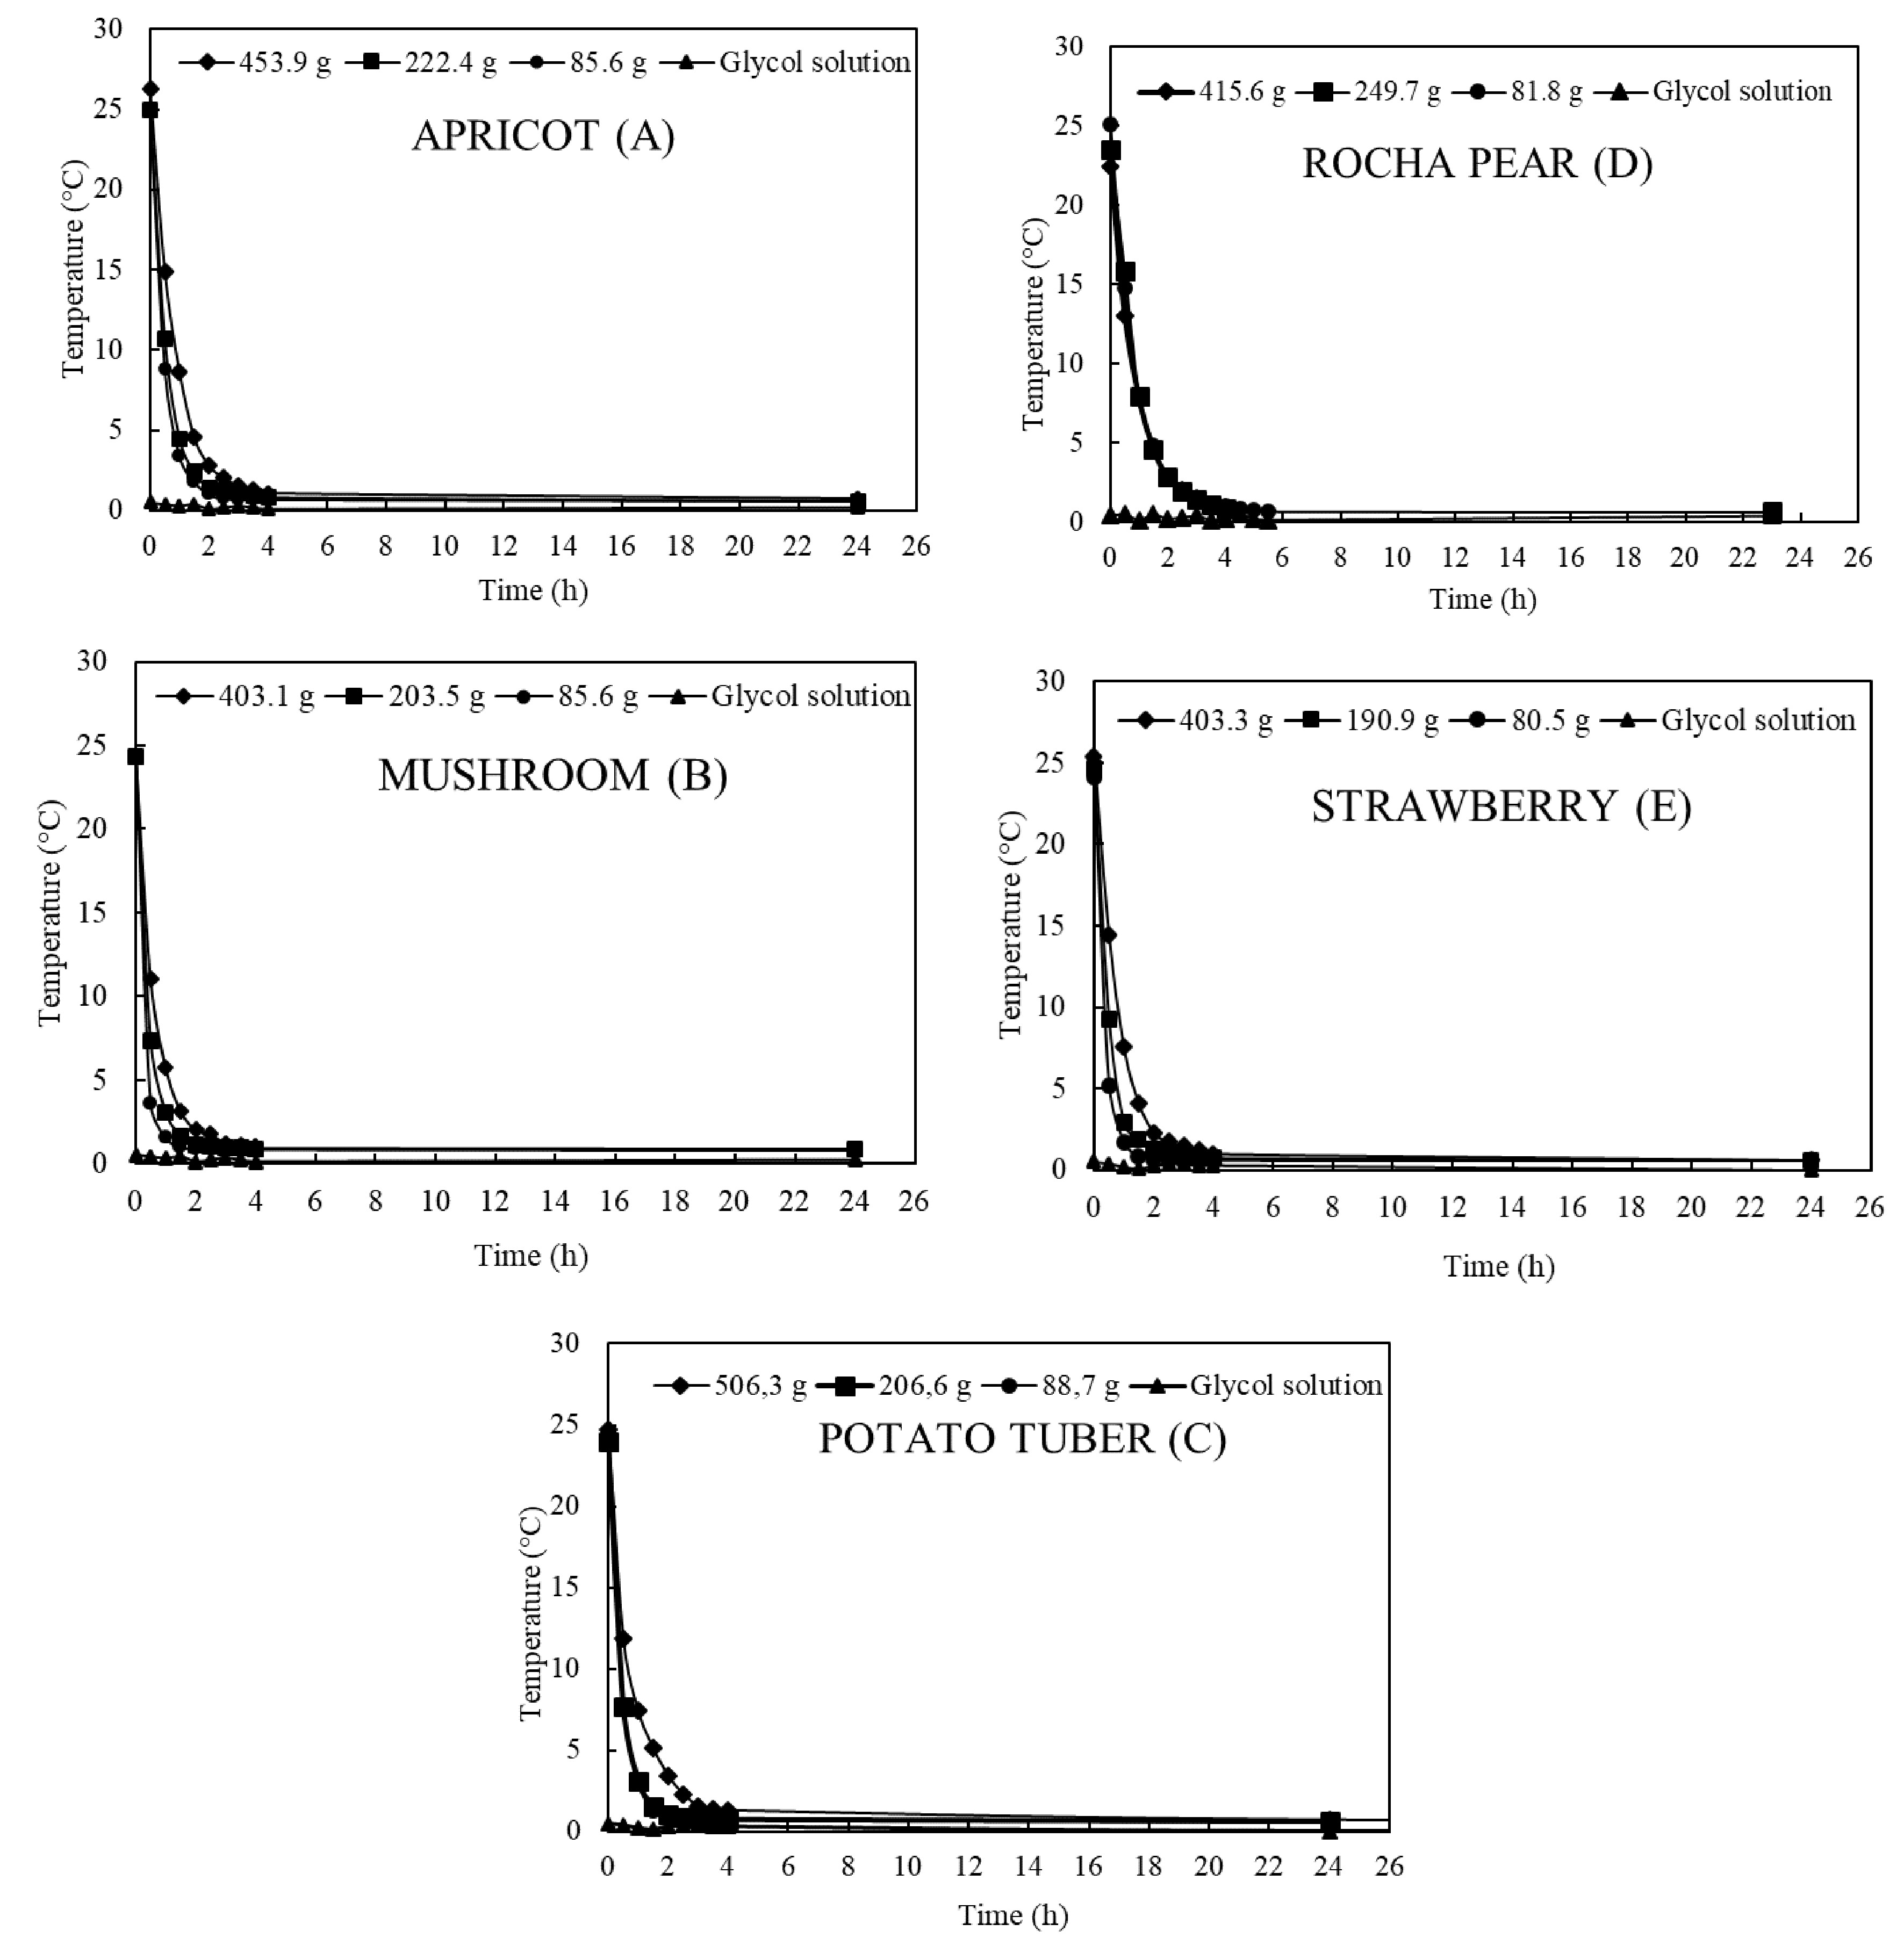
Figure 5.
Cooling rate of (a) apricot fruit, (b) white mushroom, (c) potato tuber, (d) pear fruit and (e) strawberry fruit according to their respective sample mass ranges.
-
Plant material Sample mass per range (g) Diameter (mm) (1) (2) (3) Apricot 85.6 222.4 453.9 40–45 White mushroom 85.6 203.5 403.1 30–40 Potato 88.7 206.6 506.3 28–32 Pear 81.8 249.7 415.6 55–60 Strawberry 80.5 190.9 403.3 28–32 Table 1.
Mass and size of product samples used in the experiments.
-
Commodity Initial
temperature
of samples (°C)Glycol
temperature
(°C)Time to 7/8 cooling (h) (1)* (2) (3) Apricot 25.4 0.3 1.00 1.25 1.90 White mushroom 24.3 0.3 0.75 1.00 1.50 Potato tuber 24.4 0.3 1.00 1.00 2.25 Pear 23.7 0.3 2.00 2.00 2.00 Strawberry 24.7 0.3 0.75 1.00 1.75 * Sample mass range (1) 80.5 to 88.7 g, (2) 190.9 to 249.7 g, and (3) 403.1 to 453.9 g. Table 2.
Initial temperature of samples, glycol, and time to 7/8 cooling.
-
Commodity C (h−1) R (°C·h−1) t1/2 (h) (1)* (2) (3) (1) (2) (3) (1) (2) (3) Apricot 2.2 1.7 1.2 55.5 45.0 30.0 0.3 0.4 0.6 White mushroom 4.0 2.5 1.6 95.8 59.0 38.6 0.2 0.3 0.4 Potato tuber 2.4 2.4 1.5 57.6 57.2 36.6 0.3 0.3 0.5 Pear 1.1 0.8 1.1 23.8 17.7 24.4 0.7 0.9 0.6 Strawberry 3.2 2.0 1.2 79.4 50.0 28.8 0.2 0.3 0.6 * Sample mass range (1) 80.5 to 88.7 g; (2) 190.9 to 249.7 g, and (3) 403.1 to 453.9 g. Table 3.
Cooling coefficient (C), instantaneous cooling rate (R) and half time cooling (t1/2) of samples.
-
CommodityMoisture
(%)Specific heat
(kJ·kg−1·°C−1)Respiration
heat at 0 °C
(kJ·kg−1·d−1)Density
(kg·m−3)Apricot 86.3 3.9 1.4 1,012−1,322I Mushroom 91.8 4.0 9.4 460−650II Potato tuber 78.9 3.7 1.6* 1,050−1,250III Pear 83.8 3.8 1.3 991−1,144III Strawberry 91.6 4.0 3.9 1,043IV * Respiration heat at 5 °C. I[12], II[13,14], III[15], IV[16].
Figures
(5)
Tables
(4)