-
Food quality is a complex concept and depends on a range of physical, chemical, biochemical, physiological, and microbial processes. The laws of thermodynamics determine the direction of changes in food systems, but the knowledge of their rates requires knowledge of the kinetics[1]. Temperature is a key factor in determining the kinetics of food quality changes. Arrhenius' law and Arrhenius-like models, as well as empirical rules such as the van't Hoff rule of the parameter Q10 are used to describe the effect of temperature on the rate of quality changes[1]. Knowing the temperature dependence of kinetic rate is essential to understand food quality, shelf life, food safety, and to develop and correctly apply many food processing or preservation technologies. Perishable fruits and vegetables require prompt and rapid cooling after harvest to reduce their metabolic rate, water loss, and development of decay[1,2]. Cooling rates and keeping temperatures are therefore key independent variables that affect food quality characteristics, with particular relevance in fruits and vegetables. However, addressing some research objectives related to temperature effects on products in standard cold rooms or cooling systems can be cumbersome, due to limitations regarding: i) optimization of temperature conditions; ii) optimization of cooling rates; and iii) use of extreme test conditions. Therefore, experimental devices that provide fast cooling rates, high temperature uniformity, and thermal inertia can be very useful in the study of temperature effects on fresh produce.
Cooling and subsequent temperature maintenance at the recommended levels during transportation or storage have long been known to be the most effective means of extending postharvest life of fresh fruits and vegetables[3]. Refrigeration is effective as a postharvest technology because low temperature reduces most causes of losses by slowing metabolic rates, compositional changes, water loss and decay development[4, 5]. The removal of sensible heat, also known in the postharvest context as field heat, requires a much greater refrigeration capacity than holding produce at a constant temperature[6, 7]. In postharvest situations, heat removal is often referred to as precooling to emphasize that produce should be cooled prior to transportation or storage[8]. Since precooling is the actual cooling and not an operation prior to cooling, the phrase rapid cooling is used instead in this work. Specific methods and equipment for rapid cooling of different fruits and vegetables have been developed[5, 7, 8] in addition to standard room cooling: forced air-cooling, hydro-cooling, ice cooling, and vacuum cooling.
In addition to the compatibility between the cooling system and fruits and vegetables, the design and operation of cooling systems for the specific product requires the accurate calculation of heat loads and cooling rates. The heat to be removed per unit mass of product (Q) to cool it from the initial temperature Ti to a final Tf depends on the specific heat (Cp), as described in Eqn 1.
$ Q = {C_p}({T_i} - {T_f}) $ (1) The cooling rate is a key determinant not only of the product heat load, but of the duration of operations and the quality and postharvest life of produce. Cooling rates can be effectively described by the calculation of the cooling coefficient (C) and the half-cooling time (Z)[8].
The cooling ratio (sin. temperature ratio, Y) is the unaccomplished temperature change as a percentage of the total cooling possible in the system. This ratio is calculated by Eqn 2, where, T is the flesh temperature (°C) at the time t (h), T0 is temperature in the cooling fluid (°C), and Ti is the initial temperature of the flesh (°C).
$ Y = \dfrac{{T - {T_0}}}{{{T_i} - {T_0}}} $ (2) Cooling time may also be predicted using the cooling coefficient. The cooling coefficient indicates the change in the fractional unaccomplished temperature difference between the product and its environment per unit change in cooling time[8]. Under the non-Newtonian heat transfer conditions that often occur in postharvest situations, C is calculated using Eqn 3, where the subscripts for Y and t indicate sampling times:
$ C = \dfrac{{\ln {Y_1} - \ln {Y_2}}}{{{t_1} - {t_2}}} $ (3) The half-cooling time (t1/2) is time required to reduce the temperature difference between the product and the refrigeration fluid by one-half, and is calculated from the cooling coefficient (Eqn 4):
$ t_{1/2}=\dfrac{\ln (1/2)}{C}$ (4) The instantaneous cooling rate (R, expressed in °C·h−1) is calculated with Eqn 5:
$ R = C \cdot (T - {T_0}) $ (5) The time required to remove one-half of the difference between the initial flesh temperature and the temperature of cooling medium is known as the half cooling time. This value remains constant for the particular set of cooling conditions from which it was determined[7, 9].
For best quality and storage life, harvested produce should be rapidly cooled to seven-eighths of the difference between the initial flesh temperature and that of the cooling fluid. Additional cooling to the final storage or transportation temperature is achieved in the cold rooms or transport containers[7, 9, 10].
Here we describe a laboratory-scale device engineered by us to study the cooling rates of several fruits and vegetables as affected by the product type, sample mass and size. The equipment can be used for several other experiments under controlled temperature and if is necessary it allows to control the atmospheres inside the jars.
-
A stainless steel (1.5 mm thick) container with internal dimensions of 1,960 mm × 800 mm × 330 mm (L × W × H) and an internal free volume of 500 L is insulated with polyurethane (80 mm; density of 70 kg·m−3) covered by an external aluminum sheet of 0.6 mm thick. Liquid (water or a glycol solution) within the container is circulated through a chiller for heat removal. The use of a glycol solution at 10% allows operation at temperatures below 0 °C without freezing.
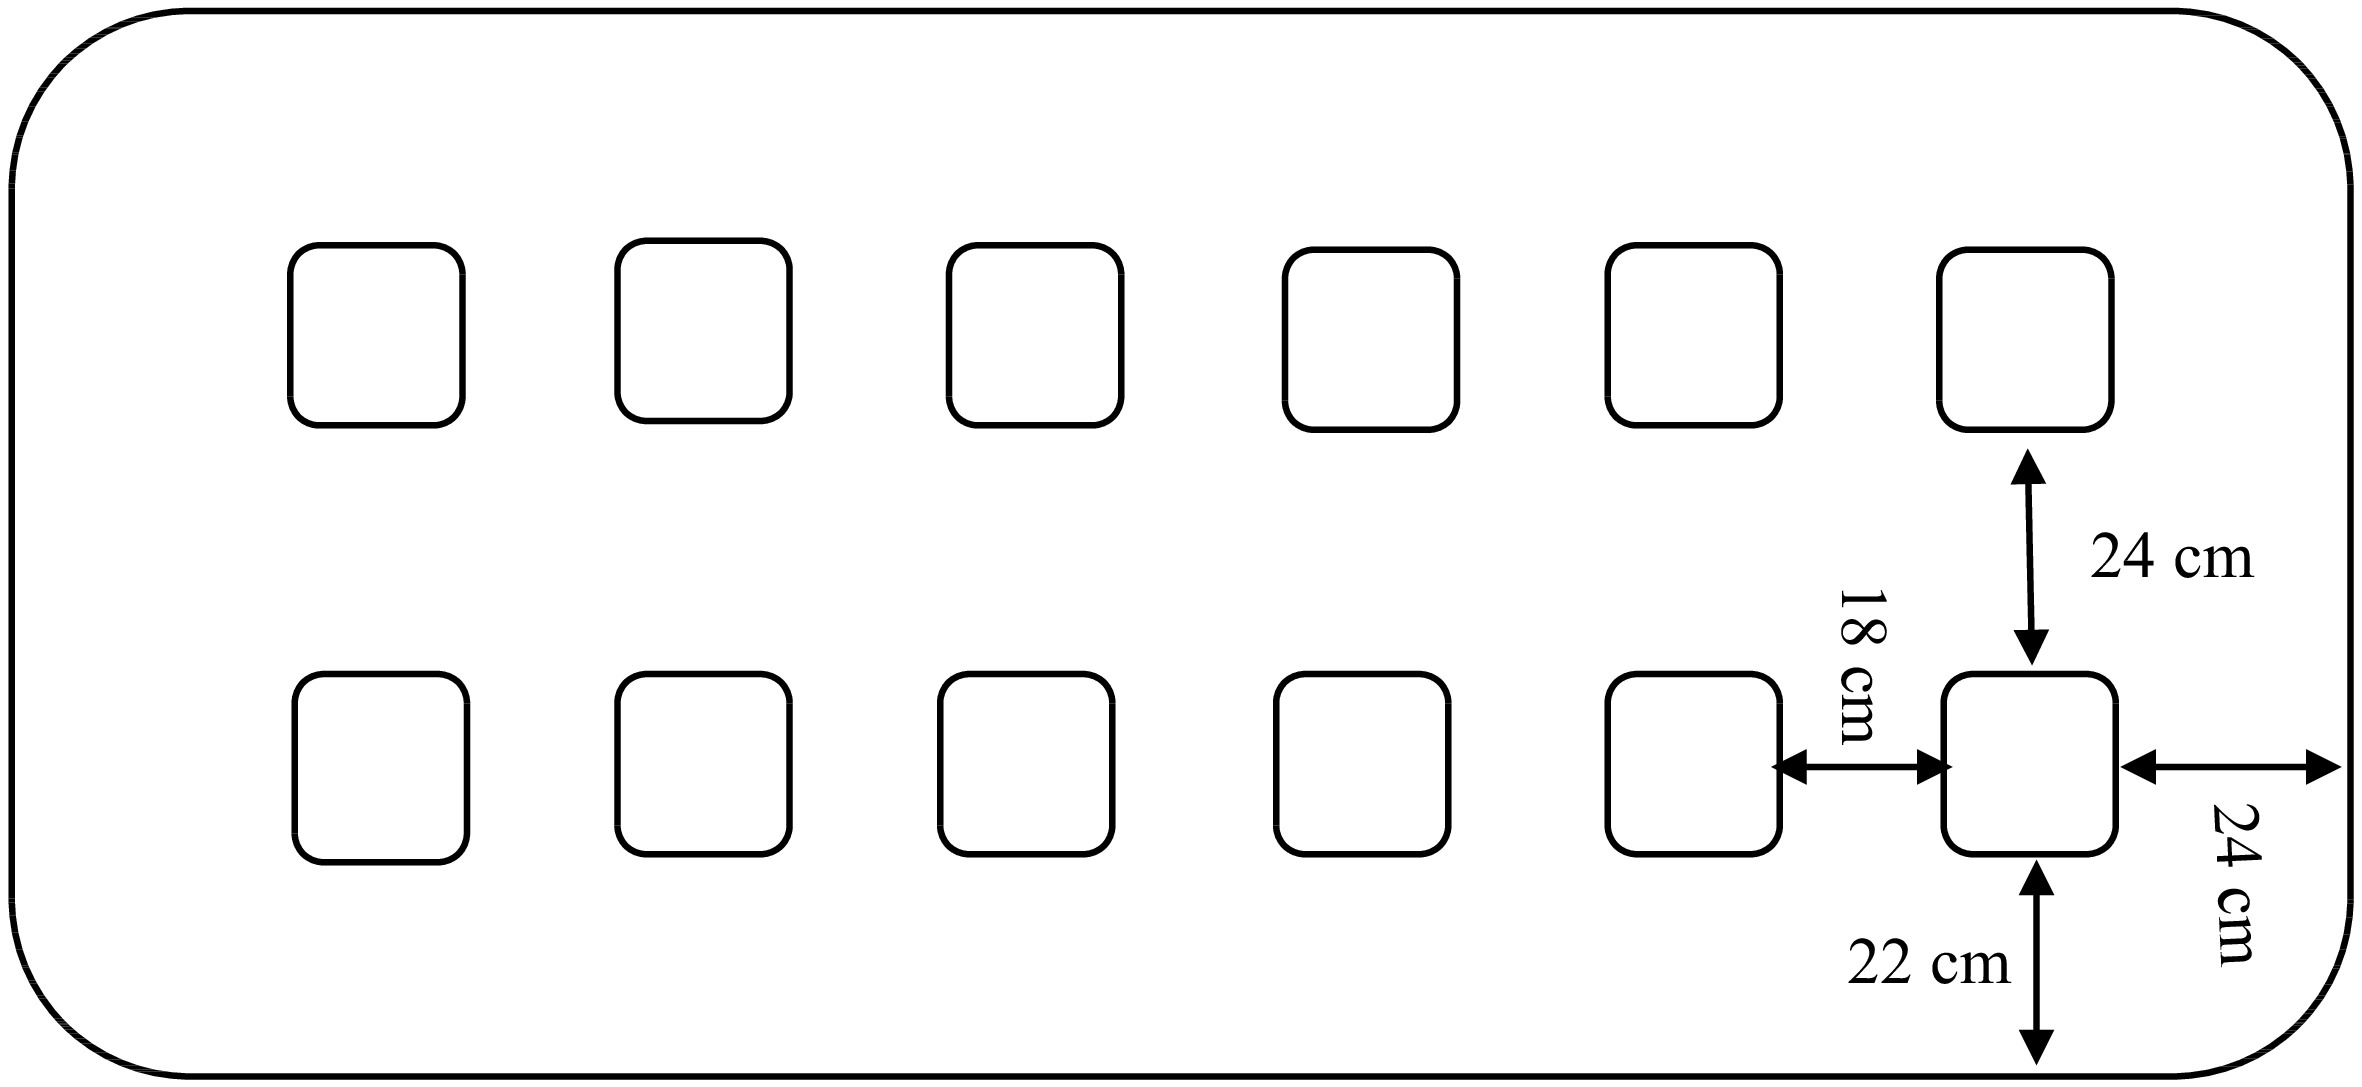
The top lid of the container is a 55 mm-thick polyurethane panel covered with aluminum sheet (0.6 mm thick) and 12 openings (140 mm × 140 mm), where the glass jars are inserted. The openings for the glass jars are sealed and thermally isolated to avoid external room temperature interference.
The system is equipped with a Universal Transfer Switch (UPS) water pump (25−120 Grundfos Pumps Corporation, Downers Grove, USA) with a maximal pressure of 10 bar, operating temperature ranging from −25 °C to +95 °C, and energy class F. The pump circulates water or a glycol solution though a closed circuit of perforated copper tubes, operating with a flow rate of 1.8 m3·h−1. The glycol solution is taken up from one end of the container forced into the chiller and injected into the container at the opposite end, creating a continuous flow.
The refrigeration system is composed by a condensation unit using air as the cooling fluid (UNT 6222 6K, Embarco) with a refrigeration capacity of 1.42 kW, operating with aspiration at −10 °C and 32 °C ambient, 0.75 kW of electrical power, and a service tension of 230/1/50 Hz. A static evaporator of copper tubing (external diameter of 1.2 cm). The system uses the refrigeration fluid R 404a.
Additional equipments in the mechanical refrigeration system include a drying filter, a pressure switch, a digital thermometer sensor, an electric valve, and circulation valves. The aspiration tube is insulated with Armaflex® foam. An electric board controls the functioning of the equipment.
Glass jars (12 units) with volume of 2.15 L each are placed on two equidistant rows inside the container. The jars have a glass lid sealed with a rubber O-ring and contain gas tight valves in the Teflon tubes to control internal atmospheres if necessary. Figure 1 shows an overview of the top lid with glass openings and their dimensions.
-
The device was tested for cooling rate of a glycol solution, temperature uniformity, and temperature fluctuation around the set point of the refrigeration unit.
Cooling rate of the glycol solution
-
The container is filled with 450 L of glycol solution at 10%. The temperature of the glycol solution was measured at 30 min intervals at 5 and 20 cm depth in the 12 sampling points (Figs 1 & 2) with a digital thermometer probe (model Checktemp 1, Hanna Instruments, Woonsocket, USA), with maximal deviation of 0.2 °C.
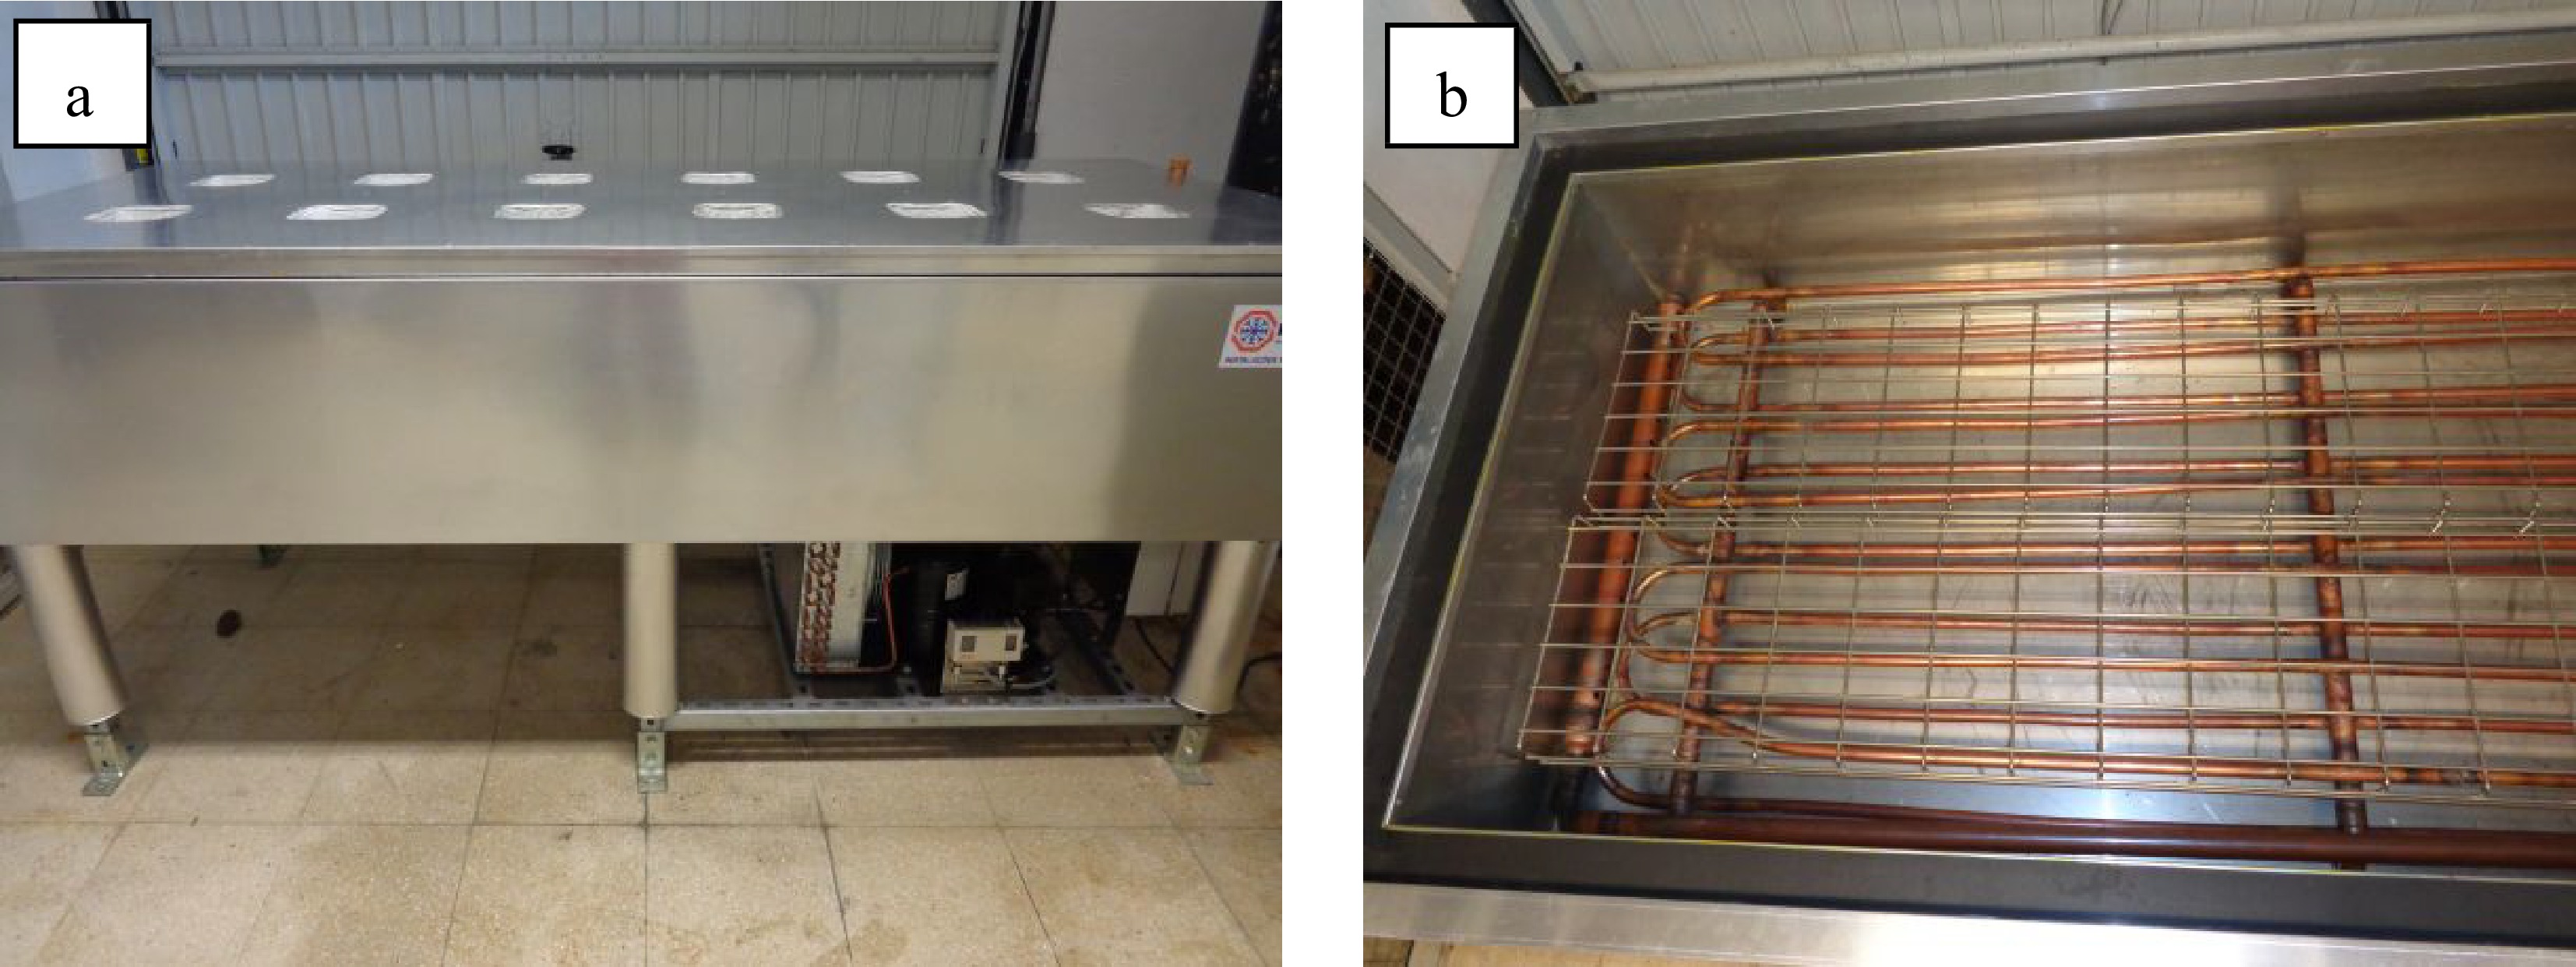
Figure 2.
(a) Overview of the device. (b) Internal view of the gas expansion tubes immersed in the glycol solution.
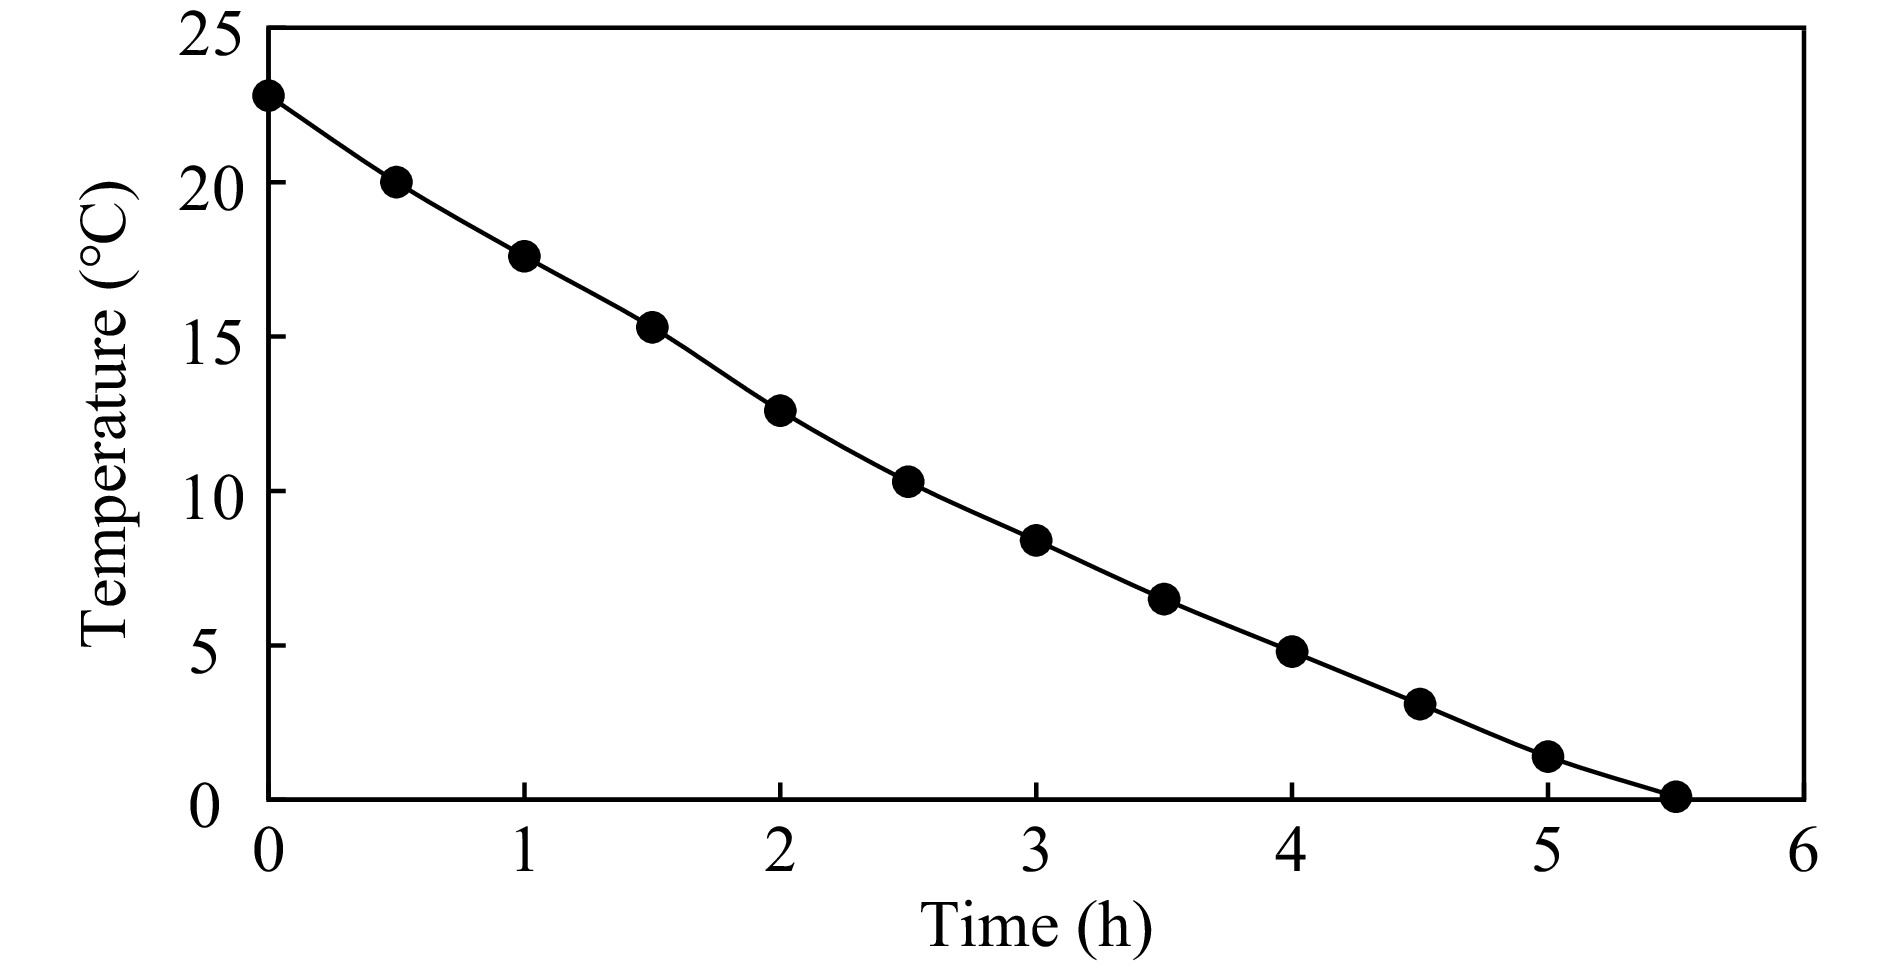
A glycol solution with an initial temperature of 22.8 °C cooled to 0 °C in 5.5 h, corresponding to a cooling rate of 4.14 °C·h−1 (Fig. 3).
Temperature uniformity in the container
-
Temperature was measured in 12 sampling points located as described in Fig. 1. Temperature values were equal in all locations and during the cooling period, i.e. temperature uniformity with the container was 100%. Therefore, the cooling curves of all sampling points are overlapped in Fig. 3.
Temperature fluctuation around the set point
-
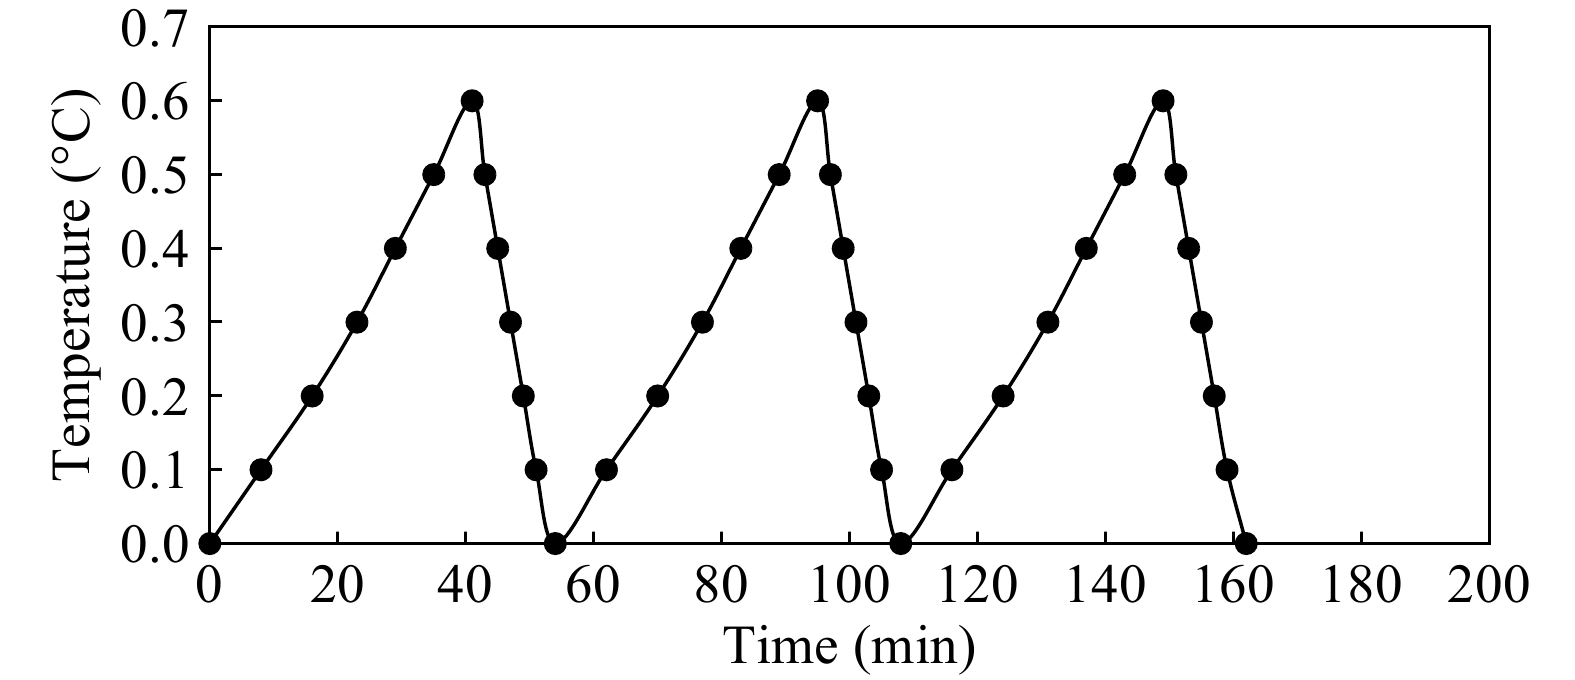
After cooling of the glycol solution to 0 °C, temperatures were measured at the 12 sampling locations. All openings for glass jars were properly isolated to eliminate the interference of the environmental heat. The time required for each temperature change of 0.1 °C was registered. The temperature of the glycol solution increased from 0 to 0.6 °C in 41 min, after which time the thermostat was automatically activated and the solution cooled from 0.6 to 0 °C in 13 min. This 54 min cycle was measured for a 24 h-period (Fig. 4). The system allowed a maximal temperature fluctuation of 0.6 °C of the glycol solution around the set point of the refrigeration unit, considered a low range of fluctuation (Fig. 4).
-
'Rocha' pear (Pyrus communis), 'Camarosa' strawberry (Fragaria × ananassa), 'Farbaly' apricot (Prunus armeniaca) fruit, and 'Maris Peer' white potato tuber (Solanum tuberosum) and white mushroom (Agaricus bisporum) were used in the experiments. Cooling of each product was performed at three sample mass ranges named (1) 80 to 89 g, (2) 190 to 250 g and (3) 403 to 506. Mass and size (grade) of produce samples are indicated in Table 1.
Table 1. Mass and size of product samples used in the experiments.
Plant material Sample mass per range (g) Diameter (mm) (1) (2) (3) Apricot 85.6 222.4 453.9 40–45 White mushroom 85.6 203.5 403.1 30–40 Potato 88.7 206.6 506.3 28–32 Pear 81.8 249.7 415.6 55–60 Strawberry 80.5 190.9 403.3 28–32 Experimental cooling conditions and temperature measurements
-
The products were cooled in a custom-made experimental device at the Freshness Lab, Instituto Superior de Agronomia, University of Lisbon, Portugal[11]. Product samples with different mass (Table 1) were placed inside of 2.15 L glass jars immersed in a 10% glycol solution previously cooled to 0 °C. Six replicate glass jars were used for pear, strawberry and potato, and three replicate jars were used for apricot and mushroom.
Temperature was measured at 30 min intervals with a digital thermistor thermometer (model Checktemp 1, Hanna Instruments, Woonsocket, RI, USA), while maintaining the samples inside the immersed glass jars. The thermometer probe was inserted into a fruit, tuber or mushroom with the tip near the center of the organ. Four temperature measurements were made for each replicate and sampling time. Different individual product pieces were punctured at each sampling measurement. The temperature of the glycol solution was measured at regular intervals in the 12 sampling points at a depth of 15 cm.
Cooling calculations
-
Cooling parameters were calculated from the direct temperature measurements. The cooling ratio (Y) was calculated using Eqn 2, the cooling coefficient (C) was calculated using Eqn 3, the half-time of cooling (t1/2) was calculated from the cooling coefficient (Eqn 4) and the instantaneous cooling rate (R) was calculated using Eqn 5.
-
Samples with initial temperature of 25.4 °C cooled with coefficients of 2.2, 1.7, and 1.2 h for mass ranges 1, 2 and 3, respectively (Fig. 5a). Apricots had higher flesh temperature than the other produce, even when subjected to the same initial room temperature (Table 2). In this fruit, the stone can act as a thermo-accumulator keeping the fruit flesh at higher temperature than the surface. The time to 7/8 cooling of apricots was similar for sample mass range 1 (85.6 g) and sample mass range 2 (222.4 g) but longer in the sample mass range 3 with 454 g (Table 3).
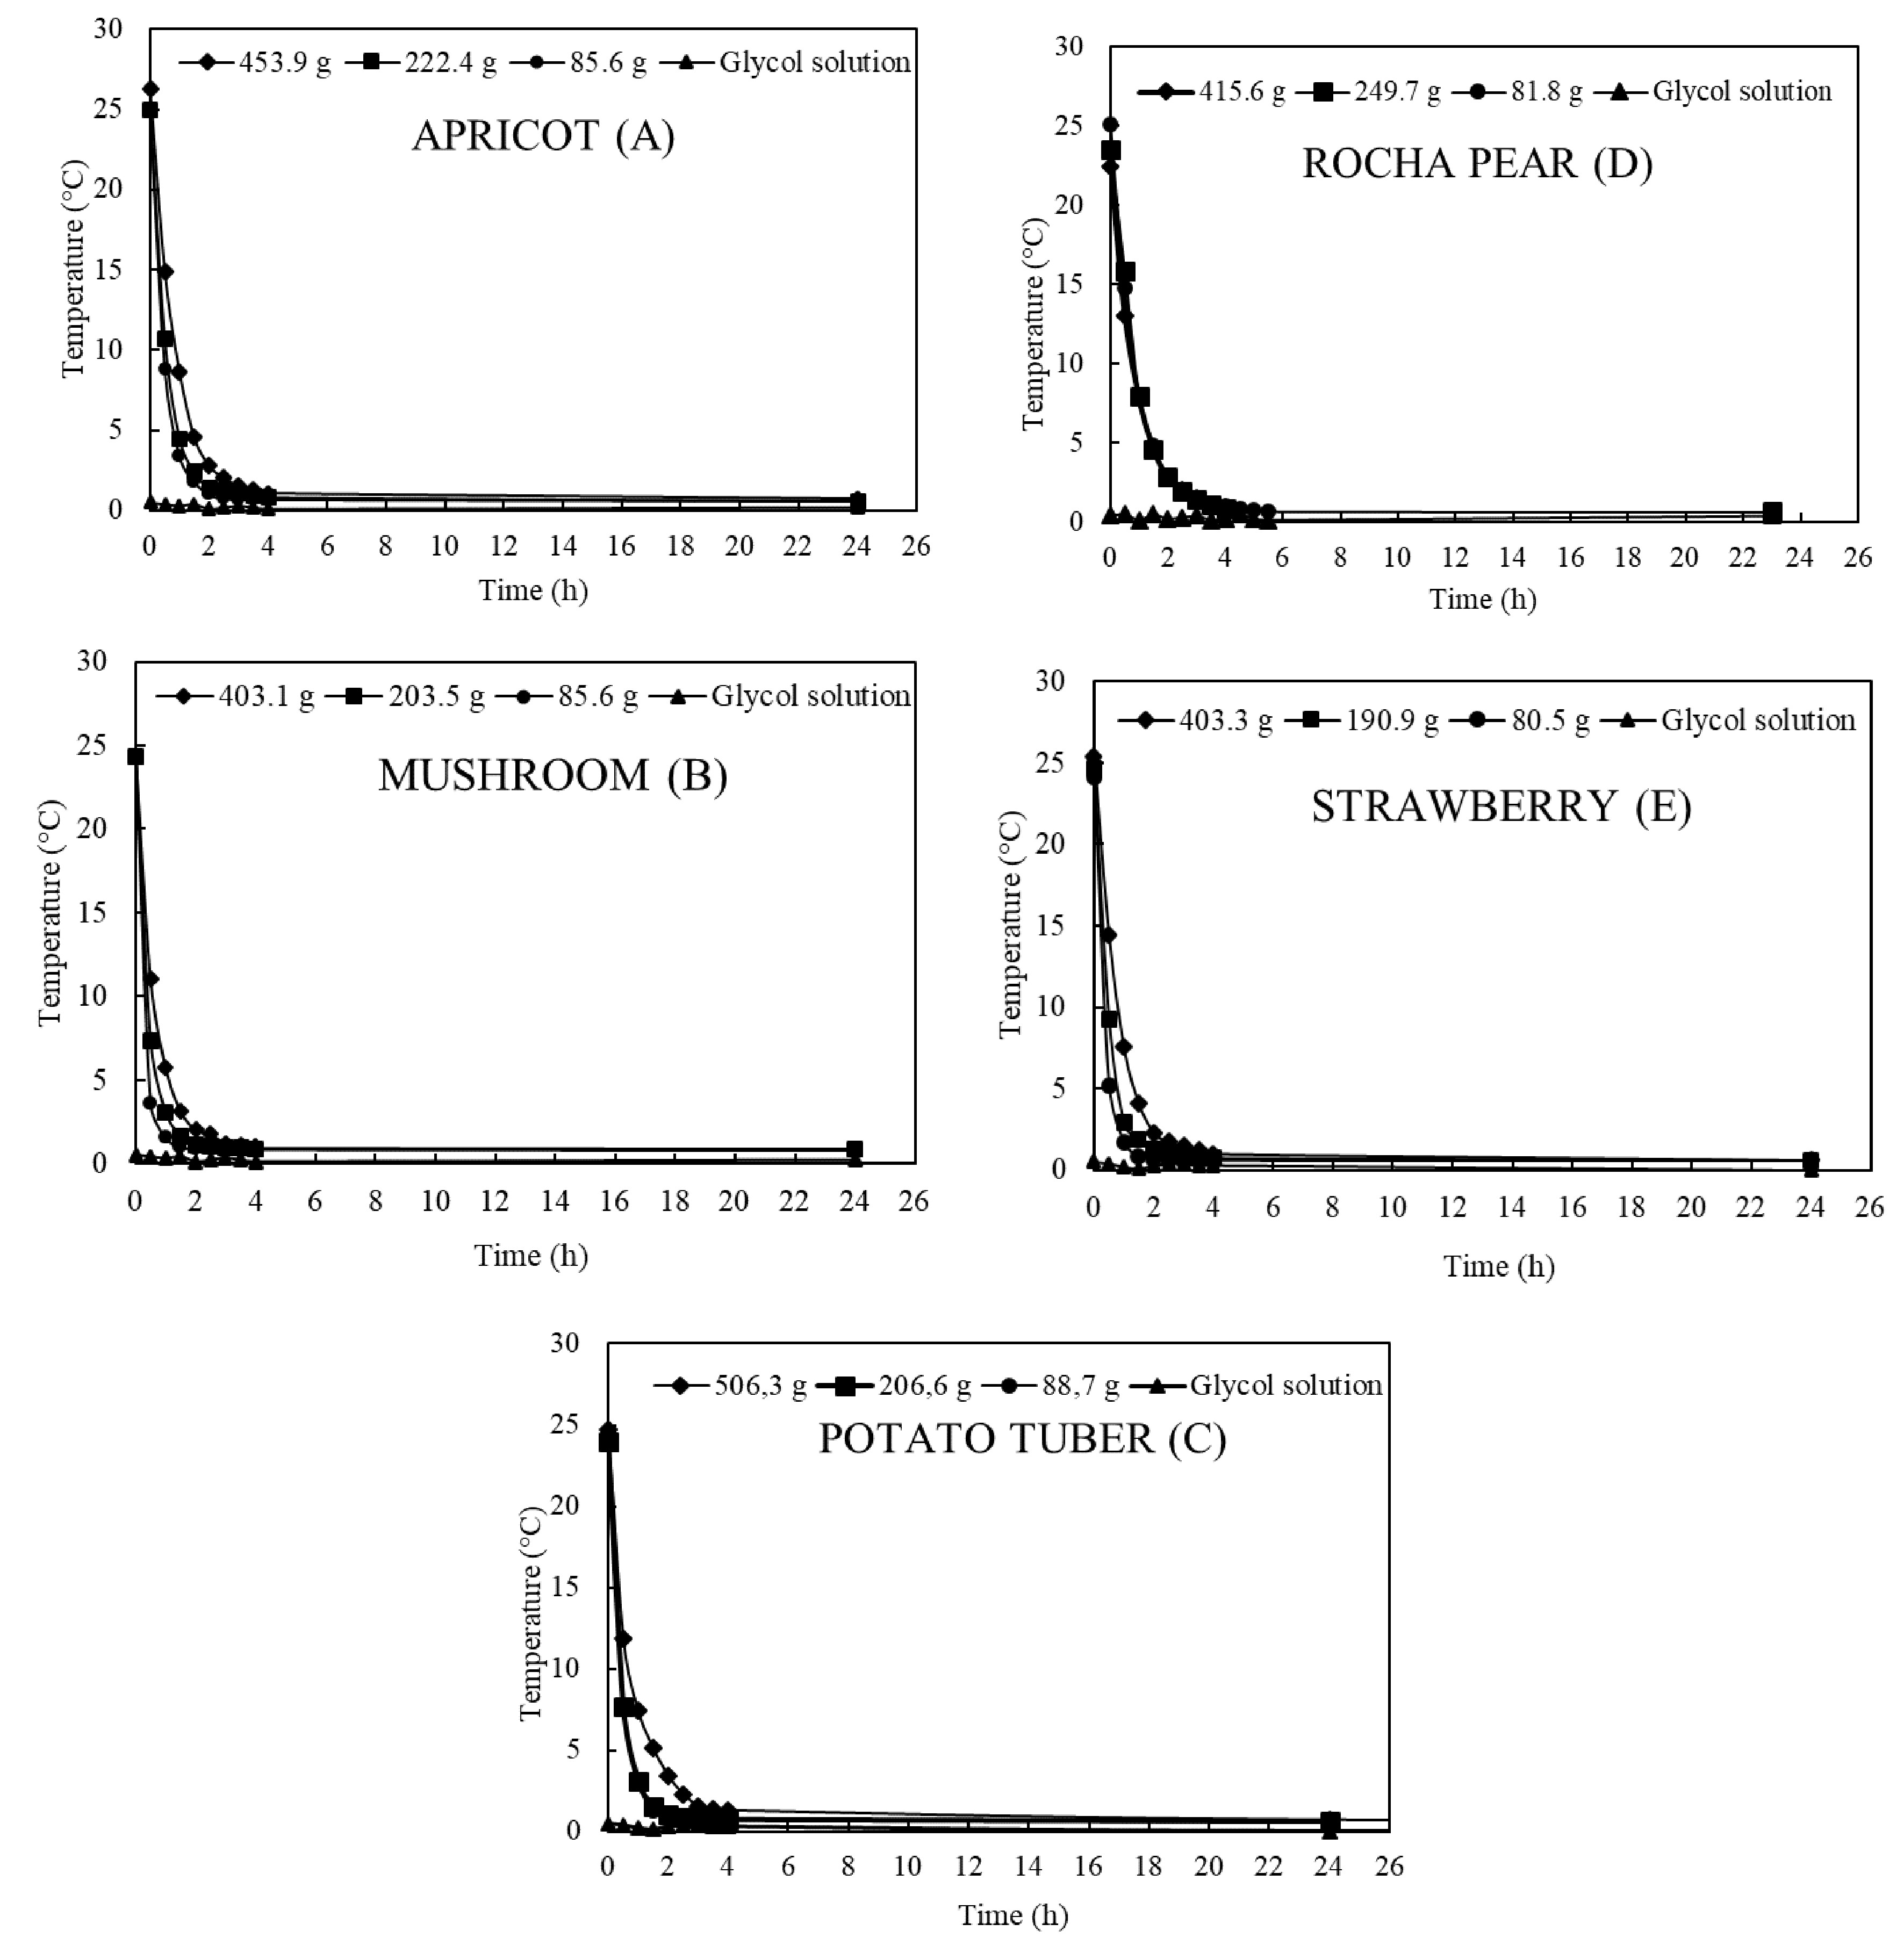
Figure 5.
Cooling rate of (a) apricot fruit, (b) white mushroom, (c) potato tuber, (d) pear fruit and (e) strawberry fruit according to their respective sample mass ranges.
Table 2. Initial temperature of samples, glycol, and time to 7/8 cooling.
Commodity Initial
temperature
of samples (°C)Glycol
temperature
(°C)Time to 7/8 cooling (h) (1)* (2) (3) Apricot 25.4 0.3 1.00 1.25 1.90 White mushroom 24.3 0.3 0.75 1.00 1.50 Potato tuber 24.4 0.3 1.00 1.00 2.25 Pear 23.7 0.3 2.00 2.00 2.00 Strawberry 24.7 0.3 0.75 1.00 1.75 * Sample mass range (1) 80.5 to 88.7 g, (2) 190.9 to 249.7 g, and (3) 403.1 to 453.9 g. Table 3. Cooling coefficient (C), instantaneous cooling rate (R) and half time cooling (t1/2) of samples.
Commodity C (h−1) R (°C·h−1) t1/2 (h) (1)* (2) (3) (1) (2) (3) (1) (2) (3) Apricot 2.2 1.7 1.2 55.5 45.0 30.0 0.3 0.4 0.6 White mushroom 4.0 2.5 1.6 95.8 59.0 38.6 0.2 0.3 0.4 Potato tuber 2.4 2.4 1.5 57.6 57.2 36.6 0.3 0.3 0.5 Pear 1.1 0.8 1.1 23.8 17.7 24.4 0.7 0.9 0.6 Strawberry 3.2 2.0 1.2 79.4 50.0 28.8 0.2 0.3 0.6 * Sample mass range (1) 80.5 to 88.7 g; (2) 190.9 to 249.7 g, and (3) 403.1 to 453.9 g. Mushroom
-
White mushroom cooled faster in the first hours of refrigeration, including samples with mass range 3 (Table 2 & Fig. 5b). The time to 7/8 cooling was 0.75 and 1.5 h for mass range 1 and mass 3, respectively. Further cooling of samples was slow when the temperature reached about 1.0 °C with a lowest temperature of 0.6 °C achieved independently on the mass (Fig. 5b). Mushrooms has the highest cooling coefficients among the produce examined at any given mass (Table 3).
Potato tuber
-
Cooling rates of the small tubers are given in Tables 2 & 3, and Fig. 5c. Tubers with sample mass range 1 and 2 cooled to 0.9 °C with a 7/8 cooling time of 1.00 h (Table 2). An additional 2 h were required to cool sample mass range 3 to the same temperature of 0.9 °C (Fig. 5c).
Pear
-
Initial flesh temperature ranged from 22.4 to 24.5 °C depending on the day of measurements (Table 1). Results are presented in Tables 2 & 3, and Fig. 5d. Sample mass range 3 (415.6 g) and fruit flesh temperature of 22.4 °C cooled to 0.6 °C after 24 h. There were no difference in time of 7/8 cooling rate measurements among samples with different mass (Table 2). In all experiments, pear needed at least 24 h to cool flesh temperature to 0.6 °C (Fig. 5d). Pear was the product with the lowest cooling coefficient (Table 3).
Strawberry
-
Samples cooled to 0.5 °C after 24 h. Among the products tested, strawberry was the one that reached the lowest temperature (a 0.5 °C difference between product and fluid temperatures, Fig. 5e). Strawberry samples required 0.75 h, 1.00 h, and 1.75 h to 7/8 cooling in sample mass 1, 2 and 3, respectively (Table 2). This cooling time was the second fastest, after mushroom, among the produce used in the experiments (Table 2).
-
Differences in the cooling rates were observed among the product types. At a mass range of 80.5 to 88.7 g decreasing cooling rates were mushroom > strawberry > potato > apricot > pear (Table 3). At the mass range from 403.1 to 453.9 g the cooling rate differences were not as large, cooling rates in decreasing order being mushroom > potato > strawberry = apricot > pear (Table 3).
In the cooling system adopted, cooling rates and respective cooling times were a function of the i) specific heat of produce; ii) size of individual products; iii) respiration rate; and iv) contact between produce pieces and the exchange surface, and the proportion of heat transfer by conduction and convection within each jar.
Specific heat depends on produce composition and is largely determined by their water content (Table 4). Interestingly, the two fastest cooling commodities, mushroom and strawberry, were the ones with higher specific heat, suggesting that other factors have a strong effect on the cooling rate.
Table 4. Composition and specific heat[8], respiratory heat production[6] and density of fresh fruits and vegetables[12−16].
CommodityMoisture
(%)Specific heat
(kJ·kg−1·°C−1)Respiration
heat at 0 °C
(kJ·kg−1·d−1)Density
(kg·m−3)Apricot 86.3 3.9 1.4 1,012−1,322I Mushroom 91.8 4.0 9.4 460−650II Potato tuber 78.9 3.7 1.6* 1,050−1,250III Pear 83.8 3.8 1.3 991−1,144III Strawberry 91.6 4.0 3.9 1,043IV * Respiration heat at 5 °C. I[12], II[13,14], III[15], IV[16]. Strawberry and mushroom have higher specific heat and higher respiratory heat production than pear, potato, and apricot (Table 4). Strawberry and mushroom had higher cooling coefficients at the lower mass range (1) but differences among produce were attenuated by the mass range (3) (Table 3, Fig. 5).
Therefore, produce size and contact with the exchange surface or fluid seems to have a significant effect on the cooling rates that overcome differences in specific heat or respiration rate at the largest mass ranges. Smaller size of individual strawberries and mushrooms, and the higher surface contact, partially explain the differences in cooling rate. The potatoes used in these experiments had small individual size (Table 1) and lower water content than the other produce (Table 4).
A cooling gradient was observed within the pear, in contrast to small strawberry fruits. The thinner proximal region of strawberries cooled faster than the medial and wider region of pears (data not shown). Therefore, the reported values were measured in the medial region of the pear in order to give higher reliability to the results.
The temperature difference among the tested products and the refrigeration fluid after 24 h was in the range of 0.3 °C, increasing to 0.5 °C in the case of white mushroom. This difference was attributed to heat generation by respiration and to the slower heat transfer from inside the glass jars to the outside glycol solution since there was no active ventilation inside the glass jars. Mushroom did not cool below 0.9 °C likely due to its high respiratory heat generation[6] and the very low density[13, 14] (Table 4), indicating a higher percentage of insulating internal air.
Although controlled atmospheres were not tested in this instance with the device, the accurate controlled temperature and air-tight glass jars of the equipment allow the possibility to carry out studies with many kinds of fresh foods (fruits, vegetables, grains, etc) under various controlled atmospheres and investigating metabolism and conservation properties. Other plant organs or even full plants (small size) can also be used to investigate physiological and biochemical processes.
-
A custom-made prototype designed to study the effects of temperature on fresh food quality provided fast cooling of a glycol solution and a temperature uniformity within the container of 100%. When the glycol solution was set at 0 °C, a maximum fluctuation of 0.6 °C was registered in 55 min cycles. Steady state temperature conditions were reached relatively quickly.
The device was used for experiments related with thermal properties and temperature effects on fresh fruits and vegetables.
The cooling properties of fruits and vegetables were not completely explained by their specific heat and respiratory heat production; density can be an important determinant of cooling properties.
-
The authors confirm contribution to the paper as follows: study conception and design: Streif J, Saquet A; data collection: Saquet A, Almeida D, Streif J; analysis and interpretation of results: Saquet A, Almeida D, Streif J; draft manuscript preparation: Saquet A, Almeida D, Streif J. All authors reviewed the results and approved the final version of the manuscript.
-
All data generated or analyzed during this study are included in this published article.
-
The authors are very grateful to Frincor - Frio Industrial e Comercial, Lda, Rua Casal da Ligeira, 20 Armazém 14, Ral, 2710-446 Sintra, Portugal, for the donation of the material for construction of this equipment.
-
The authors declare that they have no conflict of interest. Adriano Saquet is the Editorial Board member of Technology in Horticulture who was blinded from reviewing or making decisions on the manuscript. The article was subject to the journal's standard procedures, with peer-review handled independently of this Editorial Board member and the research groups.
- Copyright: © 2024 by the author(s). Published by Maximum Academic Press, Fayetteville, GA. This article is an open access article distributed under Creative Commons Attribution License (CC BY 4.0), visit https://creativecommons.org/licenses/by/4.0/.
-
About this article
Cite this article
Saquet A, Streif J, Almeida D. 2024. Experimental device to study temperature effects on food quality: development and application. Technology in Horticulture 4: e007 doi: 10.48130/tihort-0024-0004
Experimental device to study temperature effects on food quality: development and application
- Received: 05 January 2024
- Revised: 11 February 2024
- Accepted: 17 February 2024
- Published online: 15 March 2024
Abstract: An experimental device was designed to study the temperature (and, if desired, of controlled atmospheres) effects on food quality. The equipment is composed of: (a) a refrigeration unit; (b) an insulated container with total volume of 500 L of streaming glycol solution; and (c) a set of 12 sealed 2.15 L glass jars immersed in the 10% glycol solution. The continuous circulation of the glycol solution at a flow rate of 1.8 m3·h–1 allowed 100% temperature uniformity at 5 and 20 cm depth in the 12 glass jars. The cooling rates of 'Rocha' pear, 'Camarosa' strawberry, 'Farbaly' apricot, 'Maris Peer' potato and white mushroom within three mass ranges ((1) 81.8 to 90.1 g, (2) 190.9 to 249.7 g, and (3) 403.3 to 506.3 g) were investigated. The products were cooled from initial temperatures ranging from 22.8 to 26.3 °C to a final steady state temperature with cooling fluid at 0.3 °C. In general, all products, masses and sizes tested, cooled to 0.6 °C in 24 h. In conclusion, the device provided fast cooling of the glycol solution with temperature uniformity of 100%. The method is effective for precise short-term trials on the effects of temperature or cooling rates on food quality traits. However, the results with various products suggest that product specific heat and respiratory heat production were not the only determinants of the cooling rate and that product size and density played major roles.
-
Key words:
- Cooling rate /
- Fruits /
- Refrigeration /
- Temperature management /
- Vegetables


