-
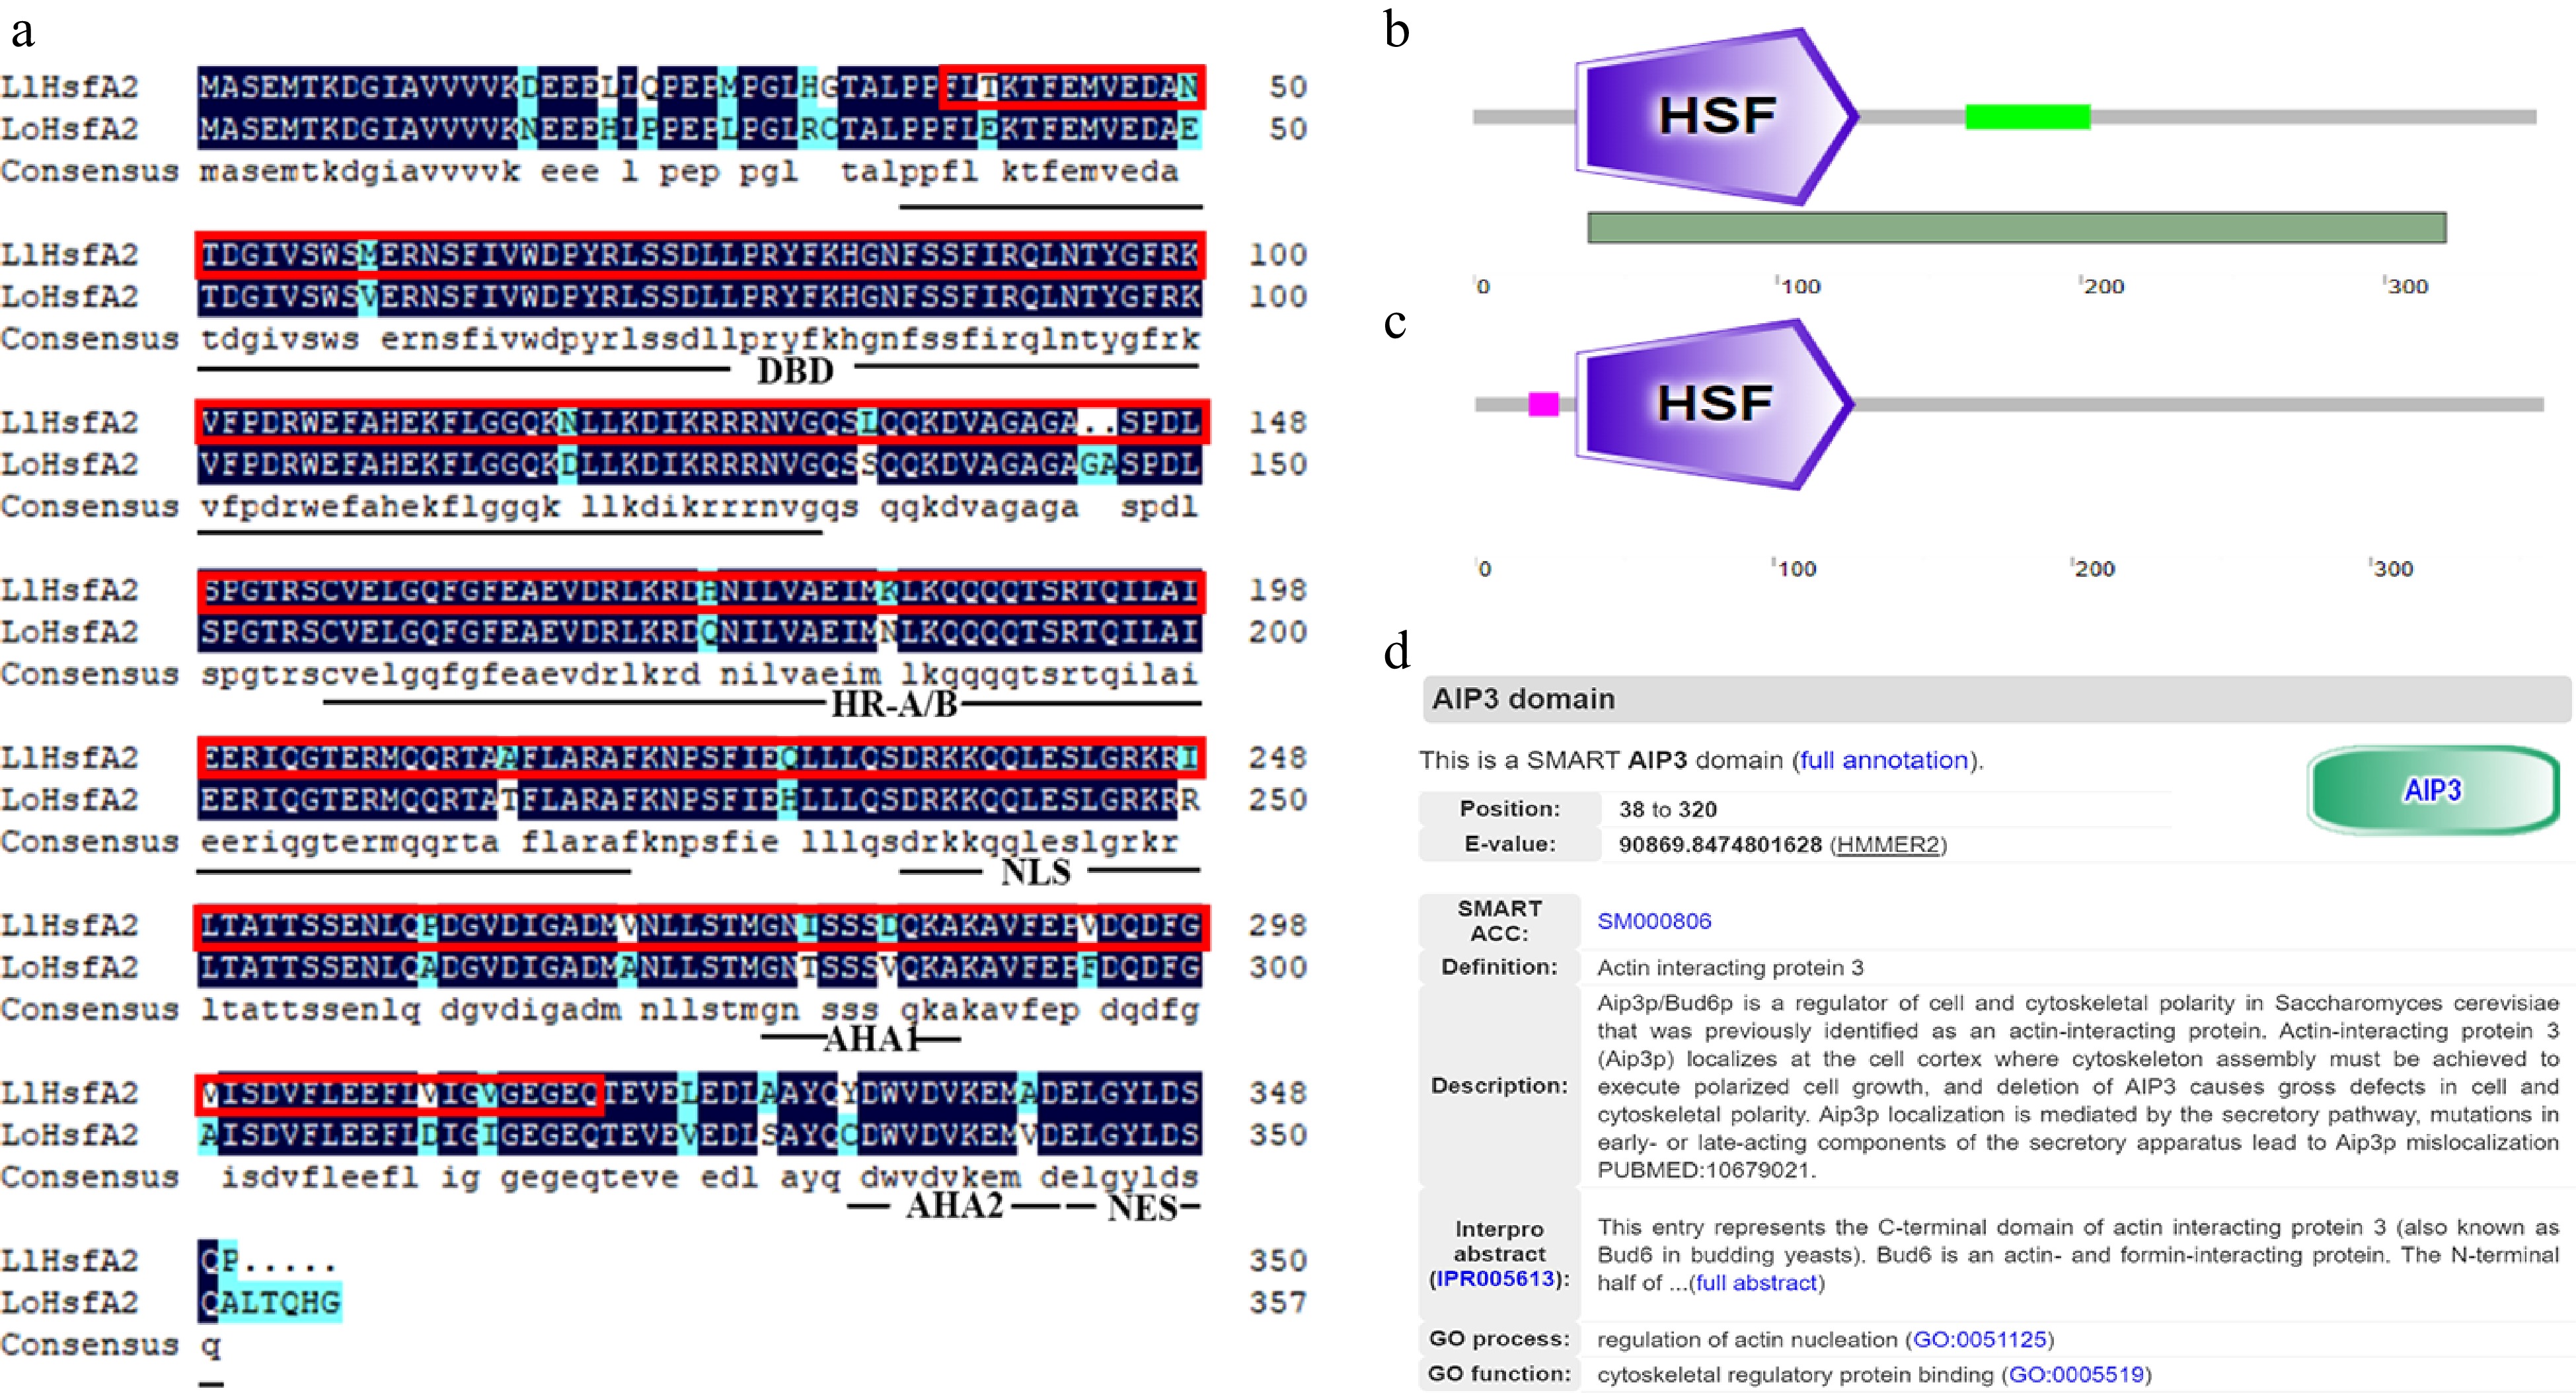
Figure 1.
Amino acid sequence analysis of HsfA2 in 'White Heaven' and 'Siberia'. (a) Amino acid sequence alignment between LlHsfA2 and LoHsfA2. The red boxes indicate the AIP3 domain. DBD, DNA binding domain; HR-A/B: Oligomerization domain; NLS: Nuclear localization sequence; AHA1/AHA2: Activation domains; NES: Nuclear export sequence. (b) The SMART website predicted that LlHsfA2 of 'White Heaven' would contain the HSF and AIP3 domain, and the position of the AIP3 domain was from 38 to 320 amino acids. The dark green bar below represents the location of the AIP3 domain. (c) The SMART website predicted that LoHsfA2 of 'Siberia' only contains the HSF domain. (d) The SMART website comments on the AIP3 domain.
-
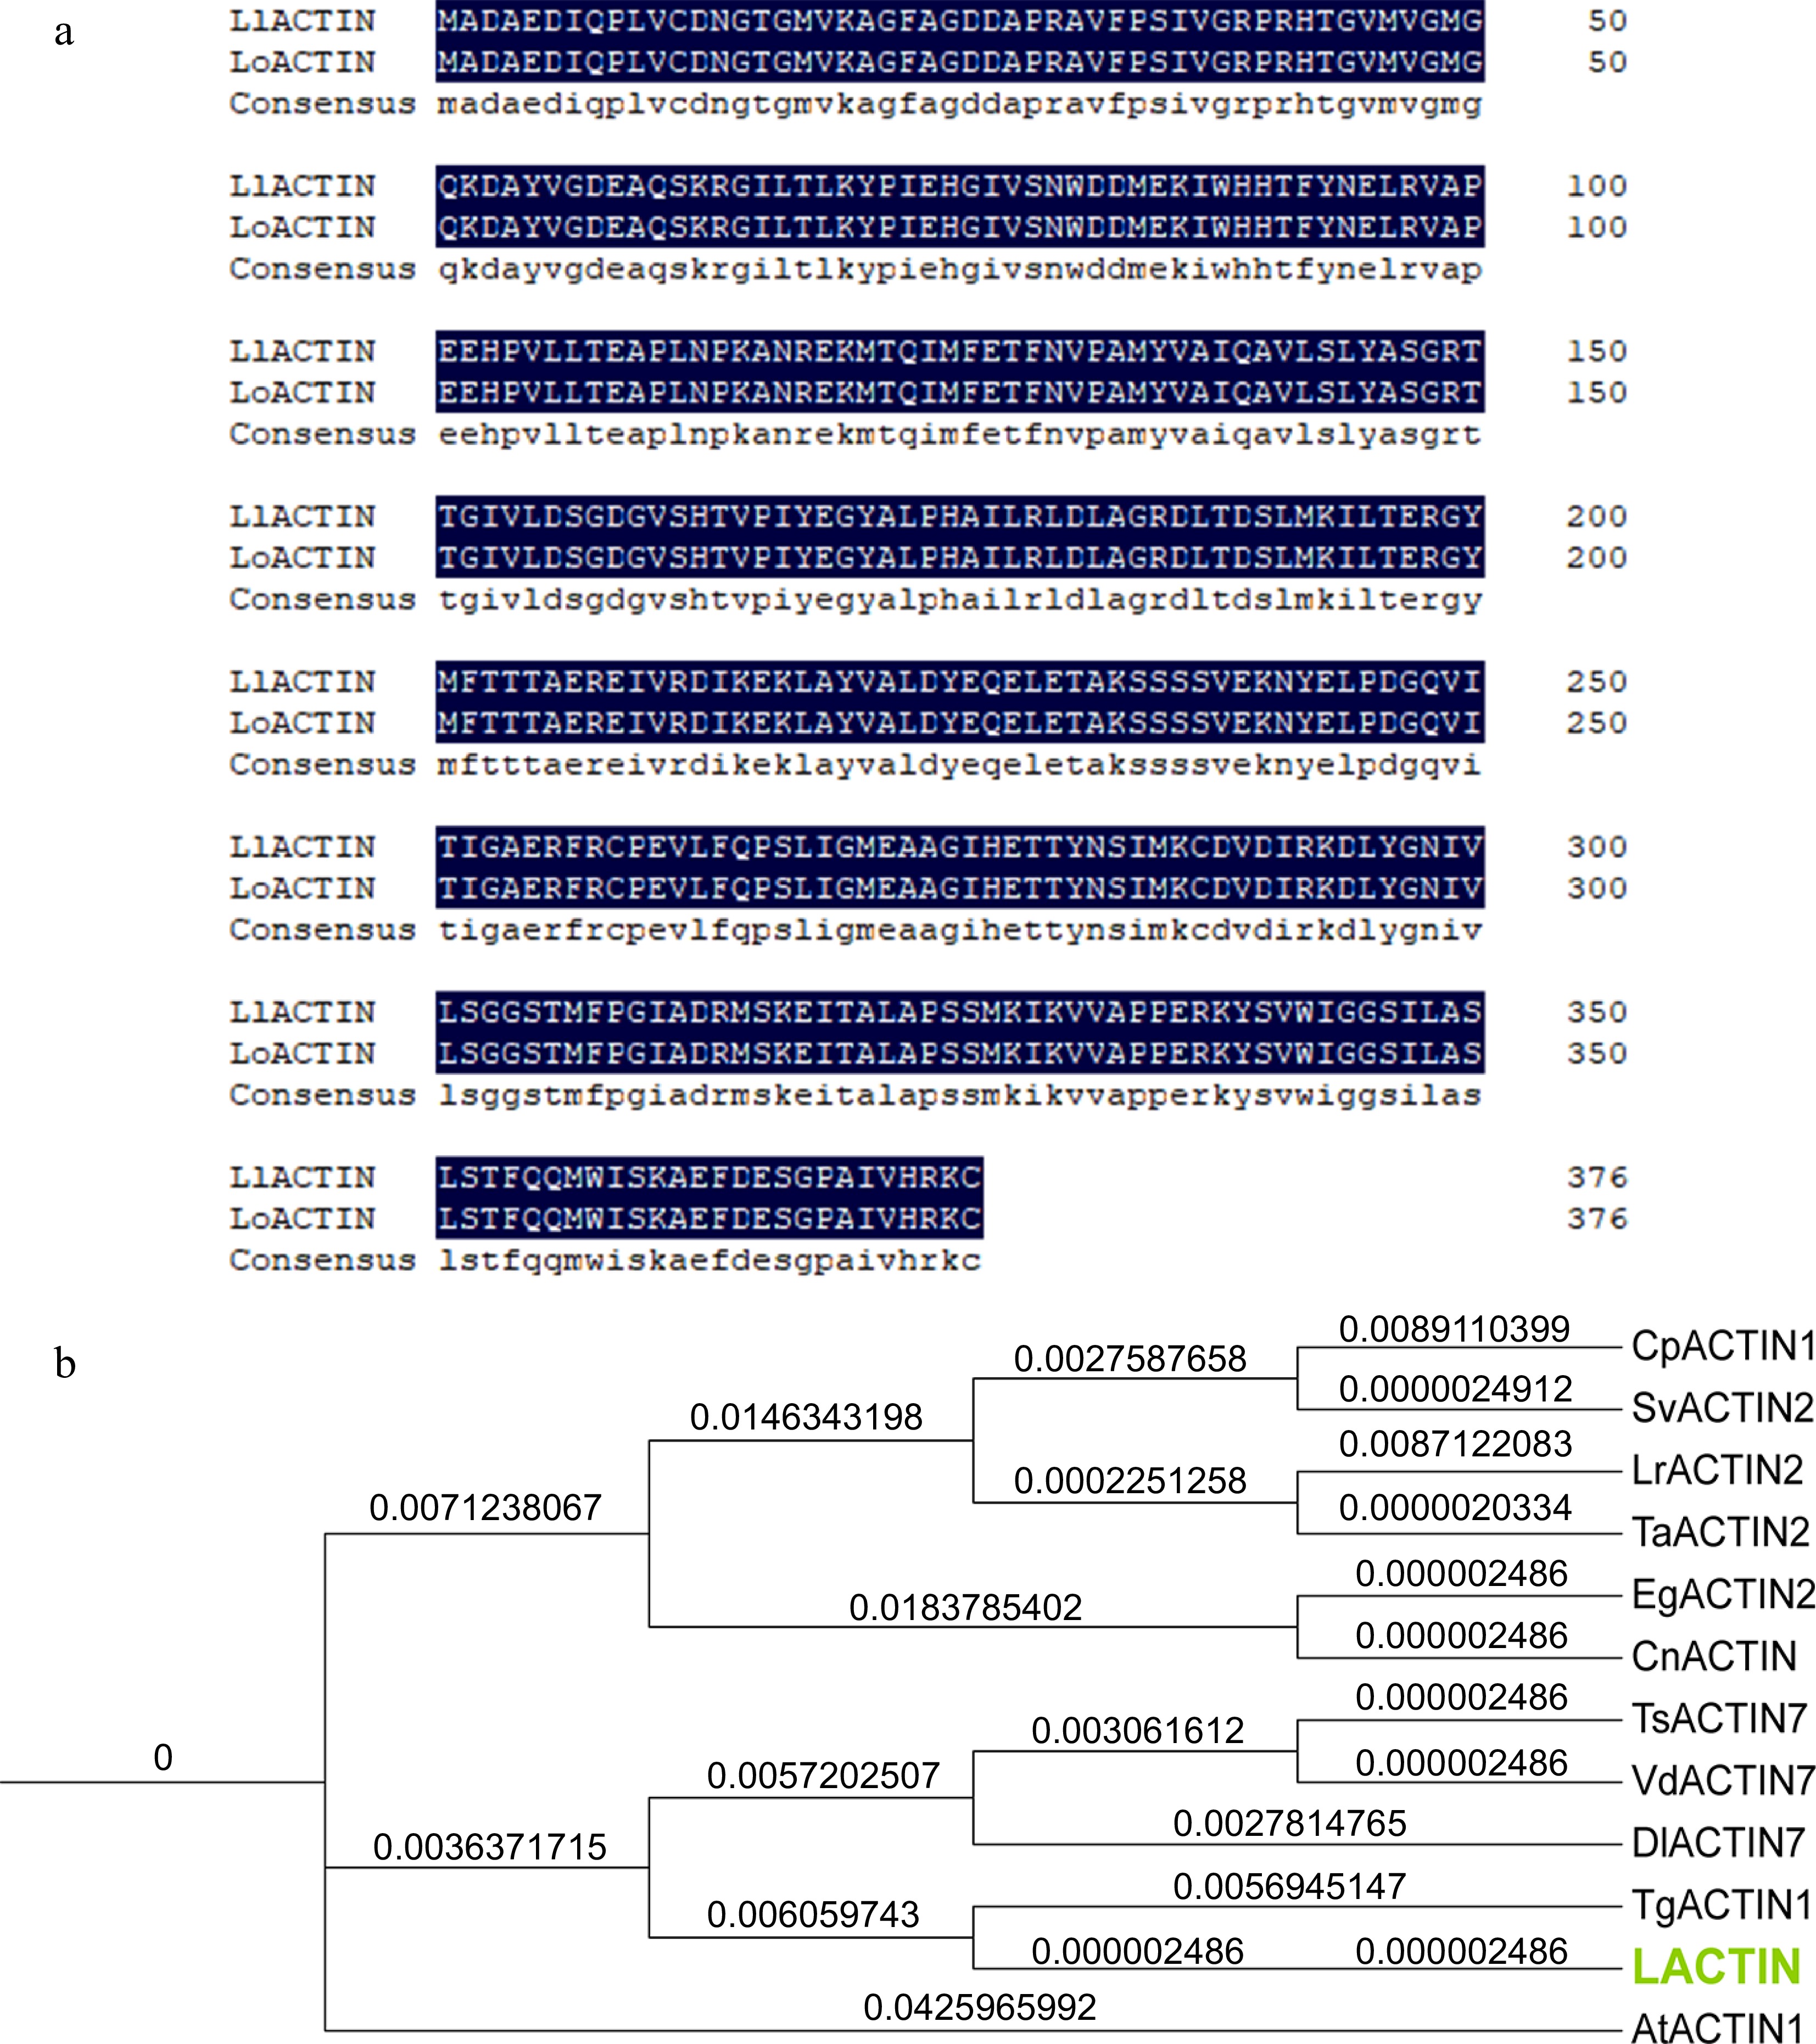
Figure 2.
Amino acid sequence alignment and phylogenetic tree analysis of ACTIN in 'White Heaven' and 'Siberia'. (a) Amino acid sequence alignment between LlACTIN and LoACTIN. (b) Phylogenetic tree of LlACTIN, LoACTIN, and ACTIN in other species. The ACTIN proteins were from: Elaeis guineensis EgACTIN2 (LOC105059495), Cocos nucifera CnACTIN (MH017421.1), Tulipa gesneriana TgActin1 (AB456684.1), Lolium rigidum LrACTIN2(LOC124705928), Triadica sebifera TsACTIN7 (KY656700.1), Diospyros lotus DlACTIN7 (LOC127809754), Cenchrus purpureus CpACTIN1 (MT784734.1), Triticum aestivum TaACTIN2 (LOC123048645), Setaria viridis SvACTIN2 (LOC117839433), and Vaccinium dunalianum VdACTIN7 (OM033722.1). The phylogenetic tree was analyzed by TBtools v1.09876 and drawn by iTOL.
-
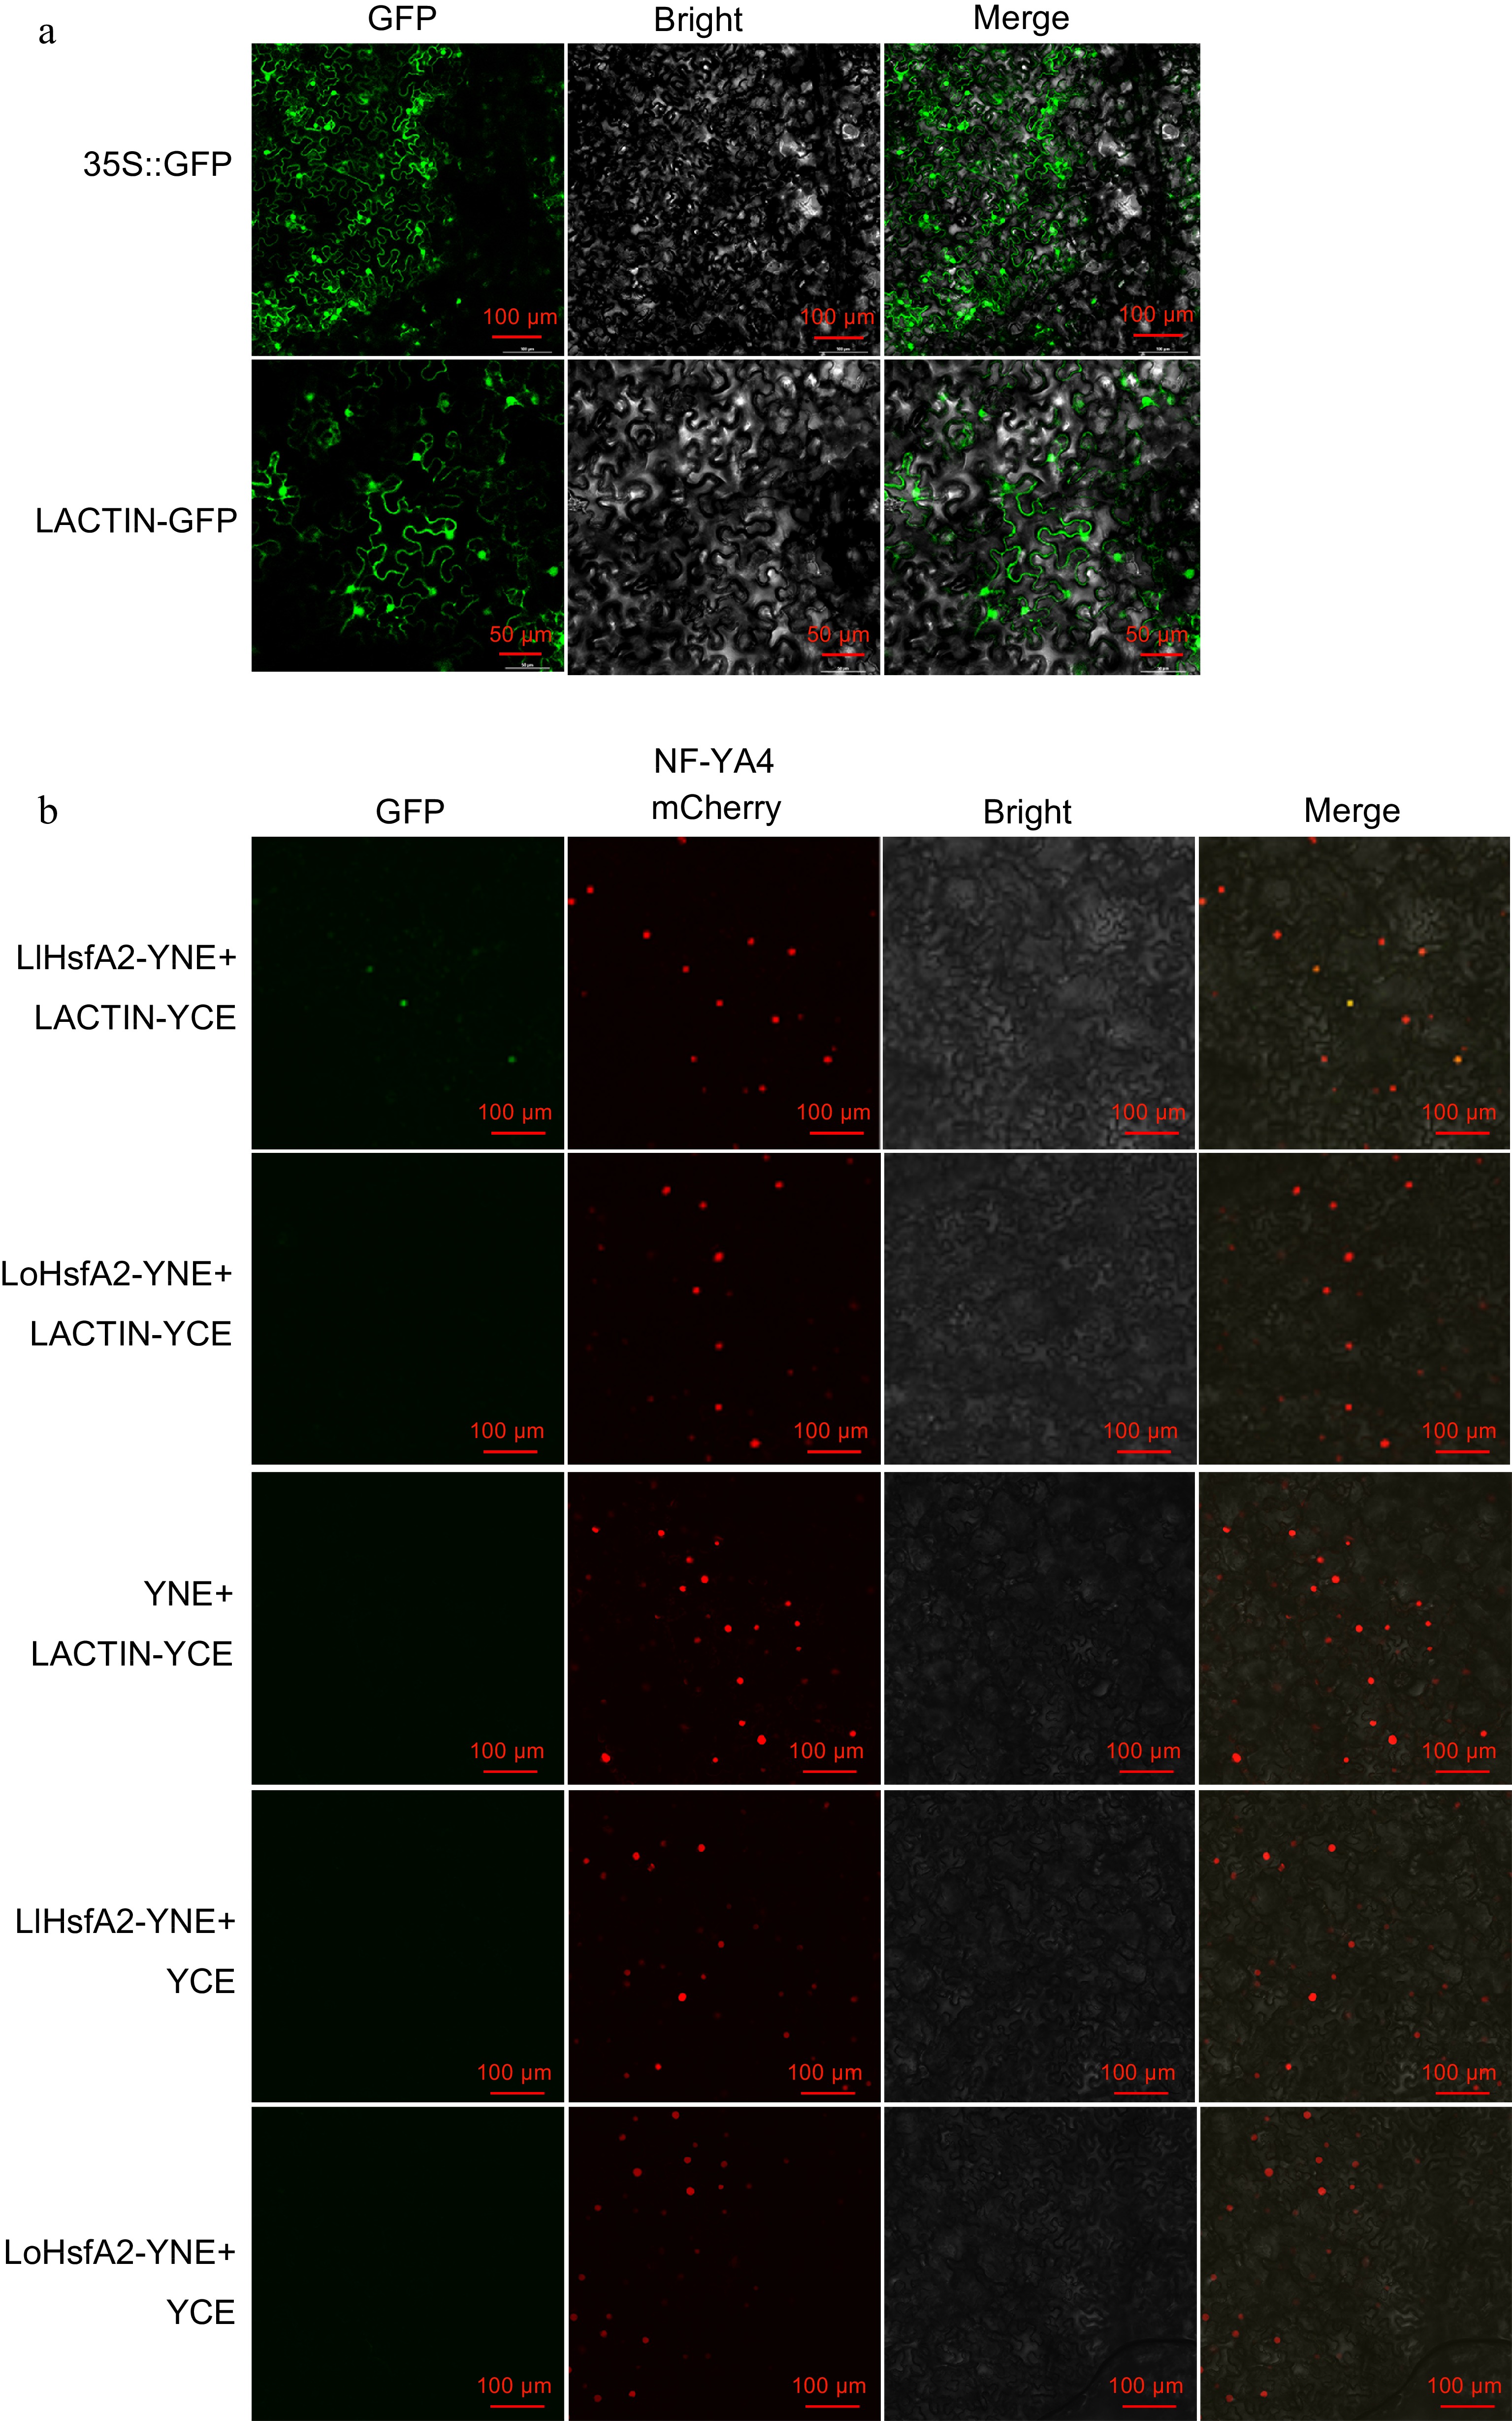
Figure 3.
The interaction relationships of different HsfA2s and ACTINs from 'White Heaven' and 'Siberia'. (a) The subcellular localization of the LACTIN−GFP fusion protein. 35S::GFP was used as the negative control. Green fluorescence were visualized using confocal microscopy 72 h after infiltration. Bars = 100 or 50 μm. (b) BiFC assay. LACTIN−YCE and the empty vector YNE, LlHsfA2-YNE, LoHsfA2-YNE and the empty vector YCE were used as negative controls. NF−YA4−mCherry was used as the nuclear marker. Green and red fluorescence were visualized using confocal microscopy 72 h after infiltration. Bars = 100 μm.
-
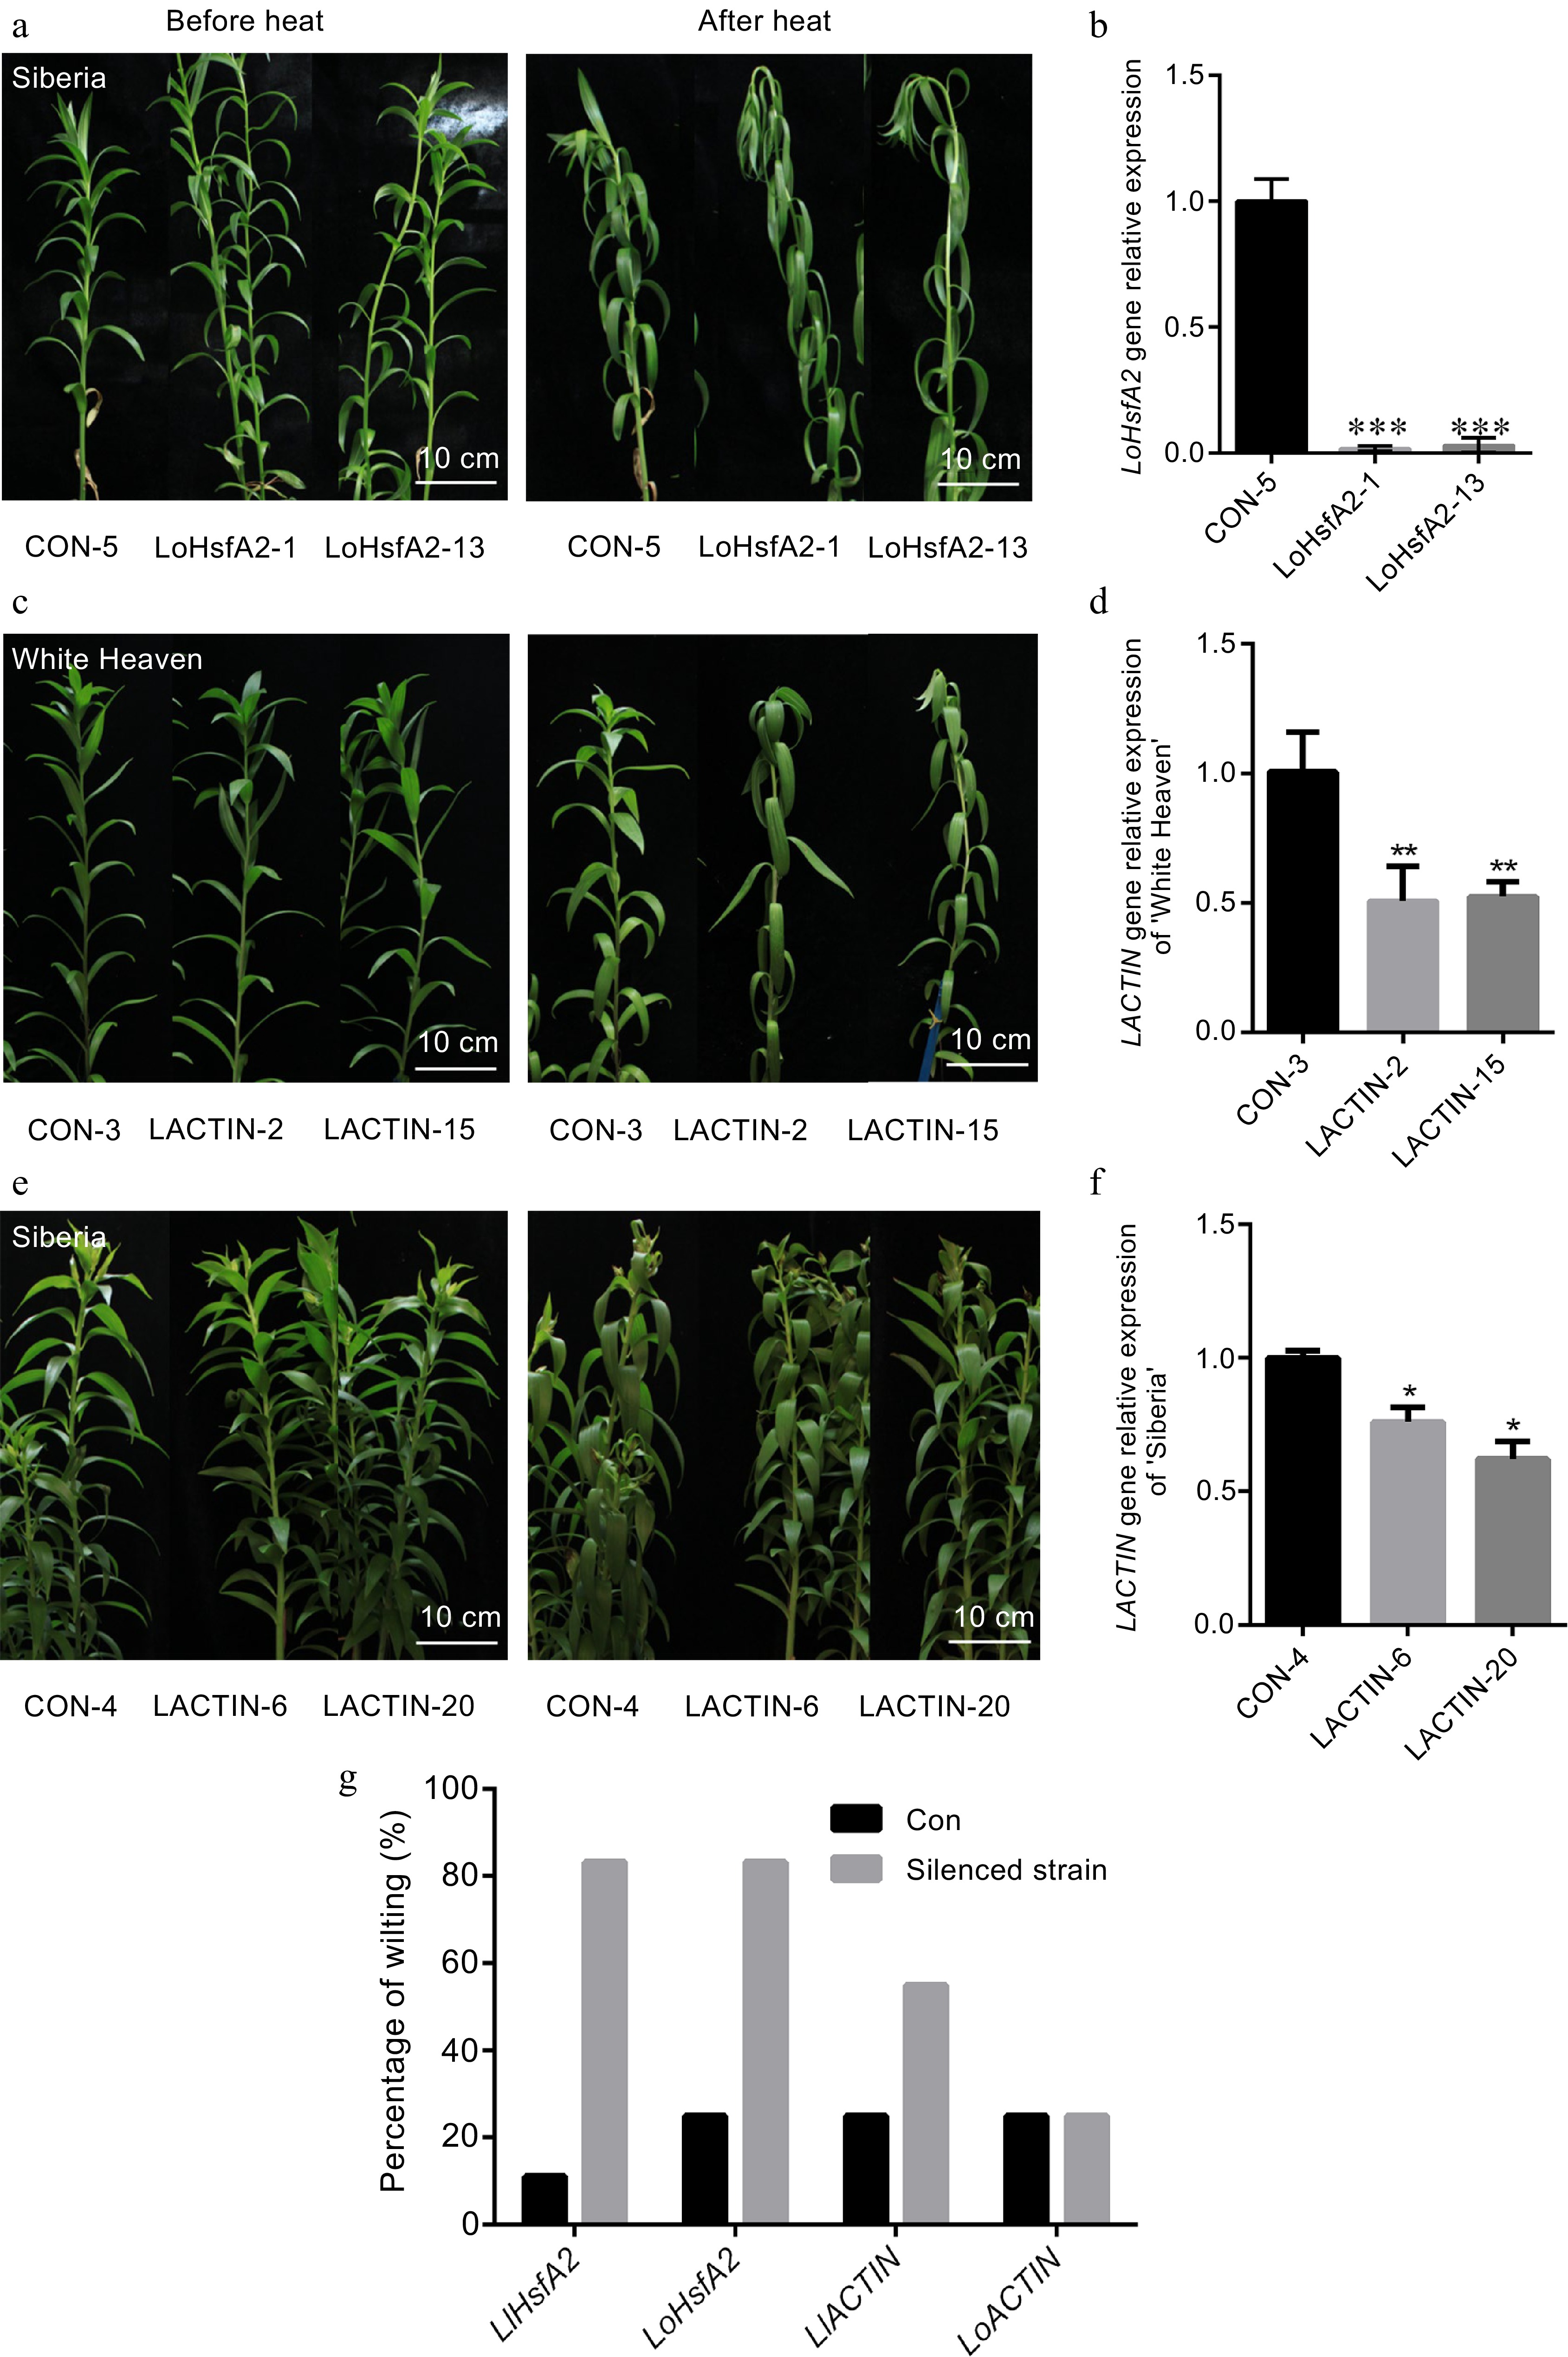
Figure 4.
Heat stress phenotype and gene expression of silenced HsfA2 and ACTIN in 'White Heaven' and 'Siberia'. (a), (c), (e) The phenotypes of the LoHsfA2, LACTIN silenced 'White Heaven' or 'Siberia' lines before heat and recovered at room temperature for 1 d after treatment with heat stress at 42 °C for 24 h. Bar: 10 cm. (b), (d), (f) Expression of LoHsfA2, LlACTIN silenced lines based on qRT-PCR. A T-test analysis of variance was employed to identify treatment means that differed statistically. Samples with different stars are significantly different: * p <0.05, ** p <0.01, and *** p <0.001. (g) Percentage wilting of the LlHsfA2, LoHsfA2, LACTIN silenced 'White Heaven' or 'Siberia' lines and negative control lines recovered at room temperature for 1 d after treatment with heat stress at 42 °C for 24 h.
-
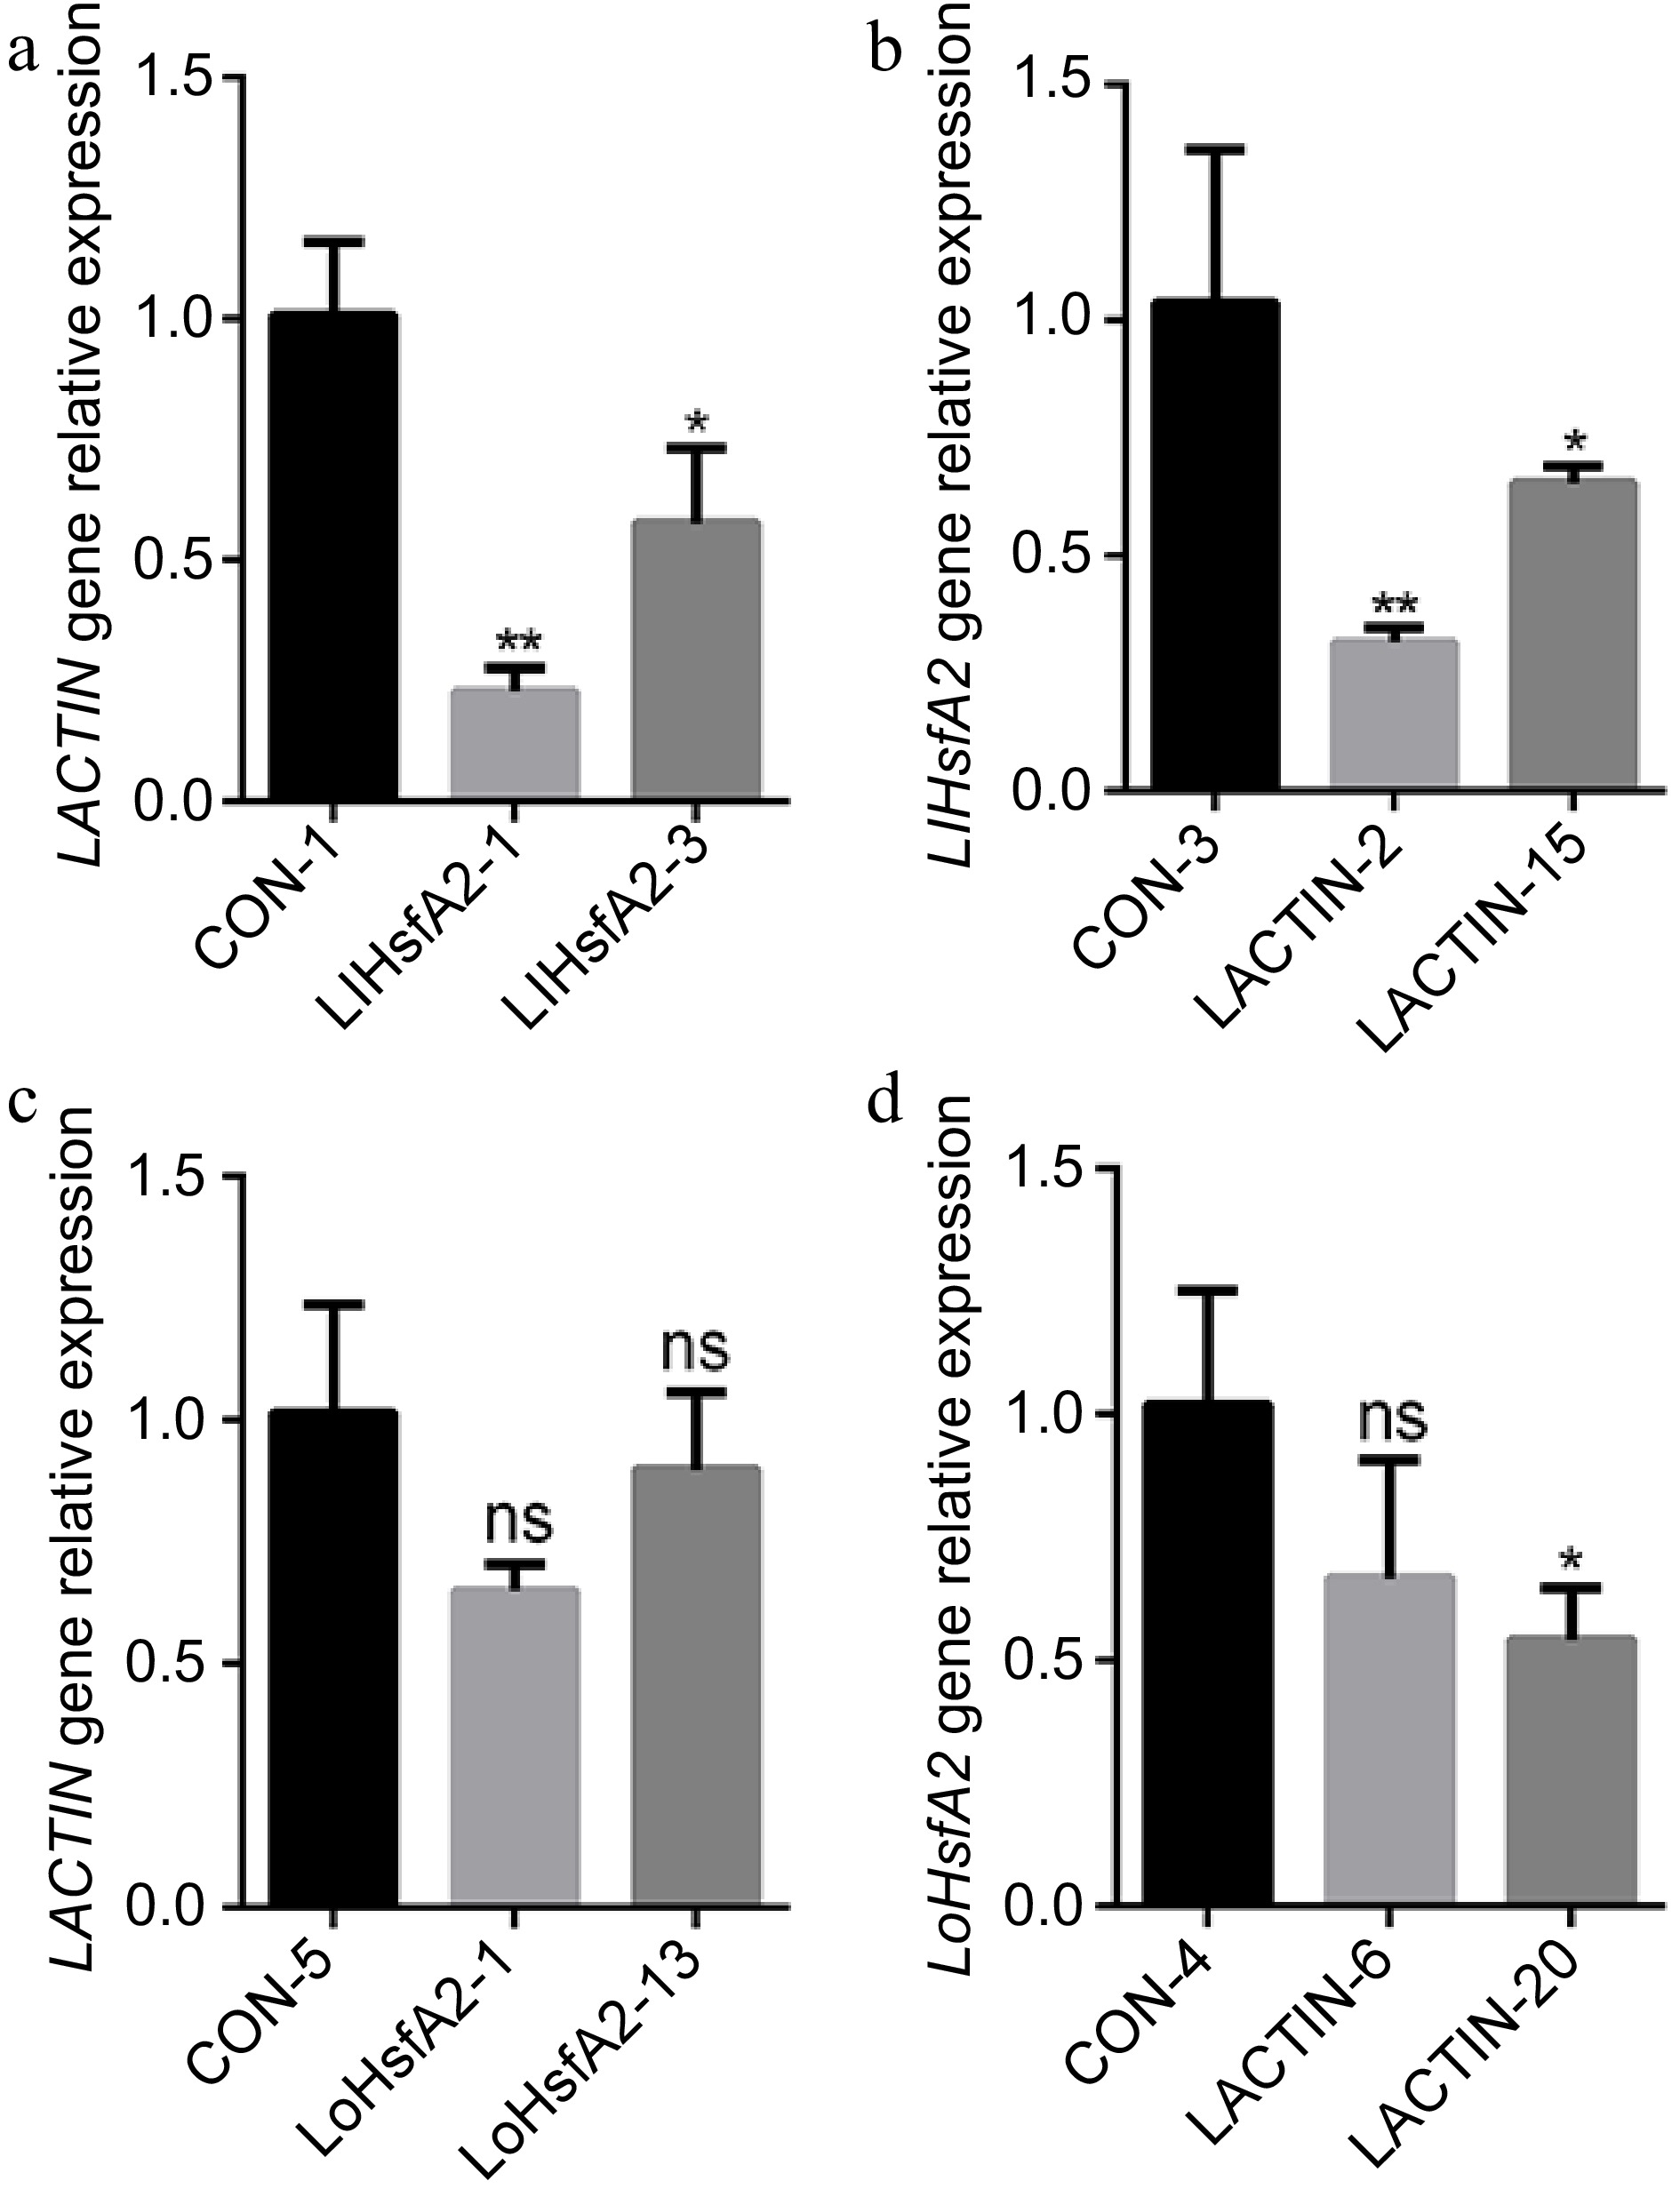
Figure 5.
The expressions of ACTIN and HsfA2 in the HsfA2 or ACTIN-silenced lines of 'White Heaven' and 'Siberia'. (a) The expression of LACTIN in the LlHsfA2 silenced 'White Heaven' line. (b) The expression of LlHsfA2 in the LACTIN silenced 'White Heaven' line. (c) The expression of LACTIN in the LoHsfA2 silenced 'Siberia' line. (d) The expression of LoHsfA2 in the LACTIN silenced 'Siberia' line. A T-test analysis of variance was employed to identify treatment means that differed statistically. Samples with different stars are significantly different: * p <0.05, ** p <0.01; ns: non-significance.
Figures
(5)
Tables
(0)