-
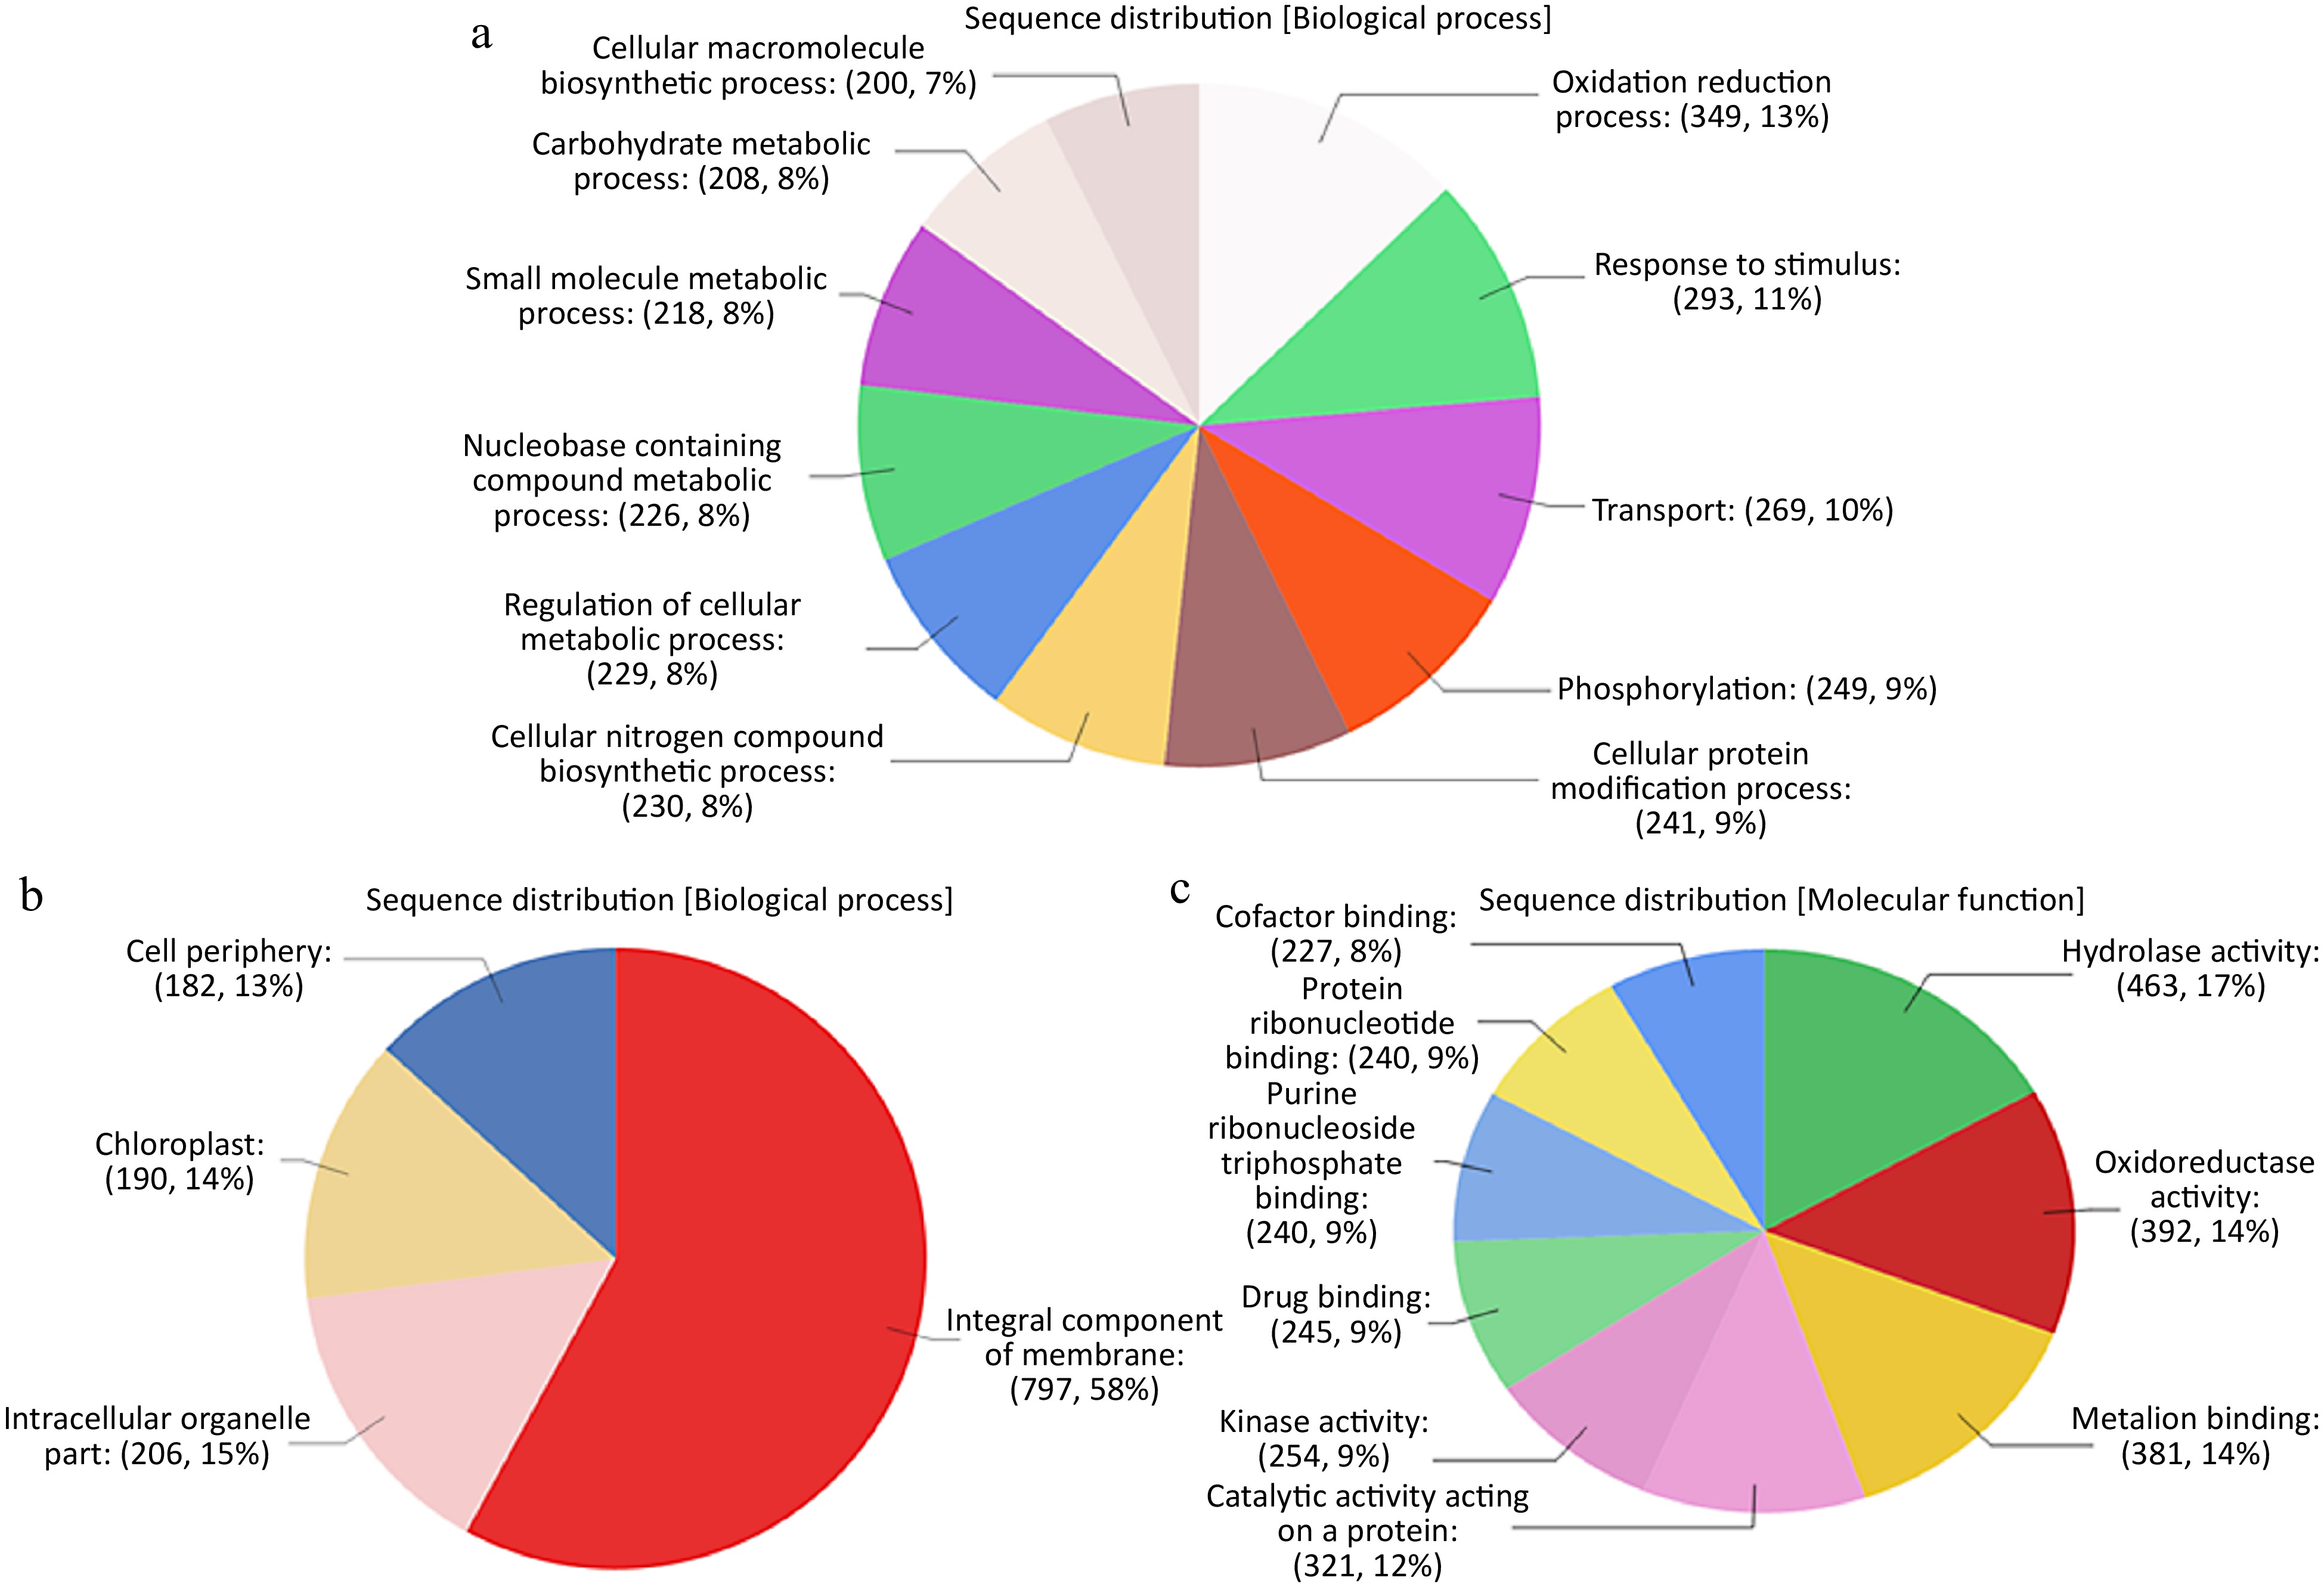
Figure 1.
(a) Sequence distribution of DETs among Biological Processes (BP) GO terms. (b) Sequence distribution of DETs among Cellular Components (CC) GO terms. (c) Sequence distribution of DETs among Molecular Functions(MF) GO terms.
-
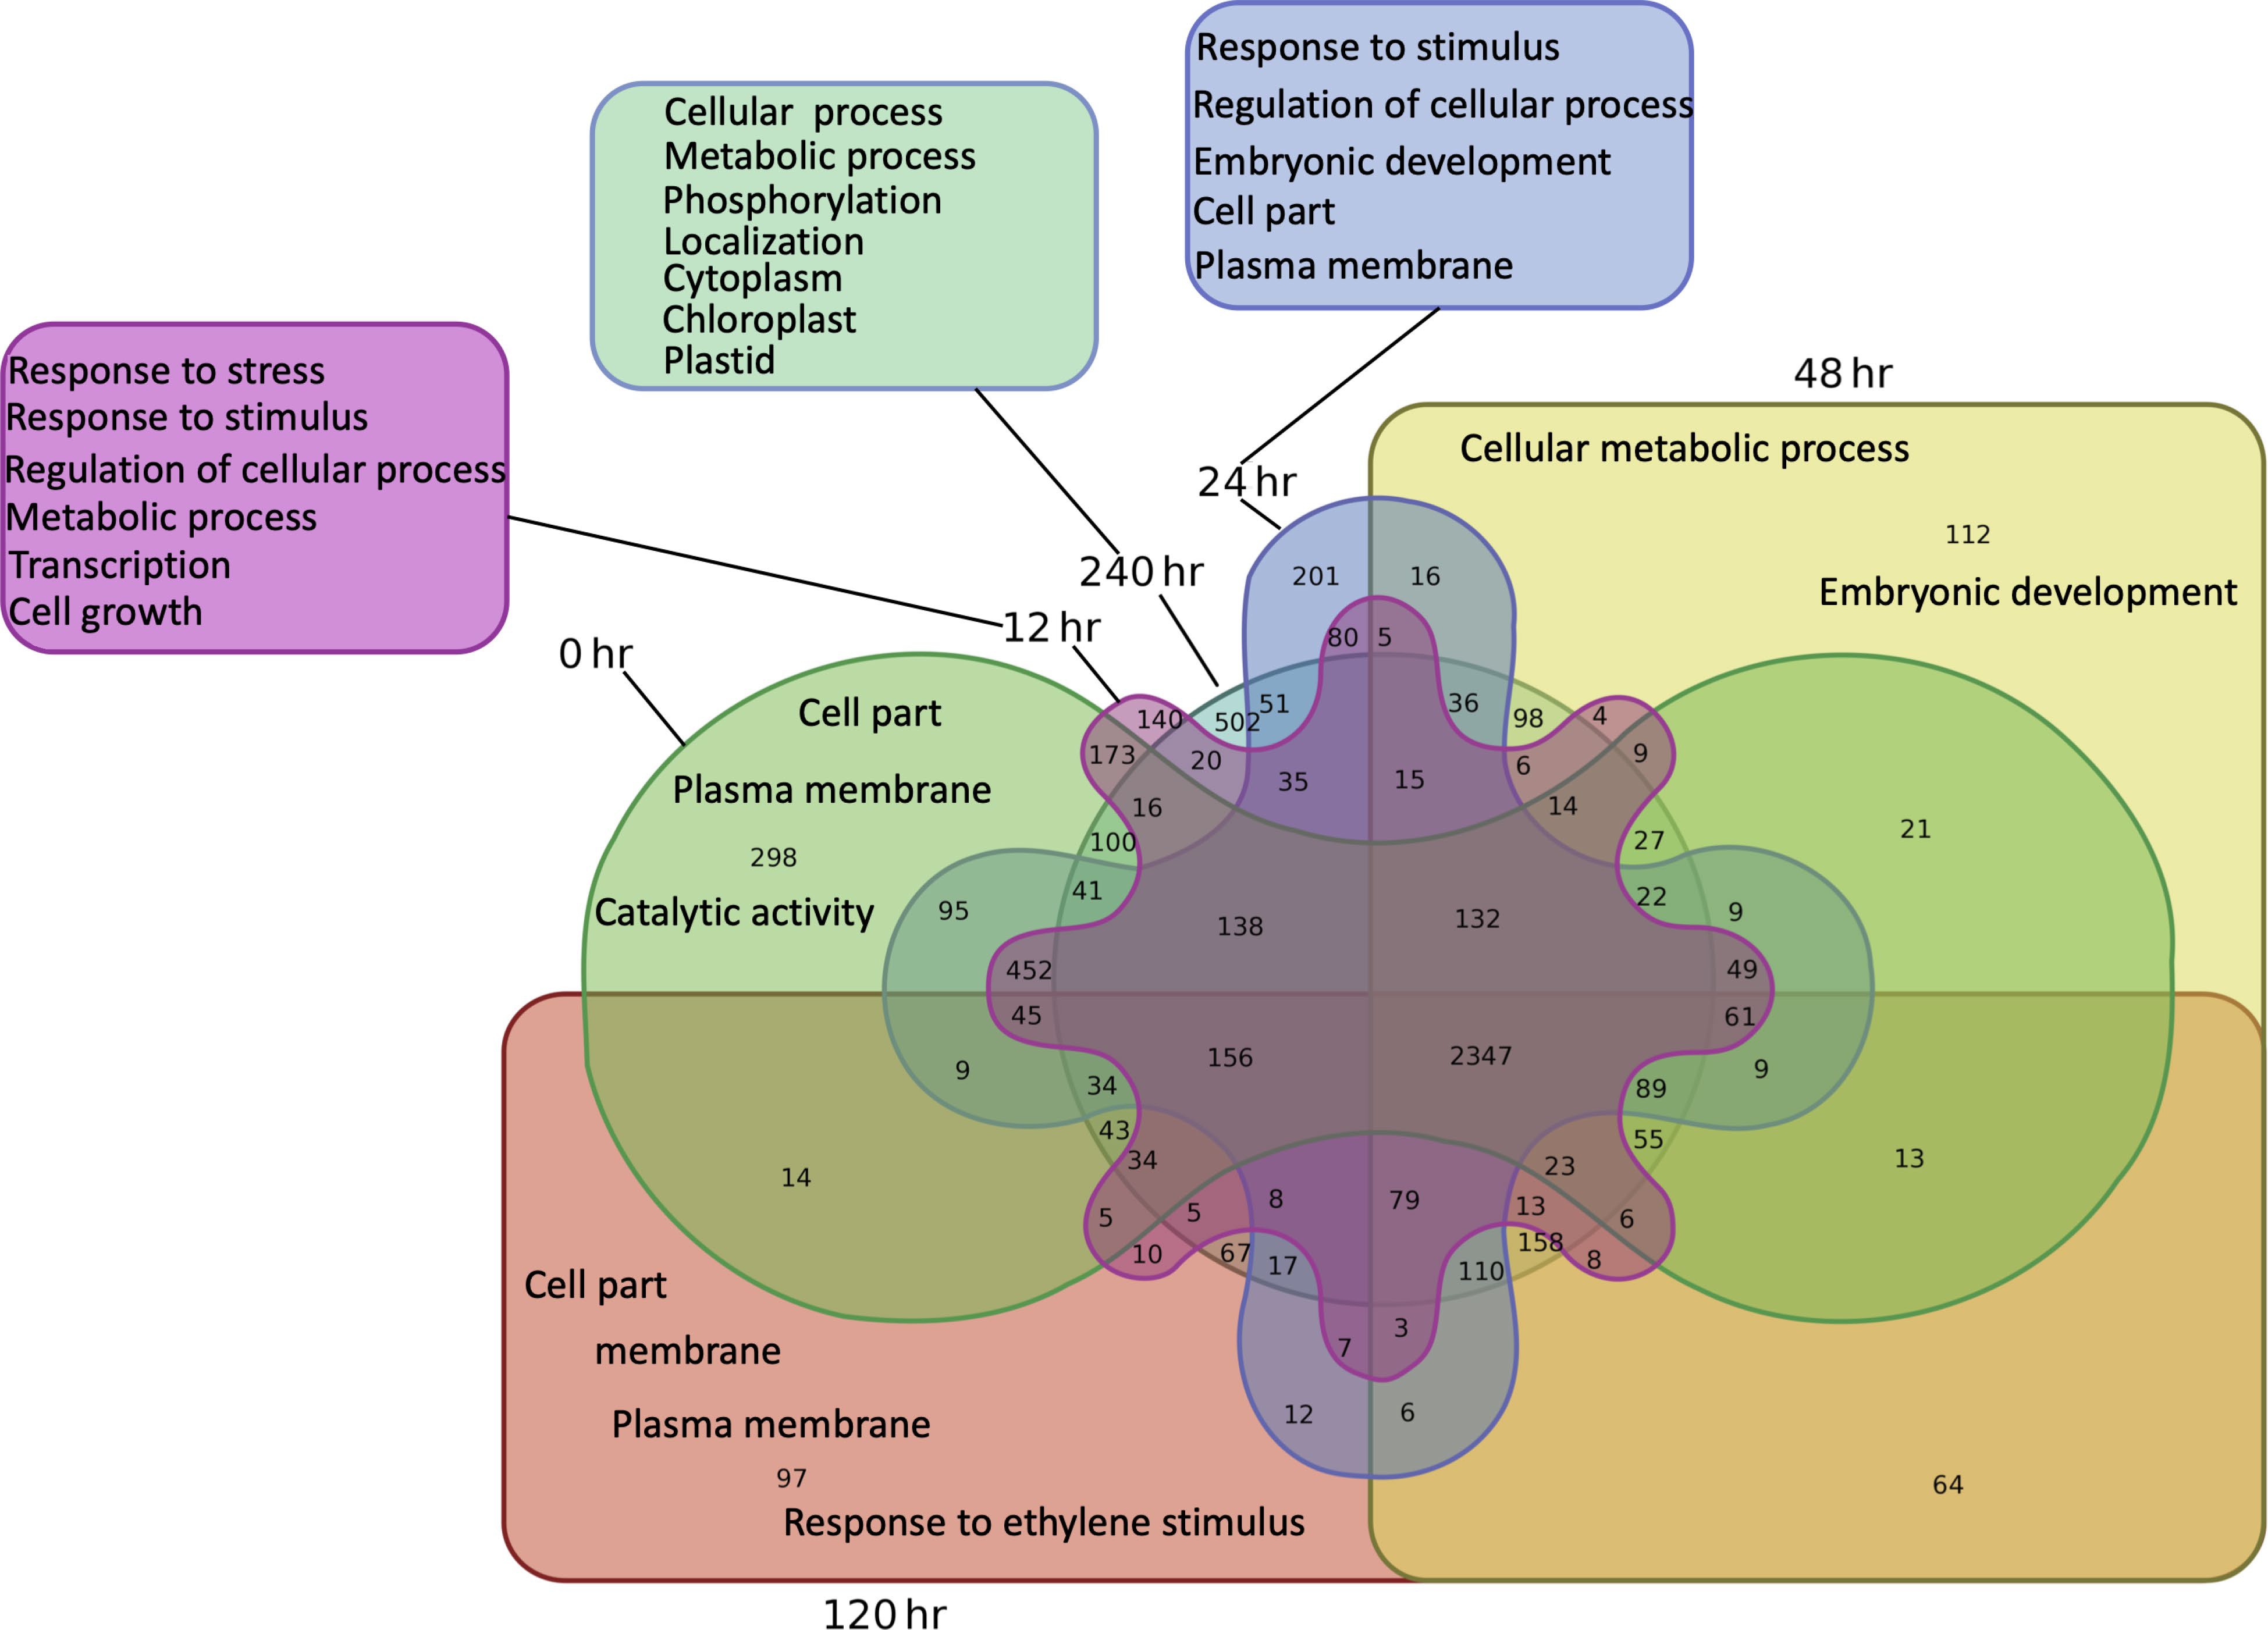
Figure 2.
Venn diagram of pair-wise comparisons of DETs unique to timepoints and most enriched GO 210 terms among unique DETs at each time point.
-
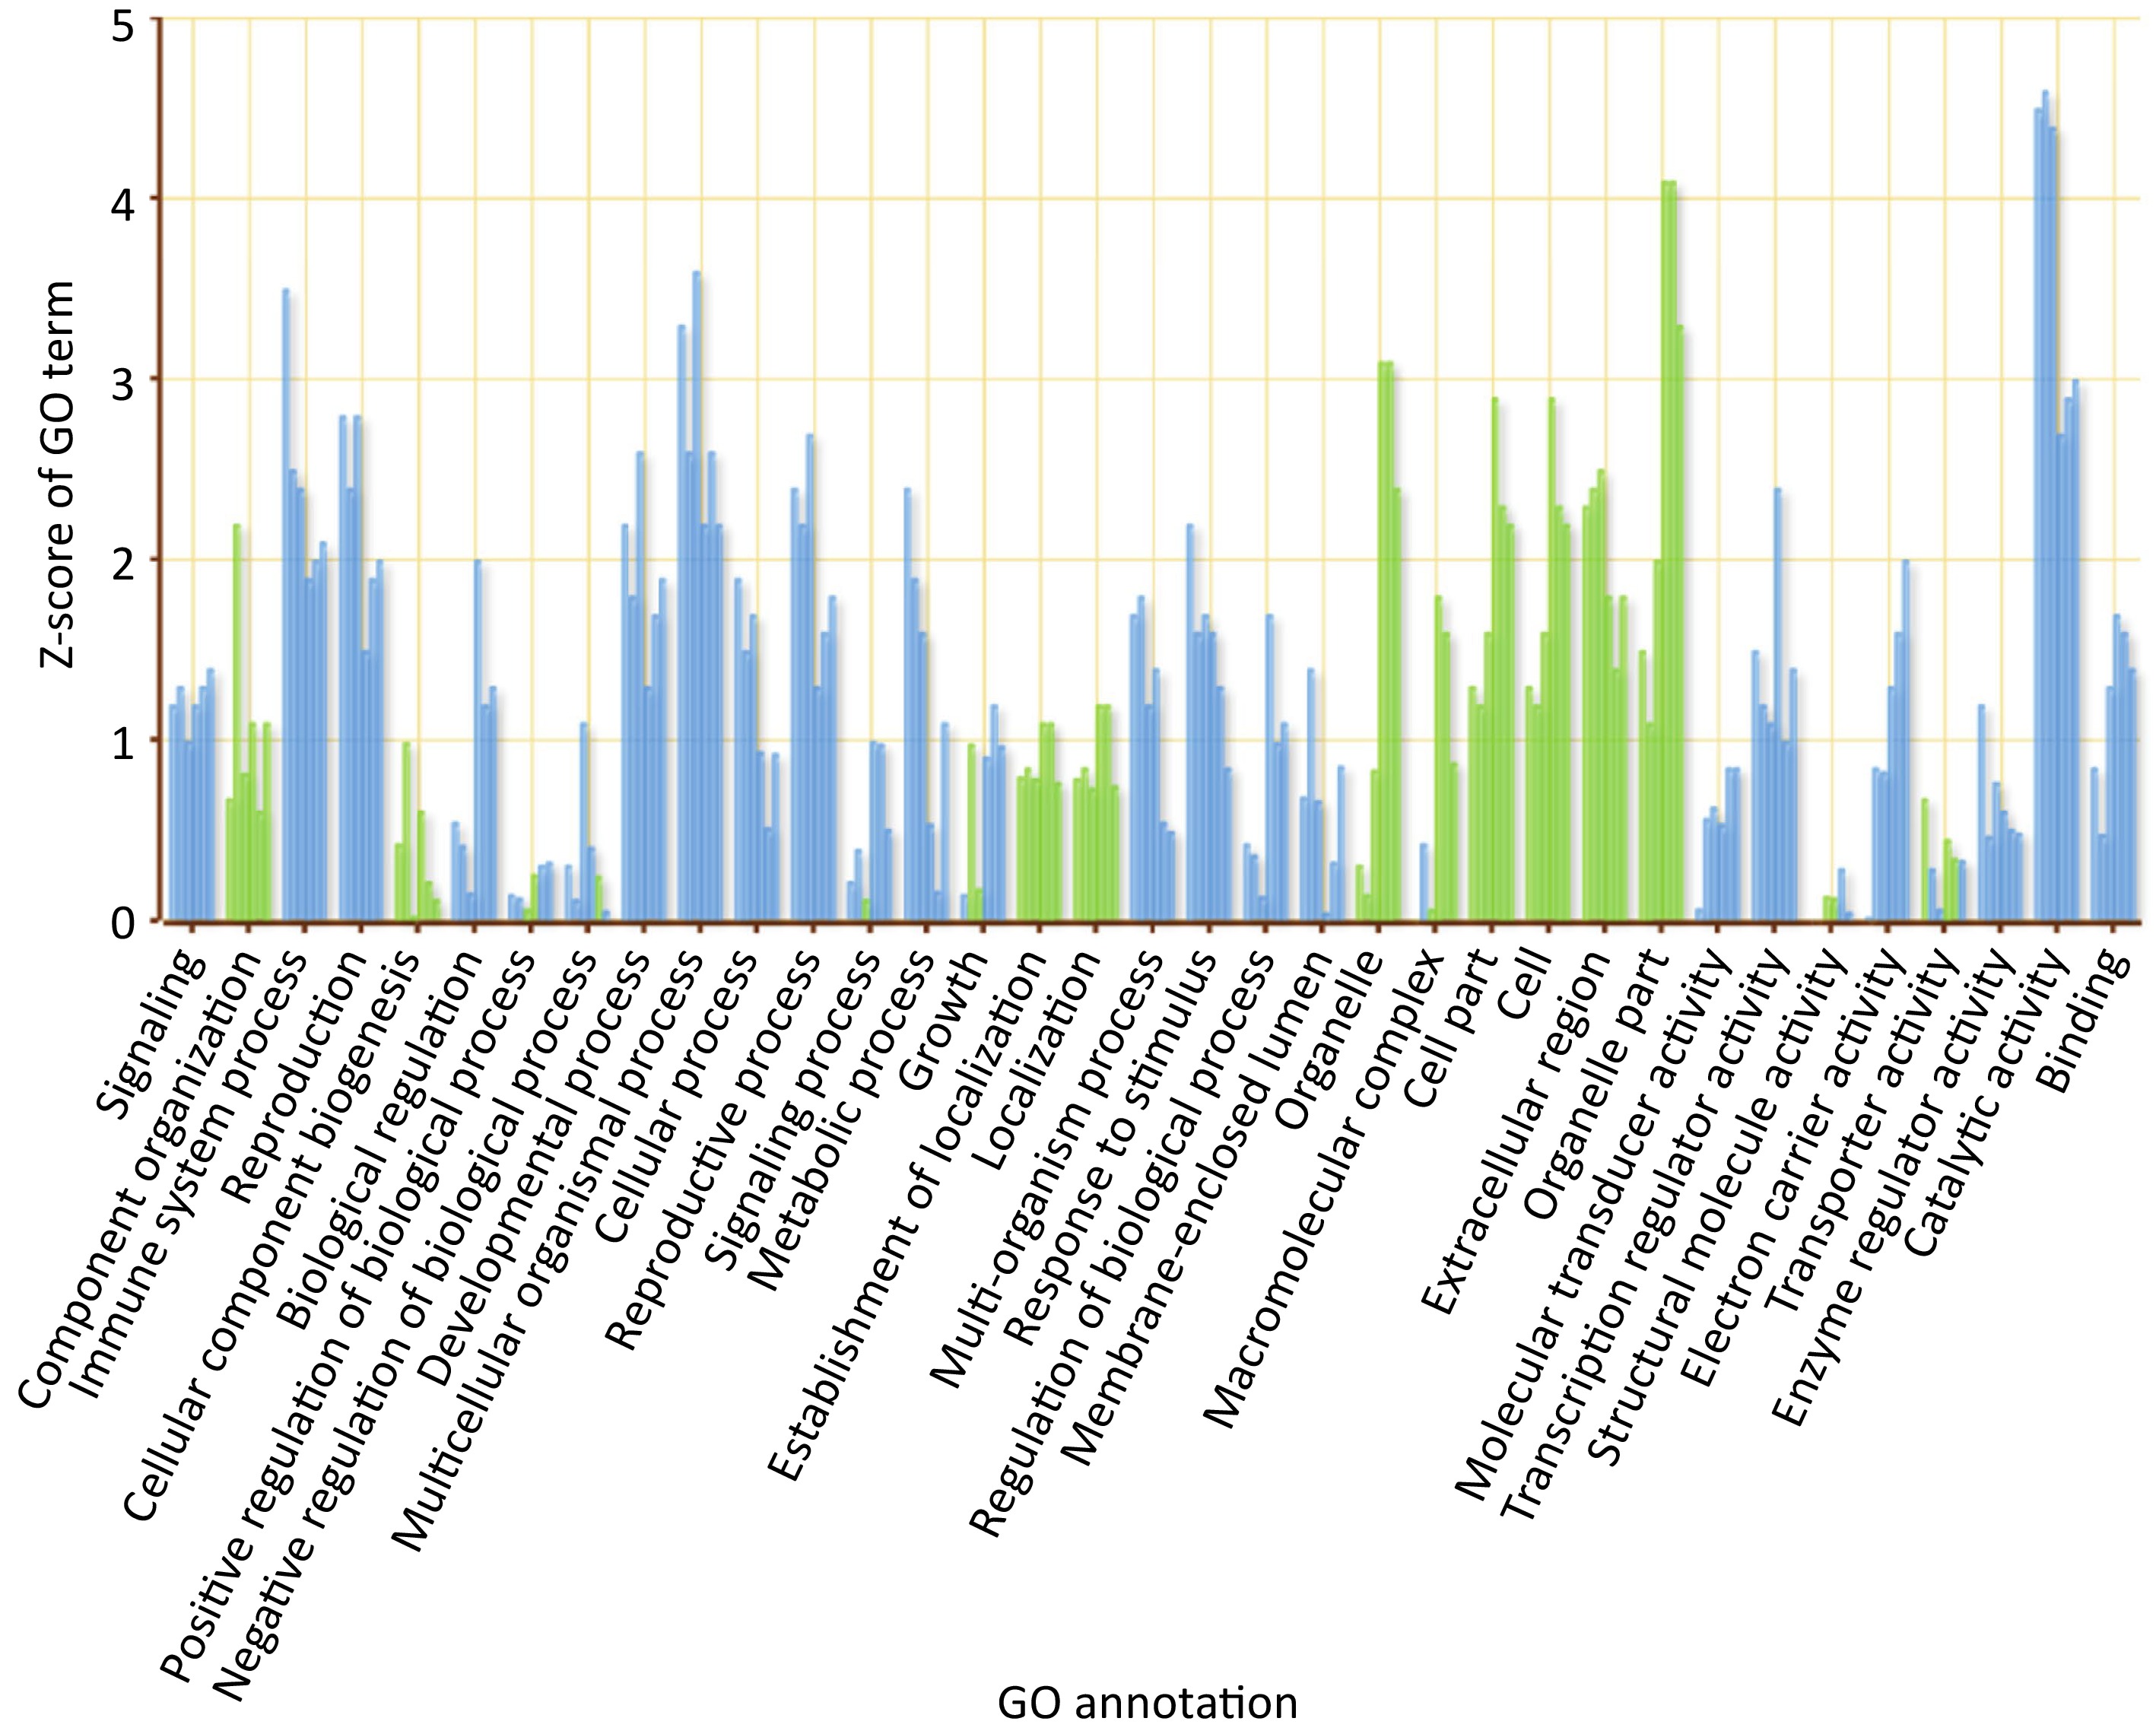
Figure 3.
GO sequence distribution chart separated by biological process (BP), molecular function (MF) and cellular component (CC).
-
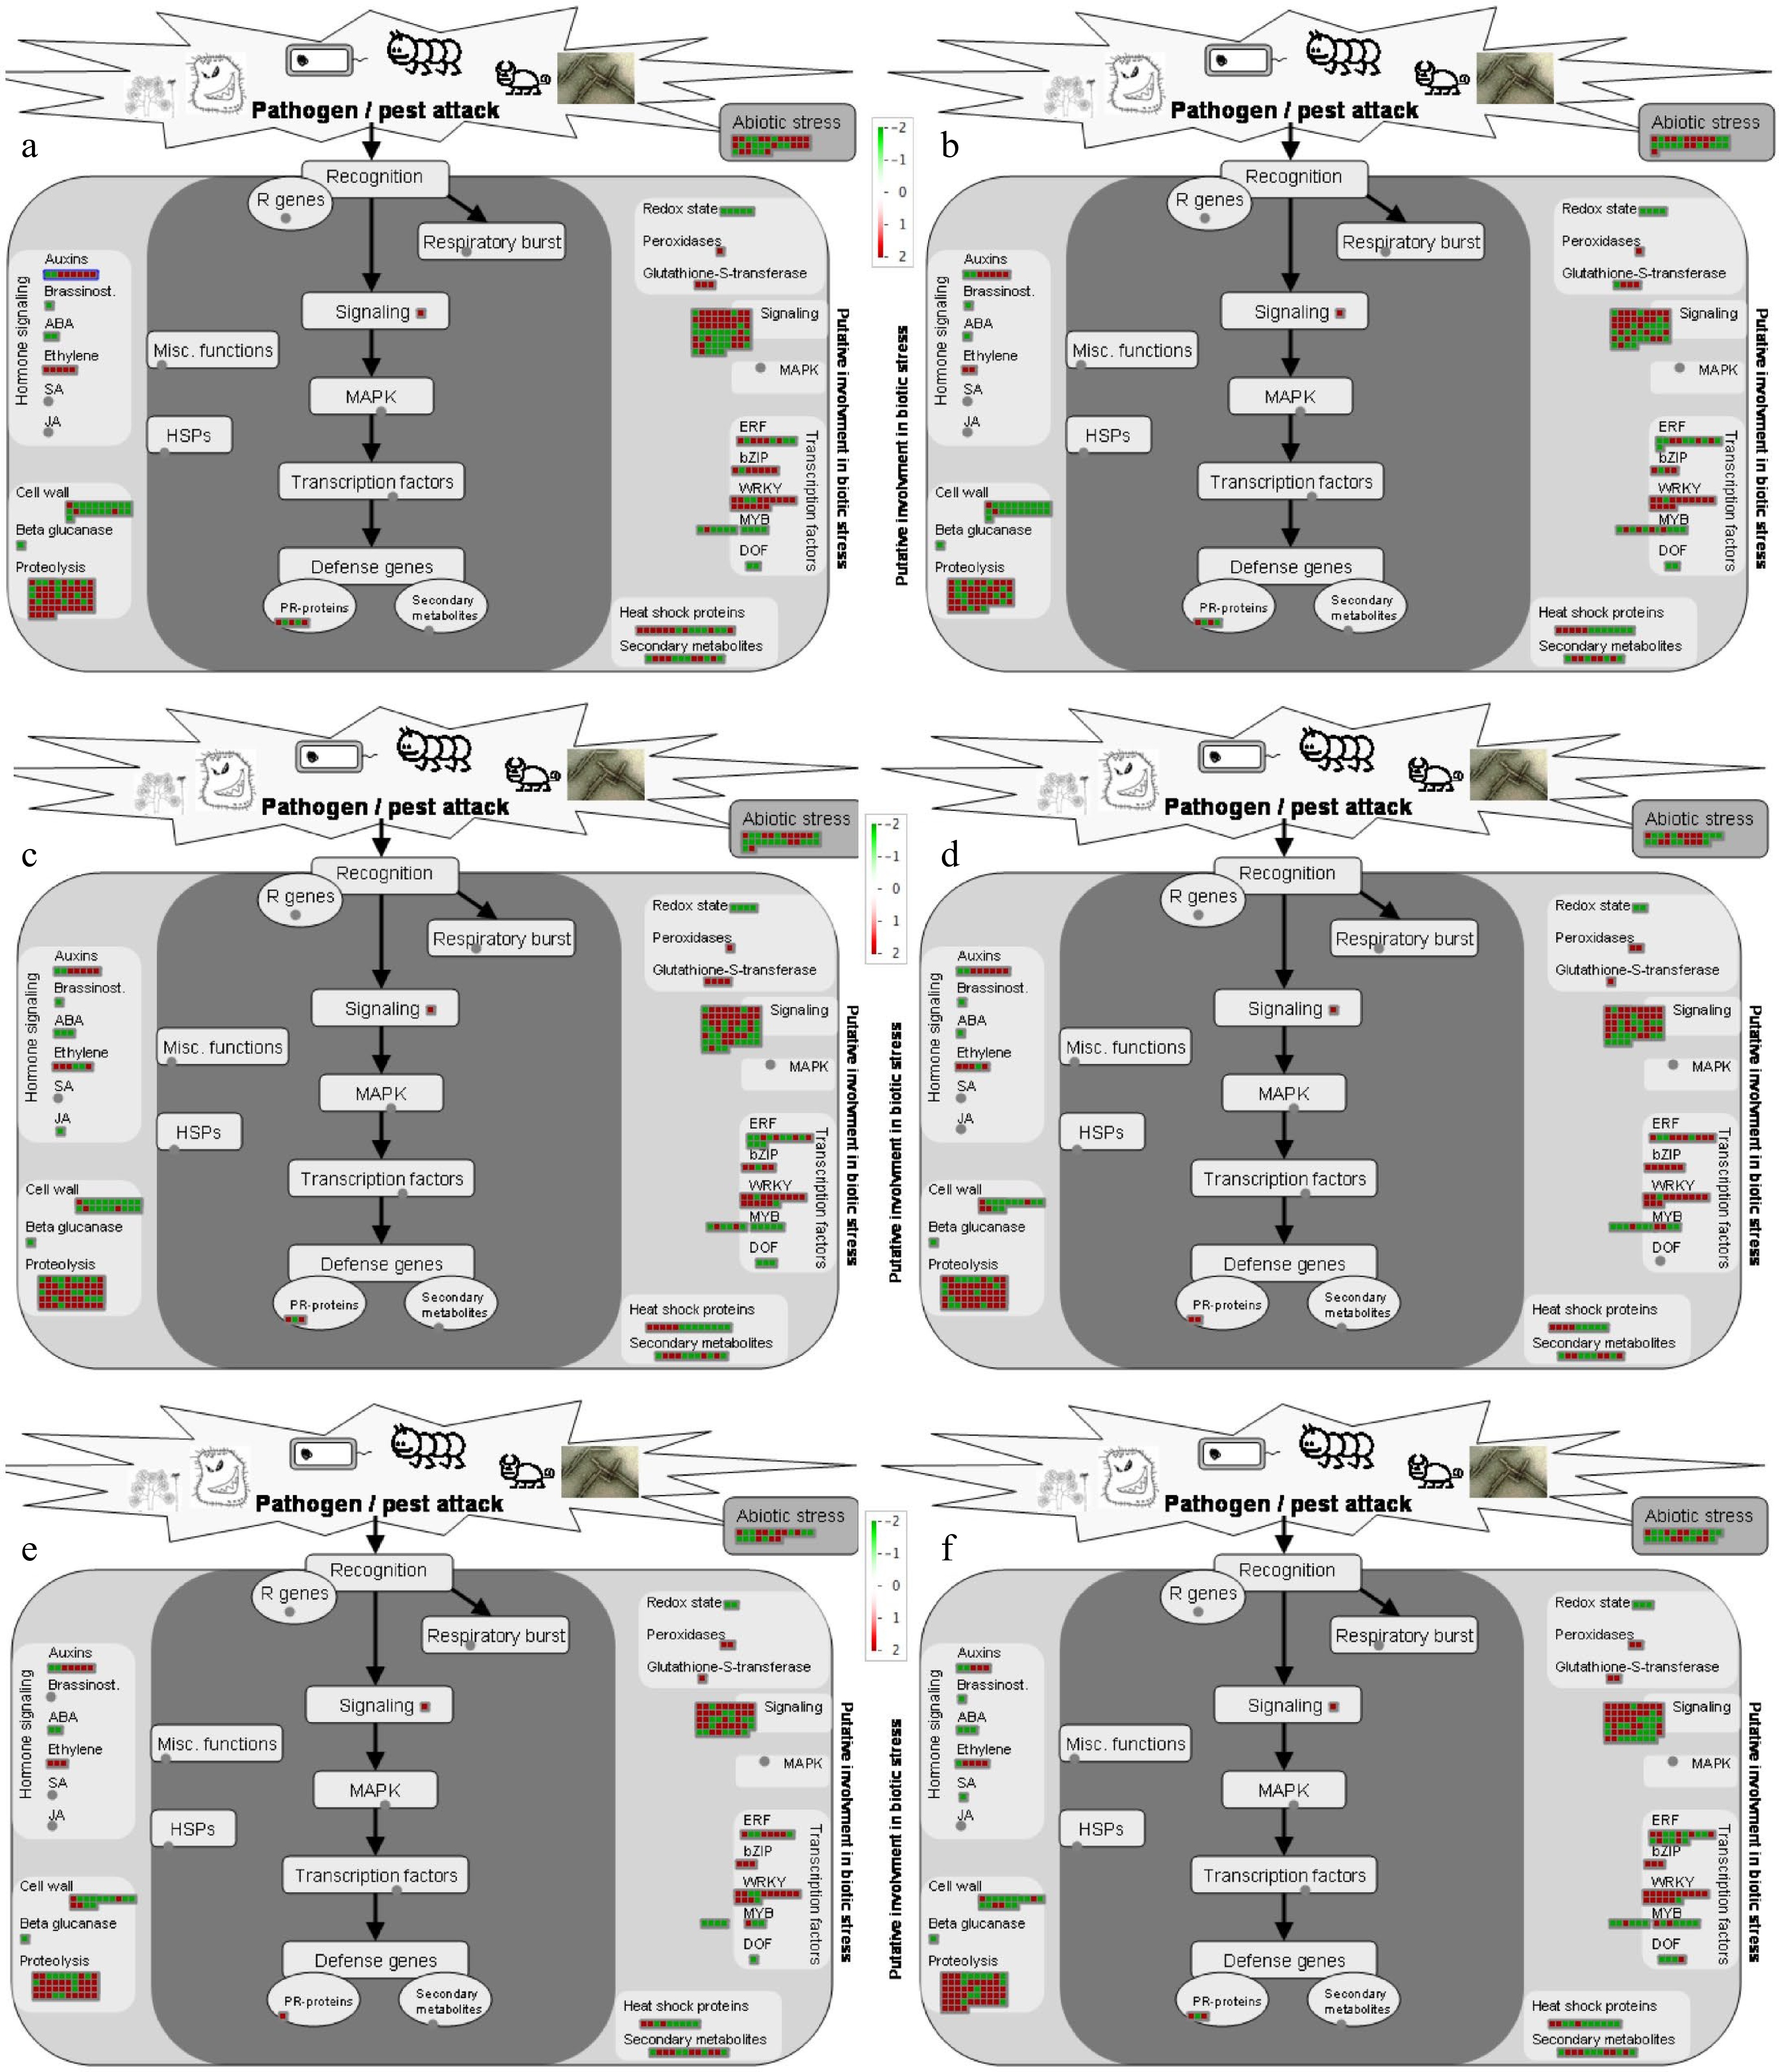
Figure 4.
Visualization of differentially expressed genes involved in biotic stress pathways in response to P. obducens (a) 0 h (hours post-inoculation), (b) 12 h, (c) 24 h, (d) 48 h, (e) 120 h and (f) 240 h. Color gradient represents log2 fold ratios with red representing upregulation and green representing downregulation in treatments over mock roots. Each box represents one transcript.
-
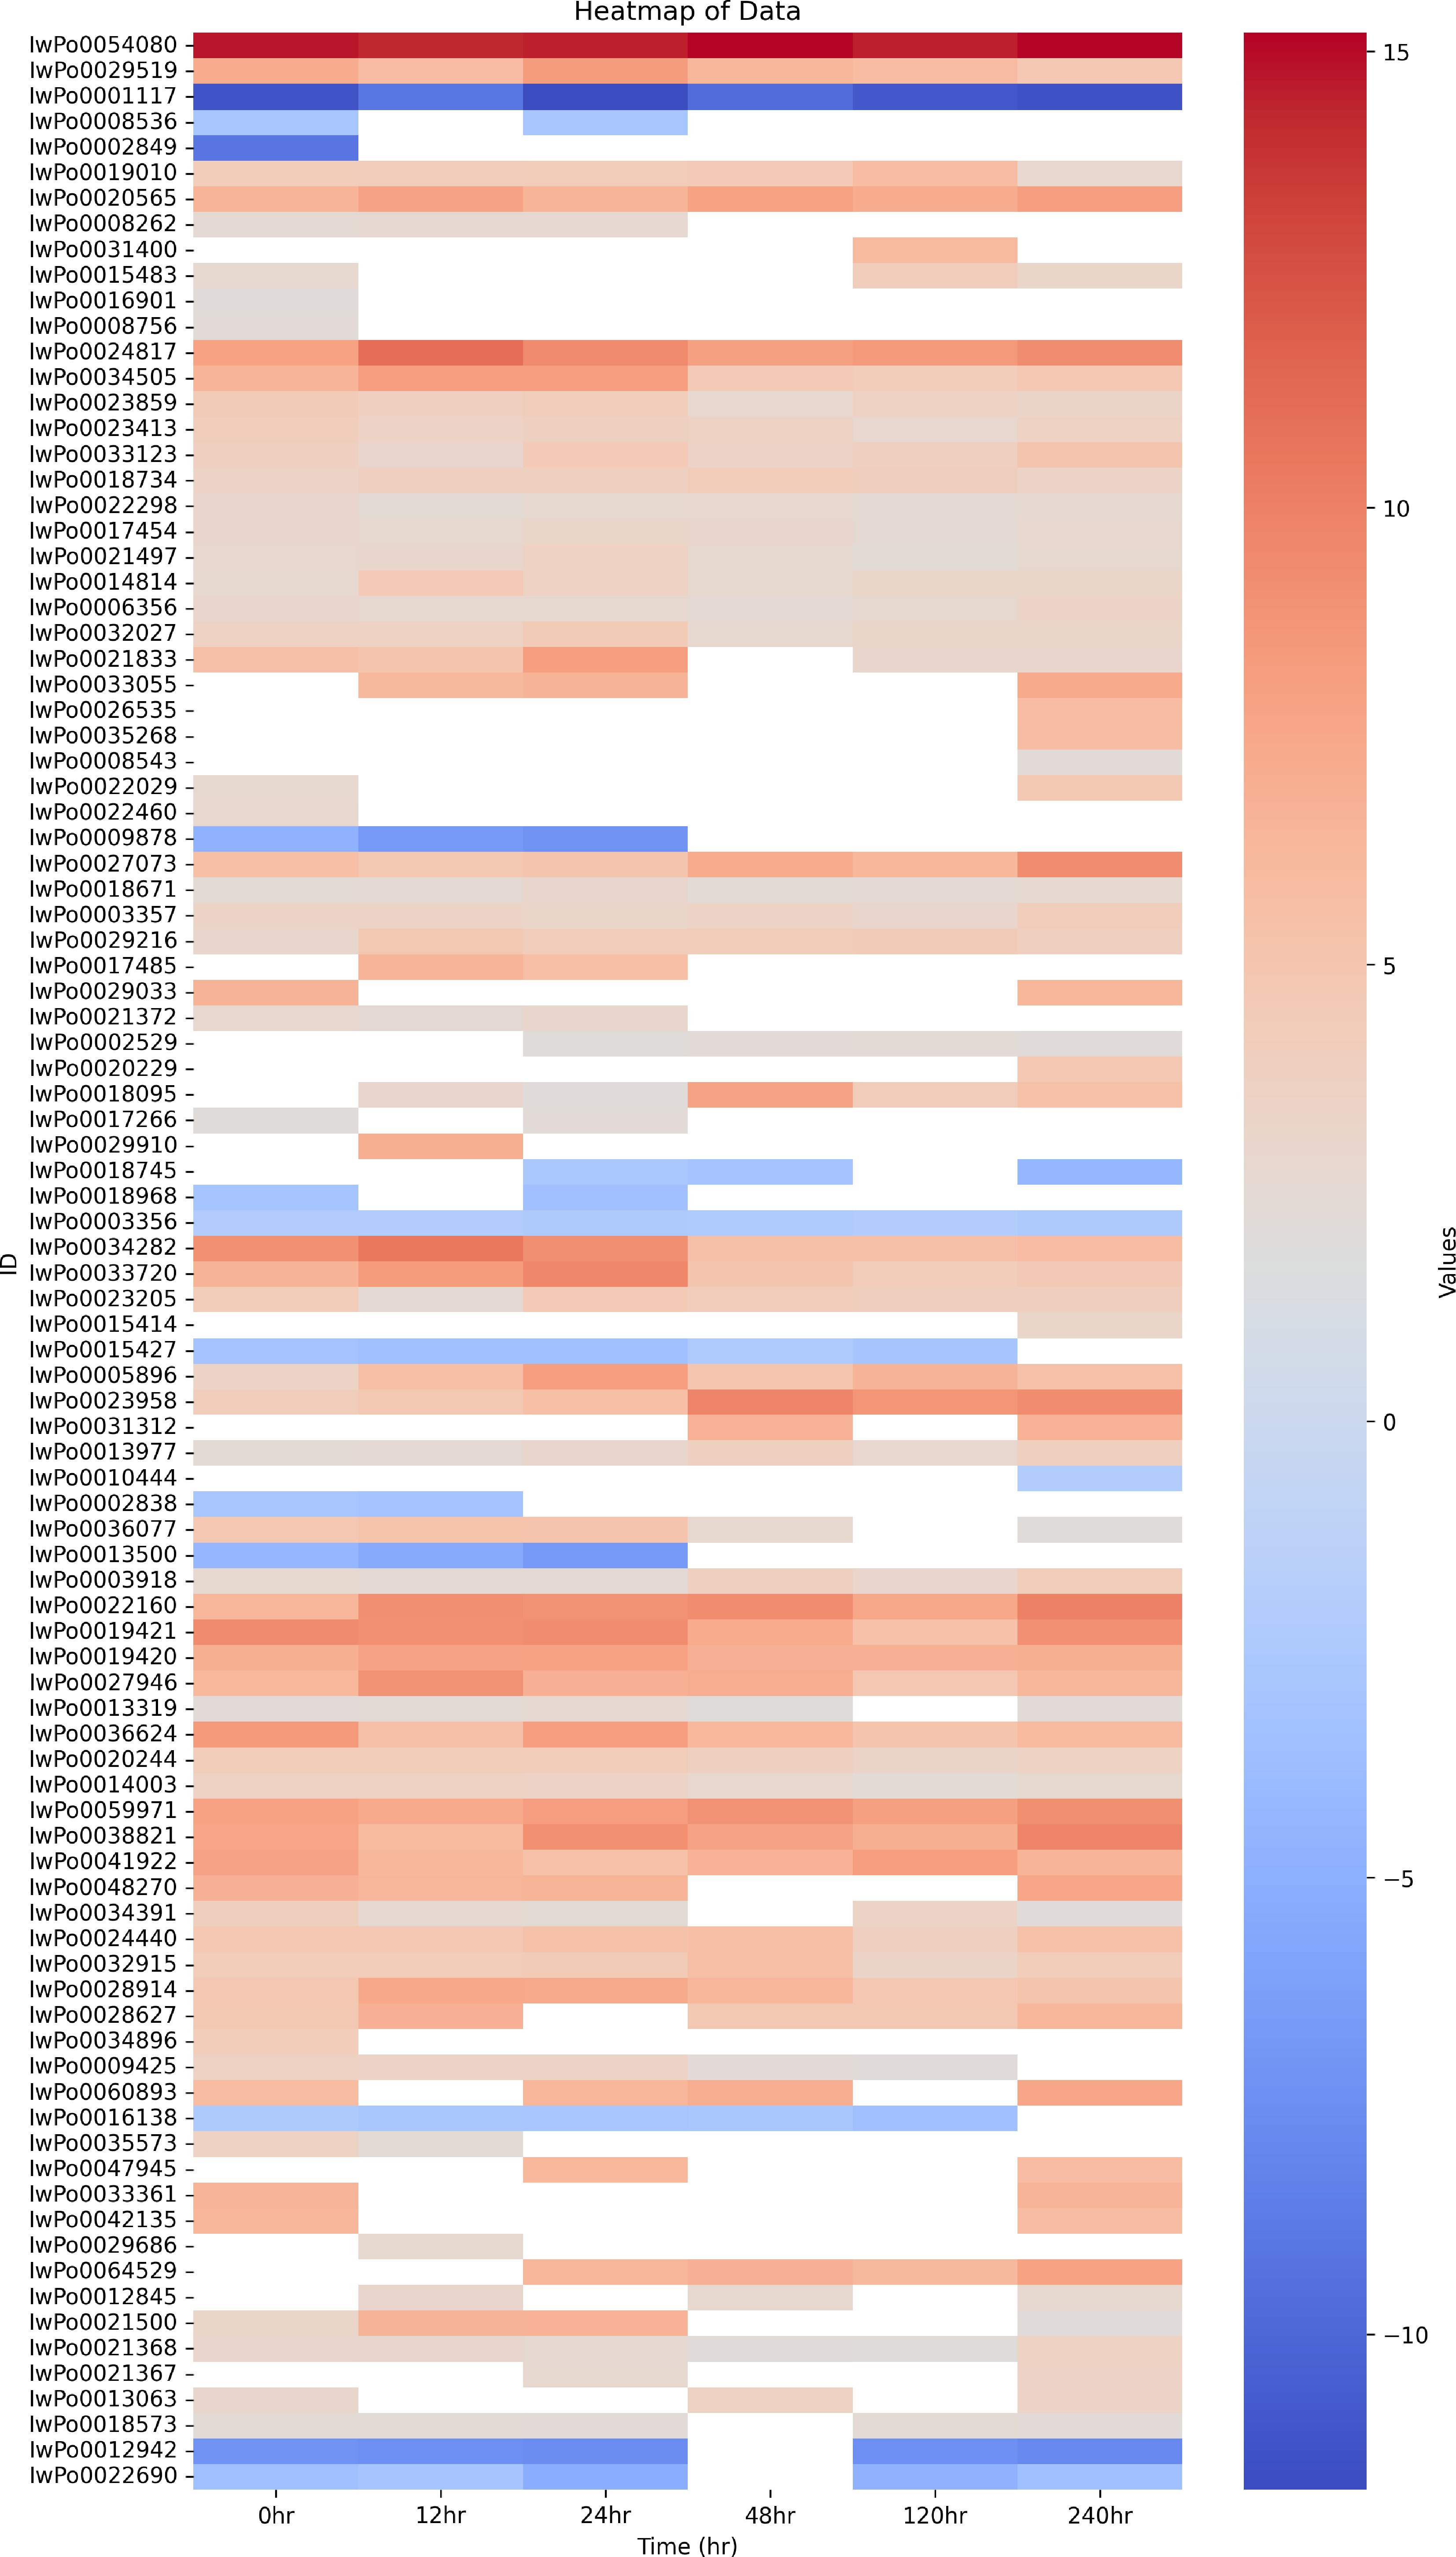
Figure 5.
Heat map of putative plant defense DETs of I. walleriana during infection by P. obducens.
-
Sample ID Raw reads (PE) Clean reads 0H_Control_R1 23,520,868 18,287,675 0H_Control_R2 27,793,058 24,193,950 12H_Control_R1 24,320,452 20,299,572 12H_Control_R2 19,672,888 15,319,055 24H_Control_R1 24,320,452 21,024,513 24H_Control_R2 19,672,888 13,922,270 48H_Control_R1 24,162,182 17,057,095 48H_Control_R2 17,226,072 19,581,661 120H_Control_R1 20,526,634 23,639,470 120H_Control_R2 23,321,216 18,259,179 240H_Control_R1 27,654,810 14,085,034 240H_Control_R2 21,765,004 21,712,471 0H_Infected_R1 37,971,712 29,005,241 0H_Infected_R2 37,778,302 29,248,606 12H_Infected_R1 33,006,920 24,968,942 12H_Infected_R2 31,223,426 24,440,783 24H_Infected_R1 34,379,442 26,500,567 24H_Infected_R2 36,662,544 27,860,148 48H_Infected_R1 31,490,402 23,140,744 48H_Infected_R2 33,238,084 24,795,526 120H_Infected_R1 37,946,602 29,078,825 120H_Infected_R2 34,596,692 25,346,127 240H_Infected_R1 33,746,888 23,867,301 240H_Infected_R2 33,041,348 24,552,405 Total 528,964,774 Table 1.
Statistical summary of RNA sequencing data.
-
Comparison
(infected vs
control)Total
DETsUpregulated
DETsDownregulated
DETsUnique to
timepoint
DETs0 h 4,549 2,470 2,068 298 12 h 4,098 2,132 1,966 140 24 h 4,369 2,235 2,133 201 48 h 3,619 2,006 1,613 112 120 h 3,607 2,066 1,541 97 240 h 4,491 2,672 1,819 502 Table 2.
Pairwise comparisons between infected vs control samples at all six time points.
Figures
(5)
Tables
(2)