-
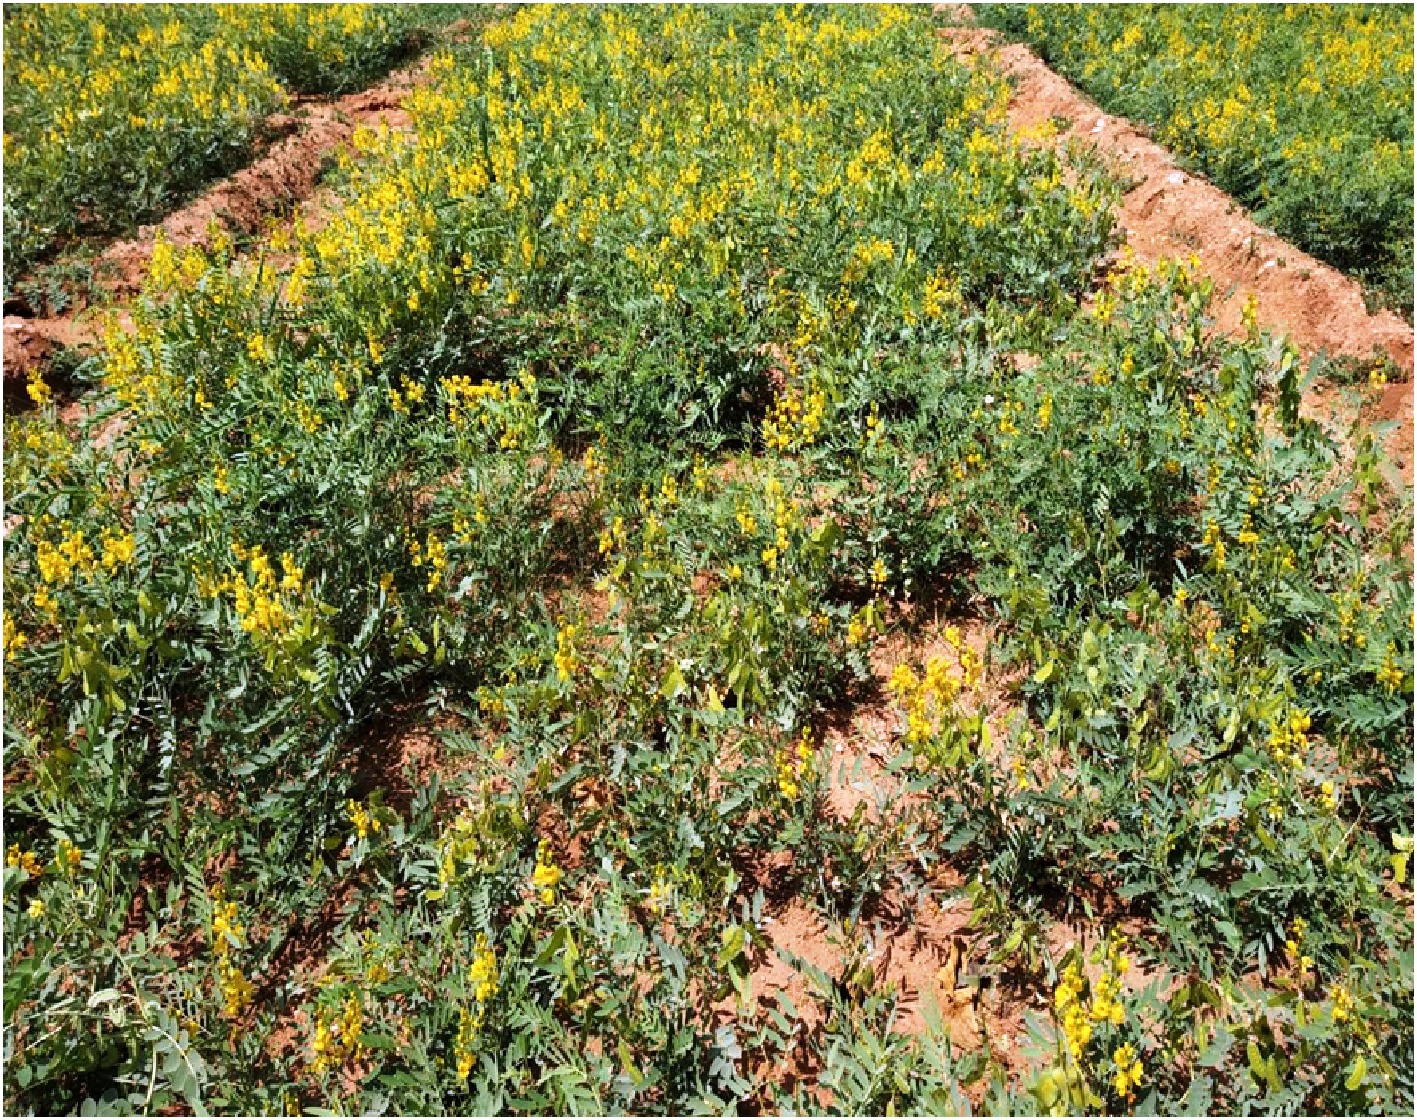
Figure 1.
Field view of the experimental plot of Senna crop.
-
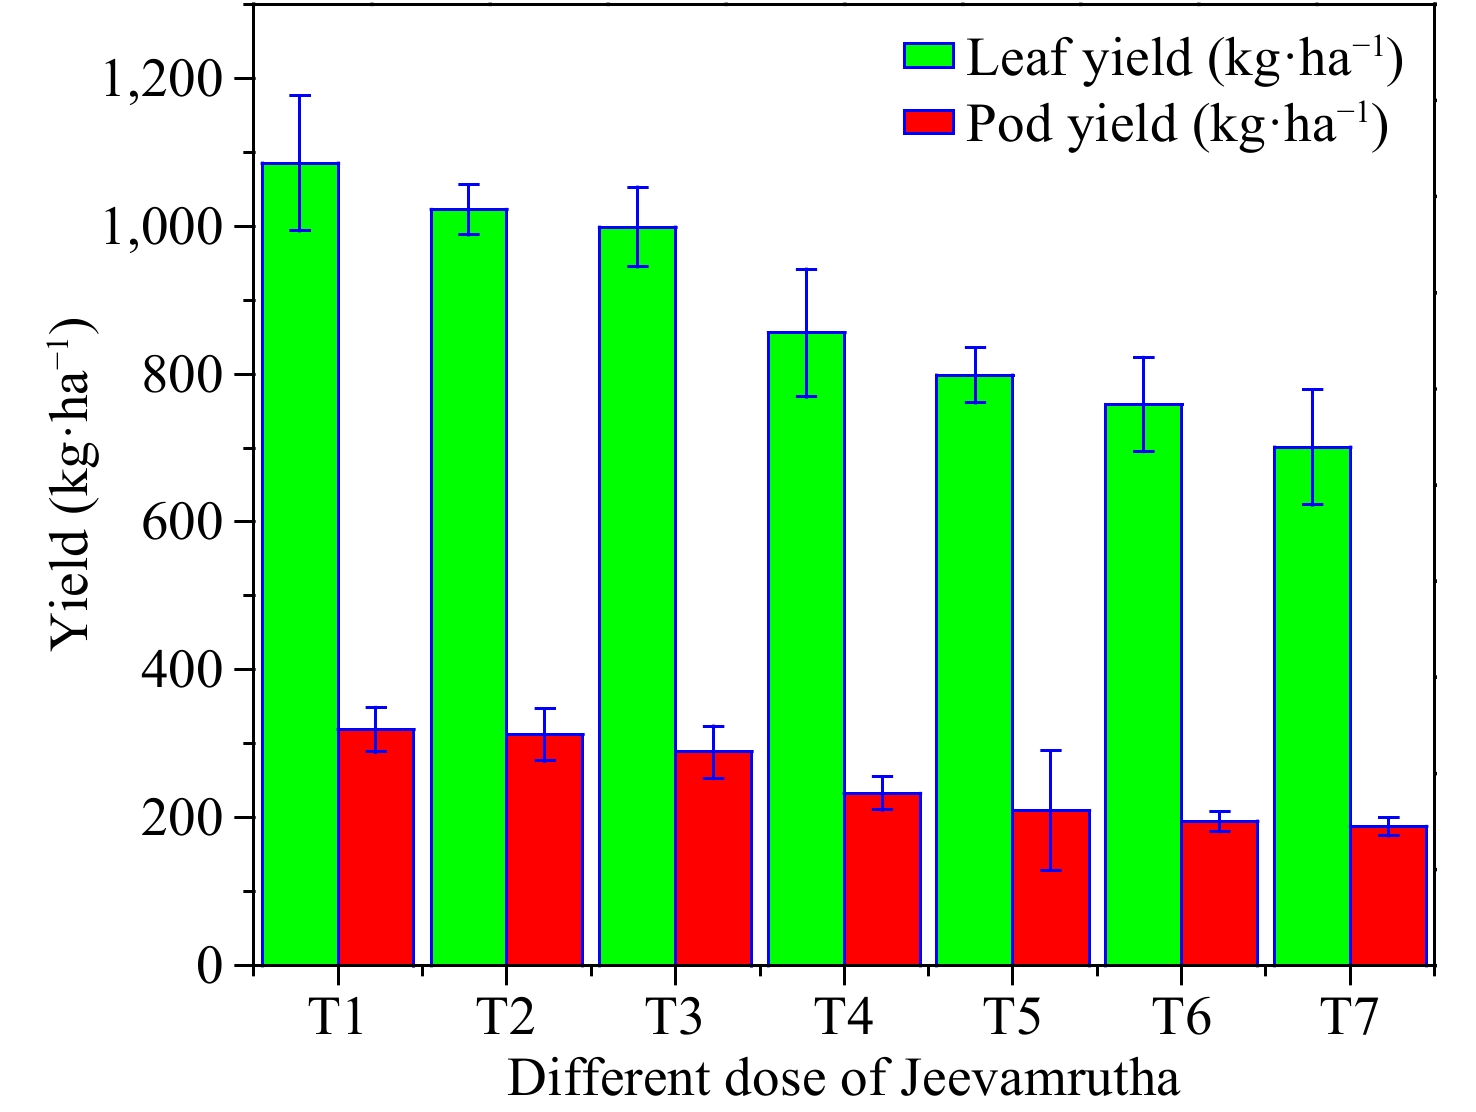
Figure 2.
Influence of different doses of biostimulant/Jeevamrutha on leaf yield (kg·ha−1) and pod yield (kg·ha−1) of Senna.
-
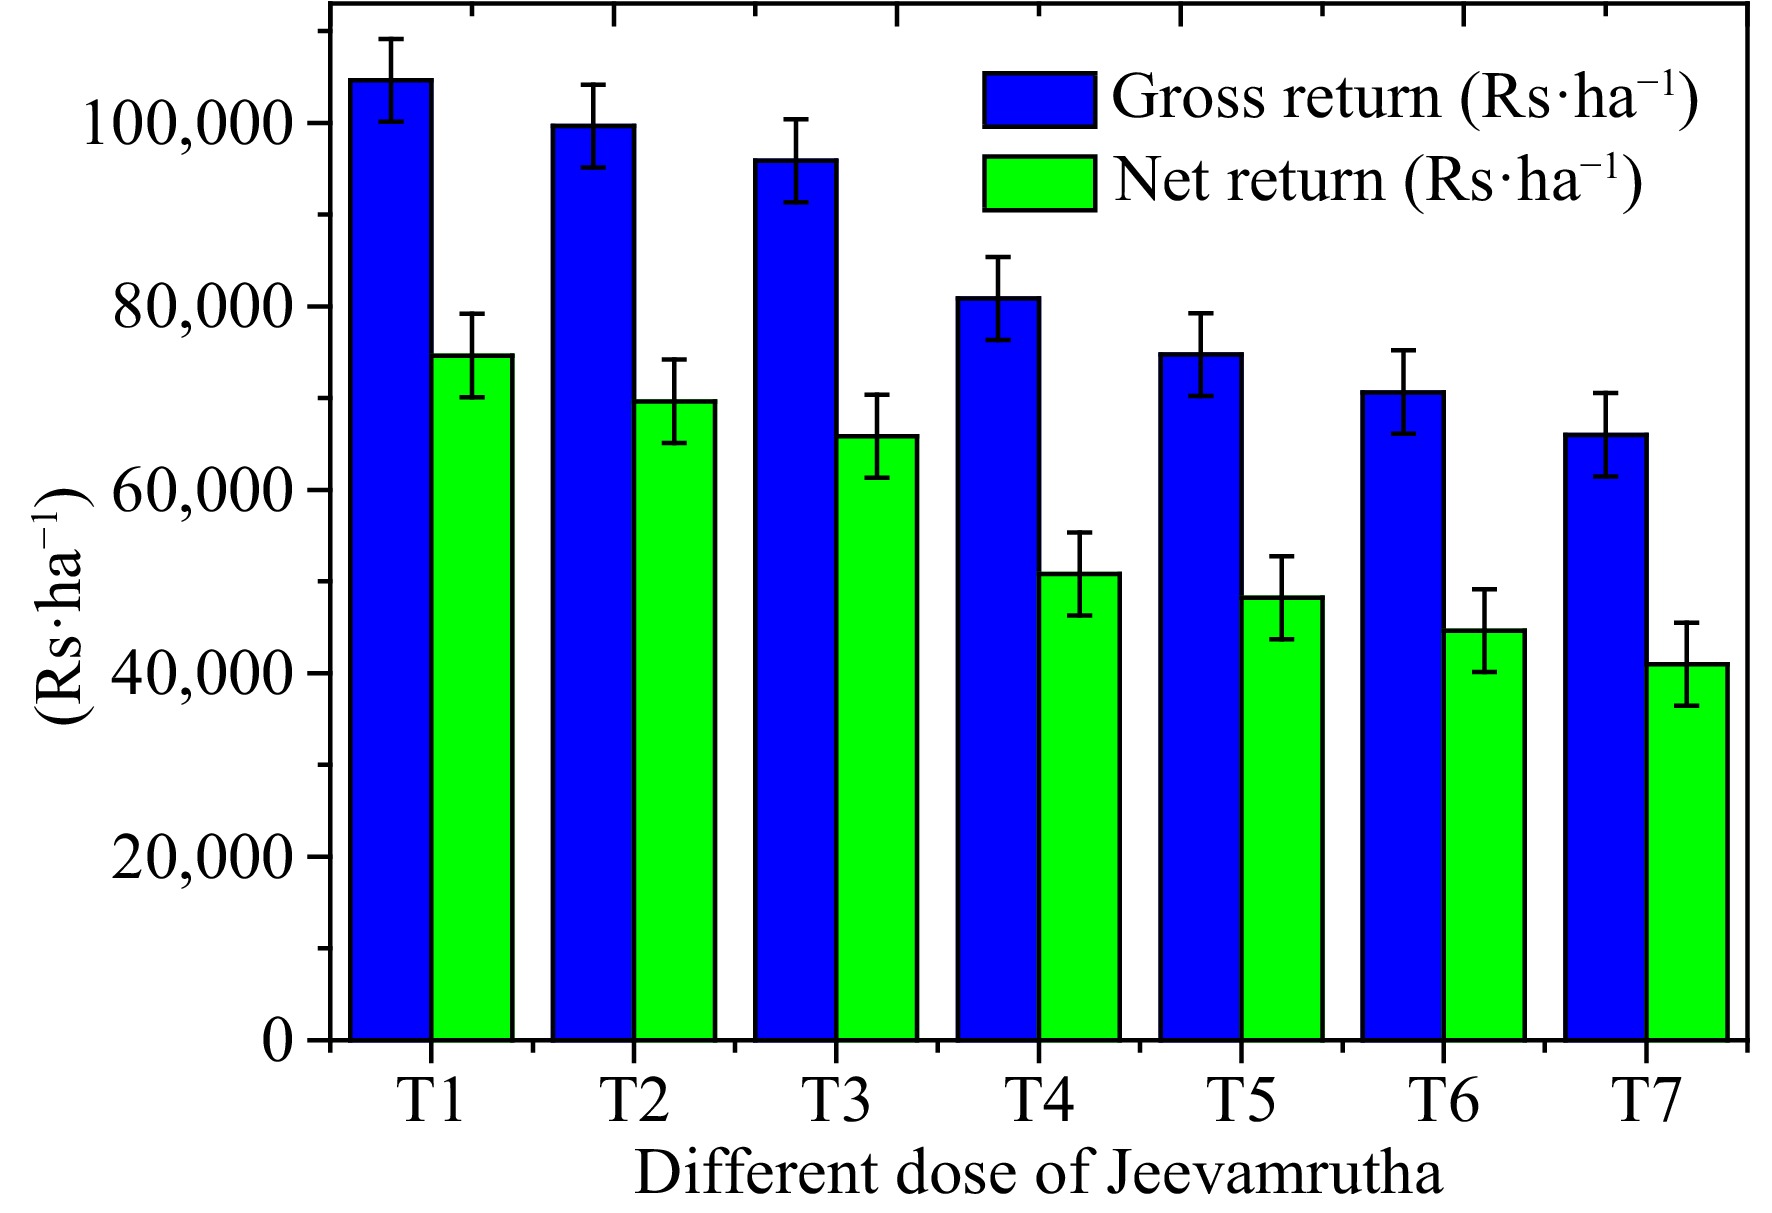
Figure 3.
Influence of biostimulant/Jeevamrutha on gross and net return in Senna.
-
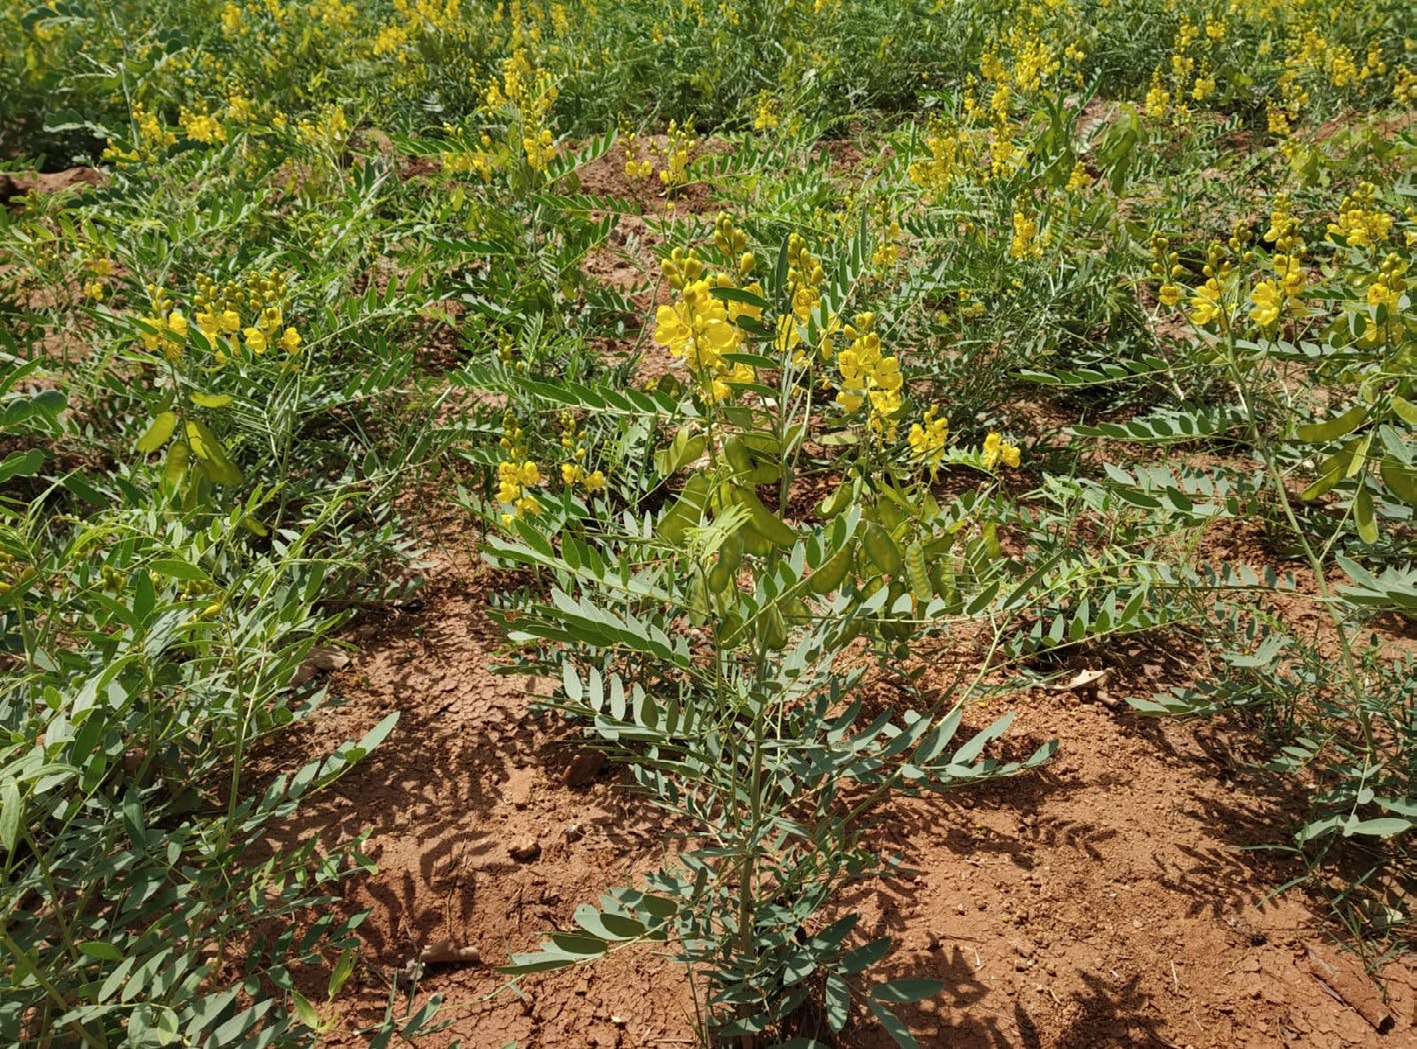
Figure 4.
Application of 150 L (T1) of Jeevamrutha to Senna crop.
-
GPS coordinates, soil and climate Estimated parameters of bio stimulant (Jeevamrutha) Latitude 17°25' N Longitudes 78º33' E pH 7.08 Mean sea level 582 m above EC (dS·m−1) 2.98 Climate Semi-arid tropical Total nitrogen (ppm) 67 Average annual rainfall 764 mm Total phosphorus (ppm) 154 Soil Red sandy soil (79.2% sand, 9.8% silt, 6.8% clay) Total potassium (ppm) 112 pH 7.7 Total zinc (ppm) 3.52 EC 0.77 dS·m−1 Total copper 1.32 Organic carbon 0.29% Total iron (ppm) 12.4 Available N 162.4kg·ha−1 Total manganese (ppm) 7.4 Available P 9.2 kg·ha−1 IAA (ppm) 5.9 Available K 272.6 kg−1 GA3 (ppm) 3.1 Table 1.
Location, climate and soil of CSIR-CIMAP R.C. at Boduppal, Hyderabad, Telangana State, PIN: 500 092, India and chemical composition of bio stimulant.
-
Organisms Bio stimulant (Jeevamrutha) Bacteria (cfu·mL−1) 15.42 × 10⁵ Fungi (cfu·mL−1) 12.12 × 10³ Actinomycetes (cfu·mL−1) 2.92 × 10³ Free-living nitrogen fixers (cfu·mL−1) 5.20 × 10² Phosphate solubilizing organisms (cfu·mL−1) 3.20 × 10² Table 2.
Microbial population in bio stimulant.
-
Treatments Plant height (cm) No. of branches per plant No. of leaves per plant Total dry matter production (g·plant−1) Chlorophyll content Leaf area LAI No of pods
per plantT1 43.7 19.9 180.3 35.91 13.25 66.02 4.89 726 T2 40.2 17.2 177.2 34.25 12.13 64.21 4.76 720 T3 39.2 16.8 176.4 33.12 10.24 63.92 4.73 689 T4 34.2 14.2 165.2 29.74 9.23 59.21 4.39 654 T5 31.5 13.8 154.7 25.15 9.01 56.27 4.17 598 T6 29.9 10.2 144.3 23.21 8.78 55.32 4.10 546 T7 26.9 8.5 135.2 21.58 8.03 49.13 3.64 487 S.Em± 1.82 0.91 2.8 1.34 0.52 1.4 0.11 18.2 CD (P = 0.05) 5.41 2.74 8.4 4.02 1.56 4.2 0.34 54.7 T1: 150 L of bio stimulant per acre, T2: 125 L of bio stimulant per acre, T3: 100 L of bio stimulant per acre, T4: 75 L of bio stimulant per acre, T5: 50 L of bio stimulant per acre, T6: 25 L of bio stimulant per acre, T7: Control. Table 3.
Effect of different doses of bio stimulant (Jeevamrutha) on growth and yield parameters of Senna in semi-arid regions of India.
-
Treatments Sennoside content (%) Sennoside yield
(kg·ha−1)Leaves Pod T1 2.01 3.11 31.7 T2 1.98 3.09 29.9 T3 1.89 2.97 27.4 T4 1.93 2.69 22.8 T5 1.87 2.66 20.5 T6 1.69 2.59 17.9 T7 1.52 2.42 15.2 S.Em± 0.03 0.06 1.2 CD (P = 0.05) 0.09 0.12 3.7 T1: 150 L of bio stimulant per acre, T2: 125 L of bio stimulant per acre, T3: 100 L of bio stimulant per acre, T4: 75 L of bio stimulant per acre, T5: 50 L of bio stimulant per acre, T6: 25 L of bio stimulant per acre, T7: Control. Table 4.
Effect of bio stimulant (Jeevamrutha) on sennoside content in leaves and pod and sennoside yield.
-
Treatments Bacteria
(cfu·g−1)Fungi
(cfu·g−1)Actinomycetes
(cfu·g−1)Nitrogen fixer
(cfu·g−1)P solubilizers
(cfu·g−1)T1 8.2 × 10⁵ 7.3 × 10⁴ 4.1 × 10³ 1.9 × 10³ 3.9 × 10³ T2 7.6 × 10⁵ 6.8 × 10⁴ 4.0 × 10³ 2.1 × 10³ 3.2 × 10³ T3 7.1 × 10⁵ 6.2 × 10⁴ 3.7 × 10³ 1.7 × 10³ 2.7 × 10³ T4 6.7 × 10⁵ 5.8 × 10⁴ 3.6 × 10³ 1.8 × 10³ 2.5 × 10³ T5 6.0 × 10⁵ 5.1 × 10⁴ 3.4 × 10³ 1.2 × 10³ 1.9 × 10³ T6 6.2 × 10⁵ 4.9 × 10⁴ 2.8 × 10³ 1.4 × 10³ 1.7 × 10³ T7 5.7 × 10⁵ 4.2 × 10⁴ 2.2 × 10³ 1.3 × 10³ 1.6 × 10³ S.Em± 0.3 × 10⁵ 0.4 × 10⁴ 0.23 × 10³ 0.3 × 10³ 0.1 × 10³ CD
(P = 0.05)0.9 × 10⁵ 1.2 × 10⁴ 0.55 × 10³ NS 0.3 × 10³ T1: 150 L of bio stimulant per acre, T2: 125 L of bio stimulant per acre, T3: 100 L of bio stimulant per acre, T4: 75 L of bio stimulant per acre, T5: 50 L of bio stimulant per acre, T6: 25 L of bio stimulant per acre, T7: Control. Table 5.
Effect of different doses of bio stimulant (Jeevamrutha) on beneficial microorganisms in the soil.
-
Treatments Dehydrogenase activity (µg·TPF−1·g−1·h−1) Alkaline phosphatase (µg·TPF−1·g−1·h−1) Acid phosphatase (µg·TPF−1·g−1·h−1) β-Glucosidase
(µg·TPF−1·g−1·h−1)Protease
(µg·TPF−1·g−1·h−1)T1 1.33 412 367 120 154 T2 1.17 374 355 99 123 T3 0.90 382 248 84 120 T4 0.75 291 201 75 100 T5 0.54 277 155 65 85 T6 0.48 132 112 50 59 T7 0.41 88 55 29 22 SEm± 0.15 12.8 7.1 3.9 4.8 CD (P = 0.05) 0.45 38.2 21.4 11.7 14.1 T1: 150 L of bio stimulant per acre, T2: 125 L of bio stimulant per acre, T3: 100 L of bio stimulant per acre, T4: 75 L of bio stimulant per acre, T5: 50 L of bio stimulant per acre, T6: 25 L of bio stimulant per acre, T7: Control. Table 6.
Effect of different doses of bio stimulant (Jeevamrutha) on enzyme activity in the soil.
-
Treatments Gross return
(USD${\$} $ Net return
(USD${\$} $ Benefit-cost ratio T1 1,495.0 1,066.4 3.49 T2 1,423.8 995.2 3.32 T3 1,369.4 940.9 3.20 T4 1,154.9 726.3 2.99 T5 1,067.9 689.3 2.82 T6 1,009.4 637.9 2.72 T7 942.9 585.8 2.64 S.Em± 21.8 21.8 CD (P = 0.05) 64.5 64.5 T1: 150 L of bio stimulant per acre, T2: 125 L of bio stimulant per acre, T3: 100 L of bio stimulant per acre, T4: 75 L of bio stimulant per acre, T5: 50 L of bio stimulant per acre, T6: 25 L of bio stimulant per acre, T7: Control. Table 7.
Effect of different doses of bio stimulant (Jeevamrutha) on gross and net return of Senna.
Figures
(4)
Tables
(7)