Processing math: 100%
ARTICLE   Open Access    

Optimization of a new organic approach to natural biostimulant (Jeevamrutha) for yield and quality management in Senna (Cassia angustifolia Vahl.): an agriculturally highly export-oriented crop

More Information
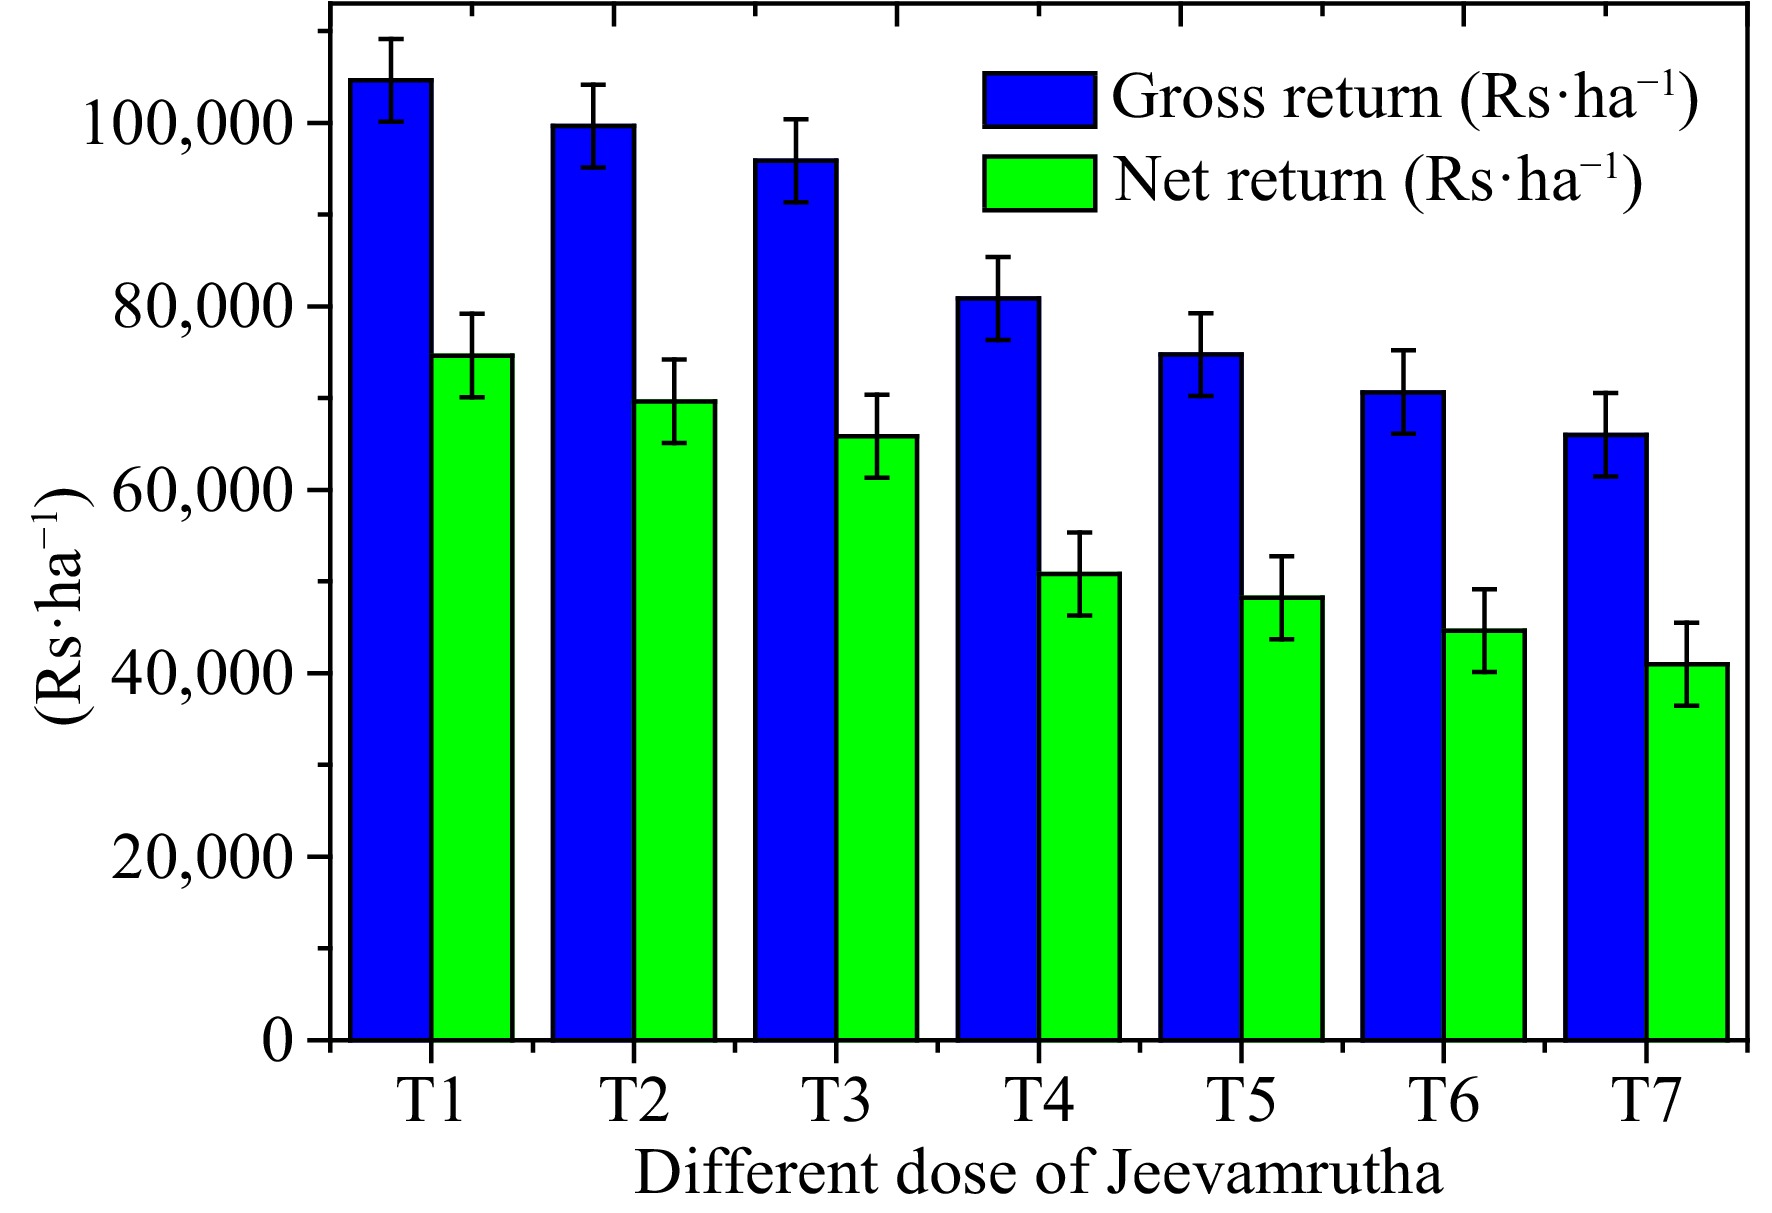
  • Senna is a leguminous and industrial crop that produces high-quality glycosides (sennosides) in its leaves and pods, which have substantial therapeutic effects for alleviating constipation worldwide. However, further research on employing Jeevamrutha in Senna is required. As a result, the experiment was carried out at CSIR-CIMAP in Hyderabad for two consecutive years, in the years 2020–2021 and 2021–2022. The main aim is to identify the optimum dose of Jeevamrutha for higher growth, yield, and quality in Senna. The study used a randomized complete block design (RCBD) with seven treatments repeated three times. From the obtained result, it was observed that the application of 150 L of Jeevamrutha per acre observed significantly high leaf yields (1,085.2 kg·ha−1) and pod (318.7 kg·ha−1) equivalent to T2 in comparison to other treatments, i.e., application of 125 L of Jeevamrutha per acre (1,022.5 kg·ha−1, 312.1 kg·ha−1), and was succeeded by T3, i.e., application of 100 L of Jeevamrutha per acre (998.5 kg·ha−1, 288.5 kg·ha−1, respectively). Lower leaf yield (700.2 kg·ha−1) and pod yield (487 kg·ha−1) were observed in the control (T7). Similarly, the application of 150 L of Jeevamrutha per acre recorded significantly higher sennoside content in leaves (2.01%) and pods (3.11%), in comparison to other treatments, and was followed by T2 (1.98%, 3.09%) and T3 (1.89%, 2.97%). A similar trend was noticed in returns, i.e., the application of 150 L of Jeevamrutha per acre recorded significantly higher gross returns (USD$1,495 ha−1) and net returns (USD$1,066.4 ha−1).
  • Tea, a beverage with a long history and widely loved by consumers contains many active substances such as tea polyphenols, catechins, alkaloids, tea polysaccharides, etc., and these ingredients have a variety of health benefits, such as antioxidant, hypoglycemic, hypotensive, hypolipidemic, and antibacterial effects[14]. Green tea is the largest tea variety produced in China, which is classified as an unfermented tea with high nutritional value. From fresh leaves to the final product, green tea goes through multiple steps such as fixation, rolling, and drying[5]. Fixation (tea killing green) is a crucial step in tea processing, which involves heating the freshly picked tea leaves to terminate further enzymatic oxidation, preserve the color, aroma, and flavor of the tea, and prepare them for subsequent processing steps. Depending on different fixation and drying methods, green tea can be further divided into pan-fired, sun-dried, baked, and steamed green tea.

    Selenium (Se) has excellent antioxidant properties that can avoid the aging process caused by the oxidation of cells due to free radicals. Besides, selenium also has multiple effects, including inhibiting the growth and division of cancer cells, optimizing cytokines in serum, maintaining the stability of cell DNA, and enhancing cellular immune response[6]. Selenium has the characteristics of counteracting heavy metals such as lead, cadmium, mercury, arsenic, etc, which can generate insoluble complexes, thereby reducing the accumulation of these heavy metals in the organism[7]. Tea is a plant with selenium accumulation ability. Se-enriched teas combine the flavor and health benefits of tea with the additional wellness advantages of selenium, holding promising market potential[6,8]. Meanwhile, the application of exogenous selenium fertilizer can increase tea yield, improve tea quality, and enhance the tea plant's resistance to various biotic and abiotic stresses, including pests and diseases, as well as exogenous hazardous substances (such as pesticides and heavy metals)[9,10]. According to the standards of the Chinese Ministry of Agriculture (NY/T 600-2002), Se-enriched teas refer to the buds, leaves, and tender stems of tea tree shoots grown in selenium-rich soil. After specific processing, the selenium content of Se-enriched teas should be controlled within the range of 0.25−4.00 mg/kg. Selenium-rich green tea showed more protective effects against lipid peroxidation and free radical scavenging ability than ordinary green tea[11]. Compared with conventional tea, the aqueous extract of selenium-rich green tea showed superior inhibitory effects on HepG-2 cells[12]. Selenium-rich green tea has a significant protective effect on liver fibrosis triggered by carbon tetrachloride (CCl4), and further screens high-content antioxidant substances from rat liver tissue, serum, and urine samples[13]. Selenium polysaccharide components from Se-enriched teas were confirmed to be α-galacturonic acid transferase inhibitors, peroxidase activity inhibitors, and superoxide dismutase activity enhancers[14]. Therefore, Se-enriched teas are attracting favorable attention from researchers and consumers as a promising natural source of Se supplementation.

    In the processing of tea infusion, brewing is a crucial step to determine the quality of the tea infusion. Proper brewing conditions before the processing of tea extract can effectively improve the quality of tea extract. The influencing factors that determine the quality of tea infusion include types and appearance of tea, brewing temperatures, water/tea ratio, brewing duration, brewing times, and water quality[5]. The brewing temperature is pivotal in determining the quality of the tea infusion. Based on diffusion principles, the dissolution speed of tea polyphenols and caffeine accelerates as the brewing temperature rises[15]. Moreover, extending the brewing duration can inhibit the precipitation of tea extract. Therefore, it is recommended to appropriately extend the brewing duration to ensure saturated and uniform dissolution, ultimately achieving better extraction of tea pigments like theaflavins (TFs), thearubigins (TRs), and theabrownins (TBs)[16]. While high brewing temperatures may increase the dissolved amount, improper thermal treatments can lead to the oxidation and browning of tea active components with a bitter and turbid taste[17]. Conversely, the low brewing temperature may reduce the dissolution efficiency and weaken the flavor of tea infusions[18]. Although prolonging the brewing duration allows for a higher dissolution rate of the main substances of tea, long brewing duration may cause adverse effects, including browning of the tea infusion color, increased turbidity, and the loss of aroma[19,20].

    The quality of tea infusion is paramount for tea processing and consumption. To the best of our knowledge, there has been a lack of systematic studies examining the dynamic changes of quality components in Se-enriched green teas under various brewing conditions (temperature, duration, and time). Therefore, this study focuses on Se-BF and Se-YL to elucidate their chemical profiles, dissolution patterns, sensory attributes, and in vitro biological activities, providing a scientific foundation for rational tea consumption and the development of industrial tea beverages.

    Three different batches of green tea samples were produced in 2021, 2022, and 2023, generously provided by Enshi Selenium Impression Agricultural Technology Co., Ltd (Hubei Province, China). The ordinary Xiazhou Bifeng and Enshi Yulu green teas were termed BF and YL, respectively, while the Se-enriched Xiazhou Bifeng and Enshi Yulu green teas were named Se-BF and Se-YL, respectively. Specific information about the tea samples can be found in Supplementary Table S1. All teas were packaged properly in sealed bags and stored in a dry environment. For long-term storage, teas were refrigerated at −20 °C. Glucosamine selenium (GlcN-Se) was synthesized by Jiangsu Shuanglin Marine Biology Group Co., Ltd. (Jiangsu, China) with selenium content of 4.00% ± 0.20%. All other chemical agents were of analytical grade and provided by Sinopharm Chemical Reagent Co., Ltd. DPPH and ABTS were provided by Aladdin Industrial Corporation (Shanghai, China). α-glucosidase and α-amylase were purchased from Shanghai Yuanye Bio-Technology Co., Ltd (Shanghai, China).

    The soluble protein content was determined by the Coomassie brilliant blue method according to the description of the National Standard of China (SN/T 3926-2014). Tea polysaccharide content was determined by the phenol sulfuric acid method according to the National Standard of China (SN/T 4260-2015). The content of total flavonoids was measured by the spectrophotometer method by the National Standard of China (SN/T4592-2016). The theanine content was determined according to the National Standard of China (GB/T8314-2013). The contents of catechins and caffeine were determined using an LC-20A high-performance liquid chromatography (HPLC) system (Shimadzu, Tokyo, Japan). The spectrophotometric method was adopted to determine the total polyphenol content in tea in accordance with the National Standard of China (GB/T 8313-2018). The content of minerals was determined by Optima 8000 inductively coupled plasma emission spectrometer (Perkin Elmer, MA, USA). The content of tea pigments (theaflavins, thearubigins, and theabrownins) were determined using a T6PC UV Spectrophotometer (Beijing Puxi general instrument) according to previous studies with some modifications[2123]. Concerning the agricultural industry standard in China (NYT 3082-2017), the spectrophotometric method is adopted to determine the chlorophyll content with some modifications. Concerning the National Standard of China (GB 5009.268-2016), the ICP-MS method is adopted to determine the selenium content of teas.

    One gram of tea leaves was weighed into a beaker with the addition of 50 mL of water and was immediately placed in a water bath at 65, 75, 85, and 100 °C for 1, 2, 3, 4, 5, 10, 20, and 40 min. After brewing, the tea infusion was filtered and kept for the determination of the dissolution rates of tea active ingredients. The content of different tea active ingredients measured under the conditions of 100 °C and 40 min is taken as 100% of dissolution rate to calculate the dissolution rates of tea active ingredients in different teas under various brewing conditions.

    A sensory evaluation team composed of 30 well-trained sensory evaluation panelists recruited from Shanghai Normal University conducted a sensory evaluation on tea infusions concerning GB/T 23776-2018 'Tea Sensory Evaluation Method'. The team members were aged between 20 and 30, with equal numbers of males and females. Each panelist had at least 1 year of experience in sensory evaluation of tea and has completed the basic smell test, aroma matching test, aroma ranking test, sensory description ability test. Before the experiment, the study design and procedures were thoroughly reviewed and ethically approved by the ethics committee. The rights and privacy of all participants were utilized during the execution of the research. The participants have given their consent to take part in the sensory study and use their information. To ensure fairness, the tea samples were coded and randomly placed, and an anonymous evaluation method was adopted. The sensory evaluation was conducted from five aspects: leaf residue, aroma, color, taste, and clarity. The scoring criteria are listed in Supplementary Table S2. After tasting each sample, the team members rinsed their mouths to avoid intervention between samples. The entire process required careful and objective judgment to ensure the accuracy and reliability of the results.

    Based on the preliminary research findings of this study, combined with consumers' daily tea-drinking habits and the tea evaluation methods stipulated in Chinese national standards, the following brewing conditions were selected to establish a daily tea-drinking model to explore the impact of brewing times on the extraction of tea active ingredients and their in vitro bioactivities: brewing temperature of 100 °C, tea-to-water ratio of 1:50, with a total of four brewings. Specifically, the brewing time for the first, second, and third infusions was 5 min each, while the brewing time for the fourth infusion was designed to be 1 h to ensure sufficient leaching of tea active ingredients.

    The DPPH radical scavenging ability of all tea infusions was measured[24]. In brief, a 0.1 mM ethanol solution (2 mL) of DPPH radicals was added to a water solution (1 mL) of tea infusion at 0, 0.4, 0.8, 1.2, 1.6, and 2.0 mg/mL, respectively. The absorbance of the resulting mixture was measured against a blank sample at 517 nm after 30 min in the dark at room temperature. The DPPH radical scavenging activity was calculated according to the following Eqn (1):

    DPPHradicalscavengingrate(%)=[(A0AiA0)]100 (1)

    where, Ai is the absorbance obtained from a sample and A0 is the absorbance of the control. Results were expressed as the percentage of inhibition of DPPH radical scavenging.

    The total antioxidant capacity of these tea infusions was quantified by the total antioxidant capacity assay kit (ABTS method)[24]. Briefly, 10 μL of the water solution of samples at 2.0 mg/mL were mixed with 20 μL of peroxidase solution and 170 μL ABTS solution. The reaction mixtures were reacted in the dark at room temperature for 6 min using a microplate reader (Powerwave XS, Biotek, USA). The MTrolox standards at 0.1, 0.2, 0.4, 0.8, and 1.0 mM, and the blank were prepared in the same manner as the samples. The absorbance of the reaction mixture was measured at 734 nm. The total antioxidant capacity was expressed as Trolox equivalent after blank subtraction.

    The determination of α-amylase and α-glucosidase enzyme inhibition assay followed a previously described method with some modifications[25]. Briefly, for the α-amylase assay, 500 μL of the tea infusions with different concentrations, or positive control (1 mM acarbose) was added to 500 μL of 13 U/mL α-amylase solution (type VI-B from porcine pancreas in 0.02 M sodium phosphate buffer pH 6.9) and incubated in test tubes at 25 °C for 10 min before 500 μL of 1% soluble starch solution (previously dissolved in sodium phosphate buffer and boiled for 15 min) was added to each tube and incubated for another 25 min. Finally, 1 mL of dinitrosalicylic acid color reagent was added and the tubes were placed in 100 °C water baths for 5 min. The mixture was diluted with 100 mL of distilled water. The absorbance was read at 520 nm. Results were presented as percent inhibition according to Eqn (2).

    α-Amylaseinhibitionrate(%)=Acontrol(AtestAblank)Acontrol×100% (2)

    where, Acontrol is the absorbance of sample without tea infusions, Atest is the absorbance of sample containing tea infusions, and Ablank is the absorbance of sample containing tea infusions, but without enzyme solution.

    For the α-glucosidase assay, in a 96-well plate, 50 μL of BTE with different concentrations, or positive control (1 mM acarbose) was added to 100 μL of a 1 U/mL α-glucosidase solution (in 0.1 M sodium phosphate buffer pH 6.9) and incubated for 10 min. A 50 μL aliquot of a 5 mM p-nitrophenyl-α-d-glucopyranoside (PNPG) solution (in 0.1 M sodium phosphate buffer pH 6.9) was added briefly to each well and incubated at 25 °C for 5 min before the absorbance was read at 405 nm. Results were presented as percent inhibition according to Eqn (3).

    α-Glucosidaseinhibitionrate(%)=Acontrol(AtestAblank)Acontrol×100% (3)

    where, Acontrol is the absorbance of sample without tea infusions, Atest is the absorbance of sample containing tea infusions, and Ablank is the absorbance of sample containing tea infusions, but without enzyme solution.

    All experiments were performed in triplicate and the reported results were the averages of experiments. The data were subjected to statistical analysis of variance using Origin 2021 (OriginLab Corporation, Northampton, MA, USA) and SPSS 18.0 for Windows (SPSS Inc., Chicago, USA), including quadratic polynomial stepwise regression analysis. Statistical differences were determined by one-way analysis of variance (ANOVA) with Duncan's post hoc test and the least significant differences (p < 0.05) were accepted among the treatments.

    The quality of tea is intimately linked to its chemical components. Supplementary Table S3 presents the contents of caffeine, soluble sugar, soluble protein, total free amino acids, flavonoids, and polyphenols in different teas. Tea polyphenols and caffeine contribute to the bitter taste of tea infusions, whereas soluble sugar and free amino acids help mitigate the bitter taste and enhance the freshness of tea infusions. Notably, there were significant differences in the chemical compositions among different teas (p < 0.05). The caffeine content varied from 24.06 to 43.24 mg/g, surpassing the minimum standard of 24 mg/g for teas. The total soluble sugar content ranged from 42.44 to 66.10 mg/g, while the soluble protein content spanned from 7.28 to 10.79 mg/g. The content of free amino acids fell within the range of 58.8 to 75.4 mg/g, and the tea polyphenol content ranged from 124.35 to 164.84 mg/g. Furthermore, comparisons between four different batches of tea revealed significant differences in their contents (p < 0.05), suggesting that influencing factors such as the growth environment of tea trees may contribute to variations in chemical compositions.

    The average contents of main chemical components in BF, Se-BF, YL, and Se-YL are shown in Fig. 1a. The contents of caffeine and polyphenols in BF and YL were both higher than those in the corresponding selenium-enriched teas, which was consistent with our previous research, indicating that the application of selenium fertilizer to tea reduced the contents of polyphenols and caffeine[10]. However, no obvious effect of exogenous selenium fertilizer was observed on soluble protein, soluble sugar, free amino acids, and flavonoids. Interestingly, YL exhibited higher contents of caffeine, soluble total sugar, and soluble protein compared to BF, potentially attributable to differences in processing techniques, which could alter the chemical compositions of teas, ultimately impacting its quality[26]. YL employs steaming as its fixation technology, which aids in preserving original chemical components, whereas BF utilizes high-temperature roasting, leading to the loss of these components. Steaming technology is more effective in retaining higher soluble sugar content and total free amino acid content compared to roasted green tea[27].

    Figure 1.  The average content of (a) main chemical components, (b) catechins, (c) tea pigments, and (d) selenium of four kinds of tea (different superscripts represent significant differences between different teas, p < 0.05).

    The catechin contents of 12 tea samples are listed in Supplementary Table S4. Catechin is the most important phenolic component in tea containing a variety of monomers. The catechin contents in selenium-enriched green teas are mainly EGCG and EGC, and EGCG is considered the most important antioxidant in green teas, accounting for about 30% of the total antioxidant capacity[26]. There were significant differences in catechin contents among different teas (p < 0.05). The GA content is between 3.10−5.21 mg/g, GC content is between 2.74−7.86 mg/g, EGC content is between 11.34−21.34 mg/g, +C content is between 1.99−7.37 mg/g, EGCG content is between 10.05−22.98 mg/g, EC content is between 3.05−10.06 mg/g, and ECG content is between 2.21−8.99 mg/g. The average contents of catechins in BF, Se-BF, YL, and Se-YL are shown in Fig. 1b. The contents of GA and GC in BF and YL were higher than those in their corresponding selenium-enriched green teas, while no effect of exogenous selenium fertilizer was found on other catechins.

    As shown in Supplementary Table S5, this study explored the effects of different natural pigments on the quality of tea. Chlorophyll, an important tea pigment, affects the appearance and leaf color of tea. The tea polyphenols will undergo oxidation to form theaflavins (TFs), which are further oxidized to yield thearubigins (TRs). Thearubigins may combine with other substances to form theabrownins (TB), which not only affect the color of tea infusion but also increase the mellow taste of tea infusion[28]. There were significant differences in the content of tea pigments among teas (p < 0.05). The concentration of theaflavins ranged from 0.22 to 0.65 mg/g; the concentration of thearubigins ranged from 3.21 to 6.39 mg/g; the concentration of theabrownins ranged from 0.24 to 0.64 mg/g and the concentration of total chlorophyll ranged from 3.08 to 5.52 mg/g. Notably, thearubigins exhibited the highest content in all tea samples, suggesting that TRs had not yet been fully converted into TBs. Moreover, substantial differences were observed between samples of the same tea type from different batches (p < 0.05), highlighting the instability of tea pigments. Figure 1c illustrates the average content of natural pigments in tea. After selenium biofortification, the contents of theaflavins, theabrownins, chlorophyll a, and chlorophyll in selenium-rich green teas were higher than those in ordinary green teas, except for chlorophyll b, indicating that the application of selenium fertilizer may affect the content of tea pigments, which was consistent with our previous study[10]. Additionally, the supplementation of selenium in growth medium or nutrient solution could elevate the net photosynthetic rate, stomatal conductance, and transpiration rate of various plants[29], which might be related to the improvement of chlorophyll content by selenium fertilizer, ultimately contributing to increased tea yield.

    As shown in Fig. 1d, the selenium content of Se-BF and Se-YL was significantly higher than that of BF and YL. The selenium content in selenium-rich tea is stipulated to be between 0.25−4.00 mg/kg (NY/T 600-2002). The selenium content in BF ranged from 0.05 to 0.16 mg/kg, while the selenium content in Se-BF ranged from 1.28 to 2.17 mg/kg, which met the standard of selenium-rich tea. Meanwhile, although no exogenous selenium fertilizer was applied to YL, its selenium content ranged from 0.33 to 0.43 mg/kg, which met the standard of selenium-rich tea. After the application of exogenous selenium, the selenium content in Se-YL reached 0.37−2.23 mg/kg. The phenomenon was that attributed to its planting area (Enshi, Hubei, China), which is currently recognized as a selenium-rich area[30]. It was worth noting that there were significant differences in selenium content between different batches of Se-BF and Se-YL. Many influencing factors can affect the selenium content in different plants due to various absorption rates of plants, which might be related to plant species, soil, pHs, microbial activity, precipitation, and other biogeochemical parameters[6].

    The dissolution pattern of tea polyphenols in Se-BF and Se-YL is shown in Fig. 2a and b, respectively. When the brewing temperature reached 100 °C, the dissolved amount of tea polyphenols was significantly higher than at other temperatures, regardless of brewing duration. Specifically, under the conditions of 100 °C and 40 min, the dissolved amount of tea polyphenols in Se-BF was 172.46 mg/100 mL, while in Se-YL it was 160.46 mg/100 mL, indicating that boiling water was more conducive to the dissolution of tea polyphenols. The dissolution pattern of tea polyphenols conformed to the general leaching rule of solute, and the dissolved amount was positively correlated with both brewing duration and temperature. Both Se-BF and Se-YL exhibited high leaching rates of tea polyphenols within the first 7 min of brewing. With the extension of brewing duration, especially after 30 min, the dissolution rate gradually slowed down. Overall, the dissolved amount of tea polyphenols increased with the rise in brewing temperature. Nevertheless, a high-temperature environment was prone to the oxidation and decomposition of tea polyphenols[31], hence, caution should be exercised when brewing tea at high temperatures for extended periods.

    Figure 2.  Effects of different brewing temperatures and duration on (a), (b) dissolution patterns of tea polyphenols, (c), (d) flavonoids, (e), (f) soluble sugar, (g), (h) free amino acids, (i), (j) caffeine, (k), (l) theaflavins, (m), (n) thearubigins, and (o), (p) theabrownins in Se-BF and Se-YL.

    As shown in Supplementary Table S6, the content of tea polyphenols measured under the conditions of 100 °C and 40 min is taken as 100% of the dissolution rate to calculate the tea polyphenols dissolution rates of Se-BF and Se-YL under different brewing temperatures and durations. Overall, the tea polyphenol dissolution rate of Se-YL was higher than that of Se-BF. When the brewing duration was 1 min, the dissolution rates of Se-YL were 9.86%, 12.91%, 17.44%, and 20% respectively, which were 1.08, 1.1, 1.09, and 1.25 times those of Se-BF. This discrepancy might be attributed to the different processing technologies of Se-BF and Se-YL. The steaming process of Se-YL may more efficiently disrupt the internal cell structure, making tea polyphenols easier to dissolve during steeping. Supplementary Table S7 presents the half dissolution time (t0.5) and full dissolution time (t1.0) of tea polyphenols under different brewing temperatures. It took 27.32, 15.20, 10.70, and 6.41 min for Se-BF to extract 50% tea polyphenols at 65, 75, 85, and 100 °C, respectively, while it took 16.93, 10.41, 6.68, and 5.14 min for Se-YL. Since tea polyphenols are the main sources of bitterness and astringency in tea infusion, the taste of tea infusion can be improved by appropriately shortening the brewing duration. Meanwhile, elevating the brewing temperature or extending the brewing duration to dissolve more tea polyphenols could enhance the health benefits of tea drinking. A quadratic polynomial stepwise regression analysis was performed on the brewing temperature (X1) and brewing duration (X2) with the concentration of tea polyphenols (Y) in Se-BF tea infusion, resulting in the regression equation Y = 0.0053X1 + 0.0139X2 + 0.0141 (R2 = 0.996). The regression equation for the brewing temperature (X1) and brewing duration (X2) with the dissolved concentration of tea polyphenols (Y) in Se-YL tea infusion is Y = 0.0063X1 + 0.0175X2 + 0.0058 (R2 = 0.995).

    The dissolution patterns of flavonoids in Se-BF and Se-YL under different brewing temperatures and durations are illustrated in Fig. 2c and d, respectively. Similar to tea polyphenols, as the brewing temperature was elevated and the brewing duration was extended, the leaching amount of flavonoids continued to rise. However, when the brewing duration exceeded 10 min, the leaching rate of flavonoids begins to decline. The dissolved amounts of Se-BF and Se-YL at 100 °C for 40 min were 0.24 and 0.39 mg/100 mL, respectively. Furthermore, the difference between the dissolved amount at 100 and 85 °C in Se-BF was greater than that in Se-YL, indicating that flavonoid compounds in Se-BF require higher brewing temperatures to be fully released.

    Supplementary Table S8 shows the flavonoid dissolution rate of Se-BF and Se-YL under different brewing temperatures and durations. When the teas were brewed for 40 min at 65, 75, and 85 °C, the dissolution rates were 64.17%, 73.33%, and 84.86% of the tea infusion brewed at 100 °C, respectively, and 69.25%, 78.35%, and 92.00% of the tea infusion brewed at 100 °C, respectively. The flavonoid dissolution rate increased by 30.00%, 35.00%, 43.89%, 56.11% and 19.38%, 29.65%, 38.42%, 44.82% in the first 0−7 min at 65−100 °C, and by 34.17%, 38.33%, 40.97%, 43.89%, and 49.87%, 48.70%, 53.58%, 55.18% in the 7−40 min. This phenomenon indicated that the dissolution rate of flavonoids in Se-YL in the first 7 min was lower than that in Se-BF, which could be reversed from 7 to 40 min. The t0.5 and t1.0 of flavonoids in Se-BF and Se-YL at different brewing temperatures are shown in Supplementary Table S9. Theoretically, the brewing time required for Se-BF to dissolve 50% of flavonoids at 65, 75, 85, and 100 °C was 20.72, 10.58, 5.89, and 2.80 min, respectively, while it took 22.29, 12.96, 8.35, and 5.6 min to dissolve flavonoids in Se-YL, respectively. The quadratic polynomial stepwise regression analysis was performed on the brewing temperature (X1) and duration (X2) with the flavonoid concentration (Y) in the Se-BF tea infusion, resulting in the regression equation Y = 0.0036X1 + 0.067X2 + 0.153 (R2 = 0.9225). Similarly, the regression equation for the brewing temperature (X1) and duration (X2) with the flavonoid dissolution concentration (Y) in the Se-YL tea infusion is Y = 0.0056X1 + 0.0062X2 − 0.004 (R2 = 0.9069).

    The soluble total sugar is the source of sweetness in the tea infusion, and the massive dissolution of soluble total sugar facilitates neutralizing of the bitterness brought by tea polyphenols. The dissolution patterns of soluble total sugar of Se-BF and Se-YL under different brewing conditions are shown in Fig. 2e and f, respectively. With the increase in the brewing temperature and duration, the leaching amount of soluble total sugar continued to rise. The dissolution quantities of Se-BF and Se-YL under the conditions of 100 °C and 40 min were 97.5 and 91.77 mg/100 mL, respectively. Meanwhile, it was observed that the dissolution pattern of Se-BF and Se-YL were similar at 85 and 100 °C, and the dissolution pattern at 65 and 75 °C were similar, indicating that soluble sugar could be dissolved in large quantities under higher brewing temperatures. Therefore, 85 °C can be selected to extract more soluble sugar when drinking tea.

    Supplementary Table S10 shows the dissolution rates of soluble sugar for Se-BF and Se-YL. The dissolution rate of Se-BF and Se-YL reached the highest within 1−3 min, followed by 3−5 min and 5−7 min. After 7 min, the dissolution rate of Se-BF and Se-YL gradually decreased. Similar to tea polyphenols, the soluble sugar of Se-YL was easier to dissolve out, which might be attributed to the different processing techniques of Se-BF and Se-YL. The t0.5 and t1.0 of soluble total sugar in Se-BF and Se-YL at different brewing temperatures are shown in Supplementary Table S11. The brewing duration required for Se-BF to extract 50% of soluble sugar at 65, 75, 85, and 100 °C was 14.27, 9.56, 5.39, and 4.45 min, respectively, while the brewing duration required for Se-YL was 14.57, 9.19, 5.12, and 4.37 min, respectively. Except at low brewing temperatures, soluble total sugar in Se-YL was easier to dissolve out. The dissolution amount of soluble sugar and polyphenols should be comprehensively compared to keep them in a balanced state to enhance the sweetness of the tea infusion. In green teas, the content of polyphenols was generally three times that of soluble sugar, and the dissolution rates of both followed the principle of being fast first and then slow. With the extension of brewing duration, the dissolved amount of polyphenols exceeded soluble sugar, thus increasing the bitterness of tea infusions. The quadratic polynomial stepwise regression analysis was performed on the brewing temperature (X1) and duration (X2) and the soluble sugar concentration (Y) in Se-BF tea infusion, and the regression equation was obtained as Y = 0.3678X1 + 0.0567X2 − 0.089 (R2 = 0.9501). The regression equation for the brewing temperature (X1) and duration (X2) and the soluble sugar dissolved concentration (Y) in Se-YL tea infusion is Y = 0.4556X1 + 0.45X2 + 0.088 (R2 = 0.9017).

    Amino acids primarily contribute to the freshness of tea infusion, enhancing its inherent flavor. The dissolution patterns of free amino acids of Se-BF and Se-YL under different brewing conditions are illustrated in Fig. 2g and h, respectively. Similar to other main components, as the brewing temperature and duration increased, the leaching amount of free amino acids continued to rise. With the progress of the brewing process, free amino acids continuously dissolved from tea leaves into tea infusion, but their leaching rate gradually decreased with the extension of brewing duration, especially after 10 min. Specifically, brewed at 100 °C for 40 min, the dissolved amounts of free amino acids in Se-BF and Se-YL are 105.23 and 95.88 mg/100 mL, respectively.

    Supplementary Table S12 presents the dissolution rates of free amino acids in Se-BF and Se-YL. The highest dissolution rates for both Se-BF and Se-YL occurred within the first minute, followed by the 5−7 min interval. The dissolution rates of free amino acids in Se-BF and Se-YL at 65−100 °C increased by 40.44%, 46.15%, 50.16%, 54.05%, and 42.99%, 48.89%, 52.49%, 55.97%, within 0−7 min, respectively, and by 26.29%, 32.92%, 36.42%, 45.95%, and 35.11%, 34.78%, 34.99%, 44.03% within 7−40 min, respectively. After 7 min, the leaching of both Se-BF and Se-YL was retarded, with Se-YL exhibiting a higher likelihood of extracting free amino acids, which was also influenced by its processing technology. As listed in Supplementary Table S13, the t0.5 of the free amino acids at 65, 75, 85, and 100 °C was 13.07, 8.65, 6.33, and 4.24 min for Se-BF, respectively, while the t0.5 was 10.93, 8.36, 5.87, and 4.30 min for Se-YL, further confirming that Se-YL was more likely to leach free amino acids. Through a quadratic polynomial stepwise regression analysis on the brewing temperature (X1) and duration (X2) with the concentration of free amino acids (Y) in the Se-BF tea infusion, the regression equation Y = 0.6766X1 + 0.0225X2 − 0.0139 was obtained (R2 = 0.9388). The regression equation for the brewing temperature (X1) and duration (X2) with the concentration of free amino acids (Y) in the Se-YL tea infusion was Y = 0.0178X1 + 0.3492X2 + 0.7099 (R2 = 0.9276).

    Caffeine, the primary source of the bitter taste in tea infusions, serves the functions of refreshing the mind and enhancing metabolism. However, excessive consumption of caffeine often leads to addiction and can even damage the central nervous system in severe cases[32]. A continuous daily intake of 500–600 mg of caffeine (7 to 9 cups of tea) may increase potential health risks. Higher levels of caffeine intake can cause a variety of adverse effects on the health of sensitive people, including heart palpitations, gastrointestinal disorders, anxiety, hypertension, and insomnia[33]. Figure 2i and j illustrate the dissolution patterns of caffeine in Se-BF and Se-YL. The dissolution amount of caffeine was continuously elevated with the brewing temperature and duration increasing, but the dissolution rate gradually decreased with the extension of the brewing duration. When the brewing temperature was 100 °C and the brewing duration was 40 min, the dissolution amount of caffeine in Se-BF tea infusion was 75.13 mg/100 mL, while the dissolution amount of Se-YL was 60.78 mg/100 mL. At 65 °C, the dissolution amounts of caffeine in Se-BF and Se-YL were 45.71 and 39.65 mg/100 mL, respectively, indicating that the optimal brewing temperature for caffeine was above 85 °C.

    As shown in Supplementary Table S14, when brewed for 40 min at 65, 75, and 85 °C, the dissolution rates of caffeine in Se-BF and Se-YL were 60.93%, 78.94%, 84.90% and 58.82%, 70.44%, 86.84% of that in tea infusion brewed at 100 °C, respectively, indicating that higher brewing temperatures facilitated the dissolution of caffeine. The dissolution rate of caffeine in Se-BF and Se-YL was the highest during the first 1−3 min, followed by the 3−5 min interval. The dissolution rate of caffeine in Se-BF and Se-YL under 65−100 °C was increased by 36.23%, 41.21%, 47.93%, 54.39%, and 33.18%, 42.80%, 45.73%, 51.43% within 0−5 min, respectively, and by 23.64%, 37.73%, 41.11%, 48.57%, and 18.31%, 27.64%, 36.97%, 38.57%, 45.61% within 5−40 min, respectively. Overall, the dissolution rate of caffeine in Se-BF was higher than that in Se-YL. According to Supplementary Table S15, the t0.5 for Se-BF to extract caffeine at 65, 75, 85, and 100 °C were 16.76, 9.91, 6.65, and 4.47 min, respectively, while the t0.5 for Se-YL were 19.98, 10.82, 6.58, and 4.51 min, respectively. This phenomenon showed that caffeine was more easily extracted from Se-BF than from Se-YL. Meanwhile, for consumers needing to stay awake, brewing tea at high temperatures for a longer duration is recommended. Otherwise, it should control the brewing duration within t0.5 or choose a lower brewing temperature, such as 75 °C. A quadratic polynomial stepwise regression analysis was conducted on the brewing temperature (X1), duration (X2), and the concentration of caffeine (Y) in Se-BF tea infusion. The regression equation obtained is Y = 0.00037X1 + 0.0256X2 + 0.0089 (R2 = 0.9562). For the brewing temperature (X1), duration (X2), and the caffeine concentration (Y) in Se-YL tea infusion, the regression equation is Y = 0.0056X1 + 0.042X2 + 0.0079 (R2 = 0.9109).

    Theaflavins not only contribute to the color of tea infusion but also enhance its freshness when combined with caffeine. Figure 2k and l illustrate the dissolution patterns of theaflavins in Se-BF and Se-YL, which align with the general dissolution behavior of solutes. Notably, the dissolution of theaflavins in Se-YL was more temperature-sensitive than in Se-BF. Specifically, the theaflavins content in Se-BF tea infusion was 0.22 mg/100 mL at 100 °C and remained at 0.21 mg/100 mL after 40 min.

    Supplementary Table S16 shows the dissolution rates of theaflavins in Se-BF and Se-YL. The dissolution rates of theaflavins in Se-BF at 65, 75, and 85 °C for 40 min were 68.18%, 81.82%, and 90.91%, respectively, while the dissolution rates of theaflavins in Se-YL were 66.67%, 80.95%, and 95.24%, respectively. Comparably, the dissolution rate of theaflavins in Se-YL was faster than Se-BF. Furthermore, Supplementary Table S17 shows the t0.5 of Se-BF at 65, 75, 85, and 100 °C were 17.43, 11.42, 6.78, and 4.53 min, respectively, while the t0.5 of Se-YL were 16.84, 10.90, 6.27, and 4.23 min, respectively, which verified that the dissolution rate of theaflavins in Se-YL was faster than in Se-BF. A stepwise quadratic polynomial regression analysis was conducted on the brewing temperature (X1) and duration (X2) with the concentration of theaflavins (Y) in Se-BF tea infusion yields the regression equation Y = 0.0321X1 + 0.0121X2 − 0.0012 (R2 = 0.9131). The regression equation for the brewing temperature (X1) and duration (X2) with the concentration of theaflavins (Y) extracted from Se-YL tea infusion was Y = 0.0156X1 + 0.0192X2 − 0.0079 (R2 = 0.9239).

    Figure 2m and n illustrate the dissolution patterns of thearubigins in Se-BF and Se-YL teas under various brewing conditions, adhering to the general extraction principles of solutes. The dissolution effect of Se-YL was relatively close at 85 and 100 °C, while this phenomenon was not observed in Se-BF. Overall, the dissolution of thearubigins in teas was influenced by both brewing duration and temperature, with the dissolution rate of thearubigins decreasing gradually after the brewing duration exceeded 5 min. Specifically, the dissolution rate of thearubigins was rapid within the first 7 min and then gradually decreased over time. Under the brewing condition of 100 °C for 40 min, the thearubigins content in Se-BF was 4.86 mg/100 mL, while that of Se-YL was 4.12 mg/100 mL.

    As shown in Supplementary Table S18, the dissolution rates of thearubigins in Se-BF and Se-YL at 65, 75, and 85 °C for 40 min were 72.39%, 81.28%, 87.01%, and 71.23%, 78.44%, 92.77%, respectively. The dissolution rates of thearubigins were increased by 29.42%, 34.56%, 40.19%, 48.18%, and 27.46%, 35.94%, 42.59%, 45.23% within 0−7 min, and by 42.97%, 46.72%, 46.82%, 51.82%, and 44.77%, 42.50%, 50.18%, 54.77% within 7−40 min ranging from 65 to 100 °C. This phenomenon indicated that the dissolution rate of thearubigins in the Se-YL tea was greater than that in the Se-BF tea during the brewing process. The t0.5 of Se-BF at 65, 75, 85, and 100 °C are 18.38, 12.45, 9.28, and 6.61 min, respectively, while the t0.5 of Se-YL are 16.82, 11.44, 7.79, and 6.40 min, respectively (Supplementary Table S19). This phenomenon indicated that the thearubigins in Se-YL were easier to extract than those in Se-BF. A stepwise regression analysis of the quadratic polynomial was conducted on the brewing temperature (X1), duration (X2), and the concentration of thearubigins (Y) in Se-BF, resulting in the regression equation Y = 0.0074X1 + 0.0025X2 + 0.0022 (R2 = 0.9021). Similarly, for Se-YL, the regression equation was Y = 0.0096X1 + 0.0083X2 + 0.0023 (R2 = 0.9369).

    Figure 2o and p illustrate the dissolution pattern of theabrownins in Se-BF and Se-YL, respectively, revealing significant differences in the dissolution pattern of theabrownins at various brewing temperatures over 1 min, which distinctly contrasts with the dissolution behavior of tea polyphenols, soluble total sugar, flavonoids, and thearubigins. Under brewing conditions of 100 °C for 40 min, the contents of theabrownins in Se-BF and Se-YL were respectively 8.20 and 8.01 mg/100 mL.

    As shown in Supplementary Table S20, the dissolution rates of theabrownins for Se-BF and Se-YL at 65, 75, and 85 °C for 40 min were 68.59%, 78.66%, 86.16%, and 63.92%, 80.55%, 90.72% respectively. Across the temperature range of 65 to 100 °C, the dissolution rates of theabrownins increased by 39.55%, 56.44%, 70.37%, 81.36% for Se-BF and 28.14%, 44.06%, 58.33%, 70.82% for Se-YL within the first 7 min. Subsequently, from 7 to 40 min, the dissolution rates increased by 29.04%, 22.22%, 15.79%, 18.64% for Se-BF and 35.78%, 36.49%, 32.39%, 29.18% for Se-YL. The t0.5 of Se-BF at 65, 75, 85, and 100 °C were 14.27, 7.10, 3.66, and 1.98 min, respectively, while the t0.5 of Se-YL were 17.88, 9.13, 5.35, and 2.84 min, respectively (Supplementary Table S21). The theabrownins in Se-BF were more easily extracted than those in Se-YL. A quadratic polynomial stepwise regression analysis was performed on the brewing temperature (X1), duration (X2), and the concentration of theabrownins (Y) in Se-BF, resulting in the regression equation Y = 0.003X1 + 0.0025X2 + 0.0039 (R2 = 0.9131). Similarly, for Se-YL, the regression equation was Y = 0.001X1 + 0.0061X2 + 0.0023 (R2 = 0.9245).

    Different brewing conditions affected the dissolution rate of various chemical components in teas, thereby influencing the sensory characteristics of the tea infusion. As depicted in Fig. 3, the sensory evaluation of tea infusions of Se-BF and Se-YL, conducted under varying brewing temperatures and durations, revealed that extended brewing durations intensified the bitterness of the tea infusions. Consequently, the evaluation focused on a brewing duration range of 0 to 15 min. Within the same brewing temperature, the overall sensory evaluation score of the tea infusions increased with the prolongation of brewing duration of up to 5 min, which could be attributed to the harmonious balance between tea polyphenols, free amino acids, soluble sugars, caffeine, and other components. While tea polyphenols and caffeine contribute to the bitter taste of the tea infusion, soluble sugars, and free amino acids enhance its sweetness and umami[8,20]. Nevertheless, beyond the 5-min brewing mark, the continuous dissolution of tea polyphenols surpassed that of soluble sugars, leading to an escalation in the bitter taste of the tea infusions. Meanwhile, the bitter and astringent taste of the tea infusion intensifies, while the fresh and sweet taste diminishes with longer brewing duration, which was consistent with previous studies[20,34,35]. Although raising the brewing temperature might elevate the leaching rate of tea's active ingredients, complex chemical alterations could simultaneously occur at high temperatures. Additionally, the release of tea pigments, notably theabrownins, facilitated a gradual darkening of the tea infusion's appearance and caused the aroma to volatilize and dissipate, ultimately resulting in a decrease in the overall score over time. Comprehensively, the highest overall score achieved was 93.88 for Se-YL, compared to 89.55 for Se-BF, indicating a superior comprehensive quality of Se-YL.

    Figure 3.  Radar map of sensory evaluation scores of (a) Se-BF, and (b) Se-YL at different brewing temperatures and duration.

    As depicted in Fig. 4, an investigation was conducted to assess the impact of brewing times (with the initial three brewings lasting 5 min each, followed by a fourth brewing lasting 1 h) on the dissolution of polyphenols, flavonoids, free amino acids, soluble sugars, and caffeine in roasted green tea (Se-BF) and steamed green tea (Se-YL) at a brewing temperature of 100 °C. The results revealed that the dissolution amounts of all chemical components decreased in both Se-BF and Se-YL as the brewing times increased. The dissolution rates for the first to fourth infusions were separately calculated by the dissolved amounts of the four primary components (Table 1). Notably, the dissolution rates of tea polyphenols, soluble sugars, and caffeine were higher in the first infusion of Se-BF compared to Se-YL. Conversely, the dissolution rates of flavonoids and free amino acids were greater in the first infusion of Se-YL than in Se-BF. Traditionally, the optimal brewing times were varied by different tea varieties. When brewing less than twice, the tea infusion tended to be flavorful and bitter, but the flavor of the tea infusion became milder after the second brewing[36]. For both Se-YL and Se-BF, the third infusion exhibited the lowest dissolution rates for the main components, suggesting that for optimal taste and nutritional qualities, the first and second infusions are preferable when brewing tea.

    Figure 4.  Influence of different brewing times on the dissolved amount of (a) tea polyphenols, (b) flavonoids, (c) free amino acids, (d) soluble sugars, and (e) caffeine.
    Table 1.  Influence of brewing time on dissolution rates (%) of main components in Se-BF and Se-YL.
    Sample Tea active ingredients Brewing times
    First infusion Second infusion Third infusion Fourth infusion
    Se-BF Polyphenols 51.60 22.82 11.38 14.20
    Flavonoids 49.82 25.09 7.17 17.92
    Free amino acids 63.01 21.36 1.48 14.15
    Soluble sugar 49.16 27.20 6.01 17.63
    Caffeine 59.61 20.06 8.34 11.99
    Se-YL Polyphenols 49.99 22.80 11.66 15.56
    Flavonoids 56.99 25.09 7.17 10.75
    Free amino acids 67.60 16.33 0.70 15.37
    Soluble sugar 46.58 29.08 5.65 18.68
    Caffeine 54.27 22.76 9.84 13.13
     | Show Table
    DownLoad: CSV

    Figure 5a and b illustrate the antioxidant activities of Se-BF and Se-YL across different brewing times. Notably, the antioxidant activity of the tea infusions peaked during the first brewing and gradually decreased as the brewing time increased. Specifically, the DPPH radical scavenging rate of Se-BF in the first brewing reached 88.68%, which was 1.17, 2.49, and 1.77 times higher than that of the second, third, and fourth brewing, respectively (Fig. 5a). Similarly, the DPPH radical scavenging rate of Se-YL in the first brewing reached 77.69%, surpassing that of the second, third, and fourth brewing by 1.15, 2.44, and 1.83 times, respectively. In terms of the ABTS radical scavenging rate (Fig. 5b), Se-BF in the first brewing achieved 66.59%, which was 1.23, 2.39, and 1.89 times higher than that of the subsequent brewing. Comparable results were observed for Se-YL, with the ABTS radical scavenging rate in the first brewing reaching 67.07%, exceeding that of the second, third, and fourth brewing by 1.27, 2.9, and 1.82 times, respectively. It was noteworthy that the antioxidant capacity of the fourth brewing was higher than the third brewing due to its extended brewing duration of 1 h. Overall, the antioxidant abilities of both tea infusions were enhanced with the increase of dissolved tea active ingredients, particularly tea polyphenols, and the antioxidant capacity of Se-BF tea infusion was consistently higher than that of Se-YL.

    Figure 5.  Effects of different brewing times on (a) DPPH free radical scavenging rate, (b) ABTS free radical scavenging rate, (c) α-glycosidase inhibition rate, and (d) α-amylase inhibition rate of Se-BF and Se-YL.

    The impact of varying brewing times on the in vitro hypoglycemic activity of Se-BF and Se-YL tea infusions was investigated. Similar to the antioxidant activity, it was evident that the hypoglycemic activity of the tea infusions gradually decreased as the brewing time increased. As illustrated in Fig. 5c, the α-glucosidase inhibition rates of Se-BF and Se-YL in the first brewing were 45.71% and 52.1%, respectively, surpassing the inhibition rates of the subsequent brewing by 1.2 to 2.0 times. Furthermore, the α-amylase inhibition rates of Se-BF and Se-YL in the first brewing were 34.7% and 38.89%, respectively, exceeding those of the subsequent brewing by 1.43 to 5.53 times (Fig. 5d). Although the two types of tea infusions did not exhibit high in vitro hypoglycemic activity, which could be attributed to the low concentration of the tea infusion, it was generally observed that the in vitro hypoglycemic activity of Se-YL tea infusion was superior to that of Se-BF.

    This study systematically investigated the chemical profiles, dissolution patterns of biochemical components, and in vitro activities of tea infusions with four types of green tea: Selenium-enriched Xiazhou Bifeng (Se-BF), normal Xiazhou Bifeng (BF), selenium-enriched Enshi Yulu (Se-YL), and normal Enshi Yulu (YL). The findings revealed that green tea processing techniques and the application of selenium fertilizer showed significant impacts on the quality components of green teas. By analyzing the dissolution patterns of selenium-enriched green teas under varying brewing temperatures and durations, it was observed that the quantities of dissolved components increased with both the duration and temperature of brewing. Notably, the majority of components in Se-YL were more readily extracted compared to those in Se-BF. Additionally, the present study investigated the impact of brewing frequency on the dissolution of tea components based on a typical daily tea consumption model. The results revealed that the first tea infusion exhibited the highest dissolution amount, accompanied by optimal antioxidant and hypoglycemic activities. Based on sensory evaluations of the tea infusions, the optimal brewing conditions were determined to be 100 °C for 5 min. However, as the brewing time increased, the content of dissolved components in the tea infusions decreased, resulting in a corresponding decline in antioxidant and hypoglycemic activities. Overall, Se-YL demonstrated superior sensory and nutritional qualities compared to Se-BF. Future research endeavors can delve deeper into the comparison between non-enriched and selenium-enriched teas, and the effects of water quality on the dissolution of key tea active components (including volatile components). Furthermore, the molecular mechanisms underlying alterations in tea infusion flavor and in vivo physiological activities should be elucidated in more delicate models.

  • The authors confirm contribution to the paper as follows: conceptualization, writing - draft manuscript preparation: Wei Y; investigation and methodology: Zhang D; writing - manuscript revision: Wei Y, Liang Y, Shi J, Wei X, Wang Y; investigation: Wei K, Peng L; data analysis: Gu H; methodology: Ma P; software and validation: Wang Q, Zhu Z; supervision, funding, administration: Wei X, Wang Y. All authors reviewed the results and approved the final version of the manuscript.

  • The datasets generated during and/or analyzed during the current study are available from the corresponding author on reasonable request.

  • The authors are grateful for financially sponsorship by Shanghai Agricultural Science and Technology Innovation Project (2023-02-08-00-12-F04598), National Key R&D Program of China (2022YFD2101104), Shaanxi Province key core technology project (2024NC-GJHX-15), National Natural Science Foundation of China (32172223), New Young Teachers Program of Shanghai Jiao Tong University (24X010500154) and China Postdoctoral Science Foundation (BX20220201, 2021M702140).

  • The authors declare that they have no conflict of interest.

  • [1]

    Lal RK, Chanotiya CS, Kumar A. 2023. The prospects and potential of the horticultural and pharmacological medicinal herb senna (Cassia angustifolia Vahl.): a review. Technology in Horticulture 3:20

    doi: 10.48130/TIH-2023-0020

    CrossRef   Google Scholar

    [2]

    Lal RK, Gupta P, Chanotiya CS, Mishra A, Kumar A. 2023. The nature and extent of heterosis, combining ability under the influence of character associations, and path analysis in Basil (Ocimum basilicum L.). Industrial Crops and Products 195:116421

    doi: 10.1016/j.indcrop.2023.116421

    CrossRef   Google Scholar

    [3]

    Patel SP, Malve SH, Chavda MH, Vala YB. 2021. Effect of Panchagavya and Jeevamrut on growth, yield attributes, and yield of summer pearl millet. The Pharma Innovation Journal SP-10:105−09

    Google Scholar

    [4]

    Kumar A, Gupta AK, Siddiqui S, Siddiqui MH, Jnanesha AC, et al. 2022. An assessment, prospects, and obstacles of industrially important medicinal crop Indian Senna (Cassia angustifolia Vahl.): a review. Industrial Crops and Products 187:115472

    doi: 10.1016/j.indcrop.2022.115472

    CrossRef   Google Scholar

    [5]

    Shubha S, Devakumar N, Rao GGE, Gowda SB. 2014. Effect of seed treatment, panchagavya application and organic farming systems on soil microbial population, growth and yield of maize, eds Rahmann G, Aksoy U. Proceedings of the 4th ISOFAR Scientific Conference. 'Building Organic Bridges', at the Organic World Congress 2014, Istanbul, Turkey. pp. 631−34.

    [6]

    Kumar A, Jnanesha AC. 2017. Enhancing the income of the farmer by cultivating senna in low rainfall area. Popular Kheti 5:14−17

    Google Scholar

    [7]

    Kumar A, Jnanesha AC, Bharath Kumar TP. 2018. Effect of different proportions of fly ash and vermicompost on growth and yield of Senna in Semi-arid regions of India. Journal of Pharmacology and Phytochemistry 7:69−72

    Google Scholar

    [8]

    Kumar A, Jnanesha AC, Verma RK, Kumar D, Lal RK. 2022. Phytoremediation, eco-restoration, and adaptive response of lemongrass (C. flexuosus Wats) grown on fly ash and vermicompost improved quality essential oil yield. Biochemical Systematics and Ecology 104:104457

    doi: 10.1016/j.bse.2022.104457

    CrossRef   Google Scholar

    [9]

    TNSMPB. 2006. Tamil Nadu State Medicinal Plants Board, Senna. Chennai, India: Tamil Nadu State Medicinal Plants Board, Government of India.

    [10]

    Guhra T, Stolze K, Totsche KU. 2022. Pathways of biogenically excreted organic matter into soil aggregates. Soil Biology and Biochemistry. 164:108483

    doi: 10.1016/j.soilbio.2021.108483

    CrossRef   Google Scholar

    [11]

    Gore NS, Sreenivasa MN. 2011. Influence of liquid organic manures on growth, nutrient content, and yield of tomato (Lycopersicon esculentum Mill.) in the sterilized soil. Karnataka Journal of Agriculture Science 24:153−57

    Google Scholar

    [12]

    Malligawad LH, Parameshwarappa KG. 2006. Effect of organics on the productivity of Spanish bunch groundnut under rainfed farming situations. In Symposia of 18th World Congress of Soil Science (Frontiers of Soil Science-Technology and the Information Age), 2006. Philadelphia, Pennsylvania, USA. 607 pp.

    [13]

    Duraivadivel P, Bhani K, Santosh S, Hariprasad P. 2022. Untangling microbial diversity and functional properties of Jeevamrutha. Journal of Cleaner Production 369:133218

    doi: 10.1016/j.jclepro.2022.133218

    CrossRef   Google Scholar

    [14]

    Palekar S. 2006. Shoonya bandovalada naisargika krushi. Swamy Anand, Agri Prakashana, Bangalore, India. pp. 1−270.

    [15]

    Rama Reddy NR, Mehta RH, Soni PH, Makasana J, Gajbhiye NA, et al. 2015. Next-generation sequencing and transcriptome analysis predict the biosynthetic pathway of sennosides from Senna (Cassia angustifolia Vahl.), a non-model plant with potent laxative properties. PLoS ONE 10:e0129422

    doi: 10.1371/journal.pone.0129422

    CrossRef   Google Scholar

    [16]

    Waksman SA. 1917. Is there any fungus flora in the soil? Soil Science 3:565−90

    doi: 10.1097/00010694-191706000-00009

    CrossRef   Google Scholar

    [17]

    Aneja KR. 2003. Cultivation techniques for isolation and enumeration of microorganisms. In Experiments in microbiology, plant pathology, and biotechnology, IV Edition. New Age International (P) Ltd., Delhi. pp. 157–88.

    [18]

    Santosha Gowda GB, Sudhir Kamath KV, Lakshmana. 2021. Shelflife study of jeevamrutha prepared from cow dung and cow urine of different desi breeds. The Pharma Innovation Journal SP-10:236−39

    Google Scholar

    [19]

    Casida LE Jr, Klein DA, Santoro T. 1964. Soil dehydrogenase activity. Soil Science 98:371−76

    doi: 10.1097/00010694-196412000-00004

    CrossRef   Google Scholar

    [20]

    Tabatabai MA, Bremner JM. 1972. Assay of urease activity in soils. Soil Biology and Biochemistry 4:479−87

    doi: 10.1016/0038-0717(72)90064-8

    CrossRef   Google Scholar

    [21]

    Hayano K. 1973. A method for the determination of β-glucosidase activity in soil. Soil Science and Plant Nutrition 19:103−08

    doi: 10.1080/00380768.1973.10432524

    CrossRef   Google Scholar

    [22]

    Panse VG, Sukhatme PV. 1956. Statistical methods for agricultural workers. Agronomy Journal 48:323

    doi: 10.2134/agronj1956.00021962004800070014x

    CrossRef   Google Scholar

    [23]

    Somasundaram E, Sankaran N, Meena S, Thiyagarajan TM, Chandragiri KK, et al. 2007. Response of green gram to varied concentrations of Panchakavya (organic nutrition) foliar application. Madras Agriculture Journal 90:169−72

    Google Scholar

    [24]

    Chongre S, Mondal R, Biswas S, Munshi A, Mondal R, et al. 2019. Effect of liquid manure on growth and yield of summer green gram (Vigna radiata L. Wilczek). Current Journal of Applied Science and Technology 38:1−7

    doi: 10.9734/CJAST/2019/v38i630460

    CrossRef   Google Scholar

    [25]

    Manjunatha GS, Upperi SN, Pujari BT, Yeledahalli NA, Kuligod VB. 2009. Effect of farm yard manure treated with jeevamrutha on yield attributes, yield and economics of sunflower (Helianthus annuus L.). Karnataka Journal of Agriculture Science 22:198−99

    Google Scholar

    [26]

    Siddappa MK, Devakumar N. 2016. Organically grown field bean (Lablab purpureus Var. lignosus) using jeevamrutha and farm yard manure. National Conference on Sustain Self-Sufficient Production of Pulses through an Integrated Approach. Bengaluru, India. pp. 105.

    [27]

    Brajeshwar, Joshi AK, Dey S. 2007. Effect of Kunapajala and Fertilizers on Senna (Cassia angustifolia Vahl.). Indian Forester 133:1235−40

    doi: 10.36808/if/2007/v133i9/1199

    CrossRef   Google Scholar

    [28]

    Aruw K, Bapi D, Reddy GS. 2011. Effect of organic manures, biofertilizers, and inorganic fertilizers on growth and yield of Senna (Cassia angustifolia Vahl.). The Asian Journal of Horticulture 7:144−47

    Google Scholar

    [29]

    Bhattacharjee U, Uppaluri RVS. 2023. Production and optimization of Jeevamrutha bio-fertilizer formulations for soil fertility and its role in waste minimization. Sustainable Chemistry for Climate Action 2:1000025

    doi: 10.1016/j.scca.2023.100025

    CrossRef   Google Scholar

    [30]

    Upperi SN, Lokesh BK, Maraddi GN, Agnal MB. 2009. Jeevamrutha, a new organic approach for disease management and crop production in pomegranate and groundnut. Environment and Ecology 27:202−04

    Google Scholar

    [31]

    Ramesh Babu TI. 1996. Nutritional studies in ashwagandha. Thesis. Tamil Nadu Agricultural University, Coimbatore

    [32]

    Hemalatha P, Suresh T, Saraswathi T, Vadivel E. 2008. Studies on nutrient content, herbage yield and alkaloid content of kalmegh under integrated nutrient management system. Advances in Plant Science 21:447−51

    Google Scholar

    [33]

    Kalyanasundaram B, Kumar TS, Kumar S, Swaminathan V. 2008. Effect of N, P, with biofertilizers and vermicompost on growth and physiological characteristics of sweet flag (Acorus calamus L.). Advances in Plant Science 21:277−80

    Google Scholar

    [34]

    Anuja S, Jayasri P. 2011. Effect of organic nutrients on flowering and herbage yield of sweet basil (Ocimum basilicum L.). Advances in Plant Sciences 24:601−03

    Google Scholar

    [35]

    Senthilkumar B, Vasundhara M, Farooqi AA. 2003. Studies on dry matter production, nutrient uptake and quality in Tagetes minuta L. Indian Perfumer 47:375−81

    Google Scholar

    [36]

    Malligawad LH. 2010. Effect of organics on the productivity of groundnut and its residual effects on succeeding safflower under rainfed farming situations. In 19th World Congress of Soil Science, Soil Solutions for a Changing World, 2010, Brisbane, Australia. pp. 128–31

    [37]

    Kumar A, Husain D, Lal RK, Singh S, Singh V, et al. 2023. Genetic diversity and future prospects in Withania somnifera (L.) Dunal: an assessment based on quantitative traits in different accessions of Ashwagandha. The Nucleus 66:151−59

    doi: 10.1007/s13237-023-00423-9

    CrossRef   Google Scholar

    [38]

    Kumar A, Jnanesha AC, Lal RK, Chanotiya CS, Venugopal S, et al. 2023. Precision agriculture innovation focuses on sustainability using GGE biplot and AMMI analysis to evaluate GE interaction for quality essential oil yield in Eucalyptus citriodora Hook. Biochemical Systematics and Ecology 107:104603

    doi: 10.1016/j.bse.2023.104603

    CrossRef   Google Scholar

    [39]

    Bilia AR, Cioni P, Morelli I, Coppi C, Lippi A, et al. 1992. Essential oil of Satureja montana, L. ssp. montana. composition and yields of plants grown under different environmental conditions. Journal of Essential Oil Research 4:563−68

    doi: 10.1080/10412905.1992.9698136

    CrossRef   Google Scholar

    [40]

    Devakumar N, Rao GGE, Shubha S, Imrankhan N, Gowda SB. 2008. Activities of organic farming research centre. Navile, Shivamogga, University of Agricultural Sciences, Bangalore. 12 pp.

    [41]

    Lal RK, Chanotiya CS, Gupta P, Mishra A, Bisht D, Maurya R, Srivastava S, Pant Y. 2021. Multi-years/environmental evaluation for high photosynthetic, bio-efficient, and essential oil genotypes selection in the breeding of vetiver (Chrysopogon zizanioides (L.) Roberty) crop. Journal of Essential Oil Research 33:471−87

    doi: 10.1080/10412905.2021.1917459

    CrossRef   Google Scholar

    [42]

    Lal RK. 2022. The opium poppy (Papaver somniferum L.): historical perspectives recapitulate and induced mutation towards latex less, low alkaloids in capsule husk mutant: a review. Journal of Medicinal Plants Studies 10:19−29

    Google Scholar

    [43]

    Lal RK, Chanotiya CS, Gupta P, Mishra A. 2022. Influences of traits associations for essential oil yield stability in multi-environment trials of vetiver (Chrysopogon zizanioides L. Roberty). Biochemical Systematics and Ecology 103:104448

    doi: 10.1016/j.bse.2022.104448

    CrossRef   Google Scholar

    [44]

    Boraiah B, Devakumar N, Shubha S, Palanna KB. 2017. Effect of Panchagavya, Jeevamrutha and cow urine on beneficial microorganisms and yield of capsicum (Capsicum annuum L. var. grossum). International Journal of Current Microbiology and Applied Sciences 6:3226−34

    doi: 10.20546/ijcmas.2017.609.397

    CrossRef   Google Scholar

    [45]

    Mallikarjun M, Maity SK. 2018. Effect of integrated nutrient management on soil biological properties in Kharif rice. International Journal of Current Microbiology and Applied Sciences 7:1531−37

    doi: 10.20546/ijcmas.2018.711.176

    CrossRef   Google Scholar

    [46]

    Kulkarni SS, Gargelwar AP. 2019. Production and microbial analysis of Jeevamrutham for nitrogen fixers and phosphate solubilizers in the rural area of Maharashtra. IOSR Journal of Agriculture and Veterinary Science 12:85−92

    Google Scholar

    [47]

    Kumar A, Lal RK, Chanotiya CS. 2023. Geraniol-rich aromatic grasses (Cymbopogon spreng) can adapt to the environment by modifying harvest dates over the ecosystems in southern India on the Deccan plateau utilizing participatory management modeling and agronomic practices. Industrial Crops and Products 193:116196

    doi: 10.1016/j.indcrop.2022.116196

    CrossRef   Google Scholar

  • Cite this article

    Jnanesha AC, Venugopal S, Kumar SR, Kumar A, Bisht D, et al. 2024. Optimization of a new organic approach to natural biostimulant (Jeevamrutha) for yield and quality management in Senna (Cassia angustifolia Vahl.): an agriculturally highly export-oriented crop. Technology in Horticulture 4: e009 doi: 10.48130/tihort-0024-0006
    Jnanesha AC, Venugopal S, Kumar SR, Kumar A, Bisht D, et al. 2024. Optimization of a new organic approach to natural biostimulant (Jeevamrutha) for yield and quality management in Senna (Cassia angustifolia Vahl.): an agriculturally highly export-oriented crop. Technology in Horticulture 4: e009 doi: 10.48130/tihort-0024-0006

Figures(4)  /  Tables(7)

Article Metrics

Article views(3287) PDF downloads(811)

ARTICLE   Open Access    

Optimization of a new organic approach to natural biostimulant (Jeevamrutha) for yield and quality management in Senna (Cassia angustifolia Vahl.): an agriculturally highly export-oriented crop

Technology in Horticulture  4 Article number: e009  (2024)  |  Cite this article

Abstract: Senna is a leguminous and industrial crop that produces high-quality glycosides (sennosides) in its leaves and pods, which have substantial therapeutic effects for alleviating constipation worldwide. However, further research on employing Jeevamrutha in Senna is required. As a result, the experiment was carried out at CSIR-CIMAP in Hyderabad for two consecutive years, in the years 2020–2021 and 2021–2022. The main aim is to identify the optimum dose of Jeevamrutha for higher growth, yield, and quality in Senna. The study used a randomized complete block design (RCBD) with seven treatments repeated three times. From the obtained result, it was observed that the application of 150 L of Jeevamrutha per acre observed significantly high leaf yields (1,085.2 kg·ha−1) and pod (318.7 kg·ha−1) equivalent to T2 in comparison to other treatments, i.e., application of 125 L of Jeevamrutha per acre (1,022.5 kg·ha−1, 312.1 kg·ha−1), and was succeeded by T3, i.e., application of 100 L of Jeevamrutha per acre (998.5 kg·ha−1, 288.5 kg·ha−1, respectively). Lower leaf yield (700.2 kg·ha−1) and pod yield (487 kg·ha−1) were observed in the control (T7). Similarly, the application of 150 L of Jeevamrutha per acre recorded significantly higher sennoside content in leaves (2.01%) and pods (3.11%), in comparison to other treatments, and was followed by T2 (1.98%, 3.09%) and T3 (1.89%, 2.97%). A similar trend was noticed in returns, i.e., the application of 150 L of Jeevamrutha per acre recorded significantly higher gross returns (USD$1,495 ha−1) and net returns (USD$1,066.4 ha−1).

    • Cassia angustifolia (Caesalpinaceae), known as Tinnevelly or Indian Senna, is cultivated for its leaves and immature pods. Dianthrone glucosides and sennosides A and B in the leaves and pods have potent laxative properties[1,2]. Sennosides primarily operate on the lower colon and are notably beneficial in cases of chronic constipation[1,3]. The glycosides are absorbed from the intestinal system; they stimulate the peristaltic movements of the colon, causing it to move. Long-term usage of the leaves may induce colon problems and produce grip if not paired with carminatives. The National Medicinal Plant Board (NMPB) of India has identified 32 plants for scaling up, and Senna is one of them. Senna is the second-largest earner of foreign exchange through exports. Its leaves and pods are regarded as reliable sennoside sources in global trade[4]. However, Indian Senna should compete with Alexandrian Senna regarding cost-effectiveness and quality. Alexandrian senna natural collections cannot supply the growing demand for Senna commodities. India has a tremendous opportunity to expand its manufacturing, commerce, and export opportunities. Tinnevelly Senna (C. angustifolia) is grown in India's southern and central parts[5]. Senna herbage production is estimated to be around 7,500 tonnes per year. The pods and leaves of a few other senna species, the most important of which is Alexandrian Senna, have laxative properties similar to those of Cassia angustifolia. Alexandrian Senna grows naturally in North African countries such as Ethiopia and Sudan[1,2].

      The swiftly increasing global population and continuously expanding geographical boundaries of the global agricultural system are extending agricultural activities on marginal soils unsuited for growing. On such terrain, crop options are limited, especially in an arid macroregion. Senna is a tropical medicinal plant that could be a dry-land crop for barren land. Areas with inadequate irrigation facilities (arid or semi-arid) are ideal for Senna cultivation, while regions with heavy rainfall, high humidity, and poor drainage are not perfect[68]. Senna grows as a perennial shrub in dry areas of Africa and neighboring countries. The Senna crop is commercially grown in all sub-tropical regions of India and spread in semi-arid parts of southern India; it is marketed under the brand name 'Tirunelveli Senna' (C. angustifolia)[3,9,10]. Tuticorin has many exporters, shipping 7,500 to 9,000 tonnes of Senna leaves each year and earning Rs 35 to 60 crore in forex 'depending on the current market price'[9].

      Modern agriculture relies heavily on chemical fertilizers to cope with the demands of a growing population. The continued use of inorganic fertilizers endangers soil health. The beneficial microorganisms decline, and natural nutrition restoration in the soil ceases, causing the soil to become unfertile[9,10]. As a result, the use of organic manure and proportionate inorganic fertilizers needs to be reduced to improve the quality and productivity of the crop's food grain, oilseed, or medicinal crop. This gradually results in a significant need for integrated nutrient management (INM), which will boost soil productivity continuously over time through the appropriate use of fertilizers and liquid organic manure[11,12].

      Organic farming has recently risen in popularity because of its inherent benefits. It contributes to crop production sustainability, complex soil nutrient status, and a clean environment[11,12]. Using fermented liquid organic manure or bio-enhancers like Jeevamrutha is a less expensive and eco-friendly preparation made from cow products. A natural biostimulant (Jeevamrutha) is a plant growth stimulant that increases crop biological efficiency[13]. It aids in accelerating soil, protects plants from diseases, and enhances the nutritional content of fruits and vegetables. It has been utilized in seedling treatment, soil application with irrigation water, foliar spraying, and much more.

      The application of liquid manure boosts microbial activity and biomass in the soil. The use of liquid organic inputs like Jeevamrutha boosts the population of beneficial bacteria and has a substantial impact on soil enzyme activity. As a result, they promote crop growth and help to maintain a safe environment and production of crops. Given the foregoing, the experiment was conducted at CSIR-CIMAP, RC, Hyderabad, with the aim of establishing the optimal doses of Jeevamrutha for increasing Senna quality and production.

    • A trial was undertaken in the CSIR-CIMAP R.C. in Hyderabad, India, for two consecutive years, 2020−2021 and 2021−2022 in the Rabi season (September to January). The experimental site's latitude, longitude, and altitude were 17°25' N, 78°33' E, and 582 m above mean sea level. Table 1 lists further information, including the climatic conditions. The experiment was laid out in a randomized complete block design (RCBD) with three replications on well-drained, red sandy soil (Table 1).

      Table 1.  Location, climate and soil of CSIR-CIMAP R.C. at Boduppal, Hyderabad, Telangana State, PIN: 500 092, India and chemical composition of bio stimulant.

      GPS coordinates, soil and climateEstimated parameters of bio stimulant (Jeevamrutha)
      Latitude17°25' N
      Longitudes78º33' EpH7.08
      Mean sea level582 m aboveEC (dS·m−1)2.98
      ClimateSemi-arid tropicalTotal nitrogen (ppm)67
      Average annual rainfall764 mmTotal phosphorus (ppm)154
      SoilRed sandy soil (79.2% sand, 9.8% silt, 6.8% clay)
      Total potassium (ppm)112
      pH7.7Total zinc (ppm)3.52
      EC0.77 dS·m−1Total copper1.32
      Organic carbon0.29%Total iron (ppm)12.4
      Available N162.4kg·ha−1Total manganese (ppm)7.4
      Available P9.2 kg·ha−1IAA (ppm)5.9
      Available K272.6 kg−1GA3 (ppm)3.1
    • The method of Palekar was used to prepare the organic liquid formulation Jeevamrutha[14]. The following were the ingredients: 10 kg cow dung, 10 L of cow urine of Gir cow breeds, 2 kg jaggery, 2 kg gram/chickpea (pulse) flour, a handful of rhizospheric soil, and 200 L of water were well combined in a stainless steel container with the help of a wooden stick. The cow dung and urine source was a local dairy farm located at Boduppal, Hyderabad, Telangana State, 500092, India. The mixture was mixed twice daily and fermented for 5–7 d. The prepared liquid formulation was used for soil application by applying irrigation water. In the Department of Soil Chemistry Laboratory at the Council of Scientific Research-Central Institute of Medicinal and Aromatic Plants, Boduppal, Hyderabad, Telangana State, 500092, India, the chemical composition of the biostimulant (Jeevamrutha) was determined. The results are presented in Table 1.

    • The treatments were comprised of seven treatments with three replications, viz., T1: application of 150 L of Jeevamrutha per acre, T2: application of 125 L of Jeevamrutha per acre, T3: application of 100 L of Jeevamrutha per acre, T4: application of 75 L of Jeevamrutha per acre, T5: application of 50 L of Jeevamrutha per acre, T6: application of 25 L of Jeevamrutha per acre, and T7: control (treated with water).

    • Senna (C. Angustifolia) var: Sona seeds were soaked in water for a whole night and treated with Trichoderma to minimize the seeds' correlation with diseases before dibbling in the field at 45 cm × 30 cm spacing. The field was irrigated for the first few weeks; one weeding was performed 30 d after seeding, and N:P:K (kg·ha−1) was applied at the seeding time.

    • Growth and yield contributing attributes were recorded at regular intervals at various phases of plant growth. The sennoside content of leaves and pods was determined using the HPLC method developed by Rama Reddy et al.[15] at the pod formation stage. Finely ground samples of dry leaves and pods (300 mg) were extracted three times with sonication (25 °C) in 30 ml of 70% methanol in water. Before being fed into the chromatographic equipment, the materials were filtered through a 0.45 m membrane. The HPLC study was conducted on a Waters HPLC system outfitted with an SPD-M20 photodiode array detector.

      The dilution plate technique determined each treatment's fungal, bacterial, and actinomycete populations[10,13,16]. For each treatment, a composite of 10 g of soil samples was extracted, and 1 g of each sample was suspended in 1 mL sterile saline (1g NaCl in 100 mL distilled H2O) in a sterile test tube and carefully vortexed. Different treatment tubes were employed to count fungi, bacteria, and actinomycetes as part of the inoculation. Soil samples were taken from the rhizosphere of plants for counting microbial load at harvest for N-fixers and P-solubilizers. Ten grams of soil was serially diluted up to 10−6 by using sterilized distilled water, and cell count per gram of rhizosphere soil was enumerated for P-solubilizers and free-living N-fixer by Pikovaskaya's media (Himedia) and Waksman No.77[13,17,18], respectively, by following the serial dilution plate count technique.

      Soil dehydrogenase activity was determined by reducing 2,3,5-triphenyl tetrazolium chloride[2,10,19]. Protease activity was measured by measuring the amount of tyrosine produced after incubating 1 g of the oven-dry equivalent of a field-moist soil sample in 5 ml of 50 mM Tri's buffer (pH 8.1) and 5 ml of 2% Na-caseinate for 2 h at 50 + 1 °C. The aromatic amino acids were removed, and the residual substrate was precipitated with 0.92 M trichloroacetic acid and calorimetrically quantified at 700 nm using the Folin-Ciocalteu reagent. Protease activity was quantified as mg tyrosine generated g−1·soil·h−1.

      Acid and alkaline phosphatase activities were determined using a standard approach[20]. In a 50 ml flask, 1 g of soil was mixed with 0.2 mL toluene, 4 mL of modified universal buffer (MUB) (pH 6.5 and 11, respectively, for acid and alkaline phosphatase), and 1 mL of p-nitrophenyl phosphate solution. After an hour of incubation, 1 mL of 0.5 M CaCl2 and 4 mL of 0.5 M NaOH were added. After the suspension was filtered, the filtrate's absorbance at 420 nm was measured using a UV-visible spectrophotometer. Controls were prepared by repeating the phosphatase activity assay technique but adding 1 mL of p-nitrophenol solution after adding 0.5 M CaCl2 and 4 mL of 0.5 M NaOH. Determination of β-glucosidase enzyme involves colorimetric estimation of P-nitrophenol released by β-glucosidase activity when soil is incubated in Mcilvaine buffer (pH 4.8) with P-nitrophenyl β-D-glucoside and toluene at 30 °C for 1 h[21] (Fig. 1).

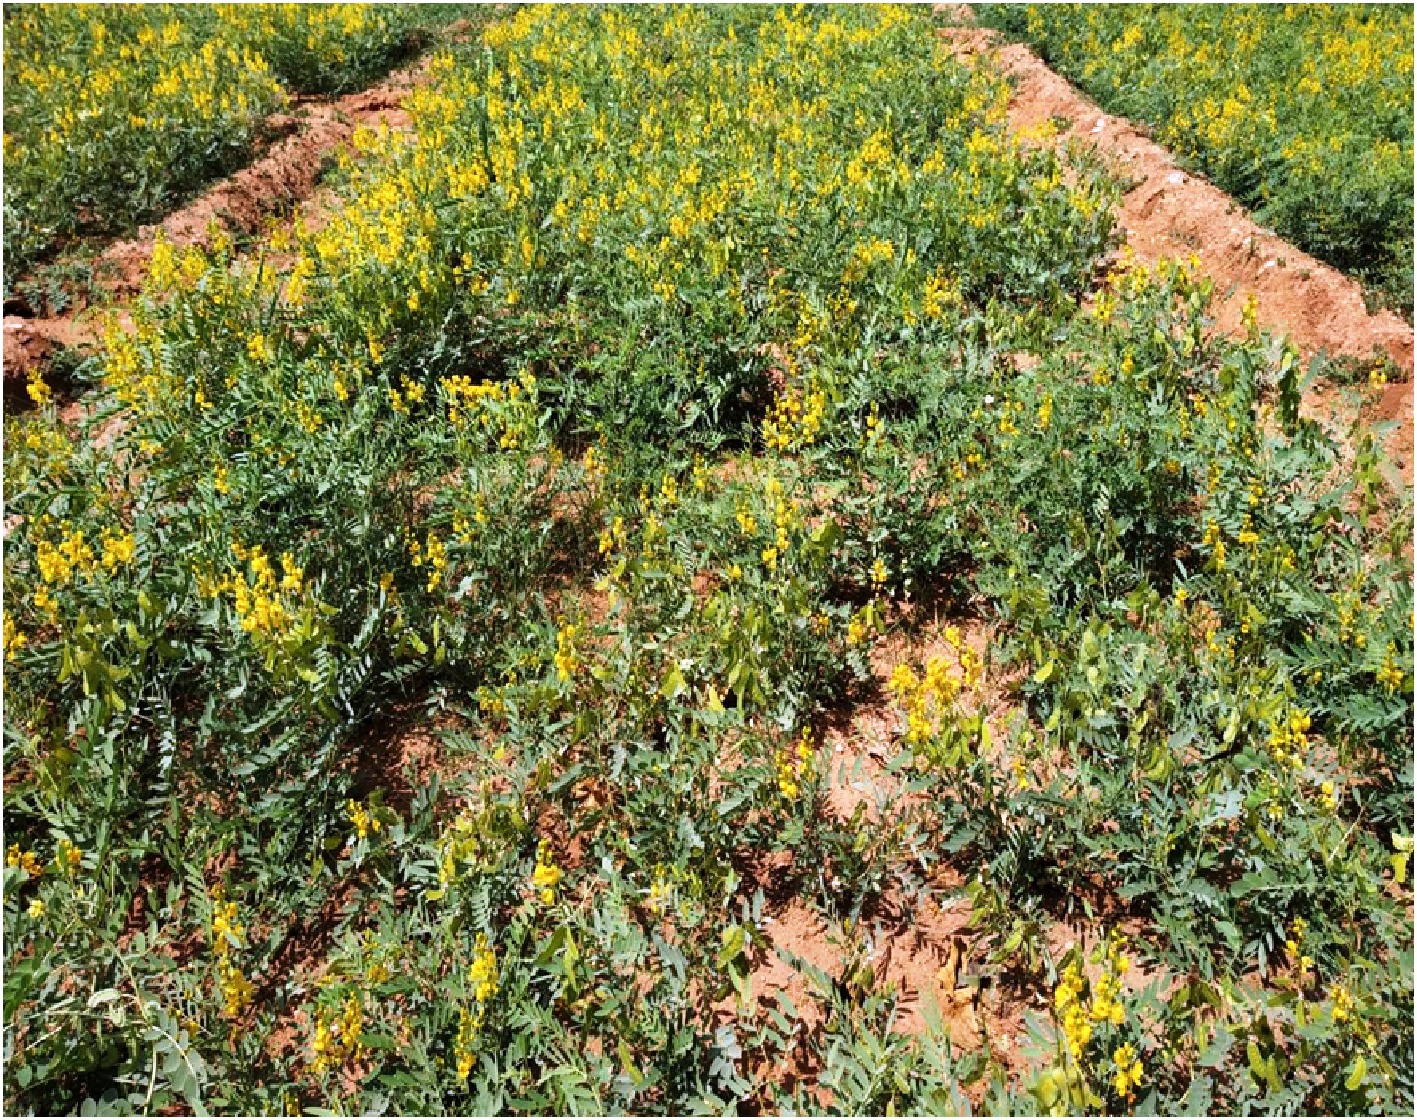
      Figure 1. 

      Field view of the experimental plot of Senna crop.

    • The benefit of gross returns was determined by multiplying the total yield by the present cost of each kilogram. The cost of cultivation for each treatment was calculated by summing up the seed cost, land preparation, labour, cultural operations, pesticides, and manure costs. Net returns were computed by subtracting manufacturing costs from gross returns. The benefit-cost ratio was determined by calculating the ratio between cultivation costs and gross returns. It is obtained by dividing the gross returns by the cost of cultivation in USD$·ha−1.

    • The analysis of variance (ANOVA) was performed on the pooled data for the experimental years 2020−2021 and 2021−2022 using CSIR-CIMAP statistical software Ver. 4.0[22].

    • The obtained results reveal that Jeevamrutha application had a significant influence on all of the characteristics of Senna (C. angustifolia). Amid the various doses of Jeevamrutha, the application of 150 L of Jeevamrutha recorded significantly higher plant height (T1; 43.7 cm) compared to another dose of application and was comparable to the applications of 125 L of Jeevamrutha per acre (T2; 40.2 cm) and 100 L of Jeevamrutha per acre (T3; 39.2 cm). Significantly, lower plant height was noticed in control (T7; 26.9 cm) and was on par with applying Jeevamrutha at 25 L per acre (T6; 29.9 cm). The number of branches and plant leaves per plant, and total dry matter production all followed a similar pattern. Applying 150 L (T1) of biostimulant/Jeevamrutha per acre recorded a substantially higher branch per plant, leaves per plant, and total dry matter production (19.9, 180.3, and 35.9 g·plant−1). It was on par with (T2) 125 L of Jeevamrutha (17.2, 177.2, and 34.2 g·plant−1), and the application of 100 L (T3) of Jeevamrutha (16.8, 176.4 and 33.1 g·plant−1). Senna's plant height and dry matter content may have improved substantially due to the availability of micronutrients and a big beneficial microbial population in Jeevamrutha[13,23]; thus, when applied to the crop as a foliar spray and through the soil, they stimulate the necessary plant growth, which encourages vegetative growth and finally increases plant height and metabolic and photosynthetic activity for improving the biological efficiency of the plant, allowing the roots to spread into deeper layers of soil and uptake more nutrients from the soil, resulting in the accumulation of more carbohydrates and higher dry matter. Our results are consistent with those of other researchers[3,16,2426]. Whereas, chlorophyll content, leaf area, and index also differed significantly with the use of a varied dose of Jeevamrutha, with the application of 150 L (T1) of Jeevamrutha per acre recording significantly higher chlorophyll content (13.2), leaf area (66.2 cm2) and LAI (4.89) comparison with the other treatments and was succeeded with T2 (12.1, 64.2 cm2, 4.76) and T3 (10.2, 63.9 cm2, 4.73) (Fig. 2). The use of Jeevamrutha resulted in faster synthesis, translocation, and accumulation of photosynthates from sources to sinks, ultimately contributing to higher growth and yield metrics (Tables 1 & 2, Fig. 2). These findings are consistent with those of other studies[27,28] in Senna.
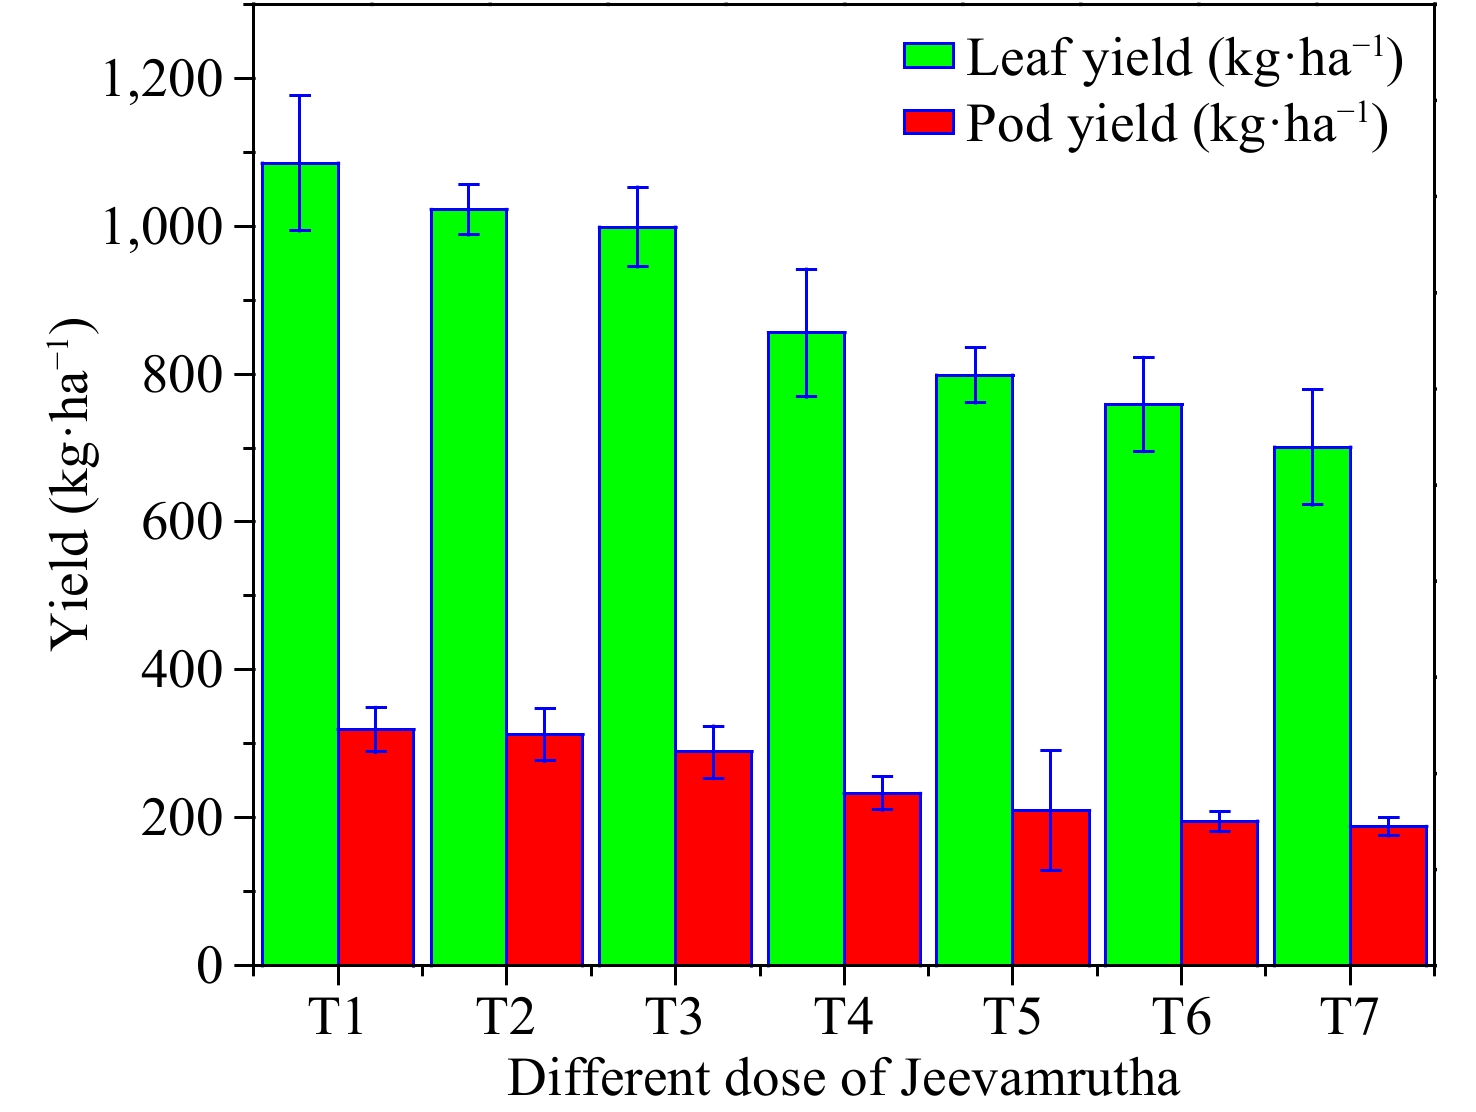
      Figure 2. 

      Influence of different doses of biostimulant/Jeevamrutha on leaf yield (kg·ha−1) and pod yield (kg·ha−1) of Senna.

      Table 2.  Microbial population in bio stimulant.

      OrganismsBio stimulant (Jeevamrutha)
      Bacteria (cfu·mL−1)15.42 × 10⁵
      Fungi (cfu·mL−1)12.12 × 10³
      Actinomycetes (cfu·mL−1)2.92 × 10³
      Free-living nitrogen fixers (cfu·mL−1)5.20 × 10²
      Phosphate solubilizing organisms (cfu·mL−1)3.20 × 10²
    • The pods/plant produced significantly depended on the dose of Jeevamrutha used. Among the various Jeevamrutha dosages, the application of Jeevamrutha at 150 L per acre recorded significantly higher pods per plant (T1; 726) compared to other treatments and was on par with (T2; 720) and (T3; 689). The significantly lower pods per plant were noticed in control (T7; 700.8) and were followed by T6 (T6; 758.9) (Table 3). The increase in pods per plant might be due to Jeevamrutha, which increases the production of growth hormones, viz., IAA, GA, and dehydrozeatin, resulting in good pod characteristics[1,29,30]. These phytohormones increased cell proliferation, elongation, and nutrient uptake, increasing pods per plant. Ramesh Babu[31] found similar results in Ashwagandha (Table 3).

      Table 3.  Effect of different doses of bio stimulant (Jeevamrutha) on growth and yield parameters of Senna in semi-arid regions of India.

      TreatmentsPlant height (cm)No. of branches per plantNo. of leaves per plantTotal dry matter production (g·plant−1)Chlorophyll contentLeaf areaLAINo of pods
      per plant
      T143.719.9180.335.9113.2566.024.89726
      T240.217.2177.234.2512.1364.214.76720
      T339.216.8176.433.1210.2463.924.73689
      T434.214.2165.229.749.2359.214.39654
      T531.513.8154.725.159.0156.274.17598
      T629.910.2144.323.218.7855.324.10546
      T726.98.5135.221.588.0349.133.64487
      S.Em±1.820.912.81.340.521.40.1118.2
      CD (P = 0.05)5.412.748.44.021.564.20.3454.7
      T1: 150 L of bio stimulant per acre, T2: 125 L of bio stimulant per acre, T3: 100 L of bio stimulant per acre, T4: 75 L of bio stimulant per acre, T5: 50 L of bio stimulant per acre, T6: 25 L of bio stimulant per acre, T7: Control.
    • Leaf and pod yield of C. angustifolia differ significantly with a varied dose of Jeevamrutha. Among the varied treatments, the application of 150 L (T1) of Jeevamrutha per acre recorded significantly higher leaf yield (1,085.2 kg·ha−1) and pod yield (318.7kg·ha−1) in comparison to the rest of the treatments. It was on par with T2 i.e., applying 125 L of Jeevamrutha per acre (1,022.5 kg·ha−1, 312.1 kg·ha−1) followed by T3, i.e., application of 100 L of Jeevamrutha per acre (998.5 kg·ha−1, 288.5 kg·ha−1, respectively). Significantly, lower leaf (700.2 kg·ha−1) and pod yield (487 kg·ha−1) were noticed in the control (T7) (Fig. 3). Raised nutrient availability, enhanced soil health, and an appropriate supply of macro and micronutrients might all have contributed to the rise in leaf and pod yield, which raised seed yield. Furthermore, Jeevamrutha may have created a favorable environment in the soil for nitrogen buildup in addition to boosting nutrient availability (Fig. 3). Hemalatha et al.[32] found similar results in kalmegh[13,32], and Kalyanasundaram et al.[33] in the sweet flag, and Anuja & Jayasri[34] in sweet basil[30,34]. The sustained availability of nutrients by applying Jeevamrutha throughout the cropping period increased soil microbial activity, and the photosynthetic rate might have increased the leaf and pod yield[4,8,3538].

      Figure 3. 

      Influence of biostimulant/Jeevamrutha on gross and net return in Senna.

    • Despite the Jeevamrutha dose, the sennoside concentration of Senna (C. angustifolia) pods is always higher than that of the leaves. Sennoside content in both leaf and pod altered drastically following Jeevamrutha treatment, as seen in (Table 2). Among the different treatments, T1, i.e., application of 150 l of Jeevamrutha per acre, recorded significantly higher sennoside content in leaves (2.01%) and pods (3.11%) in comparison to the rest of the treatment and was followed by T2 (1.98%, 3.09%) and T3 (1.89%, 2.97%). This feature could be related to an increase in enzyme activity associated with the sennoside biosynthesis pathway, as well as a shift from primary to secondary metabolite synthesis[3943]. Lower sennoside content in leaves and pods is recorded in control (T7; 1.52%, 2.42%). A similar trend was noticed in sennoside yield with T1, i.e., application of Jeevamrutha at 150 L per acre recorded significantly higher sennoside yield (31.7 kg−1) compared to other treatments. It was followed by T2 (29.9 kg·ha−1) and T3 (27.4 kg·ha−1). Lower sennoside yield was noticed in control (T7; 15.2 kg·ha−1) (Table 4). This attribute might be owing to increased yield and sennoside content in the leaf and pod, which in turn, increase the sennoside yield in T1 and T2 treatments, i.e., application of Jeevamrutha at 150 and 125 L per acre, respectively (Tables 4 & 5).

      Table 4.  Effect of bio stimulant (Jeevamrutha) on sennoside content in leaves and pod and sennoside yield.

      TreatmentsSennoside content (%)Sennoside yield
      (kg·ha−1)
      LeavesPod
      T12.013.1131.7
      T21.983.0929.9
      T31.892.9727.4
      T41.932.6922.8
      T51.872.6620.5
      T61.692.5917.9
      T71.522.4215.2
      S.Em±0.030.061.2
      CD (P = 0.05)0.090.123.7
      T1: 150 L of bio stimulant per acre, T2: 125 L of bio stimulant per acre, T3: 100 L of bio stimulant per acre, T4: 75 L of bio stimulant per acre, T5: 50 L of bio stimulant per acre, T6: 25 L of bio stimulant per acre, T7: Control.

      Table 5.  Effect of different doses of bio stimulant (Jeevamrutha) on beneficial microorganisms in the soil.

      TreatmentsBacteria
      (cfu·g−1)
      Fungi
      (cfu·g−1)
      Actinomycetes
      (cfu·g−1)
      Nitrogen fixer
      (cfu·g−1)
      P solubilizers
      (cfu·g−1)
      T18.2 × 1057.3 × 1044.1 × 1031.9 × 1033.9 × 103
      T27.6 × 1056.8 × 1044.0 × 1032.1 × 1033.2 × 103
      T37.1 × 1056.2 × 1043.7 × 1031.7 × 1032.7 × 103
      T46.7 × 1055.8 × 1043.6 × 1031.8 × 1032.5 × 103
      T56.0 × 1055.1 × 1043.4 × 1031.2 × 1031.9 × 103
      T66.2 × 1054.9 × 1042.8 × 1031.4 × 1031.7 × 103
      T75.7 × 1054.2 × 1042.2 × 1031.3 × 1031.6 × 103
      S.Em±0.3 × 1050.4 × 1040.23 × 1030.3 × 1030.1 × 103
      CD
      (P = 0.05)
      0.9 × 1051.2 × 1040.55 × 103NS0.3 × 103
      T1: 150 L of bio stimulant per acre, T2: 125 L of bio stimulant per acre, T3: 100 L of bio stimulant per acre, T4: 75 L of bio stimulant per acre, T5: 50 L of bio stimulant per acre, T6: 25 L of bio stimulant per acre, T7: Control.
    • Beneficial microorganisms in soil differ significantly with the application of different doses of Jeevamrutha in Senna; with an application of 150 L of Jeevamrutha per acre recorded significantly higher bacteria (8.2 × 10⁵ cfu·g−1), fungi (7.3 × 10⁴ cfu·g−1), actinomycetes (4.1 × 10³ cfu·g−1) and P solubilizers (3.9 × 10³ cfu·g−1) compared to rest of the treatment and was on par with the application of 150 L of Jeevamrutha per acre (7.6 × 10⁵ cfu·g−1, 6.8 × 10⁴ cfu·g−1, 3.7 × 10³ cfu·g−1, and 2.7 × 10³ cfu·g−1, respectively).

      Nonetheless, the greater dose of Jeevamrutha resulted in a more substantial microbial population, which might be ascribed to Jeevamrutha acting as a source of carbon and energy for microorganisms, boosting the number of microorganisms in the soil. However, a significantly lower microbial population was noticed in control, i.e., bacteria (5.7 × 10⁵ cfu·g−1), fungi (4.2 × 10⁴ cfu·g−1), actinomycetes (2.2 × 10³ cfu·g−1), and P solubilizers (1.6 × 10³ cfu·g−1). The low microbial population counts in control could be attributed to a lack of substrate to sustain microbial biomass. The acquired results are consistent with the findings of Boraiah et al.[44]. Similarly, enzyme activity in soil differs dramatically when Jeevamrutha is applied to Senna. Among the different doses of Jeevamrutha, the application of 150 L of Jeevamrutha per acre recorded significantly higher dehydrogenase activity (1.33 µg·TPF−1·g−1·h−1), alkaline phosphatase (412 µg·TPF−1·g−1·h−1), acid phosphatase (367 µg·TPF−1·g−1·h−1), β-Glucosidase (120 µg·TPF−1·g−1·h−1) and protease (154 µg·TPF−1·g−1·h−1) compared to rest of the treatment and was followed by application of 125 L of Jeevamrutha per acre (1.17 µg·TPF−1·g−1·h−1, 374 µg·TPF−1·g−1·h−1, 355 µg·TPF−1·g−1·h−1, 99 µg·TPF−1·g−1·h−1 and 123 µg·TPF−1·g−1·h−1). Enzymatic activity was considerably lower in the control group.

      Nonetheless, the increased enzymatic activity in the soil can be attributed to the important function of the microbial population as a result of the addition of Jeevamrutha, which acted as a tonic for enhanced microbial development[1,2,4,29]. Enzymatic activity in the soil may have increased due to favorable bacterial environments (Tables 5 & 6). The higher enzymatic activity in the Jeevamrutha plot could be explained by enhanced microbial activity[4447].

      Table 6.  Effect of different doses of bio stimulant (Jeevamrutha) on enzyme activity in the soil.

      TreatmentsDehydrogenase activity (µg·TPF−1·g−1·h−1)Alkaline phosphatase (µg·TPF−1·g−1·h−1)Acid phosphatase (µg·TPF−1·g−1·h−1)β-Glucosidase
      (µg·TPF−1·g−1·h−1)
      Protease
      (µg·TPF−1·g−1·h−1)
      T11.33412367120154
      T21.1737435599123
      T30.9038224884120
      T40.7529120175100
      T50.542771556585
      T60.481321125059
      T70.4188552922
      SEm±0.1512.87.13.94.8
      CD (P = 0.05)0.4538.221.411.714.1
      T1: 150 L of bio stimulant per acre, T2: 125 L of bio stimulant per acre, T3: 100 L of bio stimulant per acre, T4: 75 L of bio stimulant per acre, T5: 50 L of bio stimulant per acre, T6: 25 L of bio stimulant per acre, T7: Control.
    • Economics of Senna (C. angustifolia) may differ significantly about the varied application of Jeevamrutha, with the application of 150 L (T1) of Jeevamrutha per acre recorded substantially higher gross return per ha (USD$1,495) and Net return (USD$1,066.4 compared to other treatments and was on par with the application of 125 L (T2) of Jeevamrutha per acre (USD$1,423.8 and 995.2 respectively) and was followed by T3 (USD$1,369.4 and 940.9). Significantly lower gross return (USD$942.9) and net returns (USD$585.8) were noticed in control (T7) (Fig. 4). Similarly, the benefit-cost ratio differed significantly from T1, i.e., the application of 150 L of Jeevamrutha per acre recorded a higher benefit-cost ratio (3.49) than other treatments. T2 applied 125 L of Jeevamrutha per acre (3.32) (Tables 57). In contrast, a lower benefit-cost ratio was noticed in control (T7; 2.64) and was followed by T6 (2.72) (Table 7, Fig. 4).

      Figure 4. 

      Application of 150 L (T1) of Jeevamrutha to Senna crop.

      Table 7.  Effect of different doses of bio stimulant (Jeevamrutha) on gross and net return of Senna.

      TreatmentsGross return
      (USD$·ha−1)
      Net return
      (USD$·ha−1)
      Benefit-cost ratio
      T11,495.01,066.43.49
      T21,423.8995.23.32
      T31,369.4940.93.20
      T41,154.9726.32.99
      T51,067.9689.32.82
      T61,009.4637.92.72
      T7942.9585.82.64
      S.Em±21.821.8
      CD (P = 0.05)64.564.5
      T1: 150 L of bio stimulant per acre, T2: 125 L of bio stimulant per acre, T3: 100 L of bio stimulant per acre, T4: 75 L of bio stimulant per acre, T5: 50 L of bio stimulant per acre, T6: 25 L of bio stimulant per acre, T7: Control.

      Finally, Jeevamrutha is a natural fertilizer that can be used in place of chemical fertilizers. It is a type of organic liquid fertilizer used in organic farming and gardening. It is made from natural ingredients and is believed to be a sustainable and eco-friendly alternative to synthetic fertilizers. While it can be a valuable addition to organic farming practices, it's important to note that its nutrient content, including NPK (Nitrogen, Phosphorus, and Potassium), varies depending on how it's prepared. In general, Jeevamrutha is not typically formulated to have specific NPK values like synthetic fertilizers. Instead, its primary focus is on improving soil health and promoting microbial activity in the soil, which can lead to better nutrient availability for plants over time. It is rich in beneficial microorganisms, such as beneficial bacteria, fungi, and other soil organisms, which help break down organic matter and release nutrients in a form that plants can absorb. Jeevamrutha is more of a soil conditioner and biofertilizer that enhances soil fertility and overall plant health rather than directly providing specific nutrient values like NPK ratios. It is used to improve the structure and fertility of the soil and is often considered a holistic approach to sustainable agriculture. If farmers are looking for specific NPK values in fertilizer, they may need to consider synthetic fertilizers or other organic fertilizers that provide more precise nutrient content. However, many organic and sustainable farmers prefer using Jeevamrutha and similar products to support long-term soil health and reduce their reliance on chemical fertilizers. It is high in macronutrients and micronutrients, which are necessary for plant growth and development. Jeevamrutha promotes microbial activity, which enhances soil fertility. When compared to previous Jeevamrutha doses, using Jeevamrutha at 150 (T1) or 125 (T2) L per acre resulted in significantly higher leaf, pod, and sennoside yields. Meanwhile, increased leaf and pod production from a higher Jeevamrutha dose boosts Senna's gross and net returns, as well as the benefit-cost ratio.

    • Jeevamrutha is a natural fertilizer that can replace chemical fertilizers. It is an excellent source of macro and micro nutrients for plant growth and development. Jeevamrutha improves soil fertility by stimulating microbial activity. The current study found that applying Jeevamrutha at 150 (T1)/125 (T2) L per acre resulted in significantly higher leaf, pod, and sennoside yields when compared to other Jeevamrutha doses. Meanwhile, increased leaf and pod production from a higher dose of biostimulant/Jeevamrutha raises Senna's gross and net returns and the benefit-cost ratio.

    • The authors confirm contribution to the paper as follows: study planning, actual experimentation: Jnanesha AC; experimentation: Venugopal S, Kumar SR; Kumar A; data collection: Bisht D; Chemical analysis: Chanotiya CS; statistical analyses, and manuscript preparation: Lal RK. All authors reviewed the results and approved the final version of the manuscript.

    • The datasets generated during and/or analyzed during the current study are available from the corresponding author on reasonable request.

      • This work was supported by the Council of Scientific and Industrial Research, India, under HCP 010; the last author is related to an emeritus scientist, CIMAP Publication No. CIMAP/PUB/2021/118. The authors are thankful to the director of CSIR-CIMAP Lucknow, India, for providing facilities and encouragement throughout the work. Thanks also to the Scientist-in-Charge at CRC Hyderabad for the necessary facilities during this investigation.

      • The authors declare that they have no conflict of interest.

      • Copyright: © 2024 by the author(s). Published by Maximum Academic Press, Fayetteville, GA. This article is an open access article distributed under Creative Commons Attribution License (CC BY 4.0), visit https://creativecommons.org/licenses/by/4.0/.
    Figure (4)  Table (7) References (47)
  • About this article
    Cite this article
    Jnanesha AC, Venugopal S, Kumar SR, Kumar A, Bisht D, et al. 2024. Optimization of a new organic approach to natural biostimulant (Jeevamrutha) for yield and quality management in Senna (Cassia angustifolia Vahl.): an agriculturally highly export-oriented crop. Technology in Horticulture 4: e009 doi: 10.48130/tihort-0024-0006
    Jnanesha AC, Venugopal S, Kumar SR, Kumar A, Bisht D, et al. 2024. Optimization of a new organic approach to natural biostimulant (Jeevamrutha) for yield and quality management in Senna (Cassia angustifolia Vahl.): an agriculturally highly export-oriented crop. Technology in Horticulture 4: e009 doi: 10.48130/tihort-0024-0006

Catalog

  • About this article

/

DownLoad:  Full-Size Img  PowerPoint
Return
Return