-
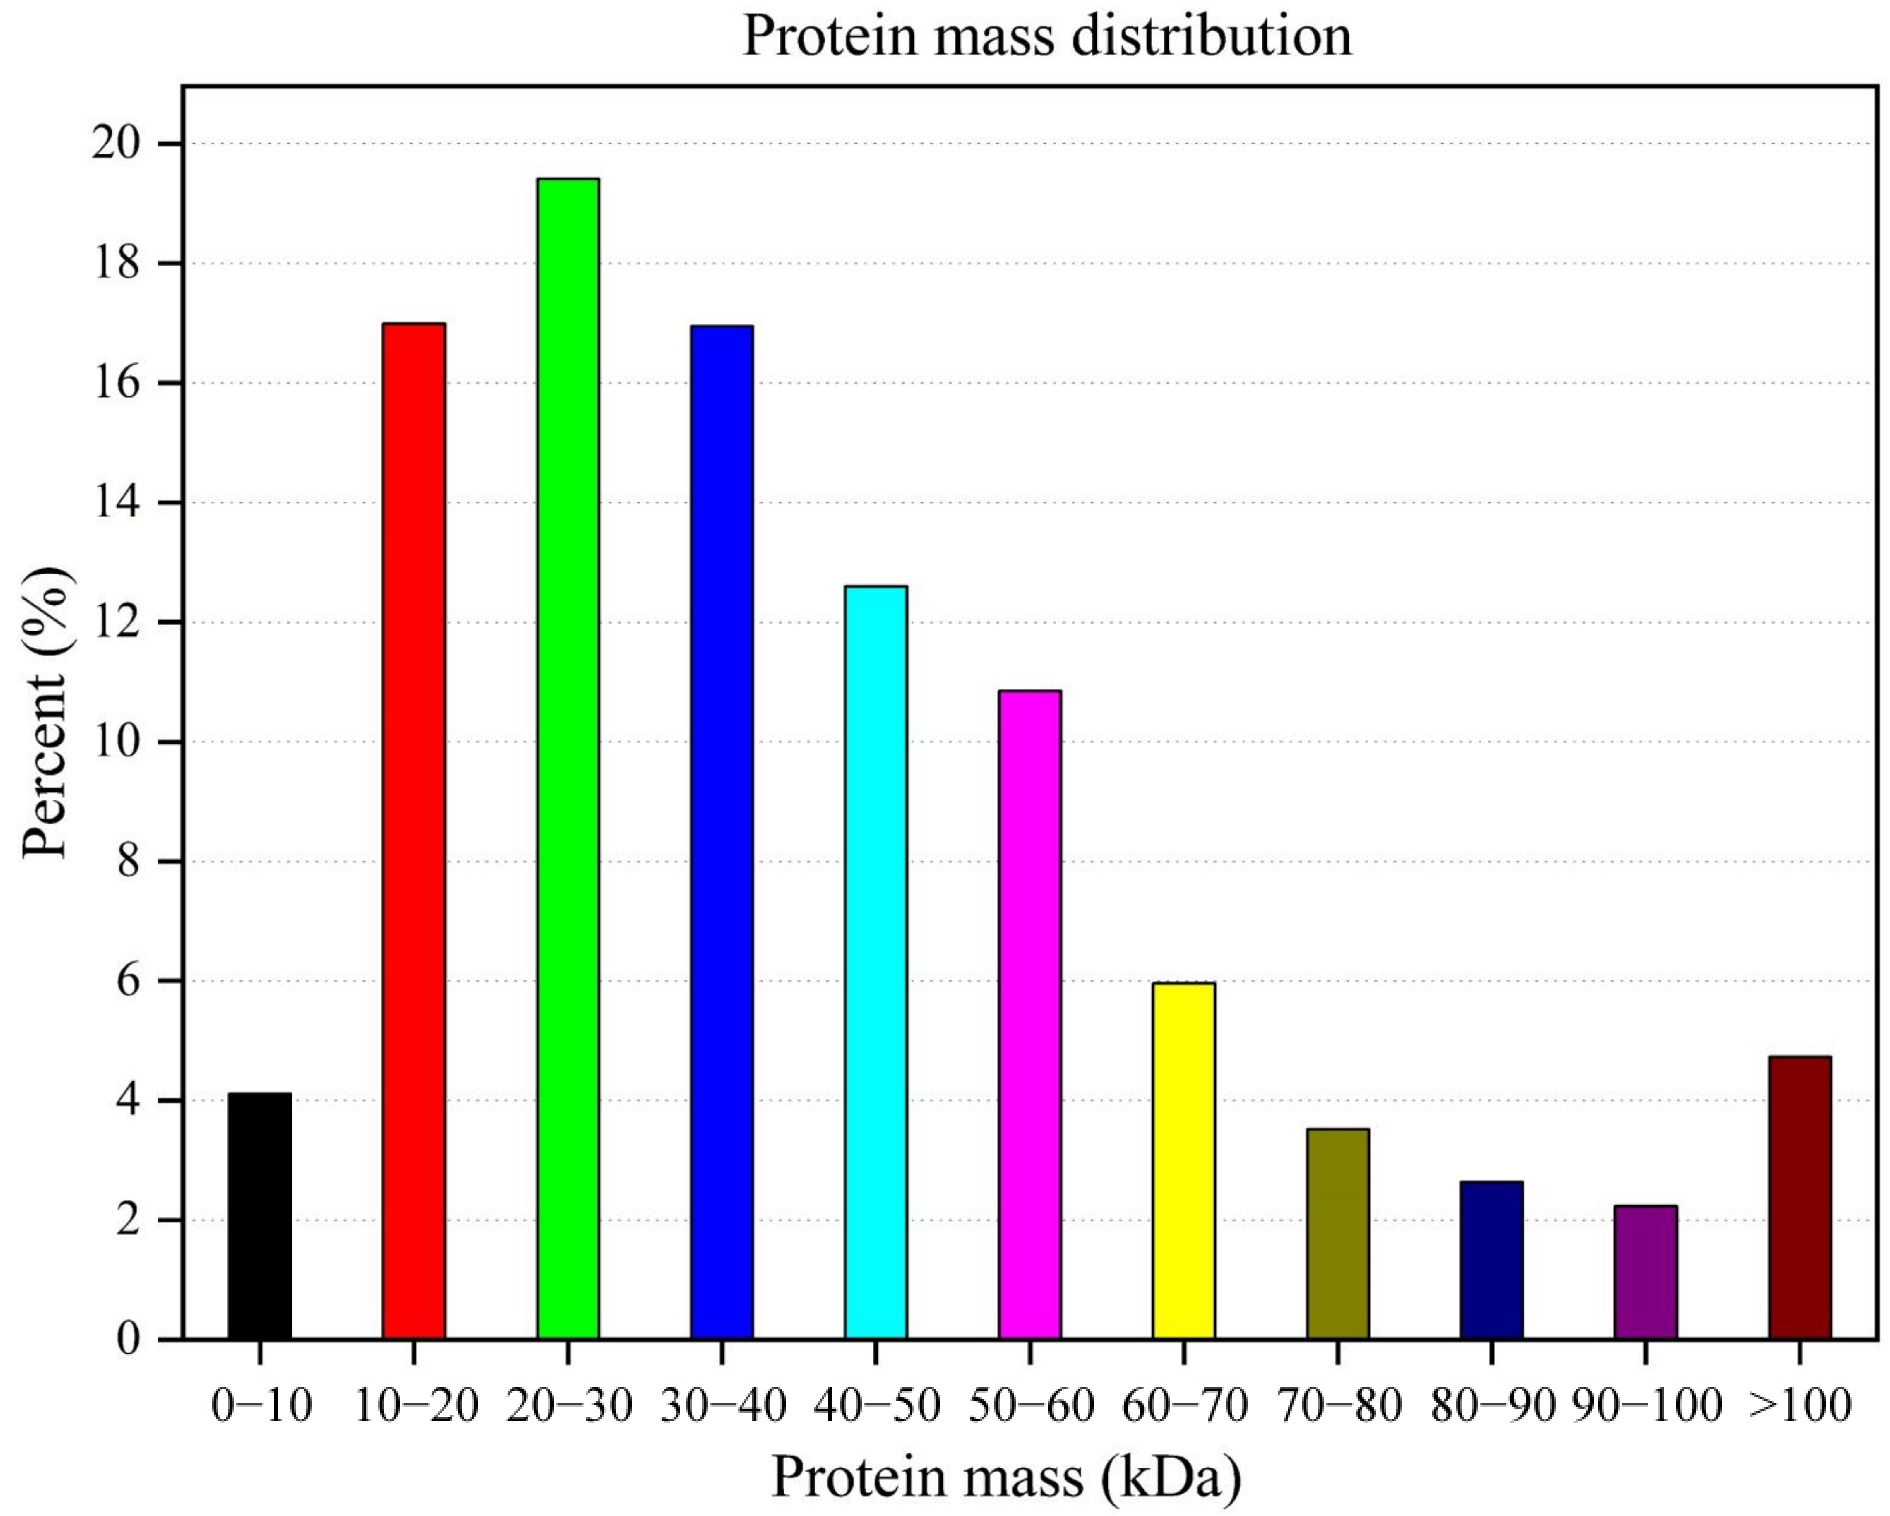
Figure 1.
Protein mass distribution of Lilium davidii var. unicolor peptides.
-
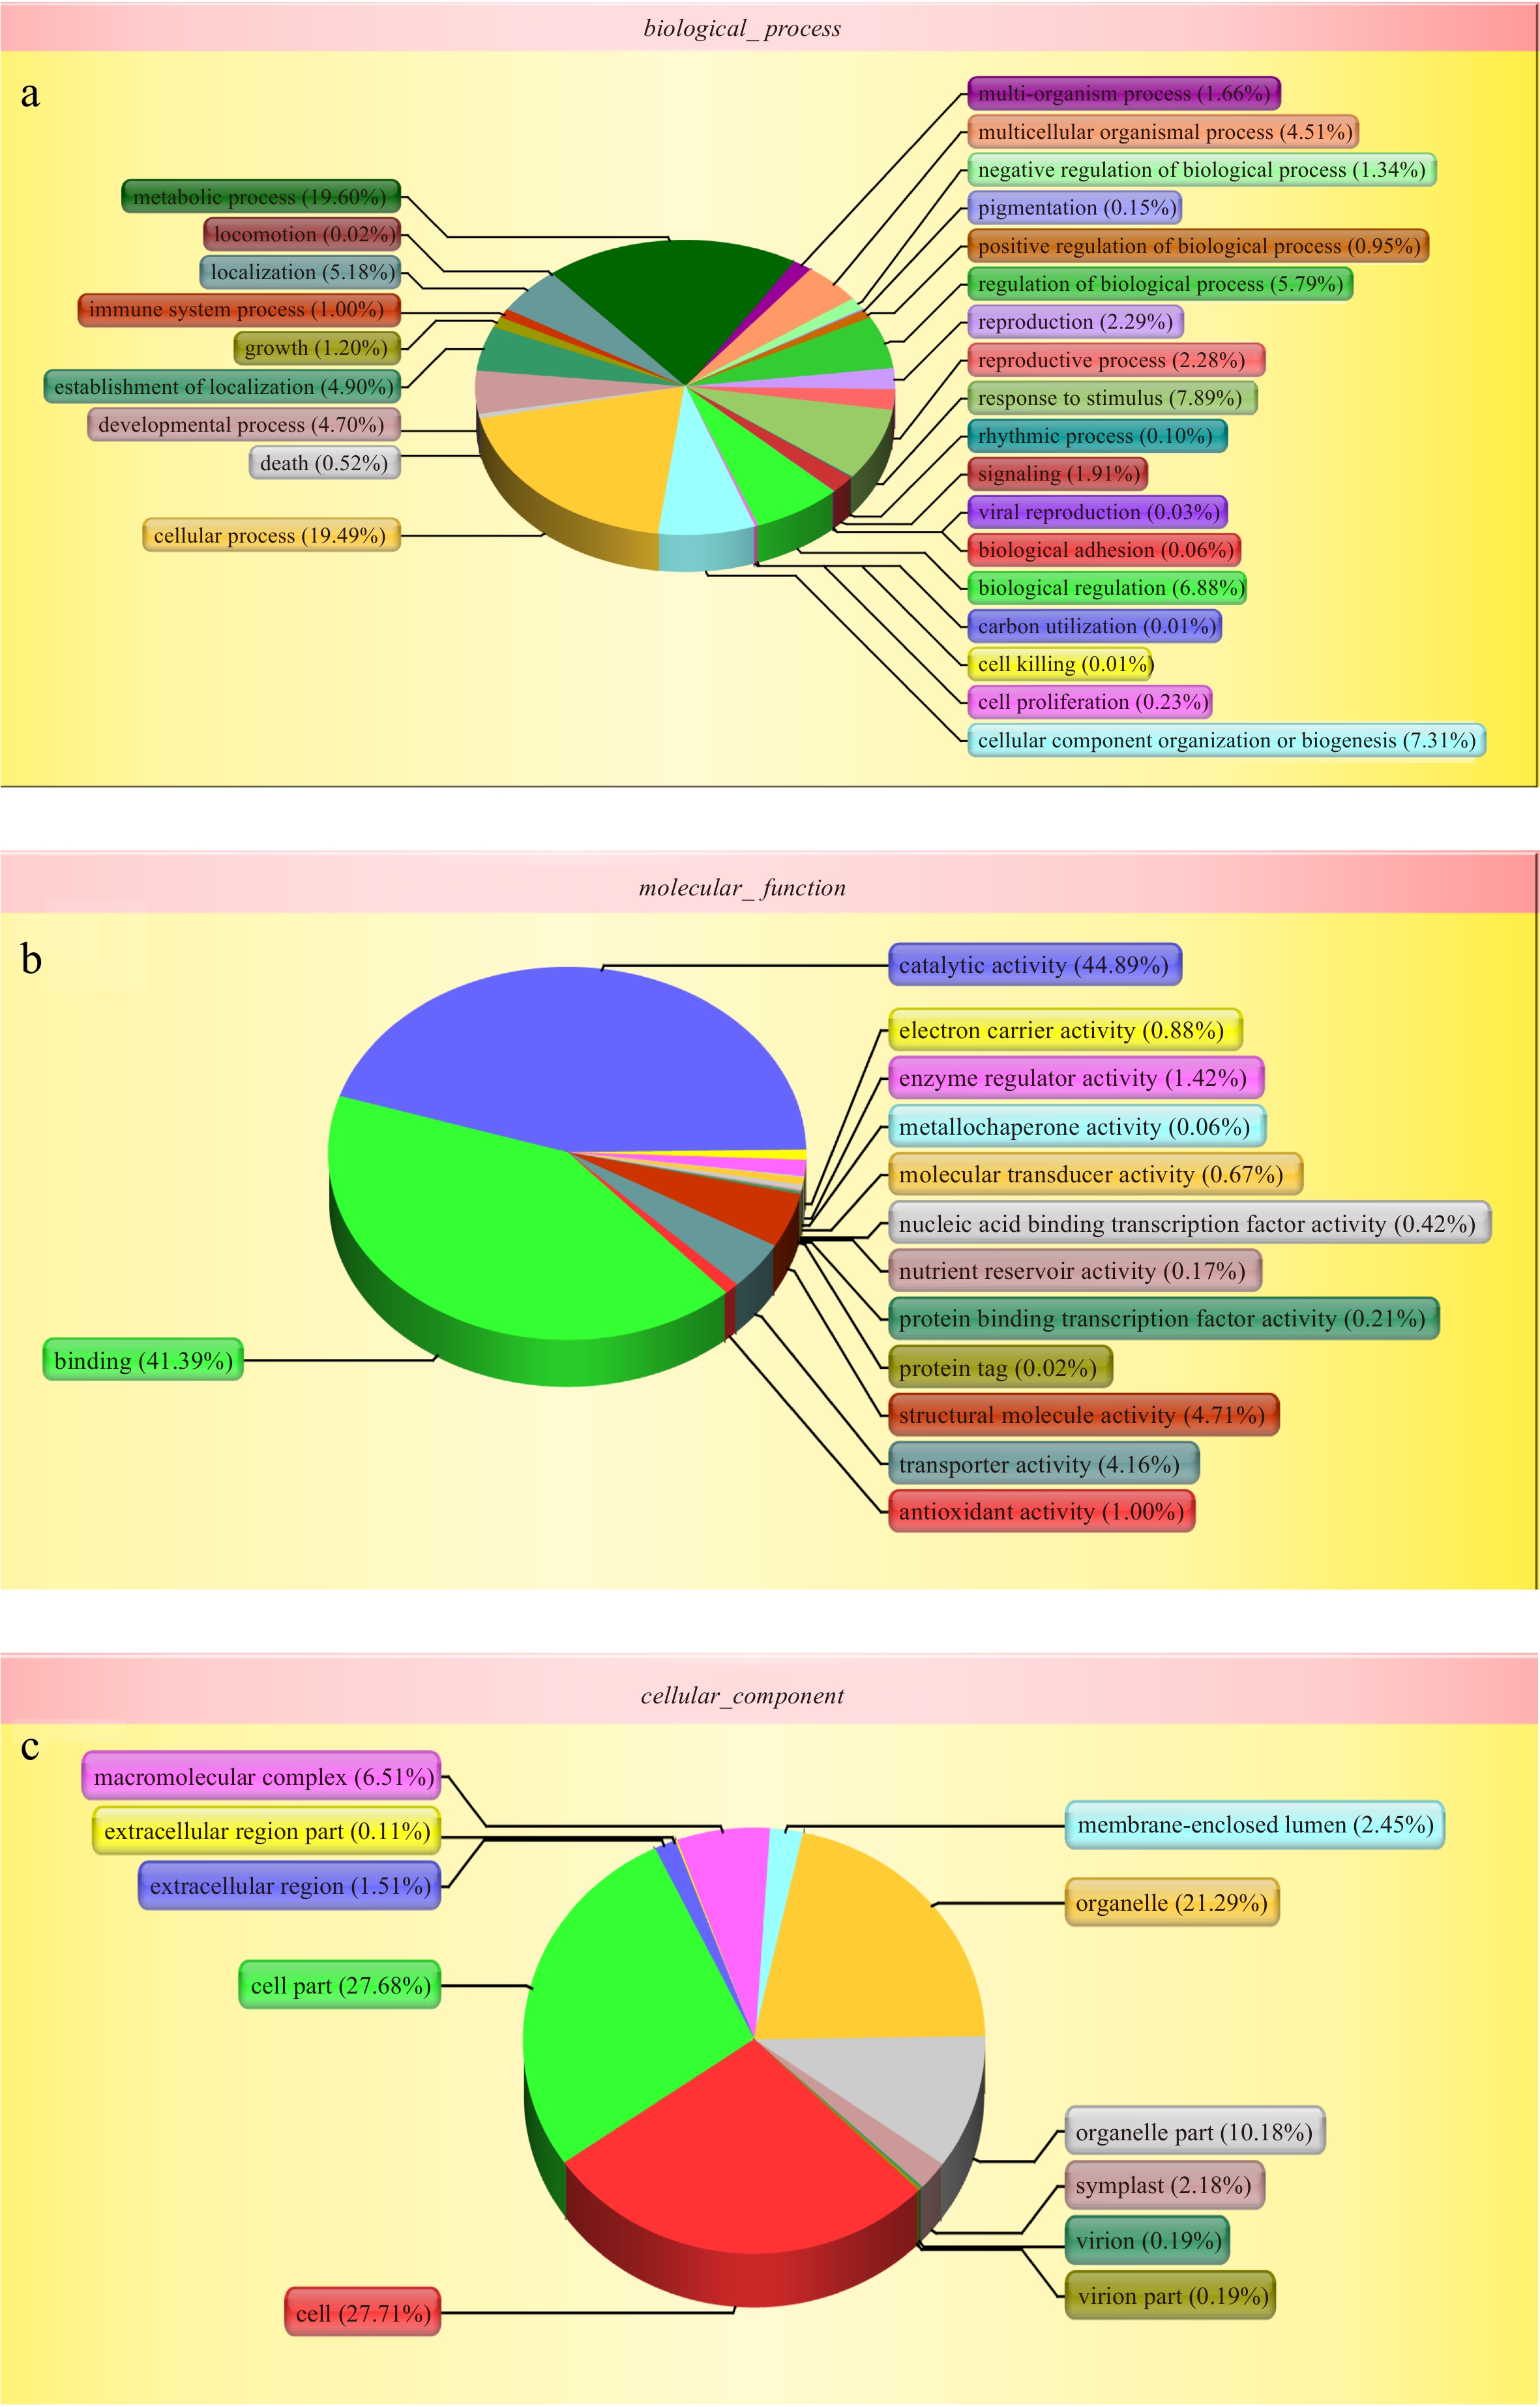
Figure 2.
Gene ontology (GO) analysis of all proteins during the bulblets development indentified by iTRAQ analysis. The left y-axis indicates the percentage of a specific category of genes existed in the main category, whereas the right y-axis indicates the number of a specific category of genes existed in main category. The classification of these proteins in different categories are shown based on (a) biological process, (b) molecular function and (c) cellular component.
-
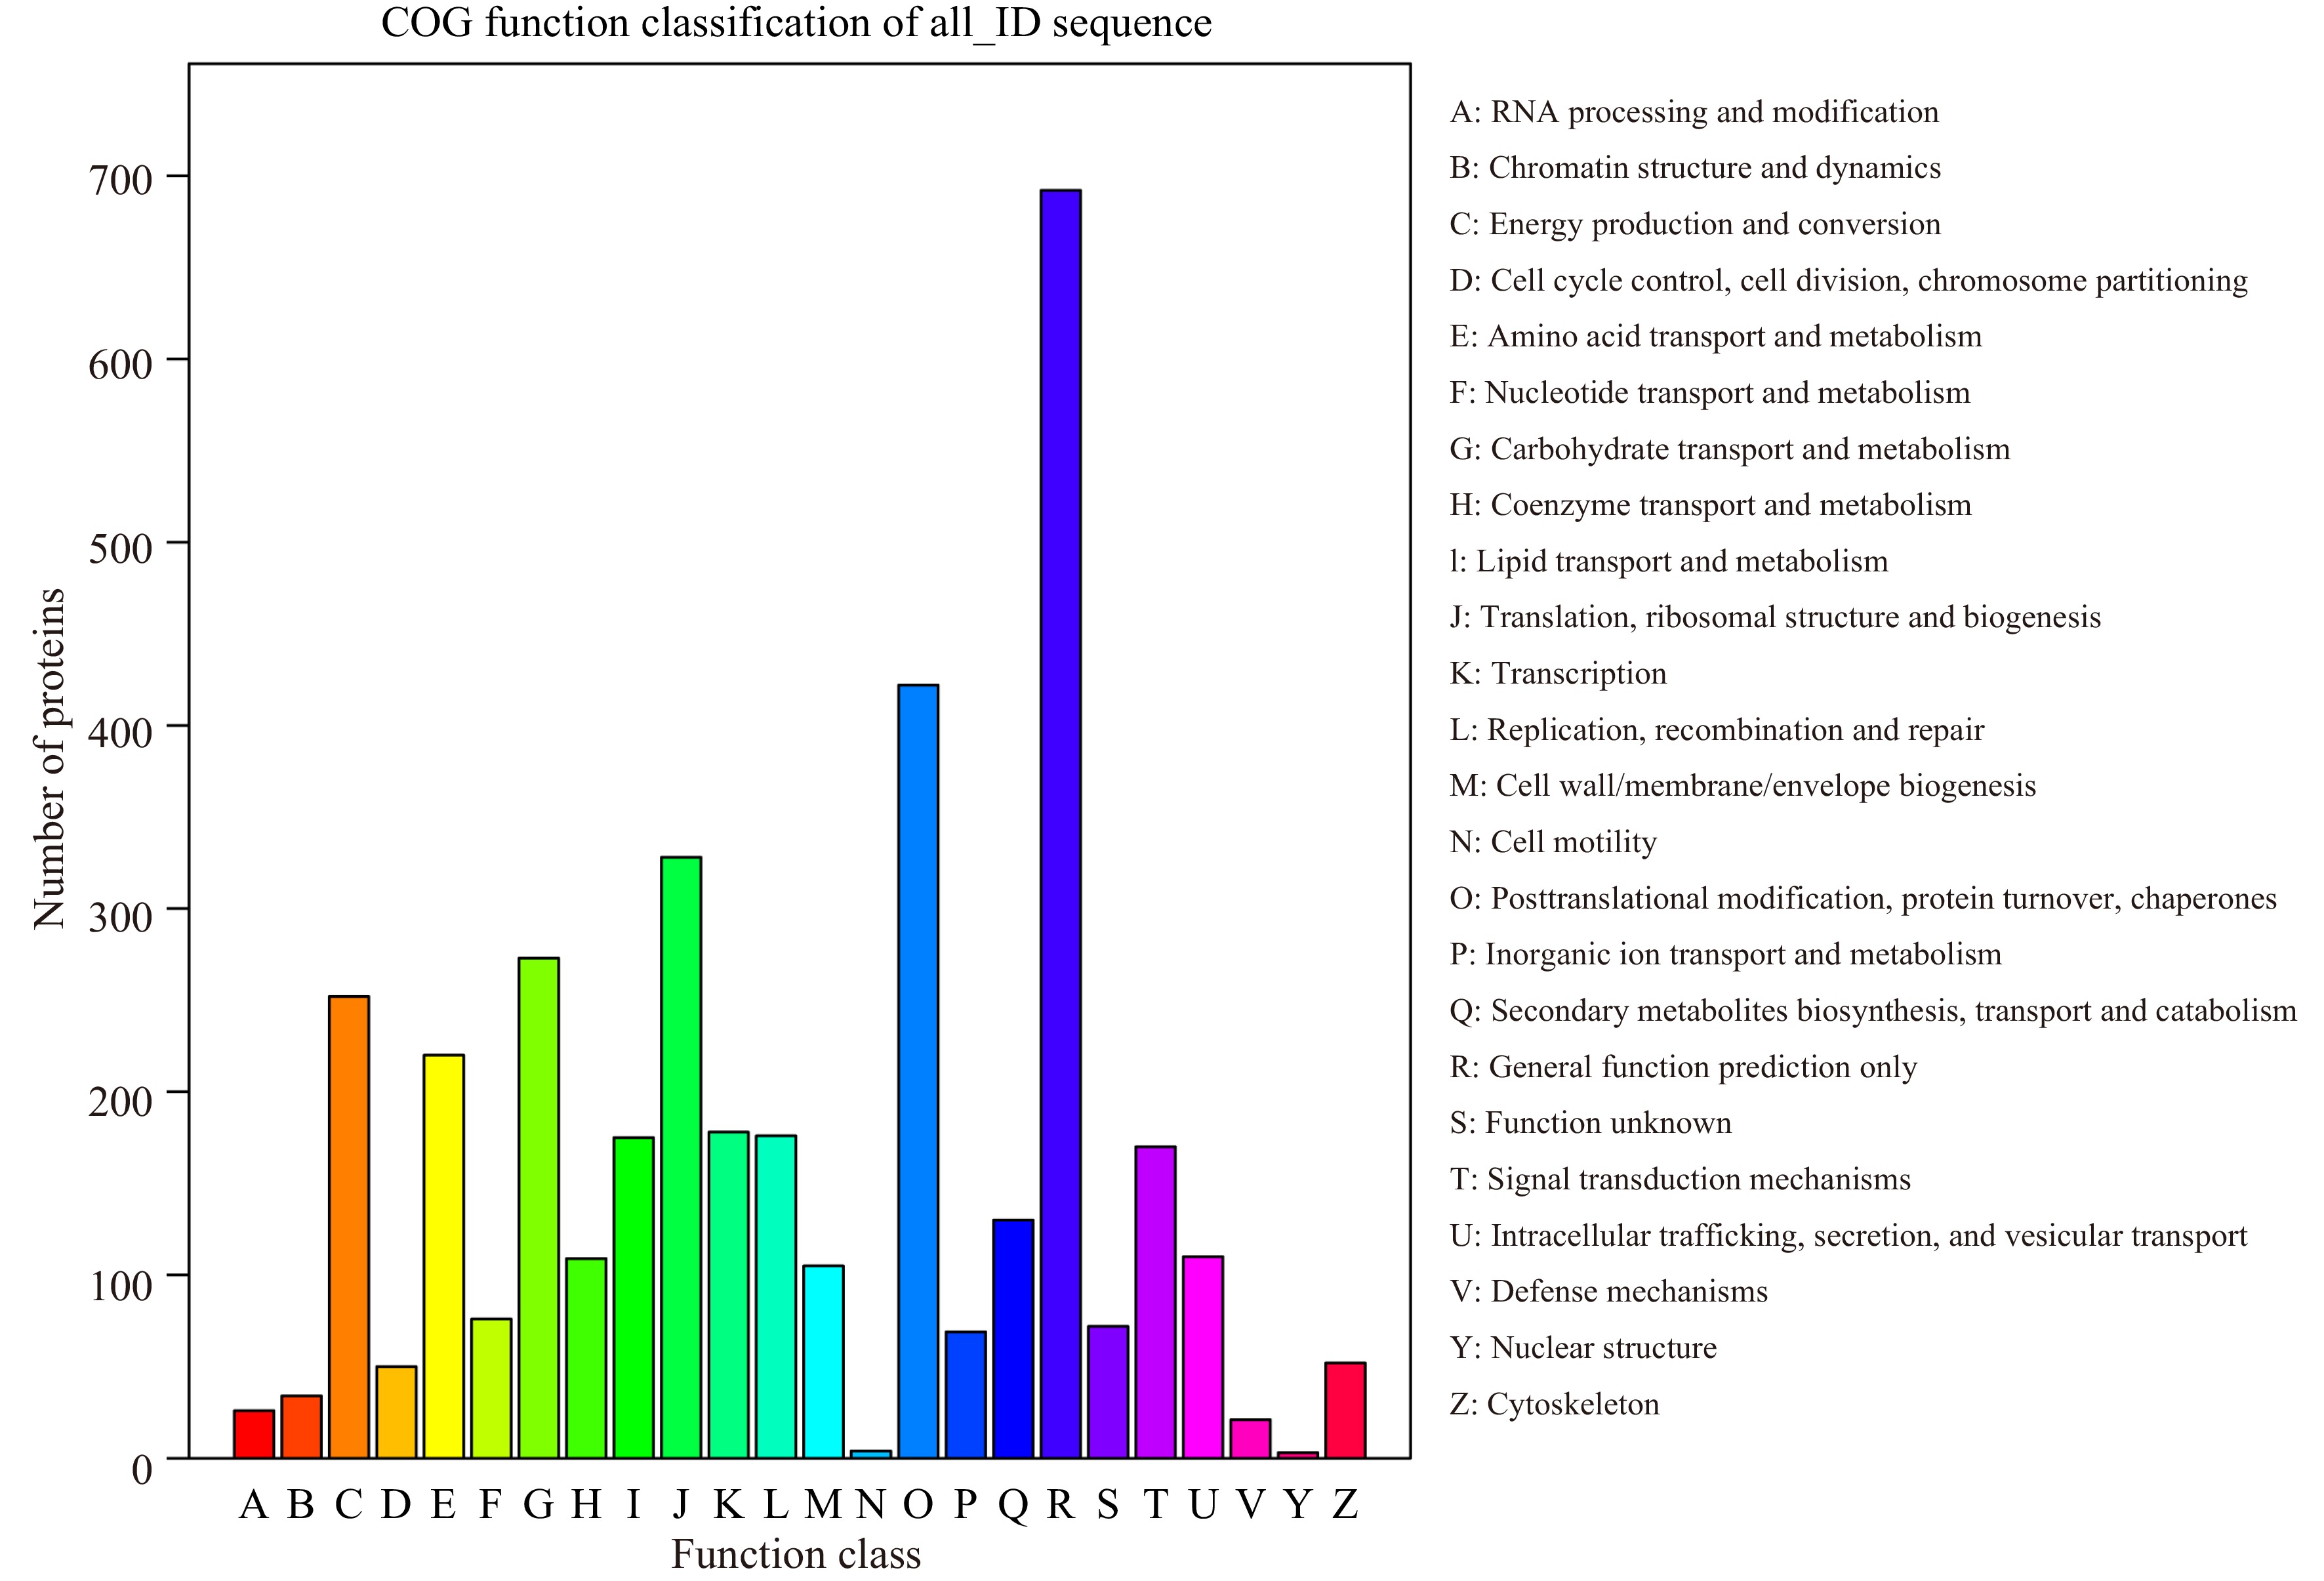
Figure 3.
COG classification of peptides.
-
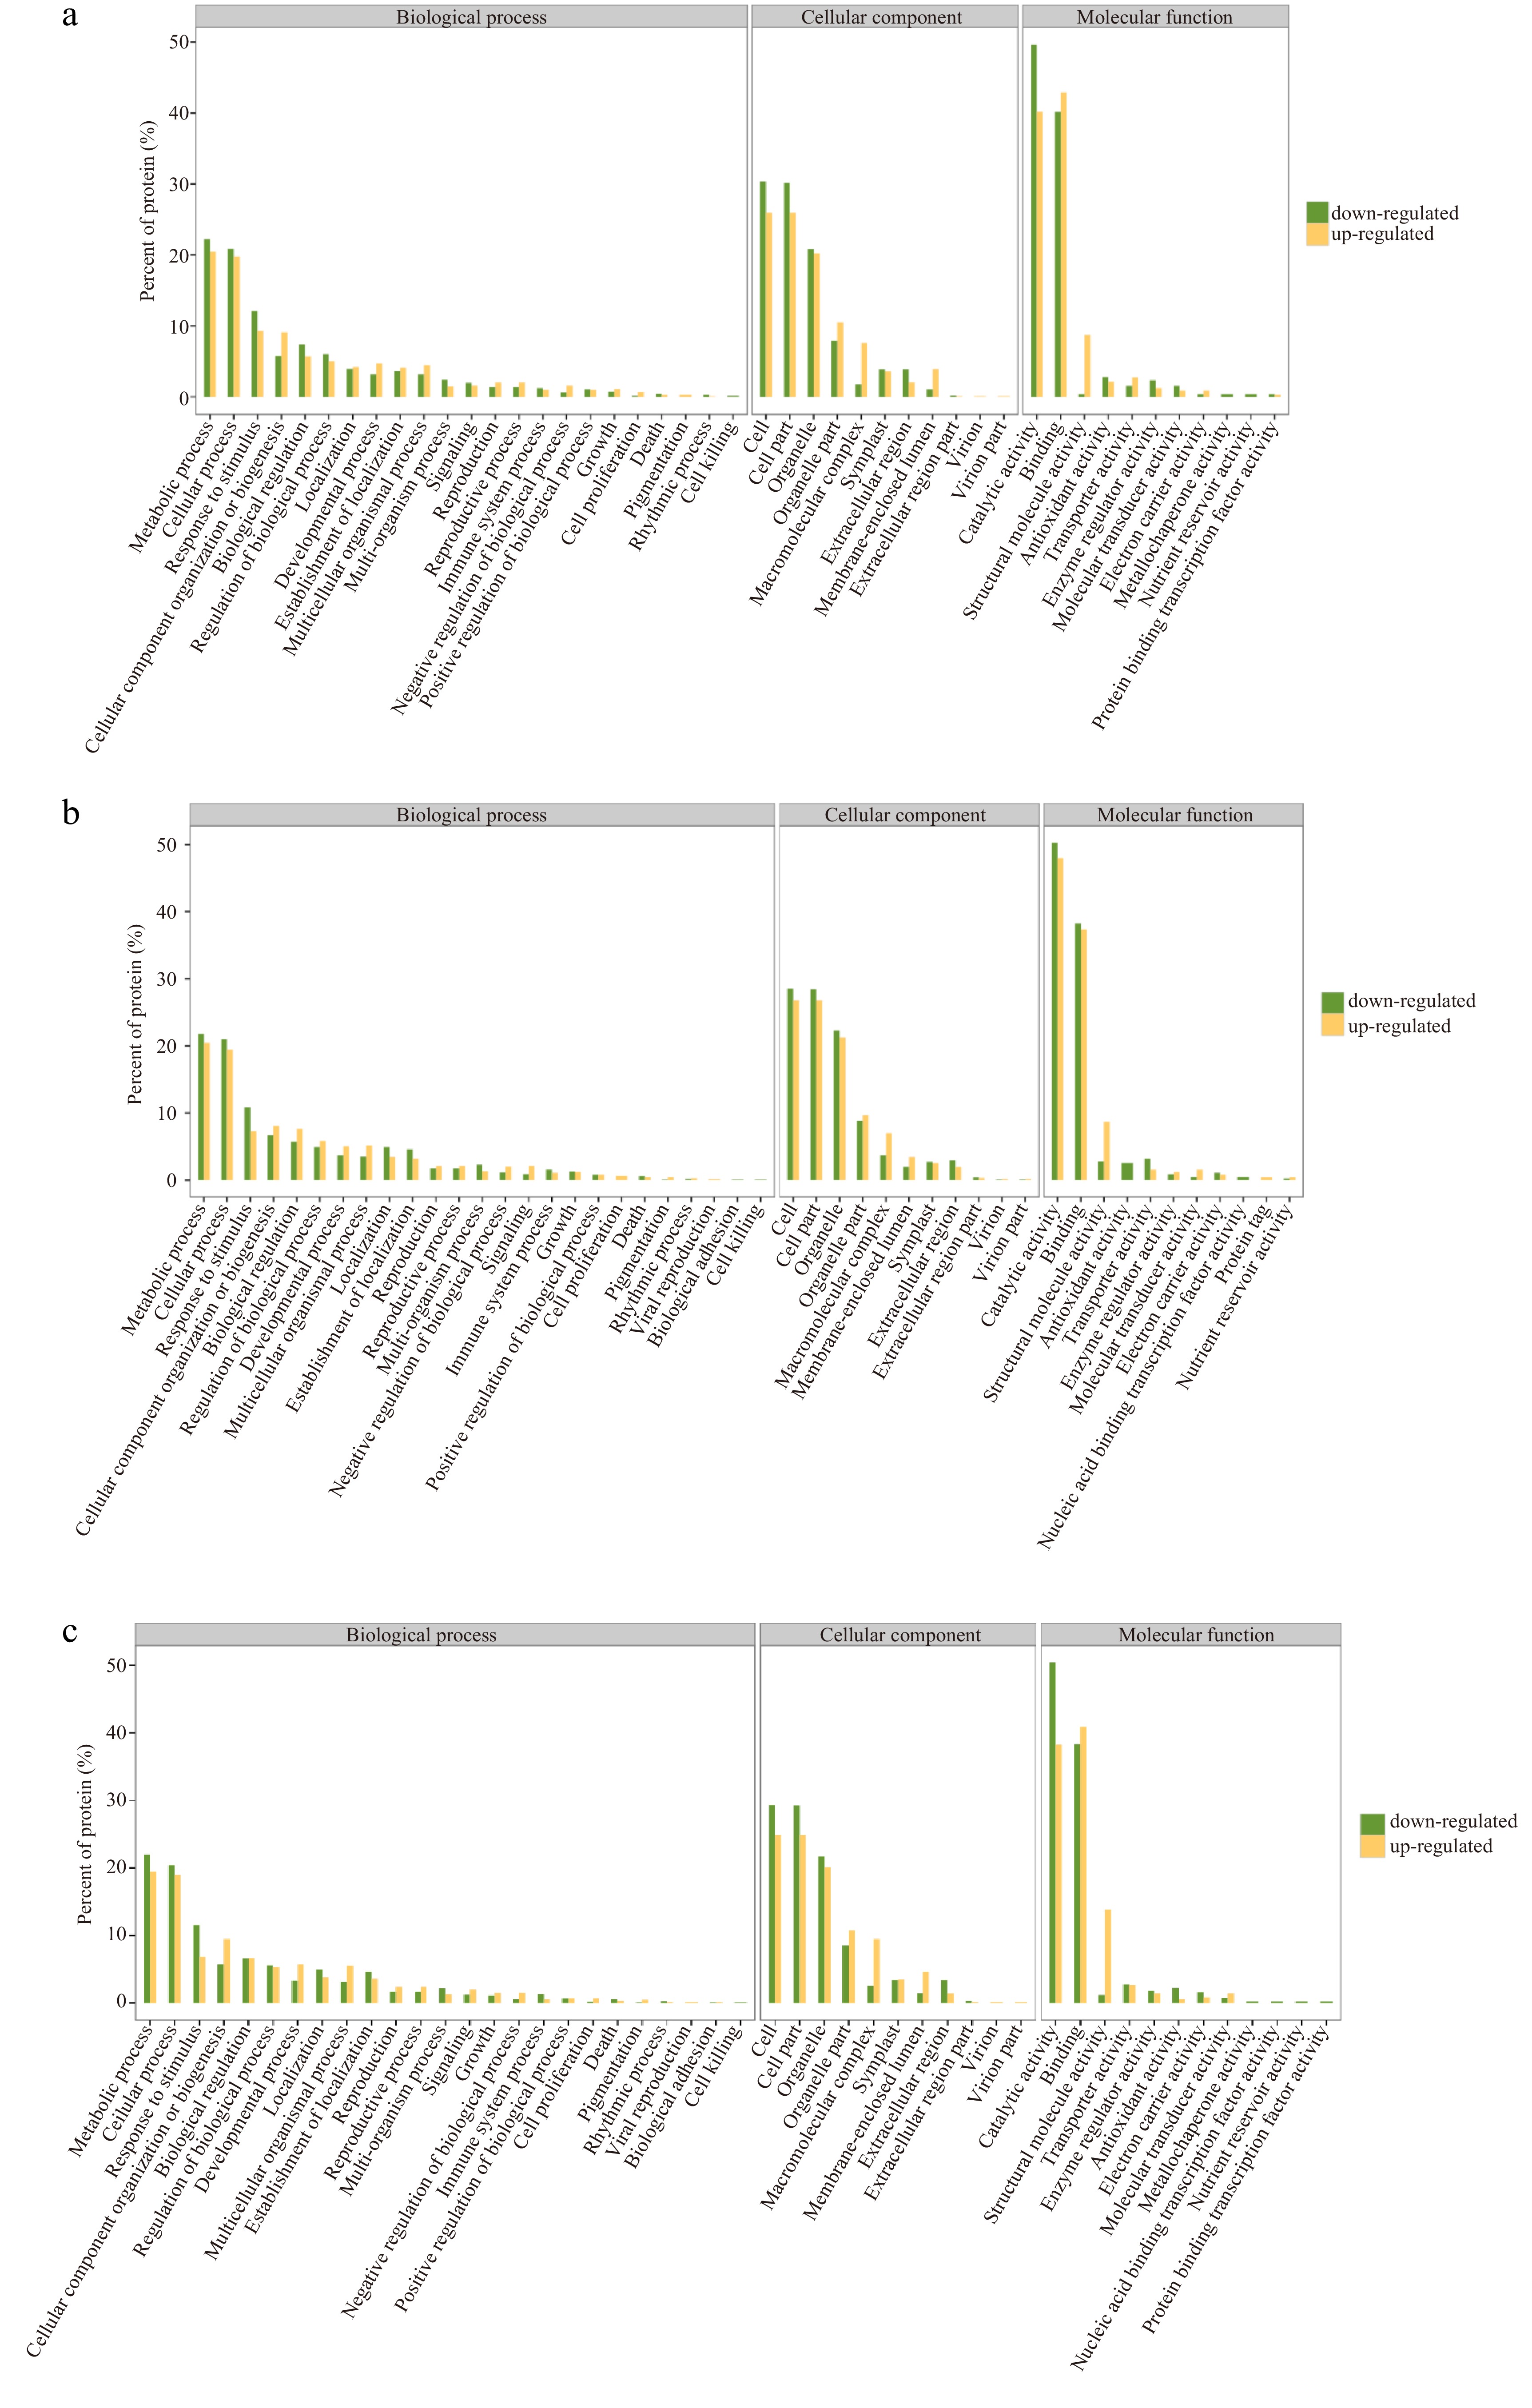
Figure 4.
GO enrichment diagrams of down-regulated and down-regulated DEPs in three comparisons. (a) Comparison of 15 d vs 0 d, (b) Comparison of 30 d vs 15 d, (c) Comparison of 30 d vs 0 d.
-
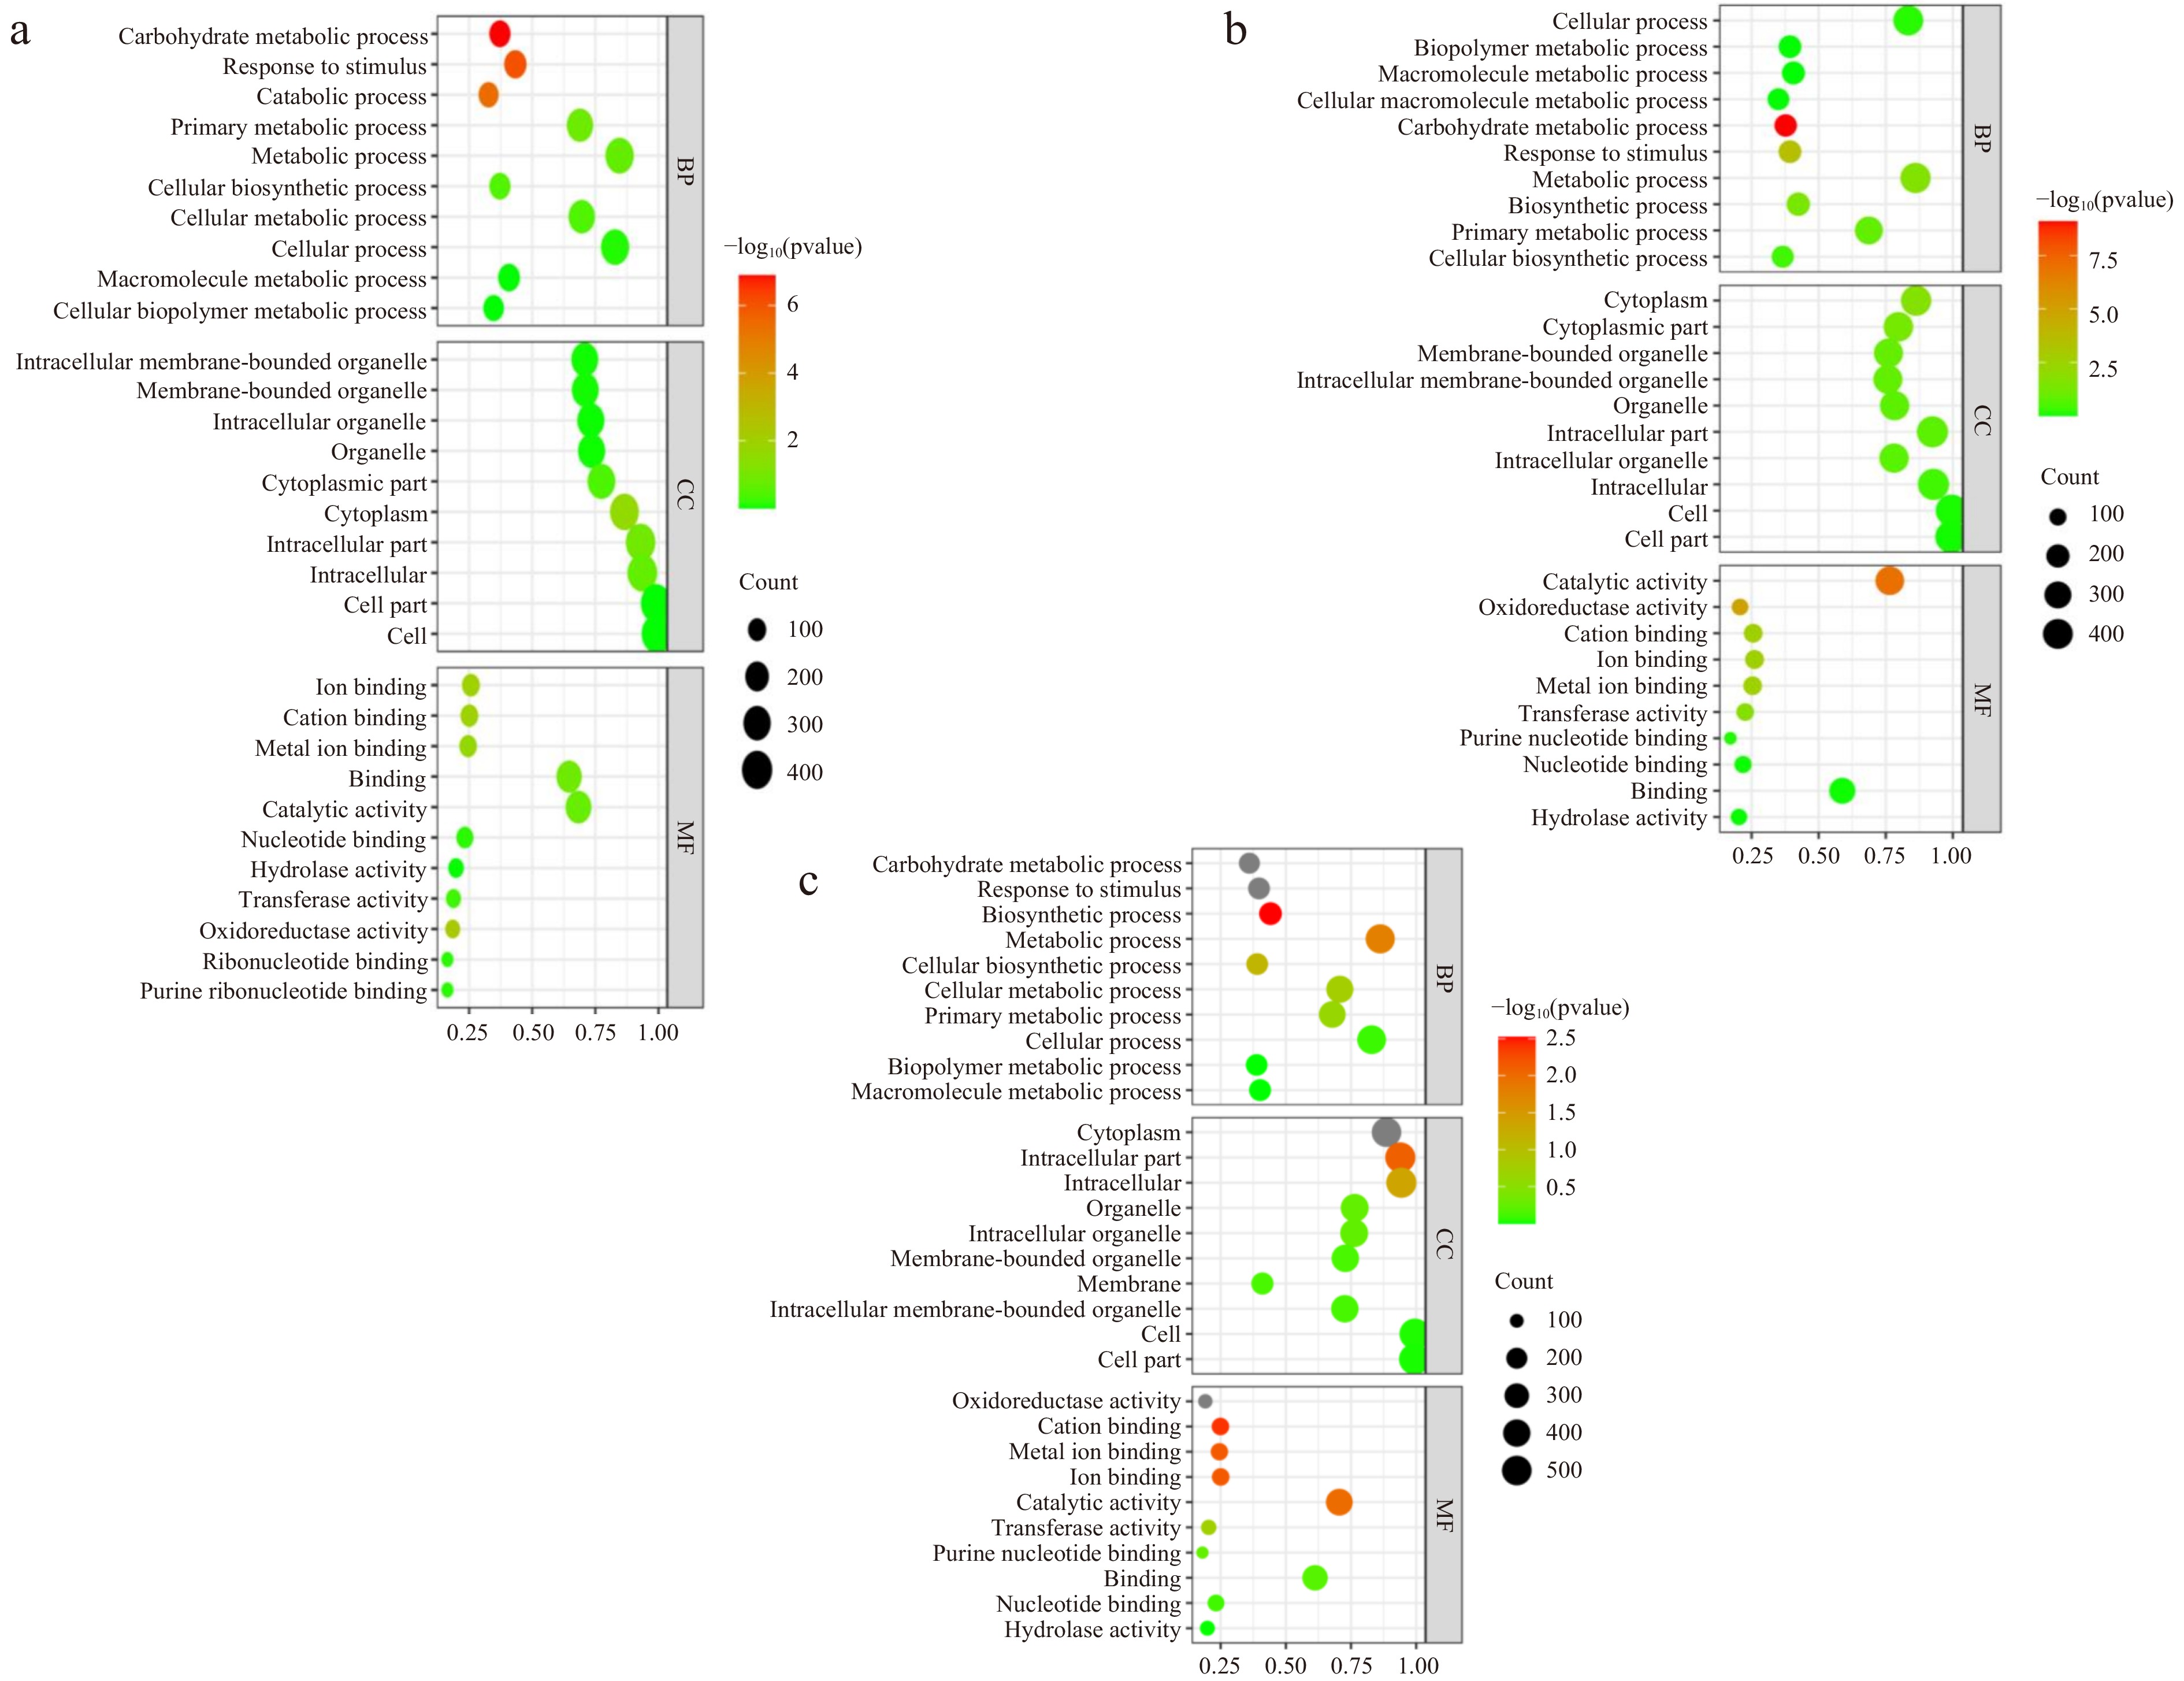
Figure 5.
GO pathway enrichment bubble charts. (a), (b) and (c) represent the GO pathway name for DEPs in 15 d vs 0 d, 30 d vs 15 d and 30 d vs 0 d, respectively. The size of the bubble indicates the number of DEPs annotated on a GO term. The color represents the enriched p-value.
-
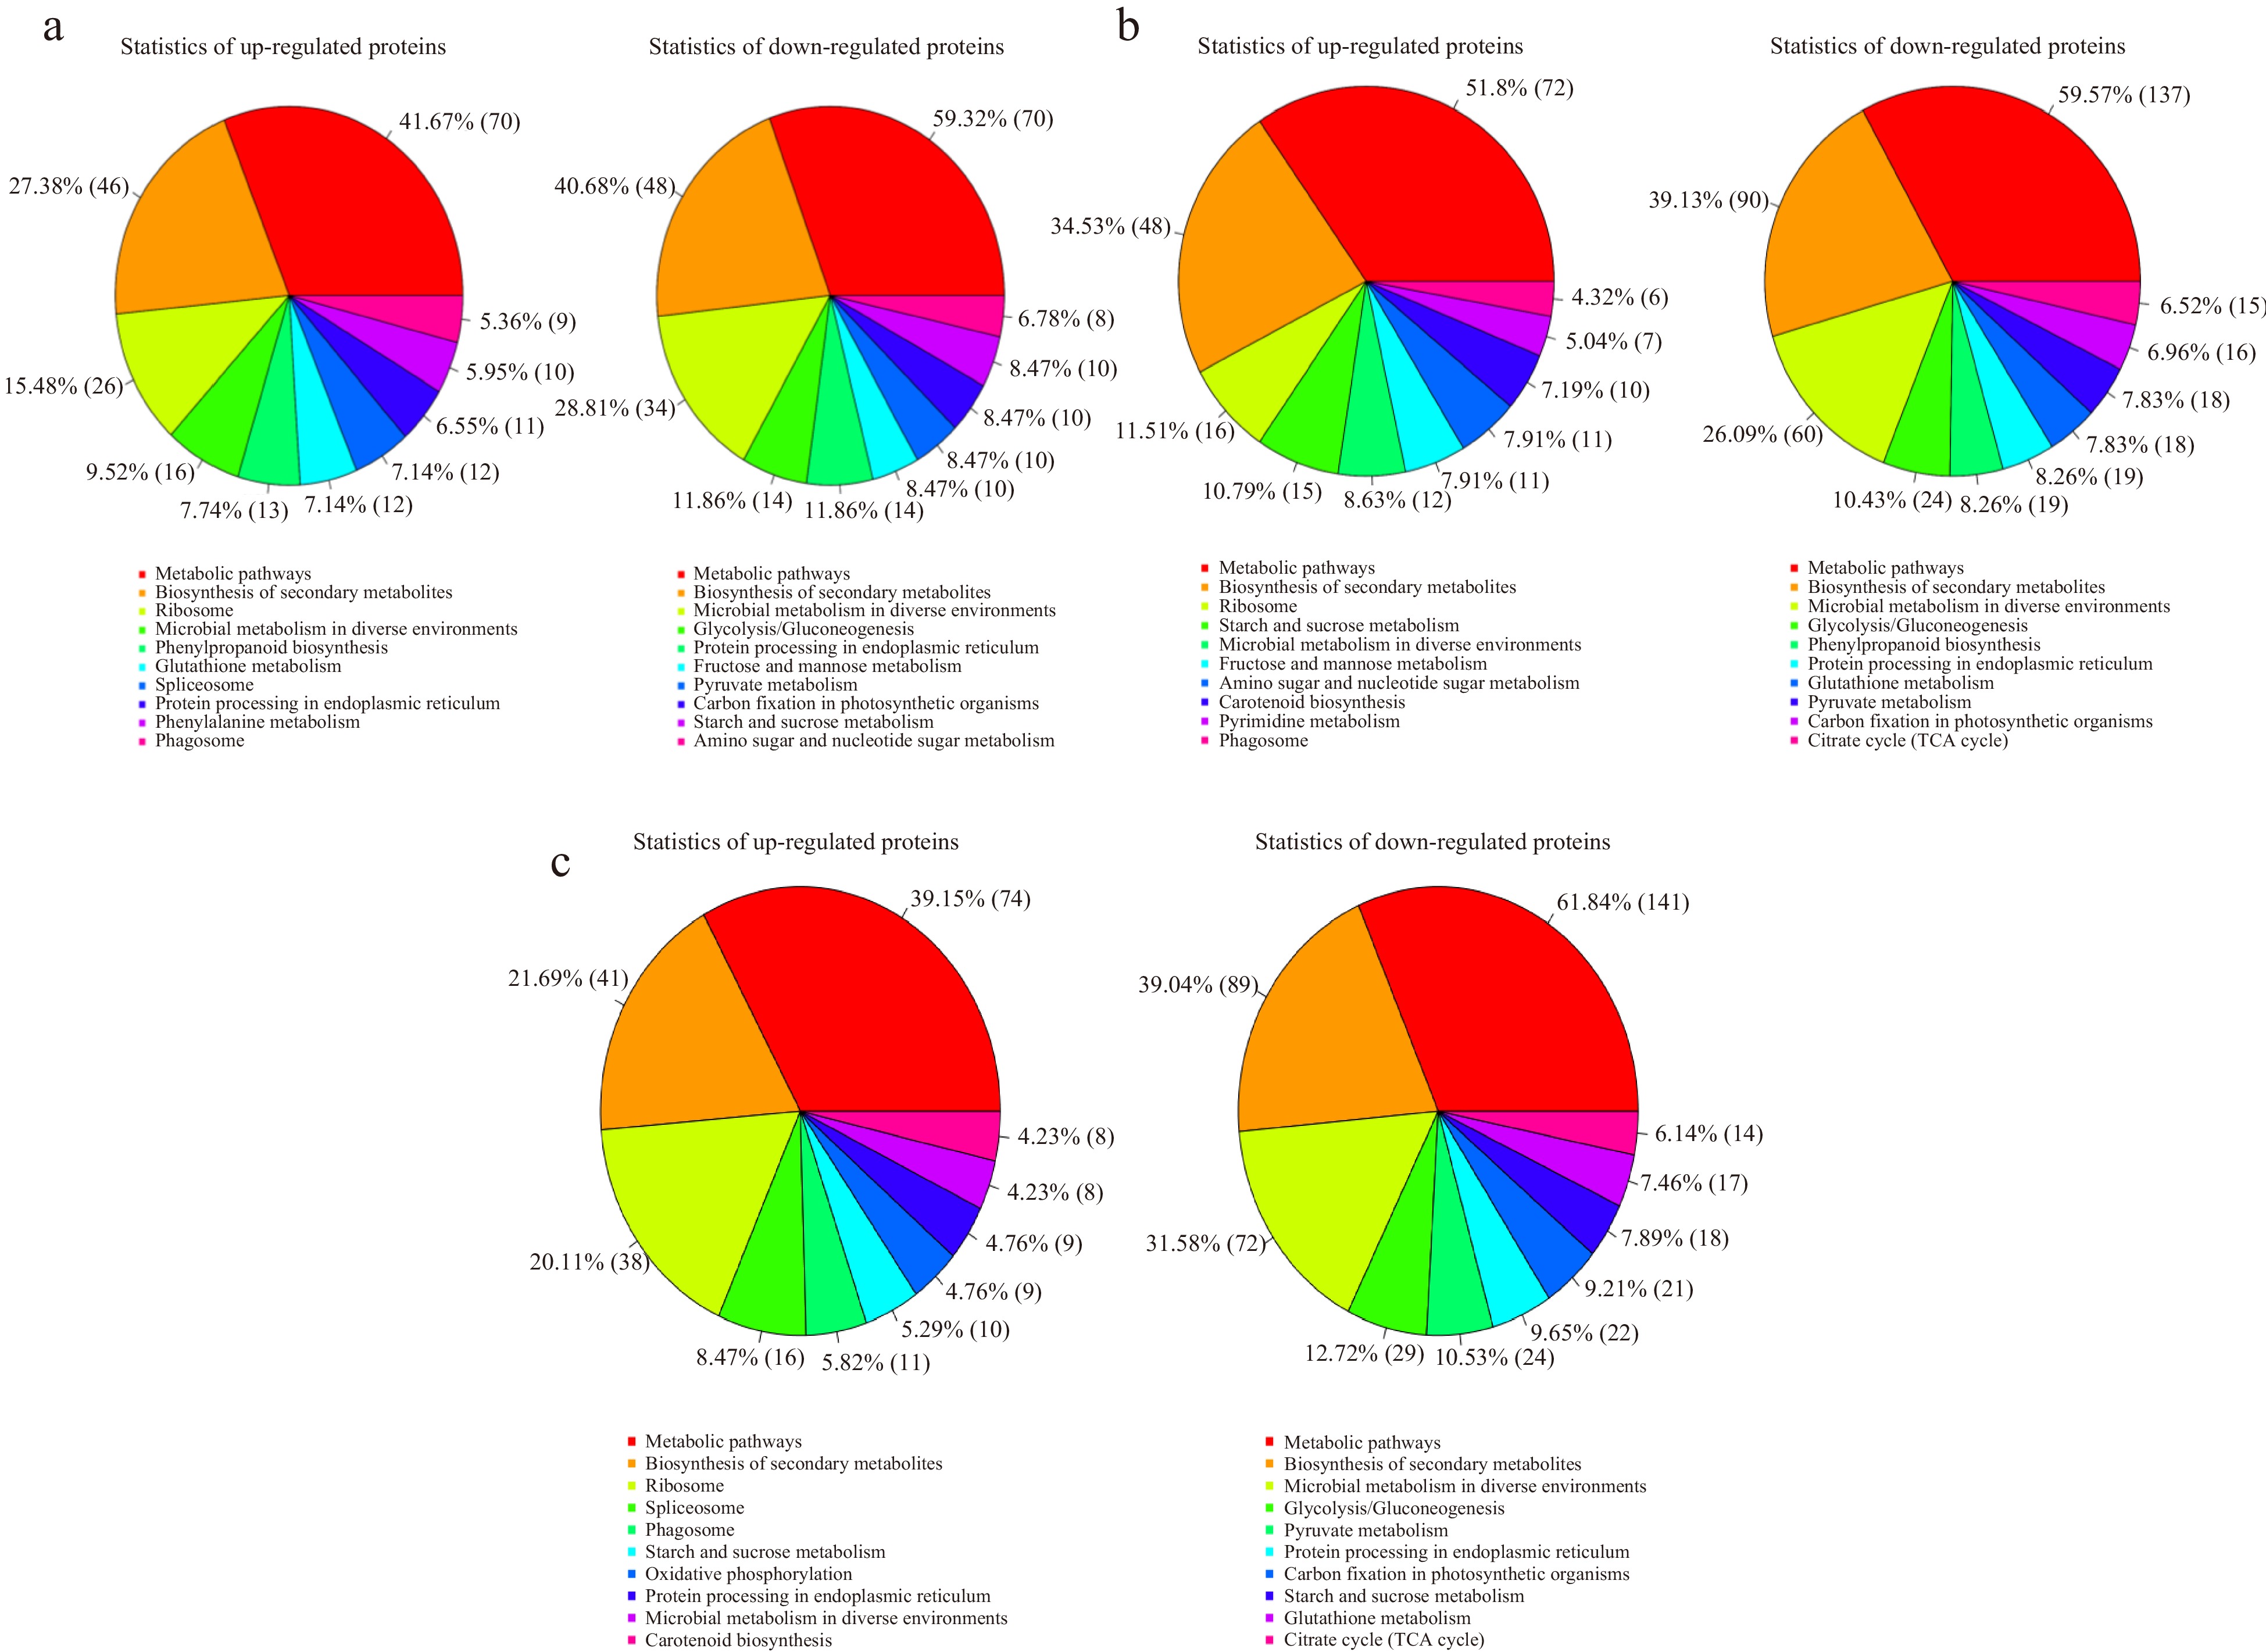
Figure 6.
Statistical chart of up-regulated and down-regulated proteins enriched pathway results in the three comparisons. (a), (b) and (c) represent the comparison of 15 d vs 0 d, 30 d vs 15 d and 30 d vs 0 d, respectively.
-
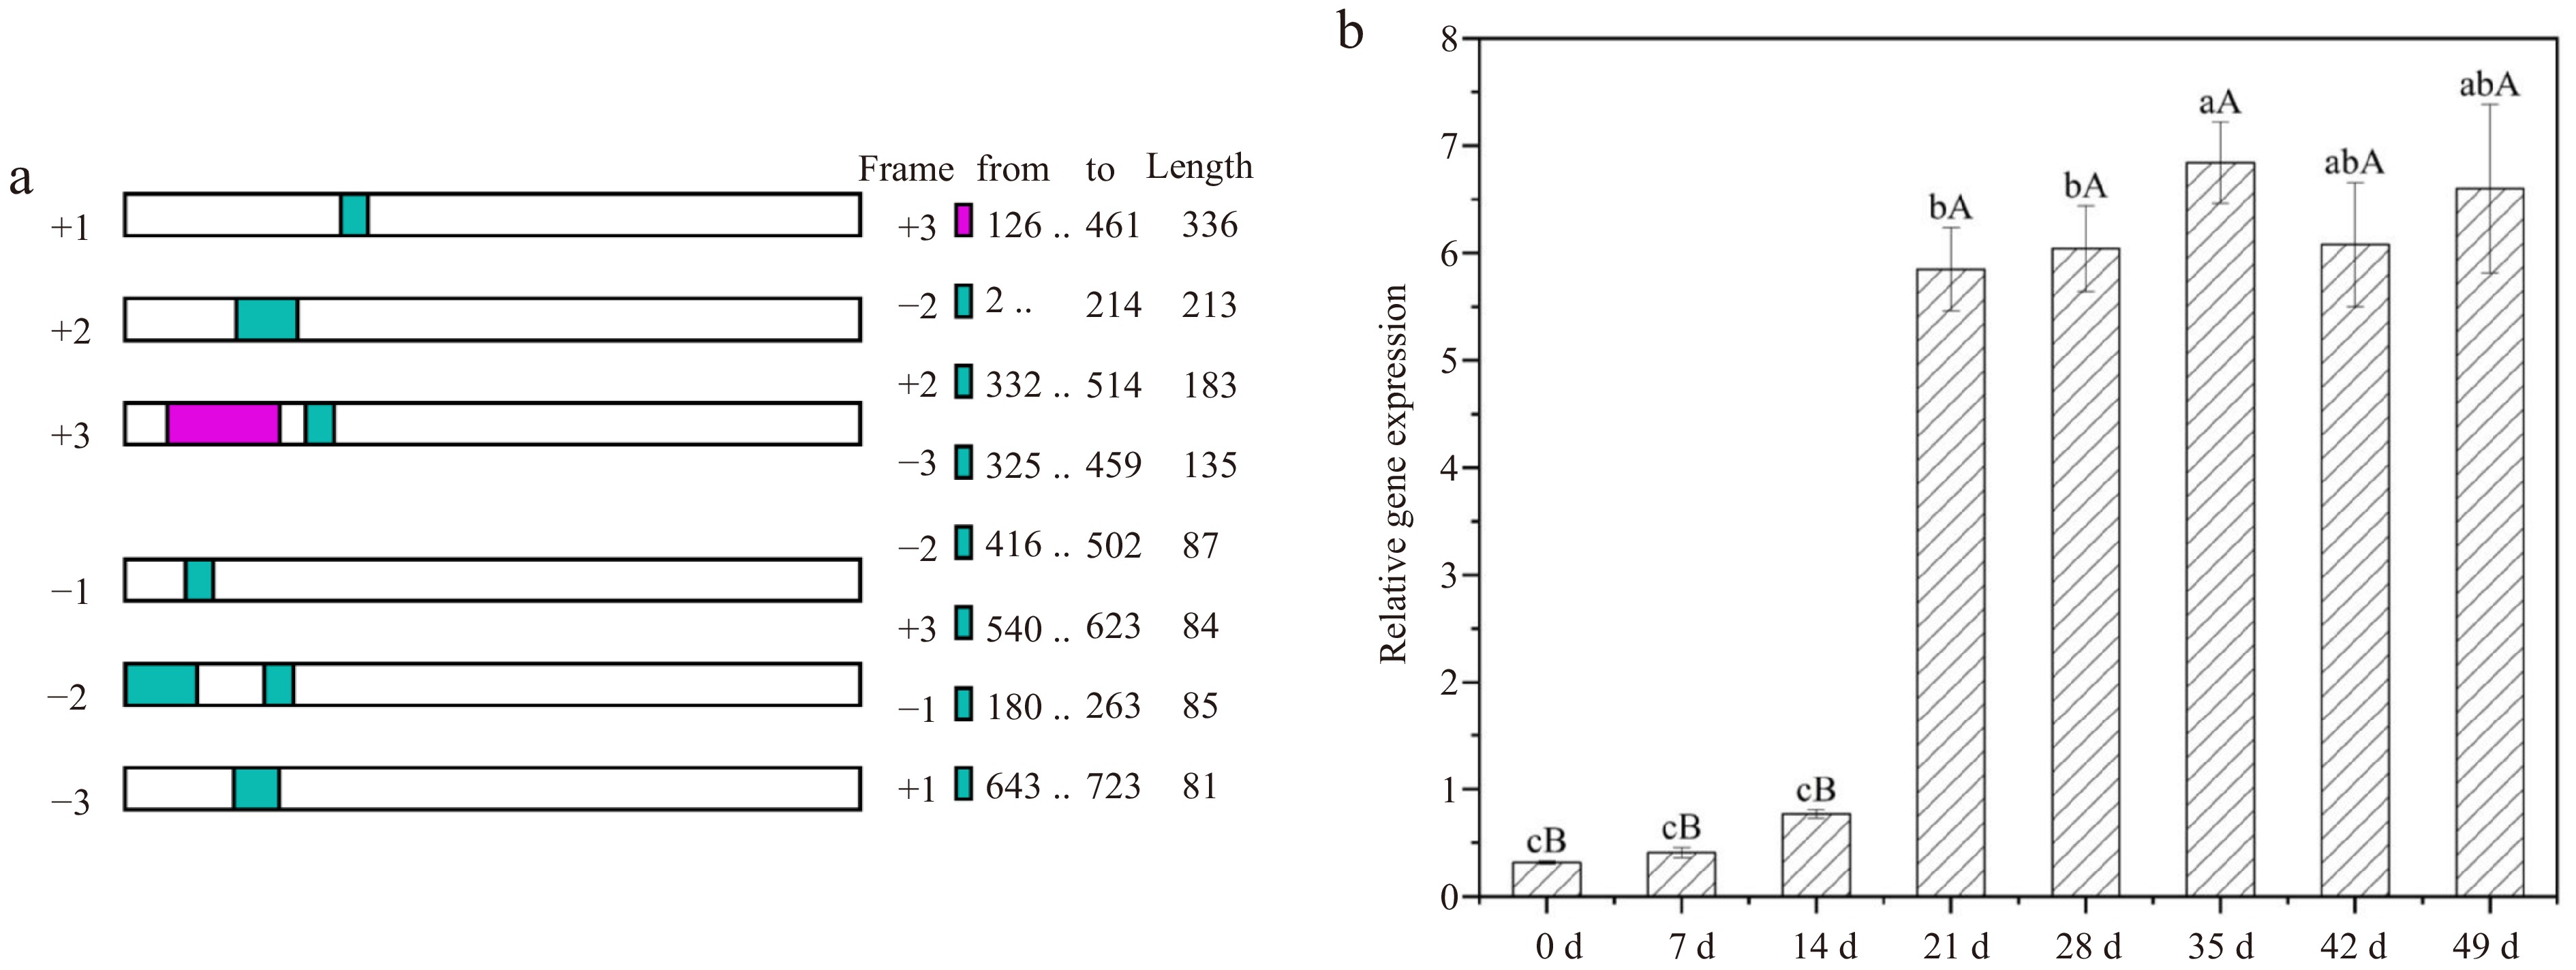
Figure 7.
NCBI ORF finder result and gene expression changes of LdGASA at different development stages of lily bulblets by real-time PCR. The values are the mean ± SD of three independent biological replicates, and lowercase and uppercase letters indicate statistically significant differences at p < 0.05 and p < 0.01 respectively as determined by Duncan's test.
-
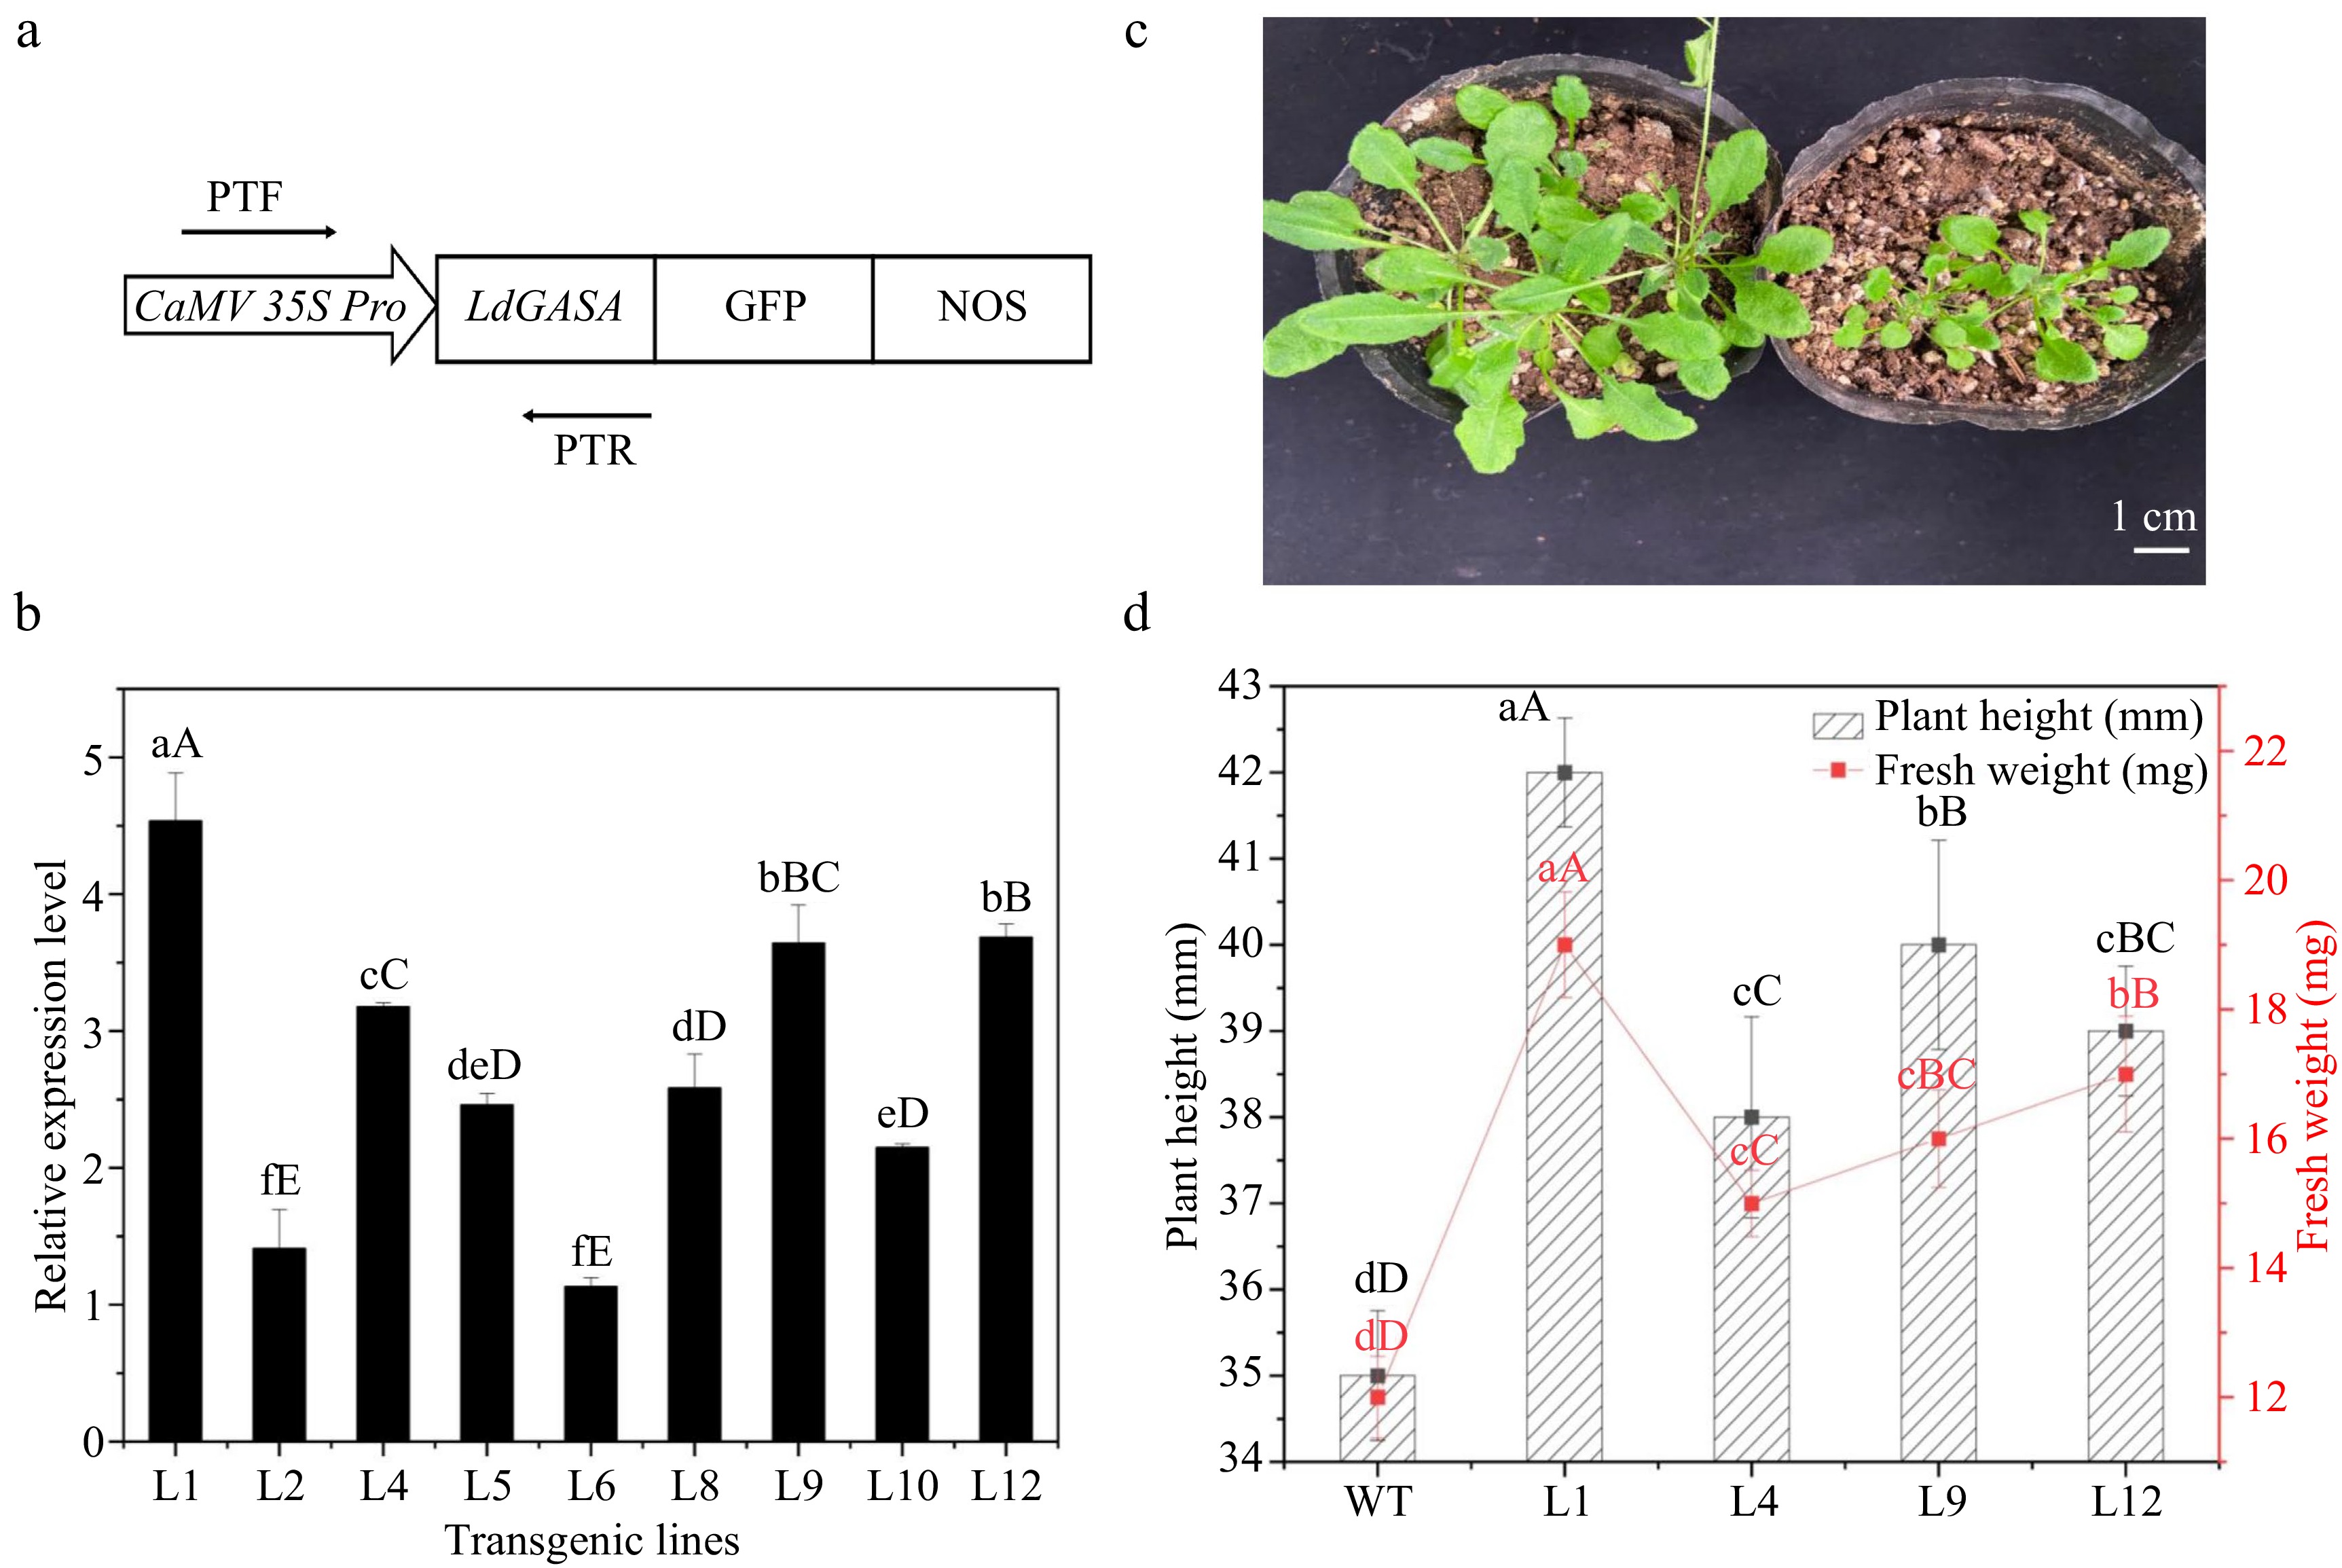
Figure 8.
Overexpression of LdGASA in transgenic Arabidopsis thaliana. (a) The LdGASA CDS was driven by the enhanced CaMV35S promoter. PTF/PTR used for identification of LdGASA in plants. (b) Quantitative RT-PCR analysis of LdGASA transcript levels in corresponding transgenic Arabidopsis leaves. The expression levels were indicated as that of WT as control. The values are the mean ± SD of three independent biological replicates normalized against the reference gene Actin. Lowercase and uppercase letters indicate statistically significant differences at p < 0.05 and p < 0.01 respectively as determined by Duncan's test. (c) The whole plants at 3 weeks old. Scales bars 1 cm. (d) The height and fresh weight of seedling at 3 weeks old. Plant height and fresh weight were determined based on six replicates for each genotype. Vertical bars represent mean ± SD. Lowercase and uppercase letters indicate statistically significant differences at p < 0.05 and p < 0.01 respectively as determined by Duncan's test.
Figures
(8)
Tables
(0)