


-
Lilium davidii var. unicolor is an important mutation of L. davidii Duchartre, listed in the geographical indications of Central Europe. It is the only edible sweet lily in China[1,2]. Modern research has shown that Lilium davidii var. unicolor has high edible, medicinal, health and aesthetic value, and has further application potential[3]. With scales rich in nutrition and polysaccharides, bioactive substances and various vitamins, Lilium davidii var. unicolor is highly valuable for a variety of applications in the realms of food, nutrition, and medicine, and ranks first among edible lilies[4,5]. Lilium davidii var. unicolor has been regarded as both a vegetable and a herbal medicine for several centuries. Due to the high commercial potential, numerous commercial bulbs of high quality are needed to meet the increasing demand.
Reproduction of the Lilium can be accomplished by different approaches, including scale cuttings, bulbs, seed reproduction and tissue culture[6]. No matter which way, the bulblet is one of the most important organs for Lilium growth and development[7]. It is of critical importance to understand the regulatory mechanism of bulblet formation and development for improving the reproductive efficiency of Lilium. Lilium bulblets formation and development has been studied in recent years. Bulb growth and development are connected with carbohydrate metabolism specifically starch and sucrose metabolism. The whole growth and development process of Lilium davidii var. unicolor is actually the accumulation process of starch[8]. The internal storage of starch and sucrose plays a vital role in bulblet growth in vitro[9]. Starch synthesis and accumulation likely promoted the initiation of upper bulbils (an aerial form of Lilium bulblet) in triploid L. lancifolium[10]. Besides, plant hormone signaling exhibits complex regulation during bulbil formation[10]. It is widely known that the formation and development of bulblets in lilies is a complex biological process which is key in their micropropagation. However, the underlying mechanism especially the proteomic process remains elusive.
In the post-genomic era, various types of omics have become the focus of bioinformatics with extreme importance. Rapid advancement in the microarray, next-generation sequencing, and mass spectrometry- (MS-) based technologies has enabled high throughput analyses of transcriptomes, proteomes, and metabolomes, serving as powerful tools for obtaining large-scale information on transcripts, proteins, and metabolites. Transcriptome has already been used in studying the molecular regularity mechanism of lily bulblet formation[10−12]. The results have validated the essentiality of carbohydrate metabolism. Typically, proteins are directly related to biological function. Study of biological processes at the protein level provides more realistic information because the proteins, but not the mRNAs, are functional and posttranslational processes result in the production of different protein isoforms[13]. However, the studies analyzing differential expression of proteins (DEPs) of Lilium bulblets are scarce, the proteomics changes in Lilium bulblets development remain unclear. The metabolic pathways identified by comparing the DEPs associated with the formation and development of Lilium bulblets in the present study would aid the exploration of the mechanism of relative hyperaccumulation. Compared with two-dimensional electrophoresis and LC MS/MS, iTRAQ labelling technology presents unique advantages and has been developed by AB SCIEX in the United States for the determination of DEPs. The method presents several advantages, such as allowing simultaneous comparison of protein profiles in multiple samples, providing information on peptide quantitation and identification, and being a relatively high-throughput process, good quantitative effect, high repeatability, and improved reliability in determining DEPs among various available proteomic technologies[14−17]. The current study will provide novel insights into the molecular basis of lily bulblet formation, lay a theoretical foundation for lily bulblet formation, and help to fill these gaps in our knowledge.
In this study, iTRAQ labelling technology was used to analyze the dynamic changes of proteins in bulblets formation and development. These changes and an overall proteomic analysis were initiated to explore the potential pathways and genes of bulblets formation and development. Our results set the theoretical foundation and provides the molecular basis for the future improvement of bulb quality.
-
Lilium davidii var. unicolor, grown at the horticultural research base of Liaoning Academy of Agricultural Science, China, was used for the experiments.
Healthy external scales without any damage were carefully removed from the base of mother bulbs, washed in running water to remove dirt, surface sterilized by immersing in 0.01% potassium permanganate solution for 20 min, and then washed with distilled water three times using an in-house protocol. After surface sterilization, scales (three biological replicates, 150 scales in each) were embedded concave upward ex vitro into pre-sterilized (180 °C for 5 h) wet peat substrate (XinYuan Gardening Resources Ltd., Liaoning, China) with 60% relative humidity. Propagules were placed into perforated plastic baskets (60 cm × 90 cm) and then incubated at 25 °C under a photosynthetic photon flux (PPFD) of 50 μmol·m−2·s−1. The propagation of bulblets was investigated for 49 d after embedding in peat when the bulblets formed a definite shape (bulbous) and size (2 cm circumference with 5−7 scales). To construct the iTRAQ library, samples were collected at 0 and 15 d (appearance of bulblets), and 30 d (bulblets formed a basic shape with 3−4 scales). For quantitative real-time PCR, mother scales and bulblets were randomly collected at 0, 7, 21, 28, 35, 42, and 49 d. Using 15 samples from triplicate treatments constituted three biological replicates for experiments. Samples were flash frozen in liquid nitrogen and stored at −80 °C until use.
Total protein extraction and peptide preparation
-
Lilium bulblet tissue samples of each stage were ground into powder in liquid nitrogen and extracted with Lysis buffer (7 M urea, 2 M Thiourea, 4% SDS, 1 mM PMSF, 2 mM EDTA, 40 mM Tris-HCl [pH 8.5]), 10 mM DTT was added after incubating on ice for 5 min. The lysate was centrifuged at 13,000 g for 20 min at 4 °C. The supernatant was transferred into a new centrifuge tube. Four volumes of cold acetone were added to the centrifuge tube and placed overnight at −20 °C. Protein precipitates were collected by centrifugation and dried in air. Eight M urea/100 mM TEAB (pH 8.0) solution was added to dissolve the protein, and DTT was added to the final concentration of 10 mM, 56 °C water bath for 30 min. Subsequently, IAM was added to the final concentration of 55 mM and subsequently alkylated for 30 min at room temperature in the dark. Protein concentration was determined by the Bradford protein assay. The supernatant from each sample containing precisely 0.1 mg of protein was digested with Trypsin Gold (Promega, Madison, USA) at a 1:50 enzyme-to-substrate ratio. After 16 h of digestion at 37 °C, peptides were desalted with an XBridge Peptide BEH C18 cartridge to remove the urea, and desalted peptides were dried by vacuum centrifugation[18].
iTRAQ labeling of peptides and HPLC fractionation
-
Desalted peptides were labeled with iTRAQ reagents (iTRAQ® Reagent-8PLEX Multiplex Kit, Sigma, St. Louis, MO, USA) following the manufacture's protocols. The iTRAQ-labeled peptide mix was fractionated using a C18 column (Waters BEH C18 4.6 mm × 250 mm, 5 μm) on a Ultimate 3000 HPLC operating at 1 mL·min−1. Mobile phases A (2% acetonitrile, 0.1% formic acid, 98% H2O) and B (98% acetonitrile, 0.1% formic acid, 2% H2O) were used to develop an elution gradient. The first-order mass spectra was scanned by the ion accumulation time of 250 ms, and the secondary mass spectra of 30 precursor ions were collected by the ion accumulation time of 50 ms. The MS1 spectrum was collected in the range of 350−1,500 m·z−1, and the MS2 spectrum was collected in the range of 100 to 1,500 m·z−1. The dynamic removal time of precursor ions was set to 15 s.
RNA isolation and cDNA preparation
-
Total RNA from lily bulbs was extracted from samples using the RNAprep Pure Plant Plus Kit (Polysaccharides & Polyphenolics-rich) (Tiangen, Beijing, China) according to the manufacturer's protocol, and the RNA samples were digested with DNase I (Tiangen) to remove genomic DNA. First-strand cDNA was synthesized from 1 μg of DNase I-treated RNA using anchored-oligo (dT)s primers according to the manufacturer's instructions (Promega). The cDNA was diluted five-fold and used for real-time quantitative PCR.
Total RNA from Arabidopsis plants leaves was isolated by the RNeasy RNA isolation kit (Magen, Guangzhou, China) according to the manufacturer's instructions. First-strand cDNA was synthesized using an M-MLV kit (TaKaRa).
Cloning and sequence identification of the LdGASA
-
mRNA was purified through oligotex chromatography (Clontech, California, USA) from total RNA and 3'-RACE and 5'-RACE were performed using a SMART-RACE cDNA amplification kit (Clontech) according to the manufacturer's protocol. Gene-specific primers used for PCR are shown in Supplemental Table S1. PCR was performed according to the manufacturer's protocol (Clontech). PCR conditions were 94 °C for 4 min, followed by 30 cycles of 94 °C for 30 s, 59/60 °C for 30 s and 72 °C for 1 min, and finally 72 °C for 5 min. PCR products were separated by 1% agarose gel electrophoresis, and subcloned into the pMD18-T vector (TaKaRa) and sequenced.
Quantitative RT-PCR analysis
-
Gene expression were analyzed by real-time quantitative PCR using the fluorescent intercalating dye SYBR-Green in a detection system (CWBIO, Beijing, China) as described previously[12]. A lily Glyceraldehyde-3-phosphate dehydrogenase gene (GAPDH, access number in GenBank: gb|KP179417.1|) was used as a standard control in qRT-PCR reactions. RT-PCR data are mean values and standard deviations (bar) of three independent experiments with three biological replicates. All primers used are listed in Supplemental Table S1.
Construction of LdGASA overexpression vector and Arabidopsis thaliana transformation
-
For the overexpression construct, the coding region of LdGASA was inserted into the pCAMBIA-1300-35S-GFP vector under the control of the Cauliflower mosiac virus (CaMV) 35S promoter. All primers used for constructs are listed in Supplemental Table S1. The binary vector was introduced into A. tumefaciens strain GV3101, and transformed into WT Arabidopsis thaliana by the floral dip transformation method[19]. The transformants were selected on B5 solid medium containing 50 mg·L−1 hygromycin (Sigma), and the surviving seedlings were transplanted into soil and grown in a greenhouse. The T1 seeds were harvested from individual plants and sown again to generate T2 plants. The T2 lines, which showed no segregation for hygromycin resistance, were considered to be homozygous and carried forward to the T3 generation. The presence of the LdGASA gene in transgenic Arabidopsis thaliana was confirmed by PCR using 35S promoter-specific forward primers and the LdGASA specific reverse primer. Transcript levels of the LdGASA gene and AtGASAs in transgenic Arabidopsis thaliana were analyzed by qRT-PCR using gene-specific primers.
Phenotypic analysis of transgenic Arabidopsis thaliana plants
-
Arabidopsis thaliana seeds were first surface sterilized with 75% ethanol for 5 min with shaking, washed with sterilized distilled water, then surface sterilized with 10% sodium hypochlorite (NaClO) for 8 min with shaking, washed with sterilized distilled water eight times and then kept at 4 °C for 3 d to break seed dormancy. The phenotypic experiment was conducted under 21−23 °C, 100 mol·photons·m−2·s−1, 60% relative humidity, 16/8 h day-night cycles.
-
We analyzed the tandem mass spectrometry (MS/MS) data using Proteinpilot™ V4.5 software. iTRAQ analysis of the proteomes of the three development stages of Lilium showed 347,359 spectra, including 111,108 identified spectra, 22,262 identified peptides.
Protein mass, length of identified peptides, and peptide numbers of unique spectra
-
Most of the proteins were 20−30 kDa (19.41%) in protein mass, followed by 10−20 kDa (16.99%), and 30−40 kDa (16.95%), while 4.12% if peptides were < 10 kDa and 4.73% if peptides were > 100 kDa (Fig. 1).
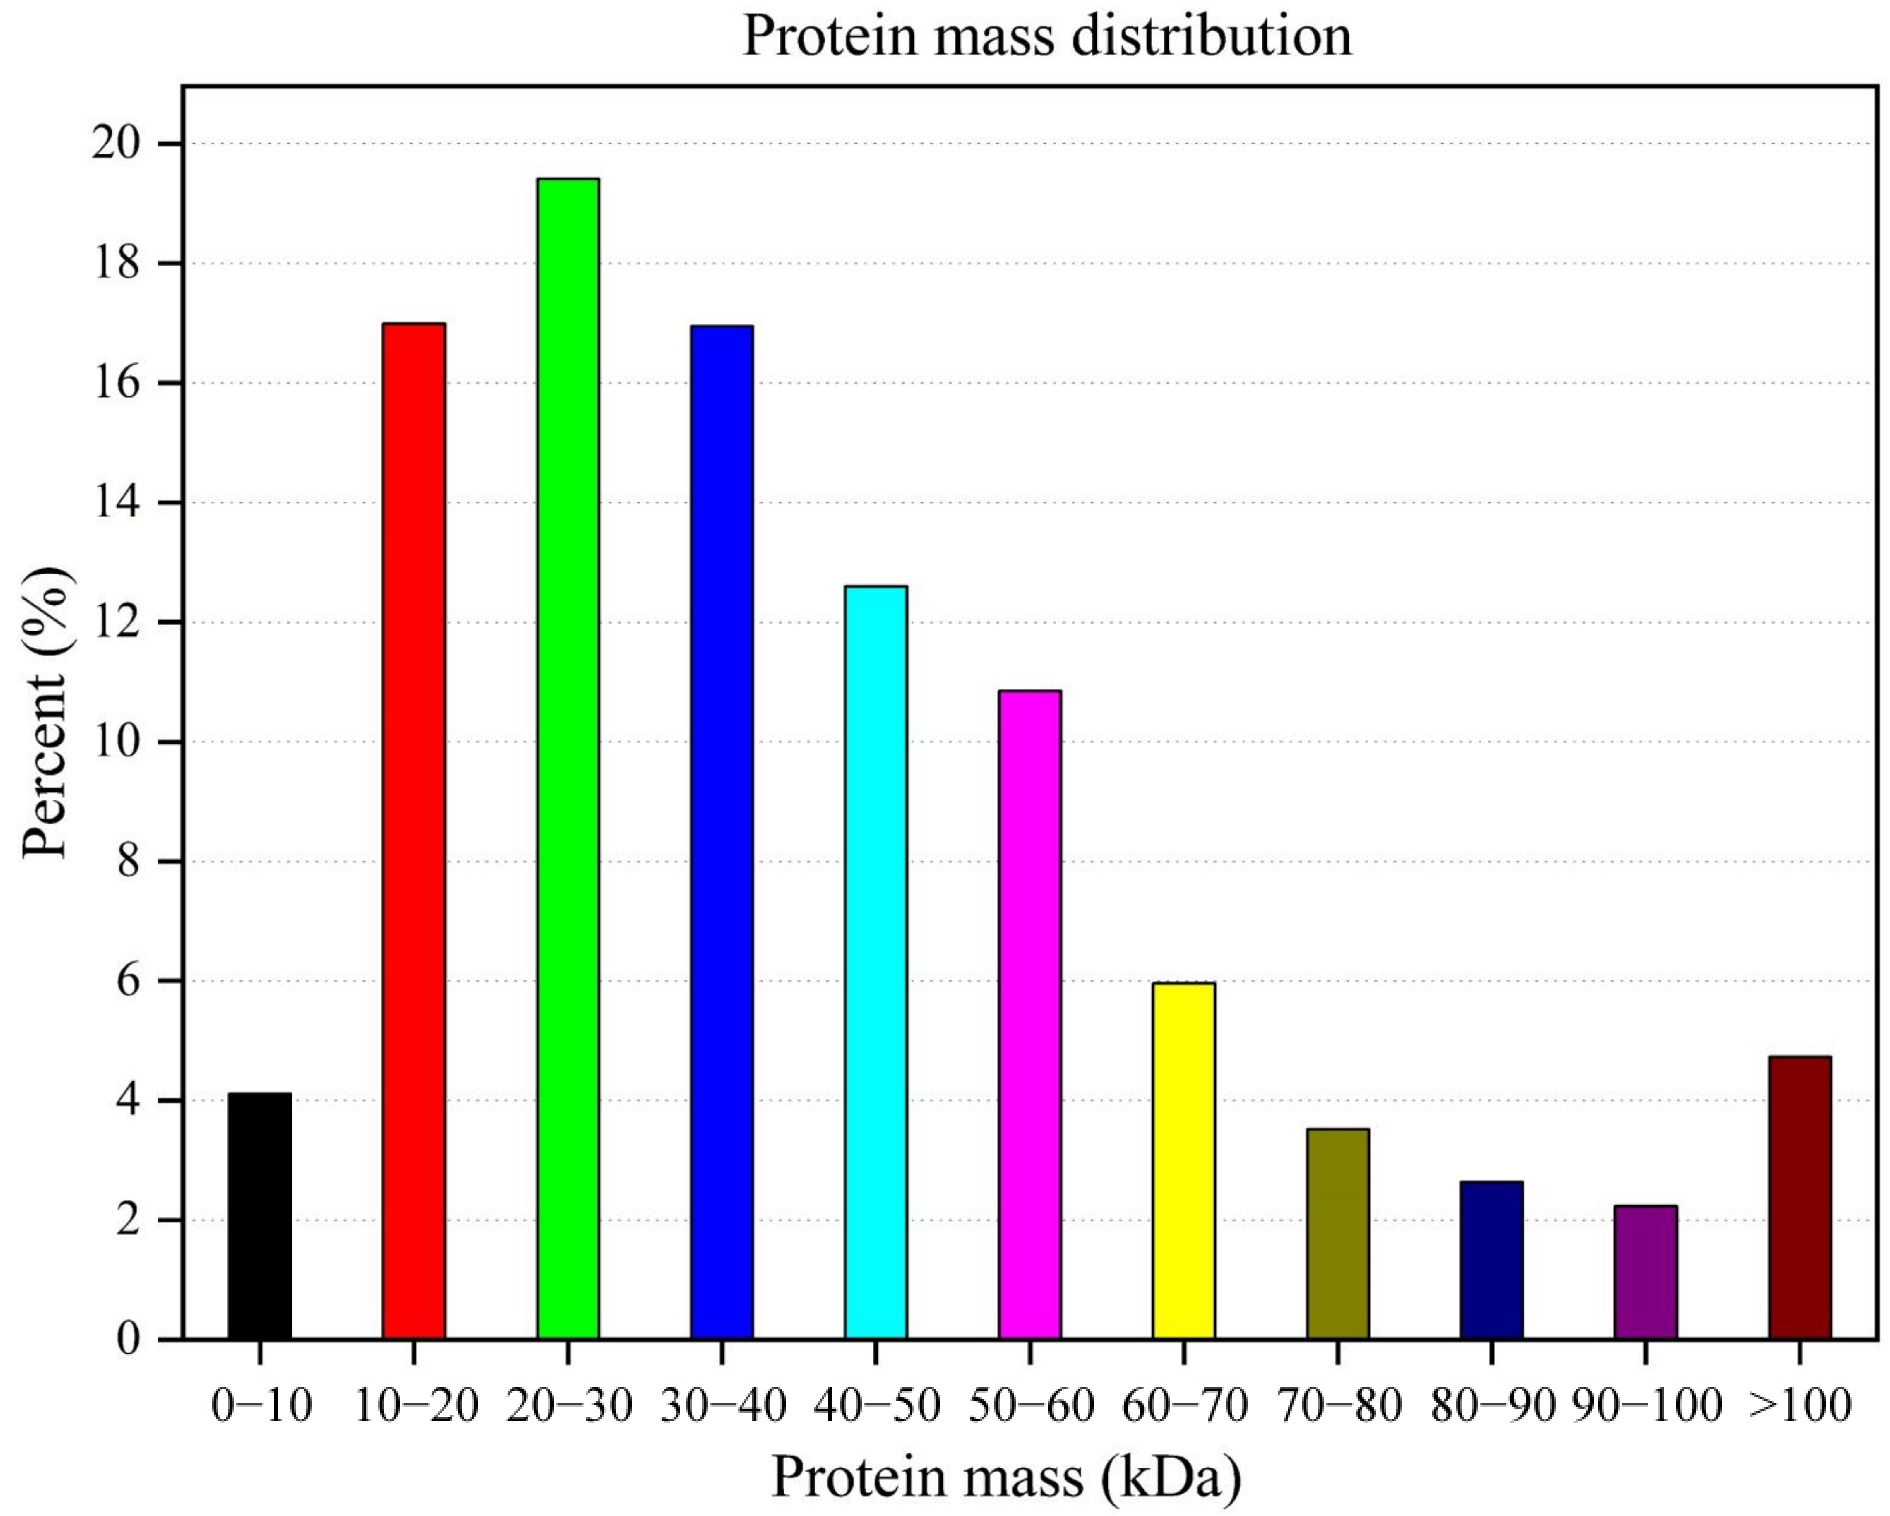
Figure 1.
Protein mass distribution of Lilium davidii var. unicolor peptides.
The lengths of the 4,802 identified proteins ranged from 30−3,000 amino acids (aa). Most were 200−300 aa in length, followed by 100−200 and 300−400 aa, with 90% being 100−1,000 aa in length.
Protein function annotation
-
The Gene Otology (GO) and Clusters of Orthologous Groups (COG) tools were used to provide a structured and controlled vocabulary for describing gene products. GO includes three ontologies: cellular component, biological process, and molecular function. GO terms were assigned to 4,187 proteins based on BLAST matches with proteins with known functions. The matched proteins comprised 51 functional groups. The number of proteins in each GO term ranged from 1 to 3,496. Biological process mainly included metabolic process (3,066, 73.22%), cellular process (3,050, 72.84%), and response to stimulus (1,234, 29.47%) (Fig. 2a); molecular function included catalytic activity (2,146, 51.25%), binding (1,979, 47.27%) and structural molecule activity (225, 5.37%) (Fig. 2b); and cellular component included cell (3,496, 83.50%), cell part (3,493, 83.42%), organelle (2,686, 64.15%), and organelle part (1,285, 30.69%) (Fig. 2c).
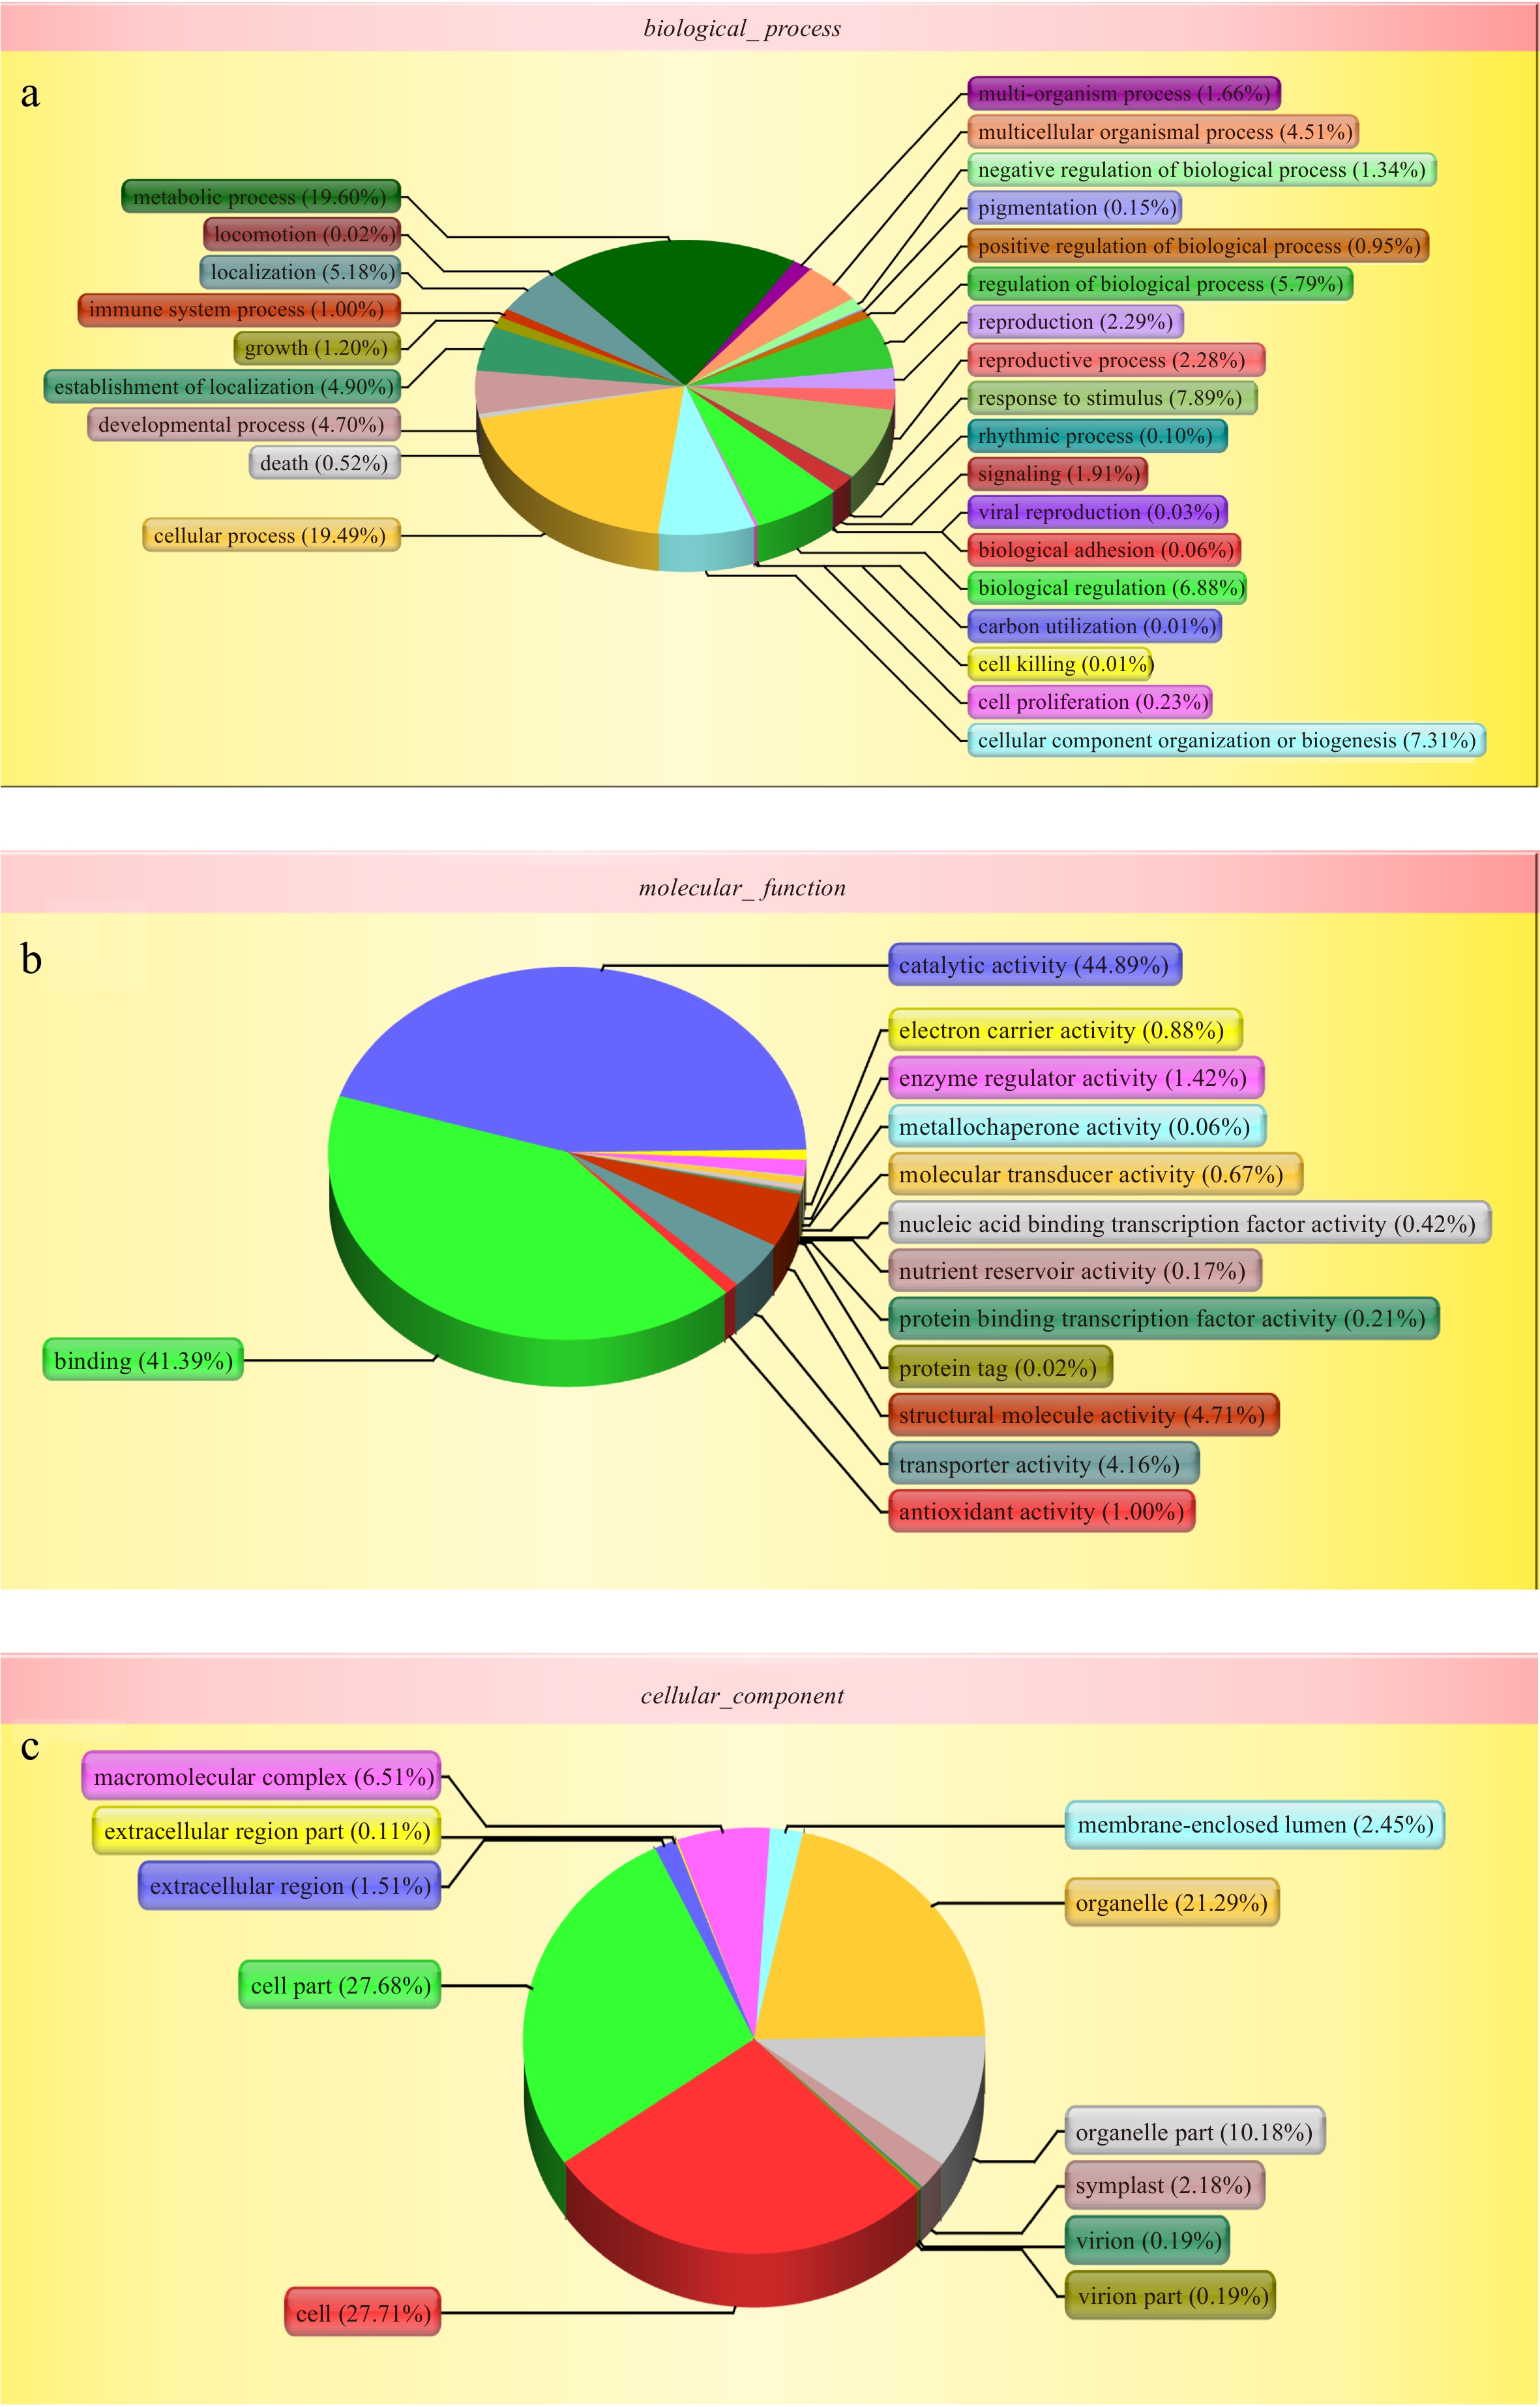
Figure 2.
Gene ontology (GO) analysis of all proteins during the bulblets development indentified by iTRAQ analysis. The left y-axis indicates the percentage of a specific category of genes existed in the main category, whereas the right y-axis indicates the number of a specific category of genes existed in main category. The classification of these proteins in different categories are shown based on (a) biological process, (b) molecular function and (c) cellular component.
COG annotation analysis classified the proteins identified by iTRAQ analysis into 24 categories (Fig. 3), with 3,692 proteins in each category. Among them, the general function prediction represented the largest functional group, including 692 proteins, followed by posttranslational modification, protein turnover, chaperones (422), translation, ribosomal structure and biogenesis (328), and carbohydrate transport and metabolism (273). Defense mechanisms, cell motility, and nuclear structure represented the smallest functional categories.
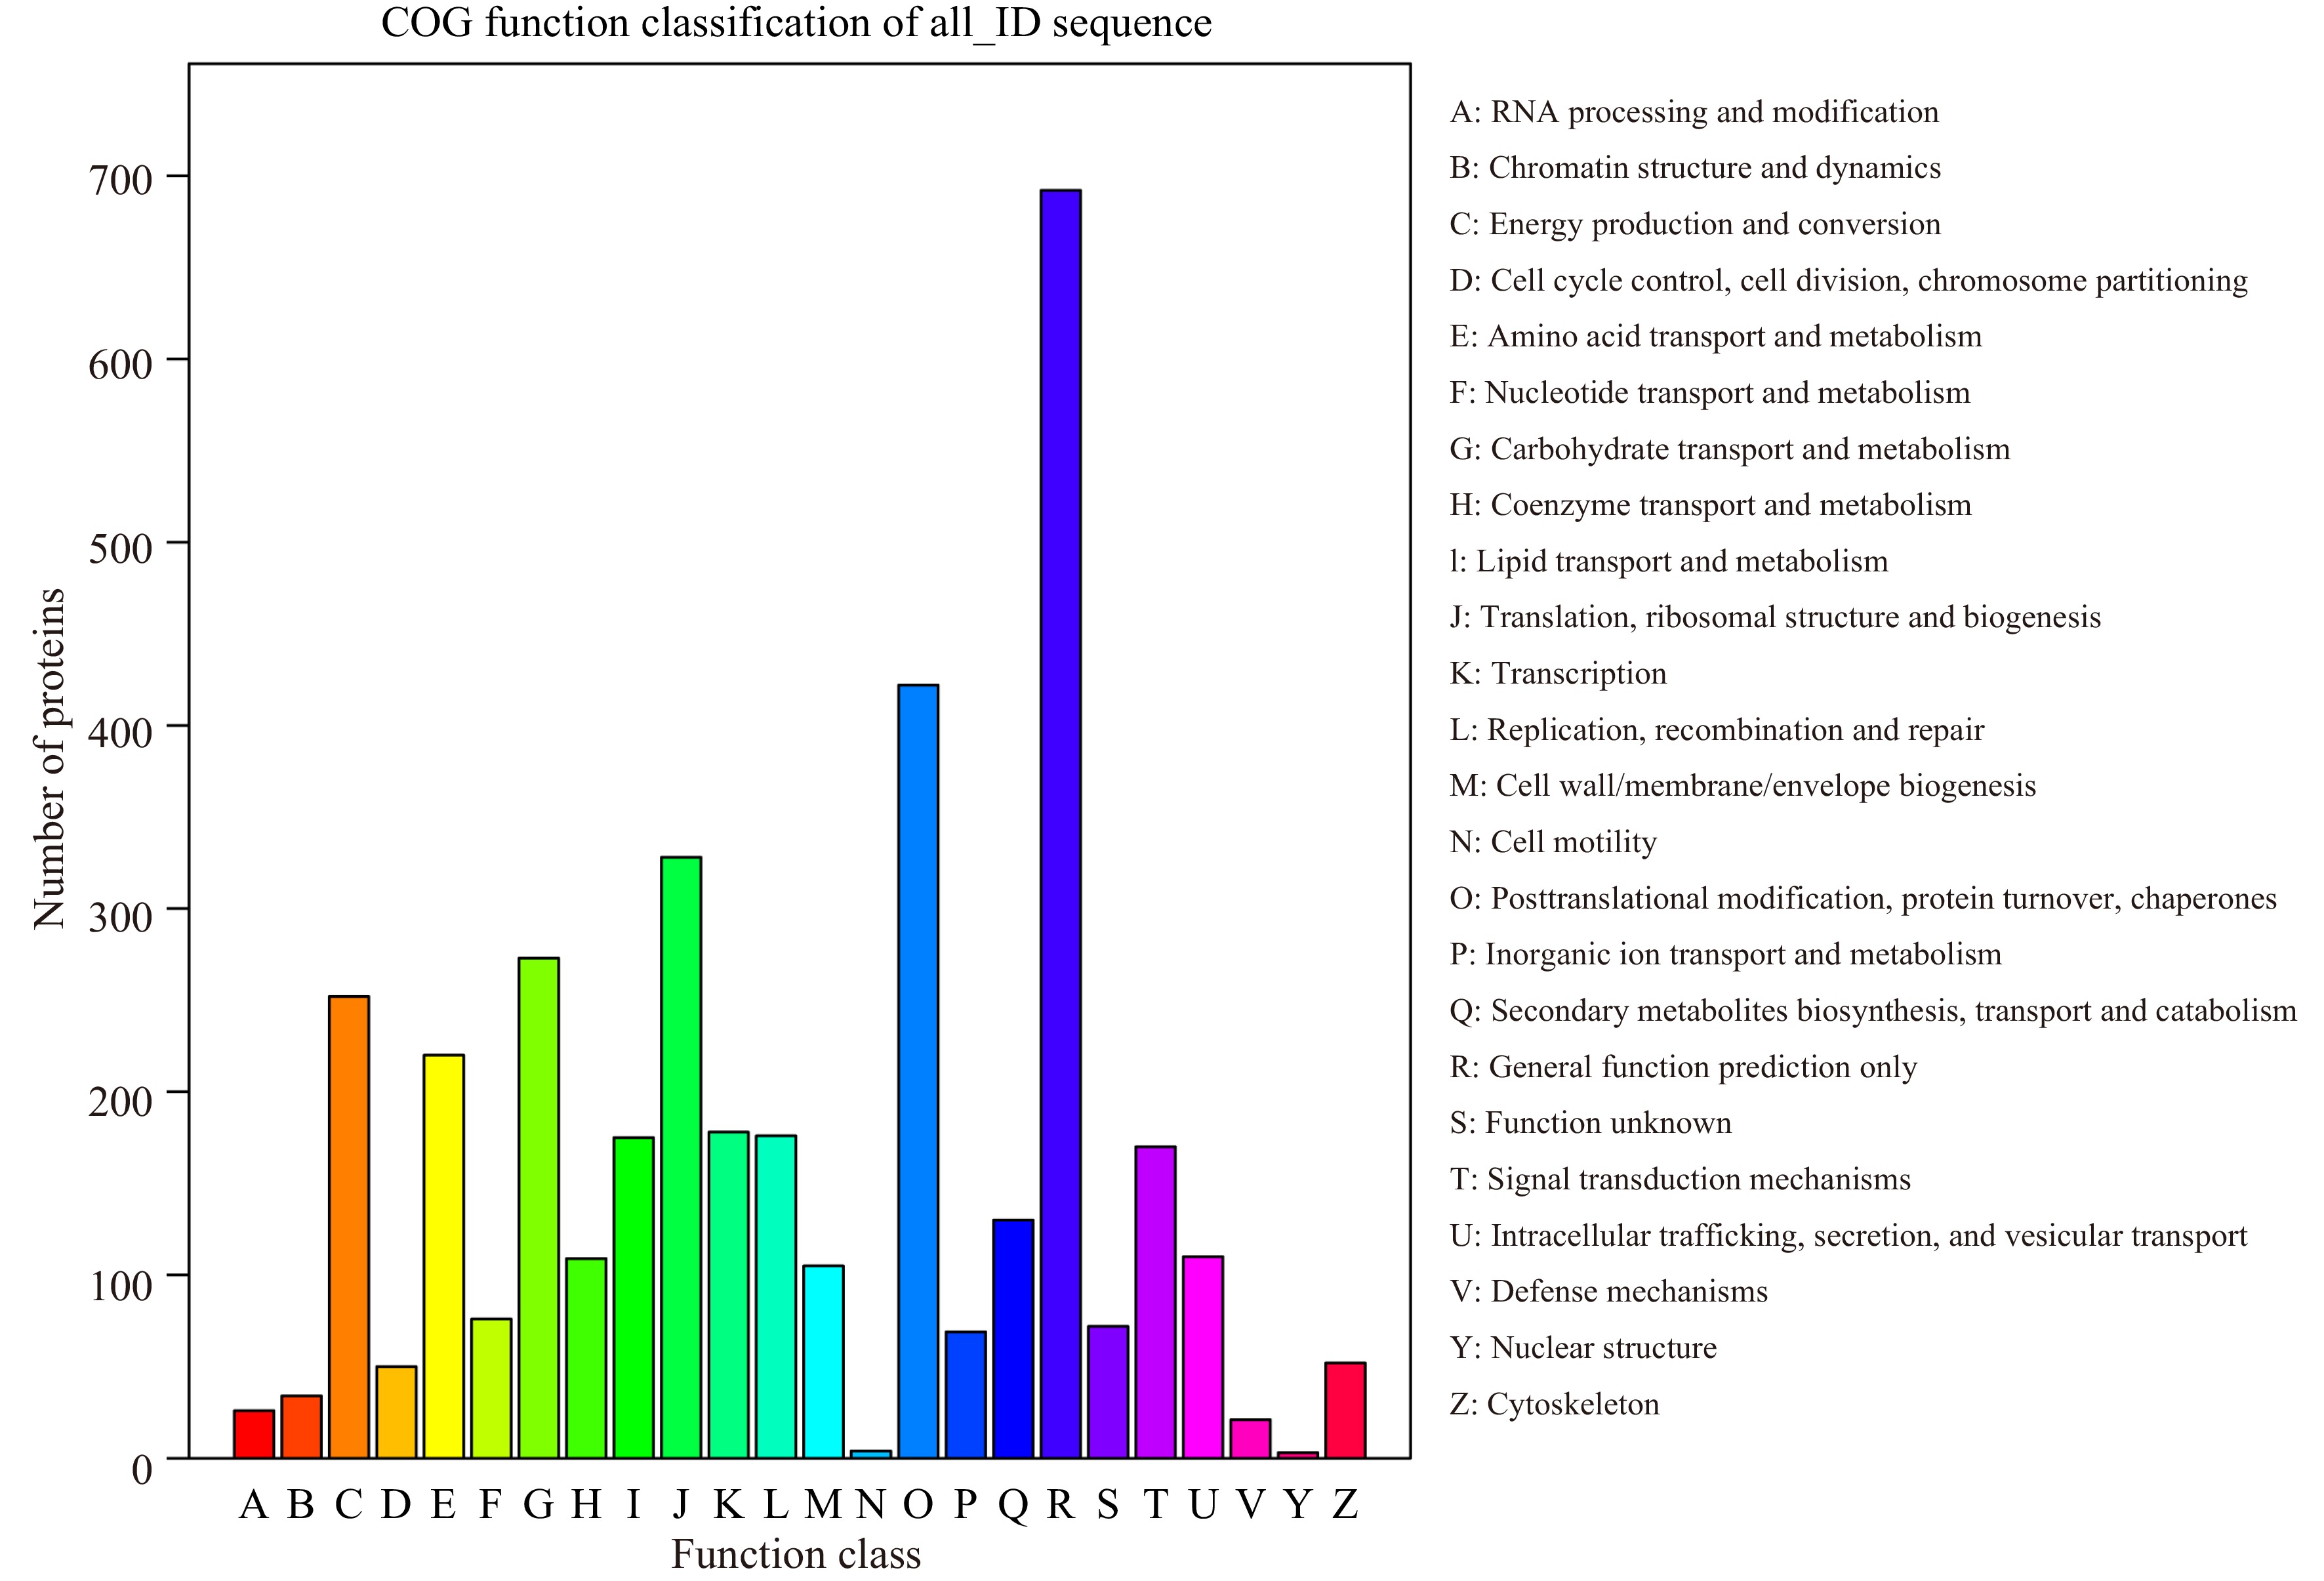
Figure 3.
COG classification of peptides.
Kyoto Encyclopedia of Genes and Genomes (KEGG) (
www.genome.jp/kegg ) ontology is the main public database related to pathways[20], and can determine the most important biochemical and signaling pathways involved in protein metabolism. Among the 4,802 proteins, 2,301 proteins were identified in KEGG database based on BLAST matches with proteins with known functions, and mapped to 120 pathways. Metabolic pathway (1,011, 43.94%), biosynthesis of secondary metabolites (573, 24.90%), microbial metabolism in diverse environments (282, 12.26%), spliceosome (185, 7.17%), and ribosome (165, 6.21%) represented the main metabolic pathways (Supplemental Table S2).Identification of differentially expressed proteins (DEPs)
-
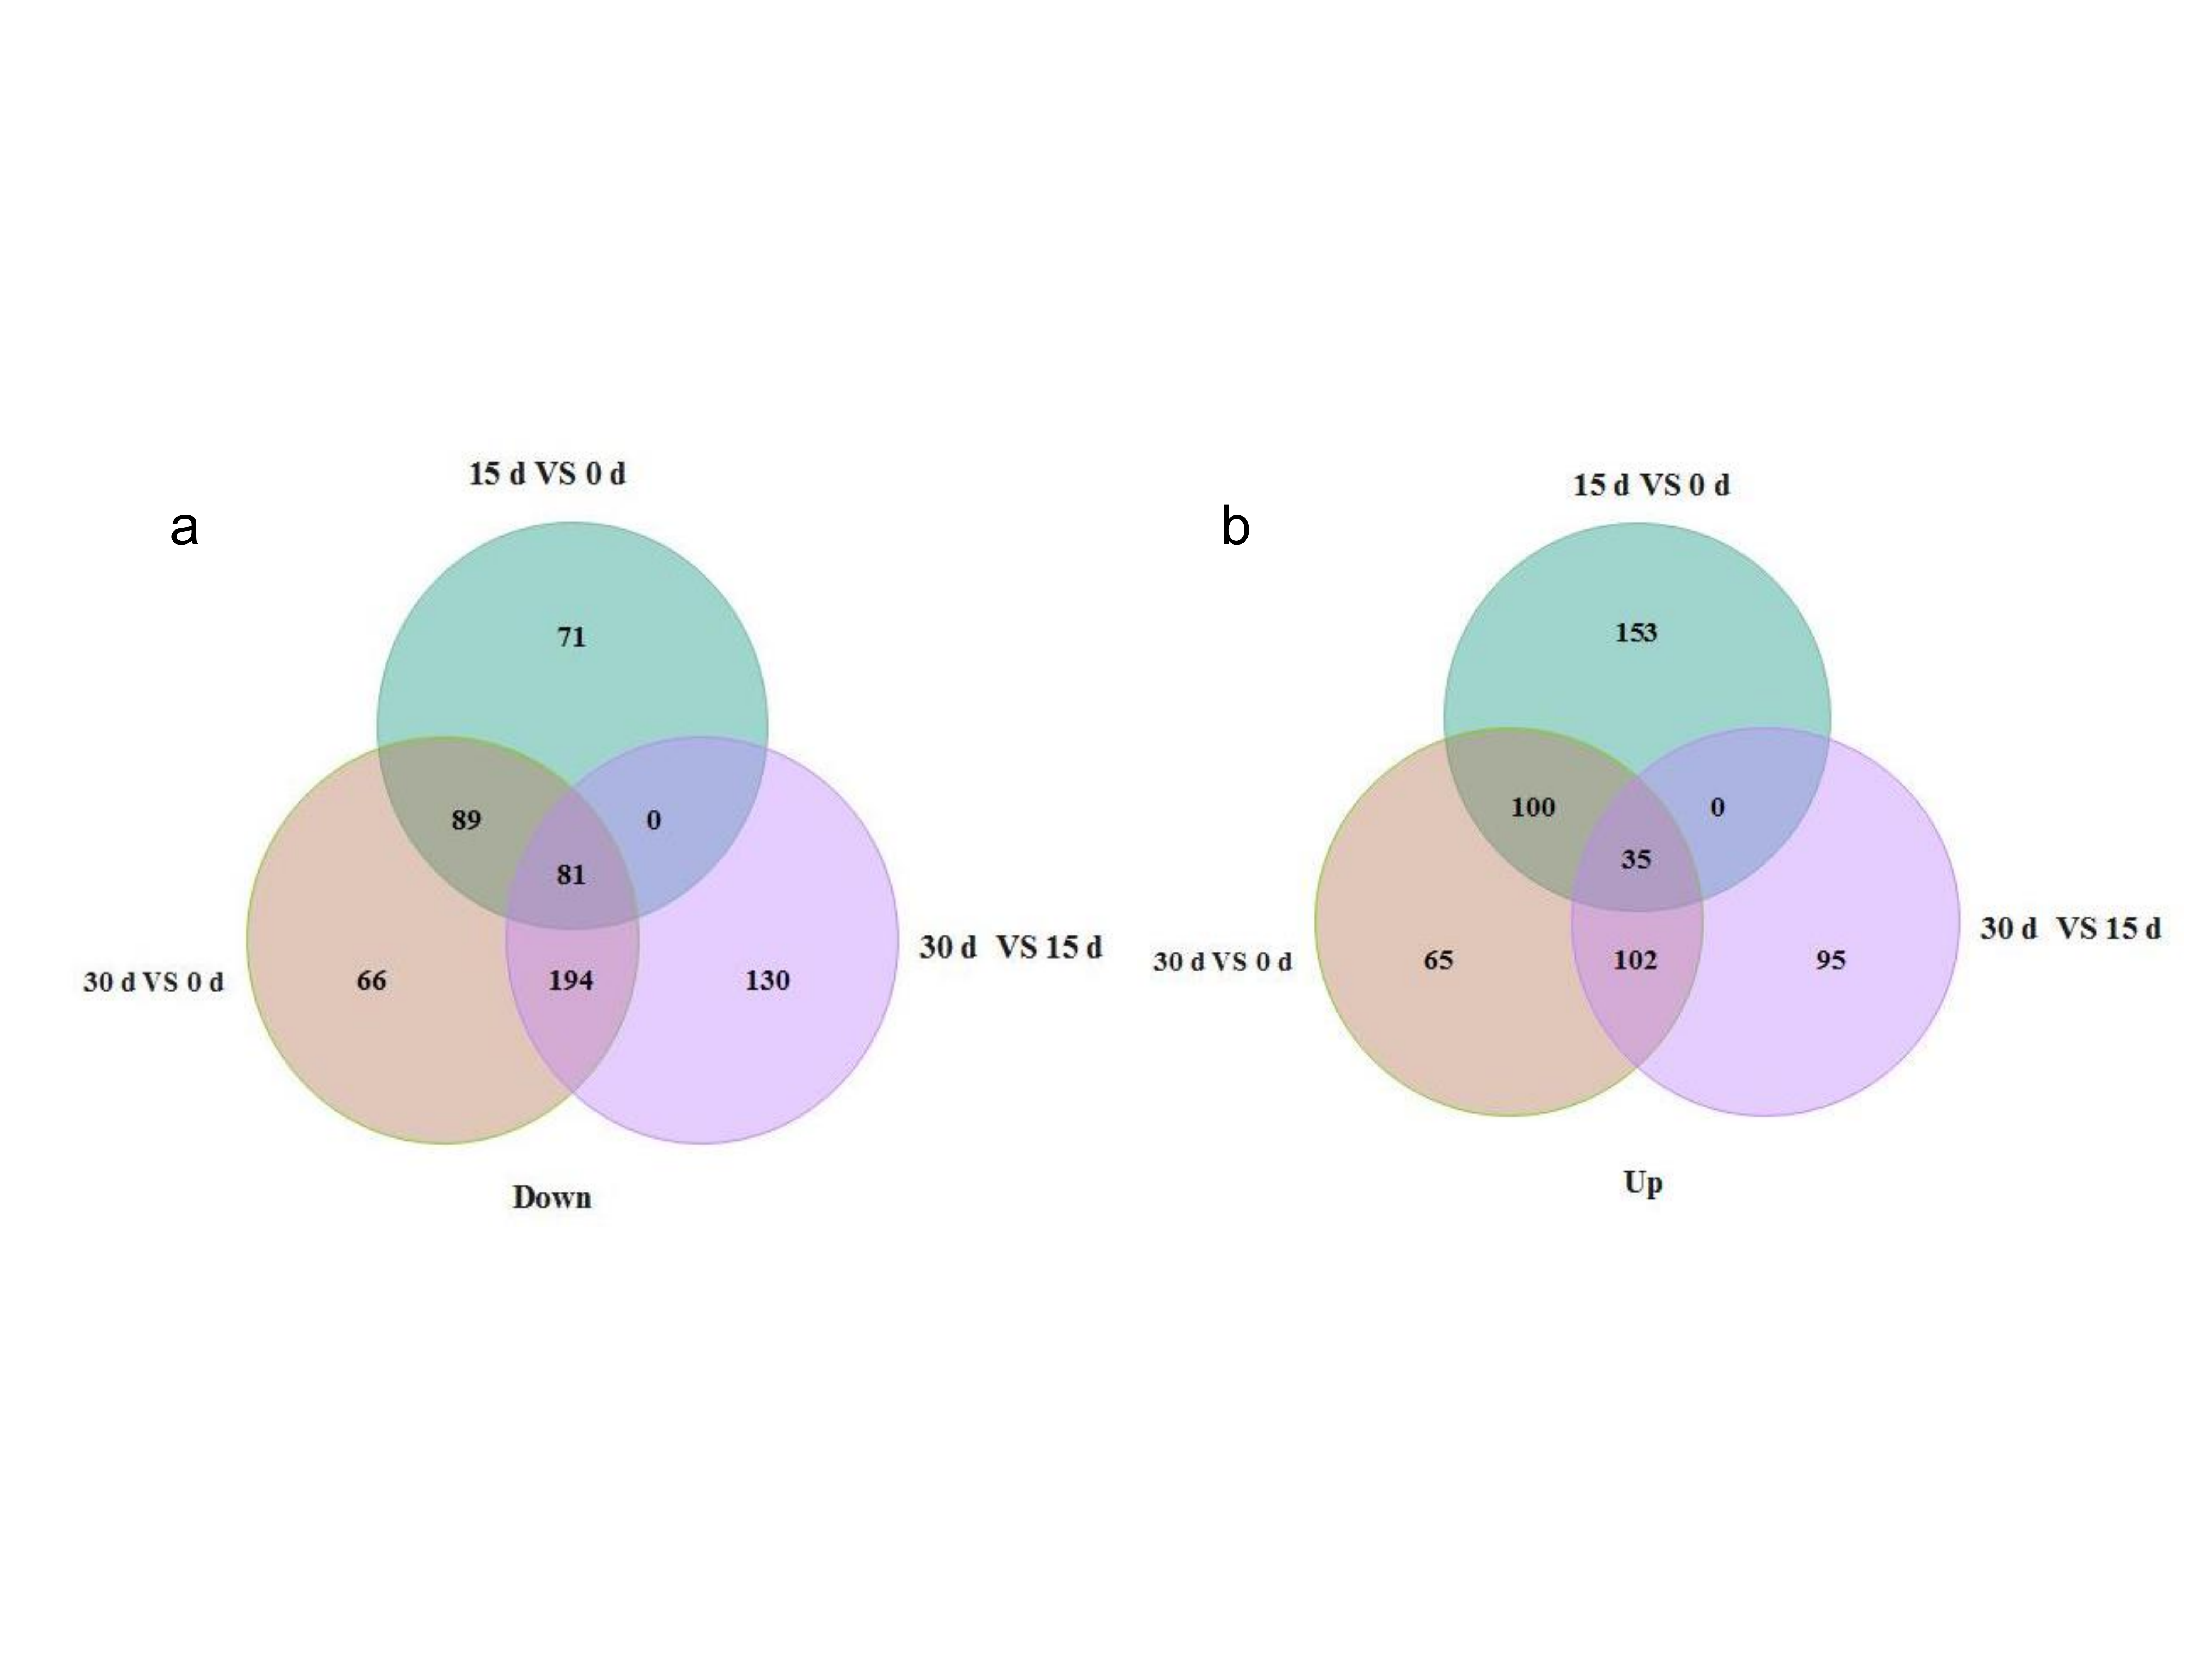
According to previous studies, DEPs were defined based on a threshold 1.5-fold change with p < 0.05. In the current study, only proteins expressed in the three lily bulblet developmental stages with fold changes ≥ 1.5 or ≤ 0.67 and p < 0.05 compared with their control groups were considered to be DEPs. Five hundred and twentynine proteins were differentially expressed in 15 d relative to 0 d, including 288 up-regulated and 241 down-regulated proteins; 735 proteins were differentially expressed in 30 d relative to 0 d, including 305 up-regulated and 430 down-regulated proteins; and 637 proteins were differentially expressed in 30 d relative to 15 d, including 232 up-regulated and 405 down-regulated proteins (Supplemental Fig. S1). Generally, there were more DEPs in 30 d relative to 0 d. It was indicated that the later stage of bulblet development, i.e. the bulblet morphogenesis presented more complex metabolic activities. Among these DEPs, 116 were differentially expressed in all of the comparisons (Supplemental Table S3).
The DEPs of the three comparisons were not significantly different in the annotations in the GO database. In the classification of biological processes, proteins annotated as 'metabolic process' account for the largest proportion in both down-regulated and up-regulated DEPs of all three comparisons. In the classification of cellular components, there were most proteins annotated as 'cell' in down-regulated DEPs while 'cell' and 'cell part' took up the largest part in up-regulated DEPs of all three comparisons. In the molecular function classification, there were many proteins annotated as 'catalytic activity' in down-regulated DEPs of three comparisons and up-regulated DEPs in comparison of 30 d vs 15 d, while 'binding' had the most up-regulated DEPs in comparisons of 15 d vs 0 d and 30 d vs 0 d (Fig. 4).
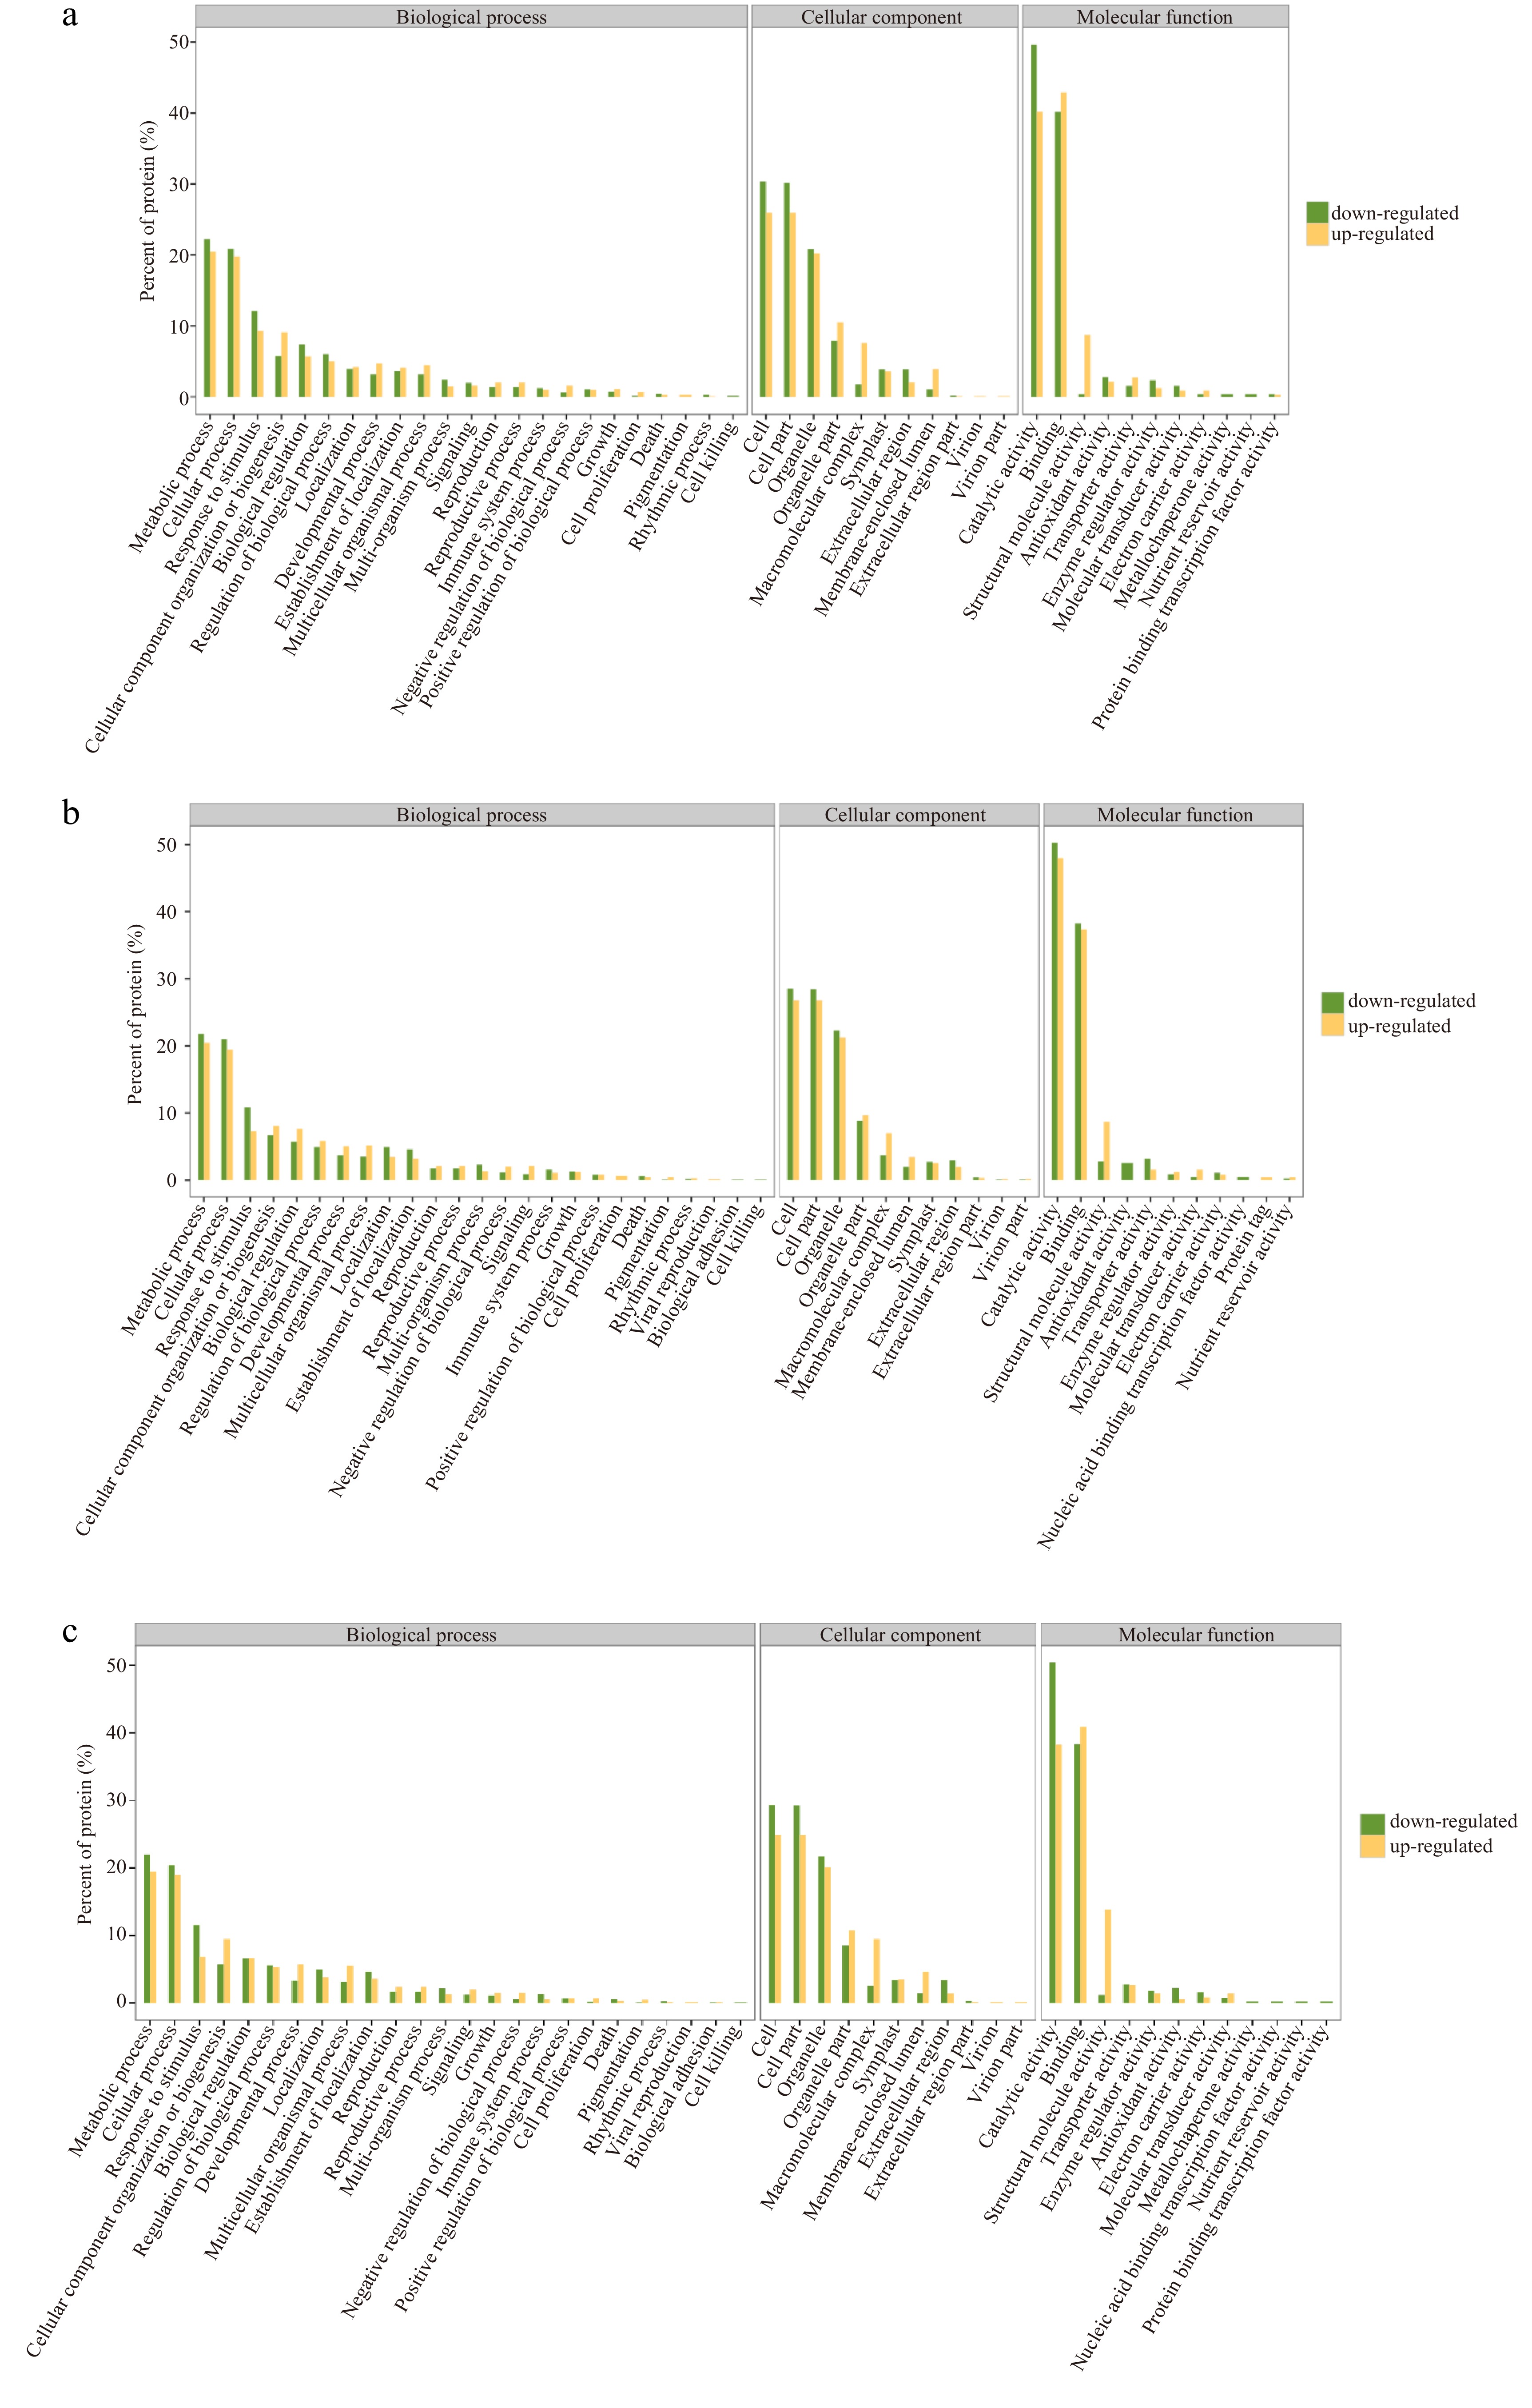
Figure 4.
GO enrichment diagrams of down-regulated and down-regulated DEPs in three comparisons. (a) Comparison of 15 d vs 0 d, (b) Comparison of 30 d vs 15 d, (c) Comparison of 30 d vs 0 d.
DEPs in three comparisons were enriched in GO terms to significantly respond to cell, cell part, intracellular, cytoplasm, metabolic process, cellular process, organelle, and intracellular organelle (Fig. 5). Some DEPs in comparisons of 15 d vs 0 d and 30 d vs 15 d were also enriched in GO terms to respond to cytoplasmic part, in comparisons of 15 d vs 0 d and 30 d vs 0 d were enriched to cellular metabolic process, in comparisons of 30 d vs 15 d and 30 d vs 0 d were enriched to biosynthetic process. In addition, DEPs were also significantly enriched in cellular biopolymer metabolic process, catabolic process and ribonucleotide binding in comparison of 15 d vs 0 d, as well as cellular macromolecule metabolic process in comparison of 30 d vs 15 d, and membrane in comparison of 30 d vs 0 d. Accordingly, the lily bulblet development is associated with cellular activities, metabolic activities and energy activities.
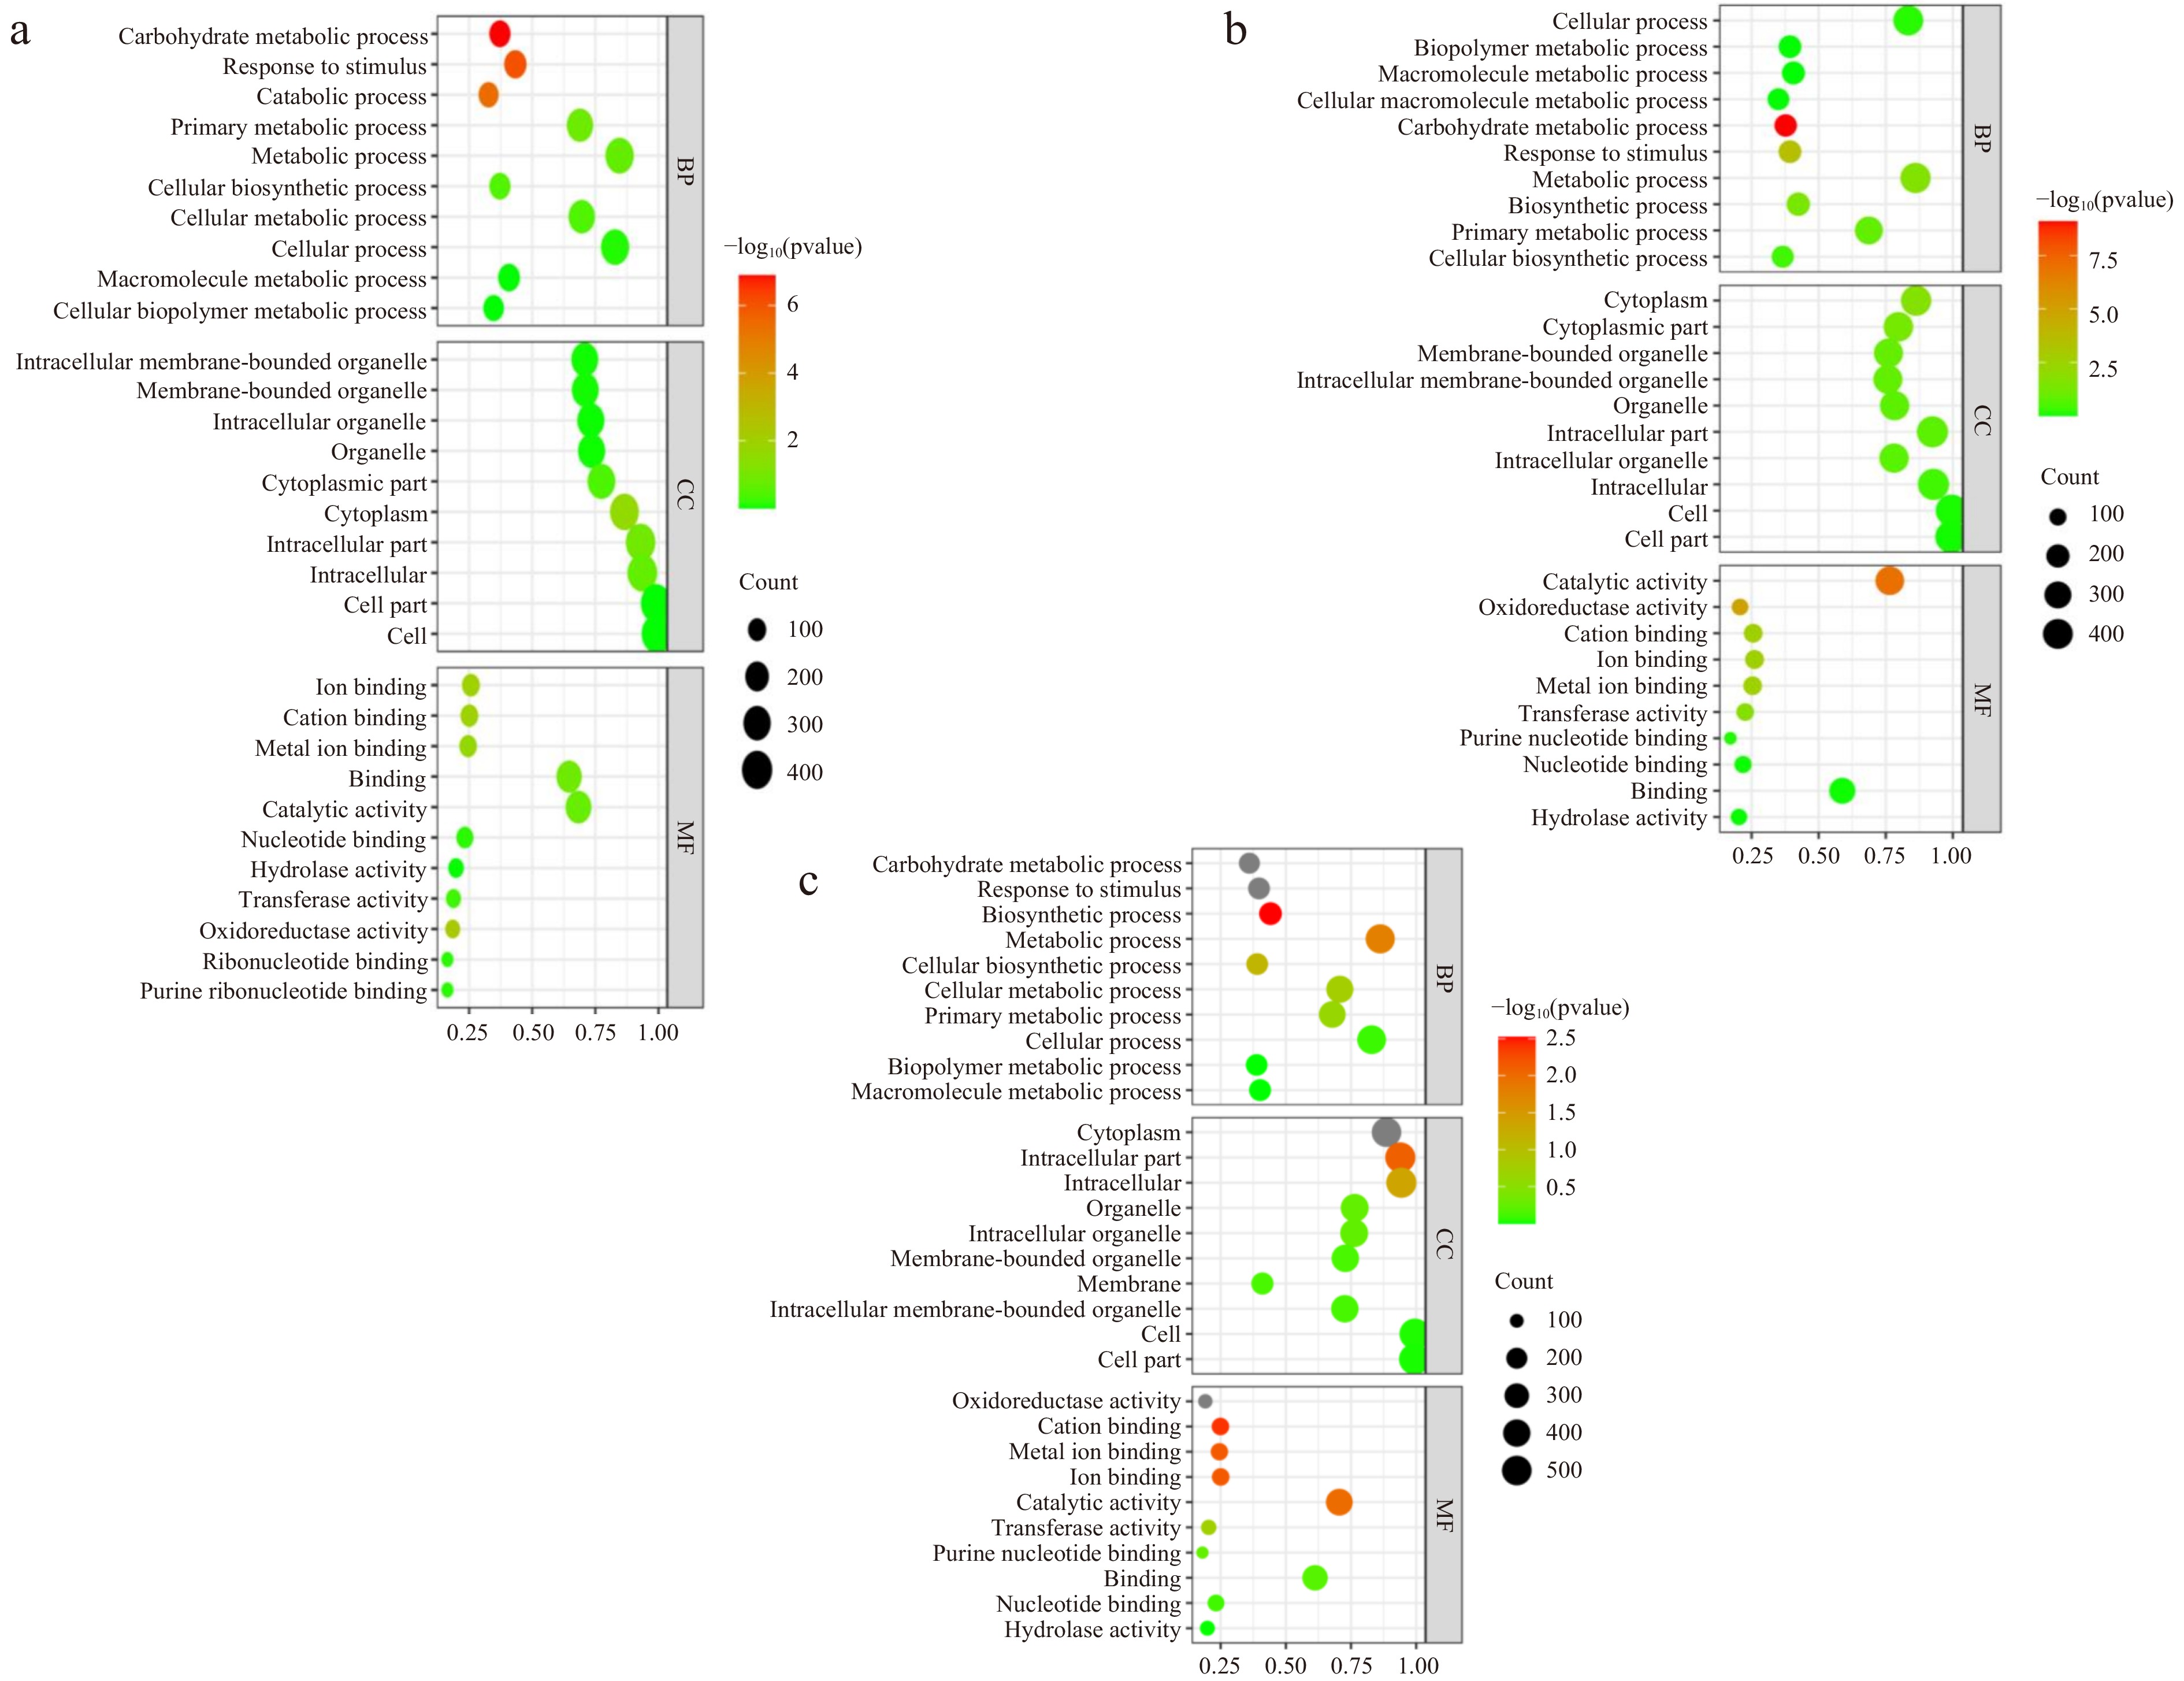
Figure 5.
GO pathway enrichment bubble charts. (a), (b) and (c) represent the GO pathway name for DEPs in 15 d vs 0 d, 30 d vs 15 d and 30 d vs 0 d, respectively. The size of the bubble indicates the number of DEPs annotated on a GO term. The color represents the enriched p-value.
The top 10 up-regulated and down-regulated differential proteins enriched in KEGG pathway in the comparisons are shown in Fig. 6. It can be seen that the metabolic pathways, biosynthesis of secondary metabolites and microbial metabolism in diverse environments pathways were presented in both up-regulated and down-regulated differential proteins of all the three comparisons. Carbon fixation in photosynthetic organisms, glycolysis/gluconeogenesis, and pyruvate metabolism were down expressed in all the three comparisons, while ribosome and phagosome up expressed in all the three comparisons. Amino sugar and nucleotide sugar metabolism, fructose and mannose metabolism, and starch and sucrose metabolism were oppositely expressed in comparison of 15 d vs 0 d and comparison of 30 d vs 15 d, down in 15 d vs 0 d while up in 30 d vs 15 d. This indicates that the metabolic activity is vital to lily bulblet development, while energy needed is opposite between the early and later stages of lily bulblets.
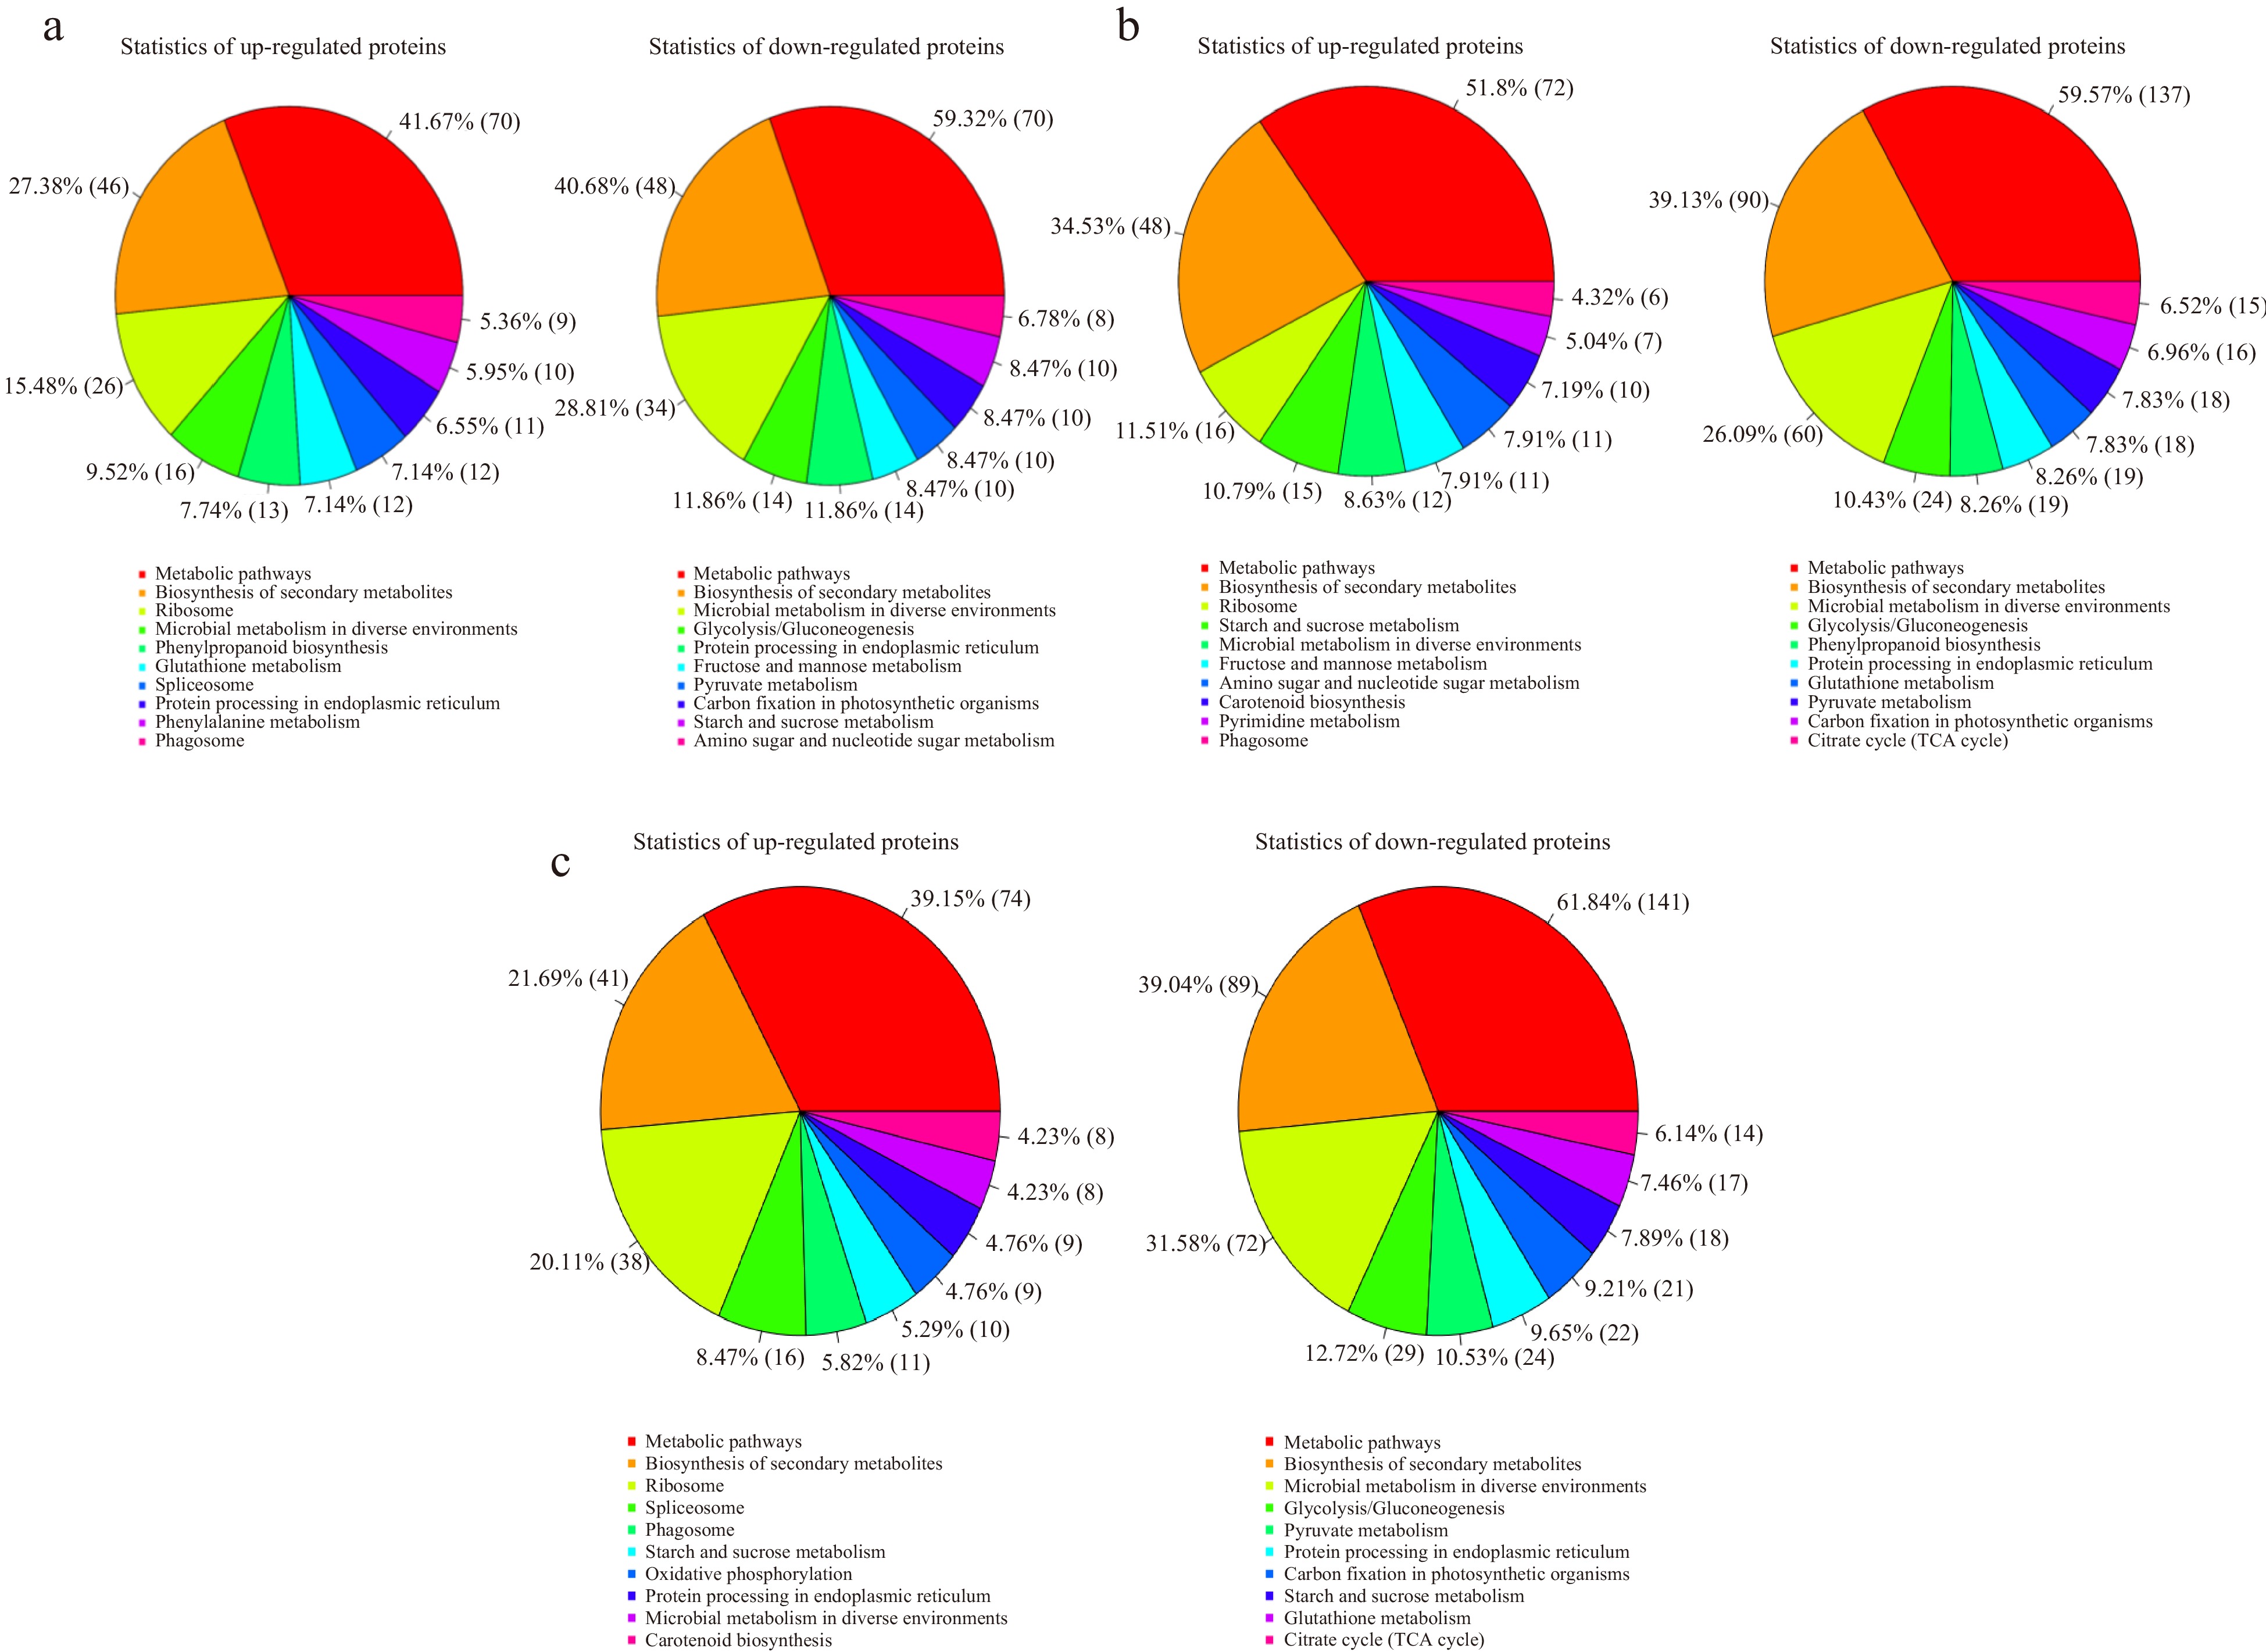
Figure 6.
Statistical chart of up-regulated and down-regulated proteins enriched pathway results in the three comparisons. (a), (b) and (c) represent the comparison of 15 d vs 0 d, 30 d vs 15 d and 30 d vs 0 d, respectively.
The main metabolic pathways of the DEPs are shown in Supplemental Table S4. The main metabolic pathways enriched among these lily bulblet developmental stages included metabolic pathways, biosynthesis of secondary metabolites, microbial metabolism in diverse environments, ribosome, protein processing in endoplasmic reticulum, starch and sucrose metabolism which were the main 'intersection metabolic pathways' during the bulblet development. The results indicated that energy formation, protein synthesis process, and carbohydrate metabolism was vital to lily bulb growth and development. Integrating the previous transcriptome of lily bulblets development with the present iTRAQ database, the gene named GASA/Snakin (Gibberellic Acid Sitmulated Arabidopsis) with an obvious difference (15 d vs 0 d with fold change of 0.09, and 30 d vs 15 d with fold change of 12.88) was found to play crucial roles in lily bulblets growth and development, so we decided to study its function during the development of lily bulbs.
Isolation, sequence analysis and expression of the LdGASA gene in bulb development
-
To isolate the full-length cDNA sequence of the LdGASA, an approximate 600 bp cDNA sequence obtained previously by the RNA-seq was used and cDNA from an immature bulblets mixture used as a template. RACE was performed to isolate the 5'- and 3'-end fragments with specific primers (Supplemental Table S1). Agarose gel analysis showed 5'-end fragments of about 444 bp and 3'-end of fragments of about 64 bp. According to the overlaps between the 5'-, 3'-end and middle fragments, the full-length cDNA was obtained. As shown through the NCBI ORF finder, the full-length cDNAs of LdGASA was 725 bp, including the 336 bp of ORF, 125 bp of 5' UTR, 264 bp of 3' UTR, respectively (Fig. 7a).
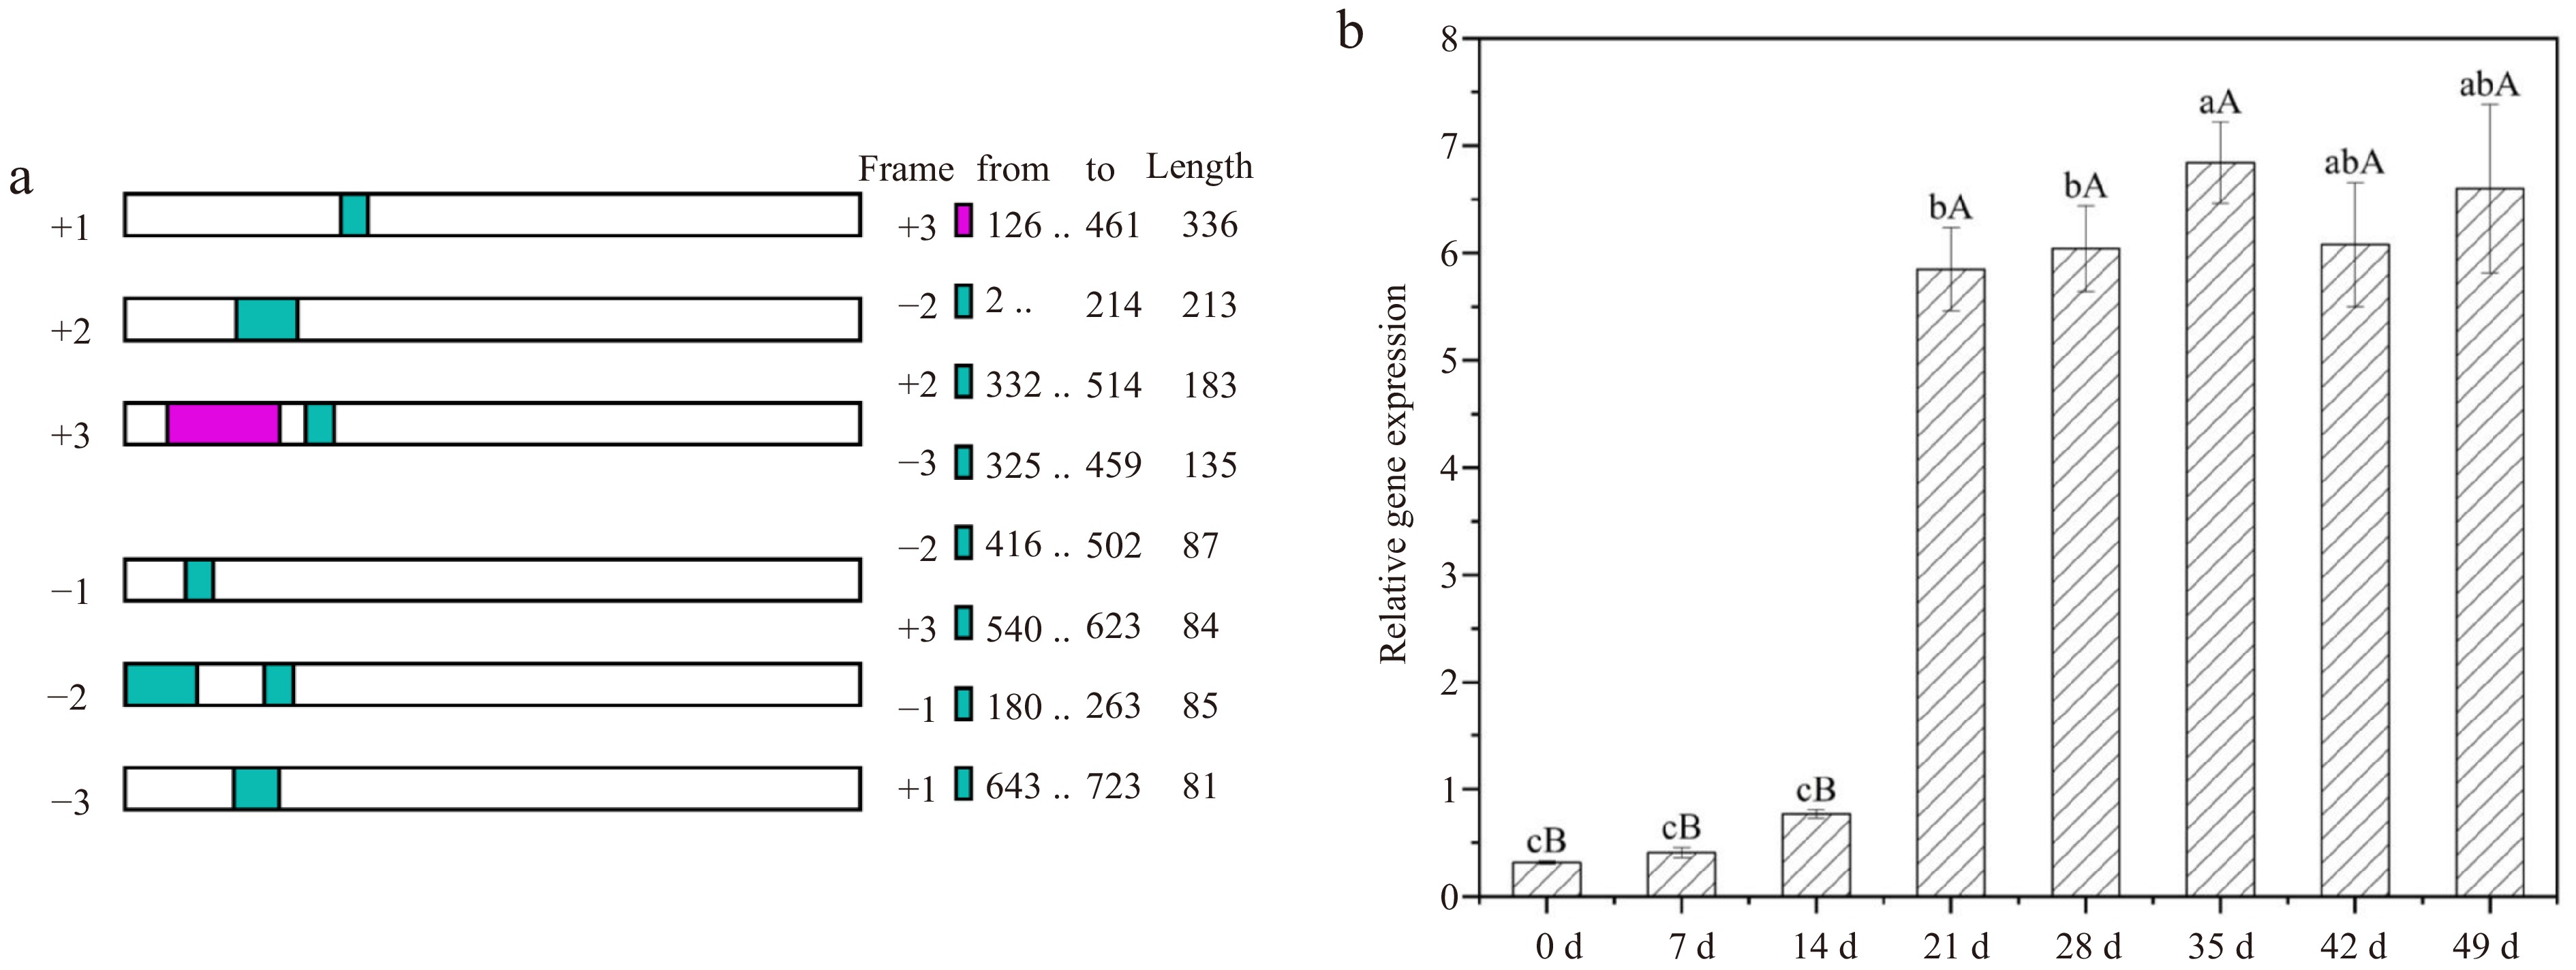
Figure 7.
NCBI ORF finder result and gene expression changes of LdGASA at different development stages of lily bulblets by real-time PCR. The values are the mean ± SD of three independent biological replicates, and lowercase and uppercase letters indicate statistically significant differences at p < 0.05 and p < 0.01 respectively as determined by Duncan's test.
Quantitative real-time PCR analysis was carried out to investigate LdGASA expression pattern in lily bulblet at different stages of development. As shown in Fig. 7b, the relative expression level of LdGASA gene was different at different periods, and the expression level of LdGASA gene was relatively low at 0 and 7 d, that is, before the emergence of small bulbs. With the emergence of small bulbs (14 d), the expression of LdGASA gene increased gradually. With the development of small bulbs (21 d), the expression level of LdGASA gene suddenly increased, and then maintained at a high level, reaching the highest level on the 35 d, when small bulbs developed to form basic traits, indicating that LdGASA plays an important role in the development of lily bulbs.
Overexpression of LdGASA in transgenic Arabidopsis thaliana
-
To detect the function of LdGASA in plants, overproducing LdGASA in Arabidopsis plants was generated. The CDS sequence of LdGASA was cloned from a pool of lily bulblet cDNA and placed under the control of the enhanced CaMV 35S promoter (Fig. 8a). The construct was introduced into Arabidopsis via Agrobacterium-mediated transformation. Independent transgenic lines (T0) with LdGASA were generated, and the lines were self-crossed and seeds were collected and cultivated. The plants with LdGASA were identified by specific primers (PTF/PTR). More than 20 transgenic lines (Line 1−Line 12) were obtained and named LdGASA-OE. qPCR analysis showed that the LdGASA gene was successfully expressed at various levels in individual LdGASA-OE lines and some of them are displayed in Fig. 8b. Transgenic lines (T1, T4, T9, T12) with higher LdGASA expressions were selected for the following experiments.
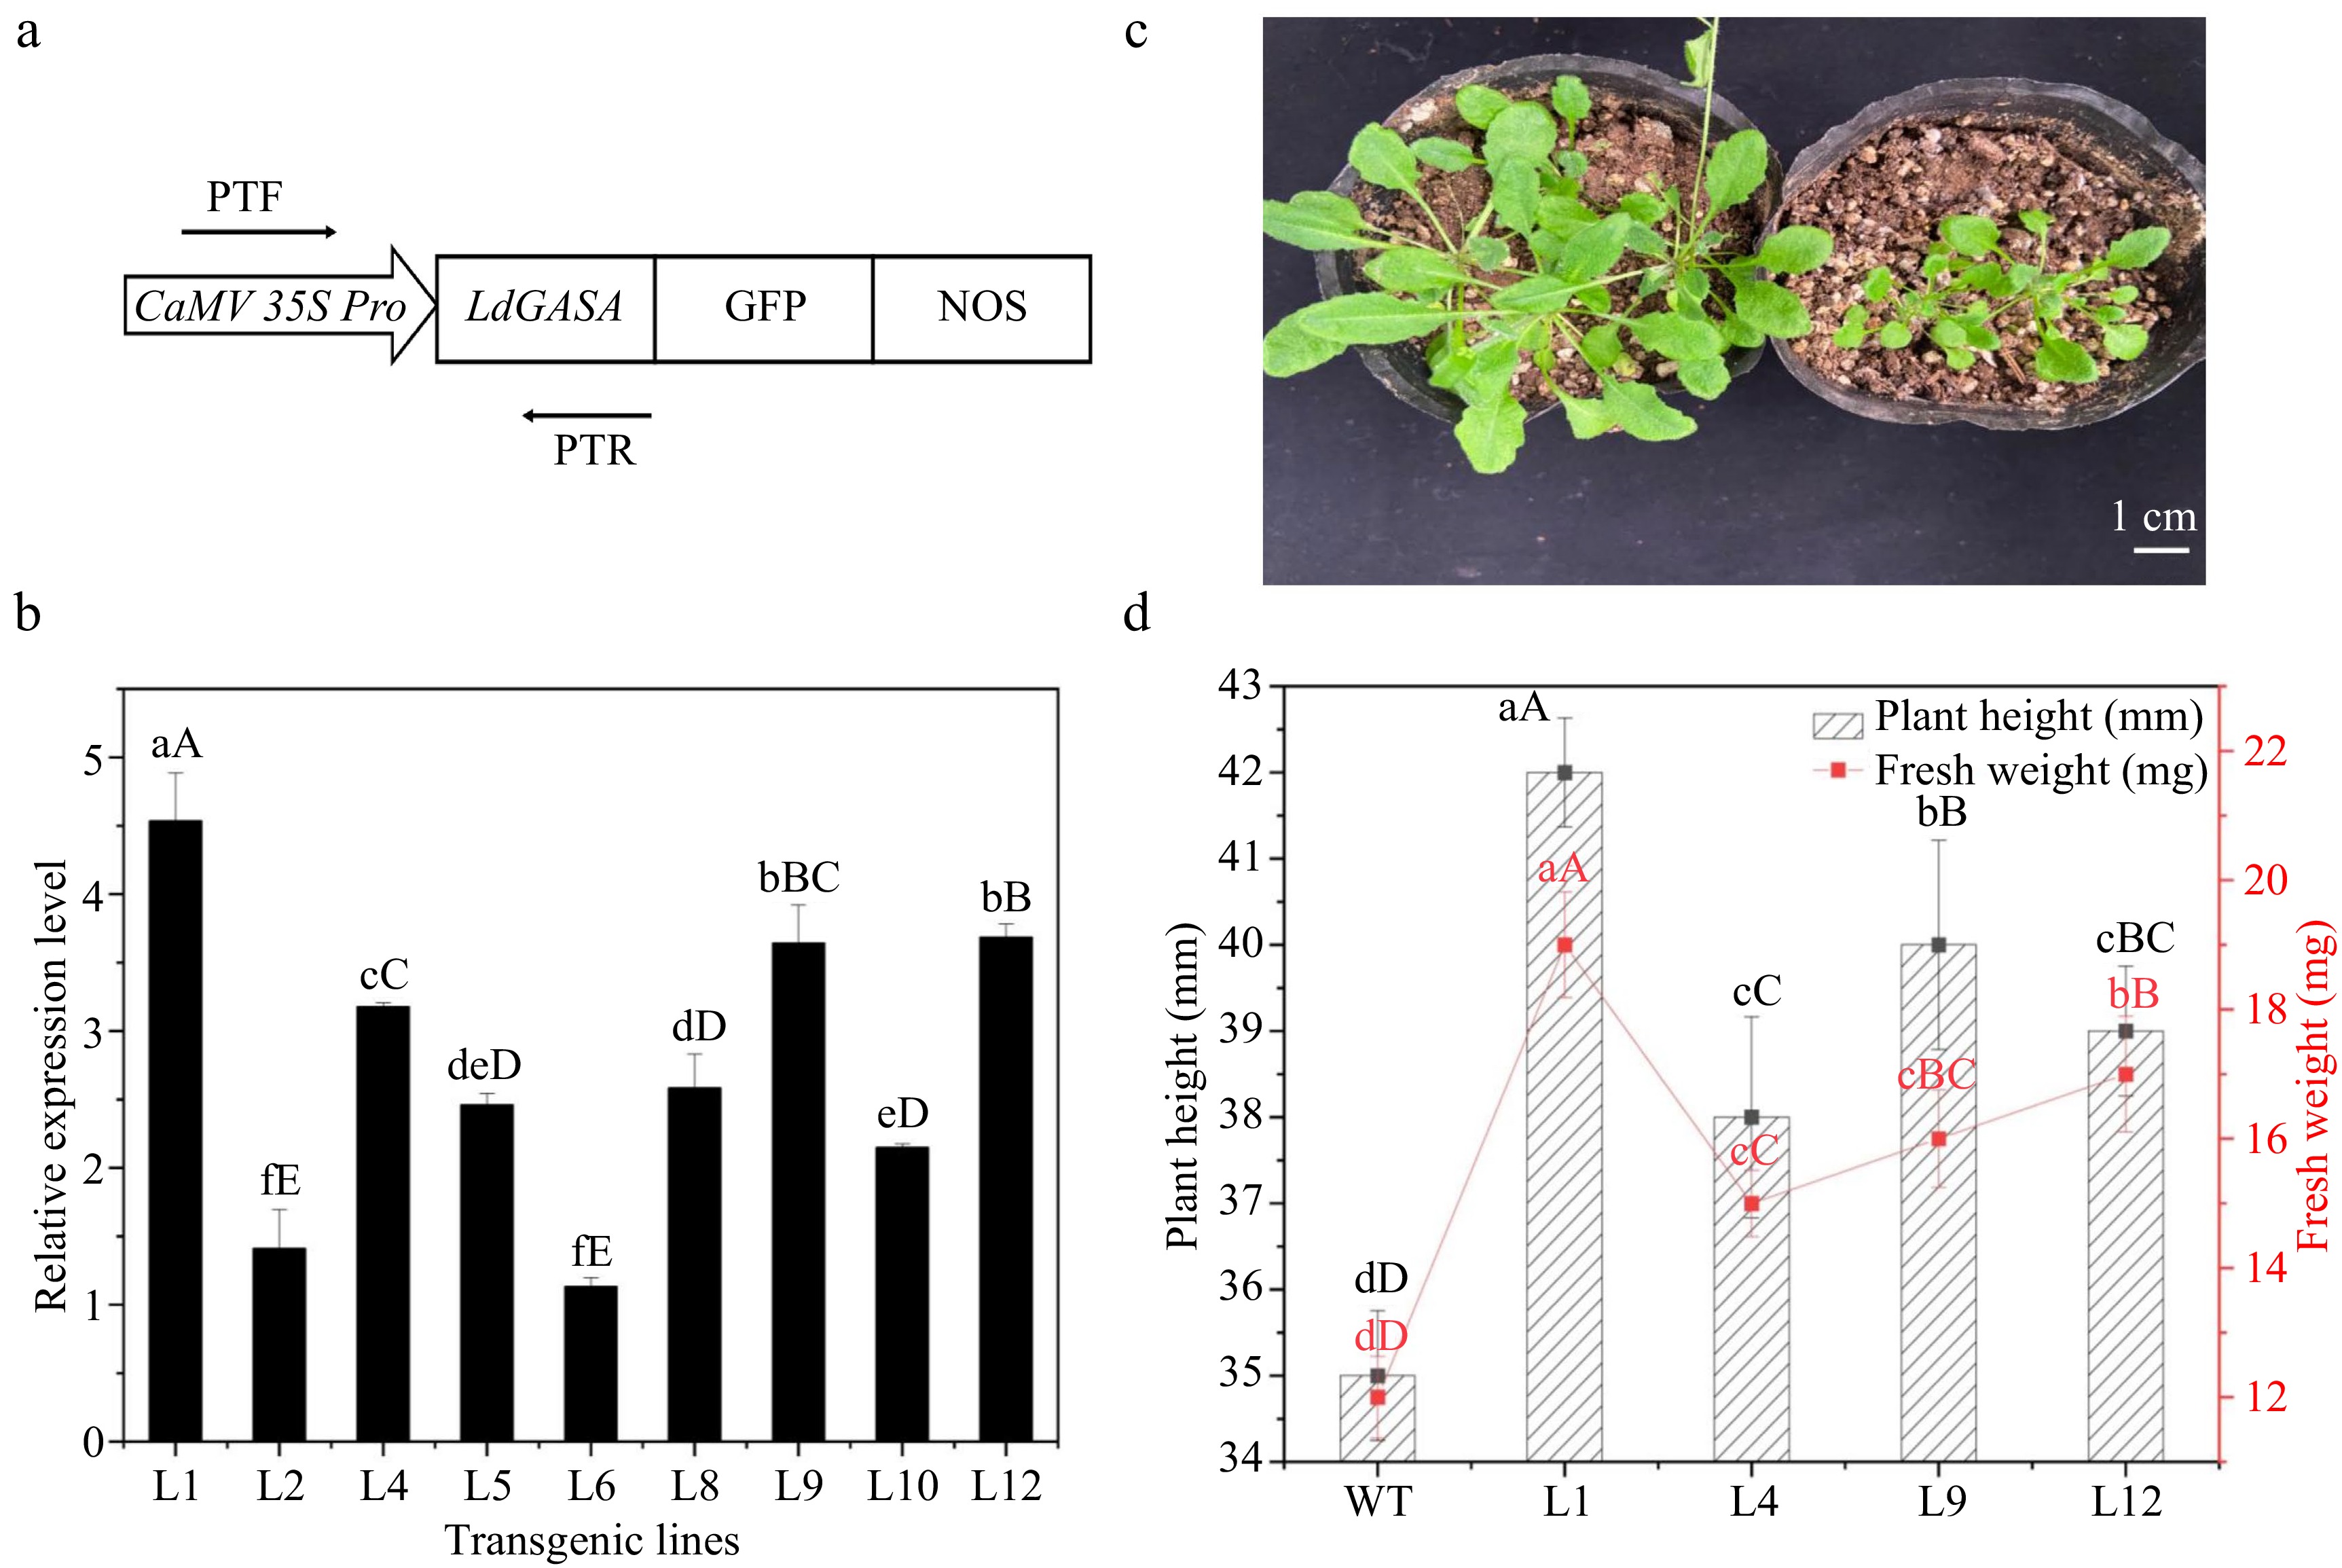
Figure 8.
Overexpression of LdGASA in transgenic Arabidopsis thaliana. (a) The LdGASA CDS was driven by the enhanced CaMV35S promoter. PTF/PTR used for identification of LdGASA in plants. (b) Quantitative RT-PCR analysis of LdGASA transcript levels in corresponding transgenic Arabidopsis leaves. The expression levels were indicated as that of WT as control. The values are the mean ± SD of three independent biological replicates normalized against the reference gene Actin. Lowercase and uppercase letters indicate statistically significant differences at p < 0.05 and p < 0.01 respectively as determined by Duncan's test. (c) The whole plants at 3 weeks old. Scales bars 1 cm. (d) The height and fresh weight of seedling at 3 weeks old. Plant height and fresh weight were determined based on six replicates for each genotype. Vertical bars represent mean ± SD. Lowercase and uppercase letters indicate statistically significant differences at p < 0.05 and p < 0.01 respectively as determined by Duncan's test.
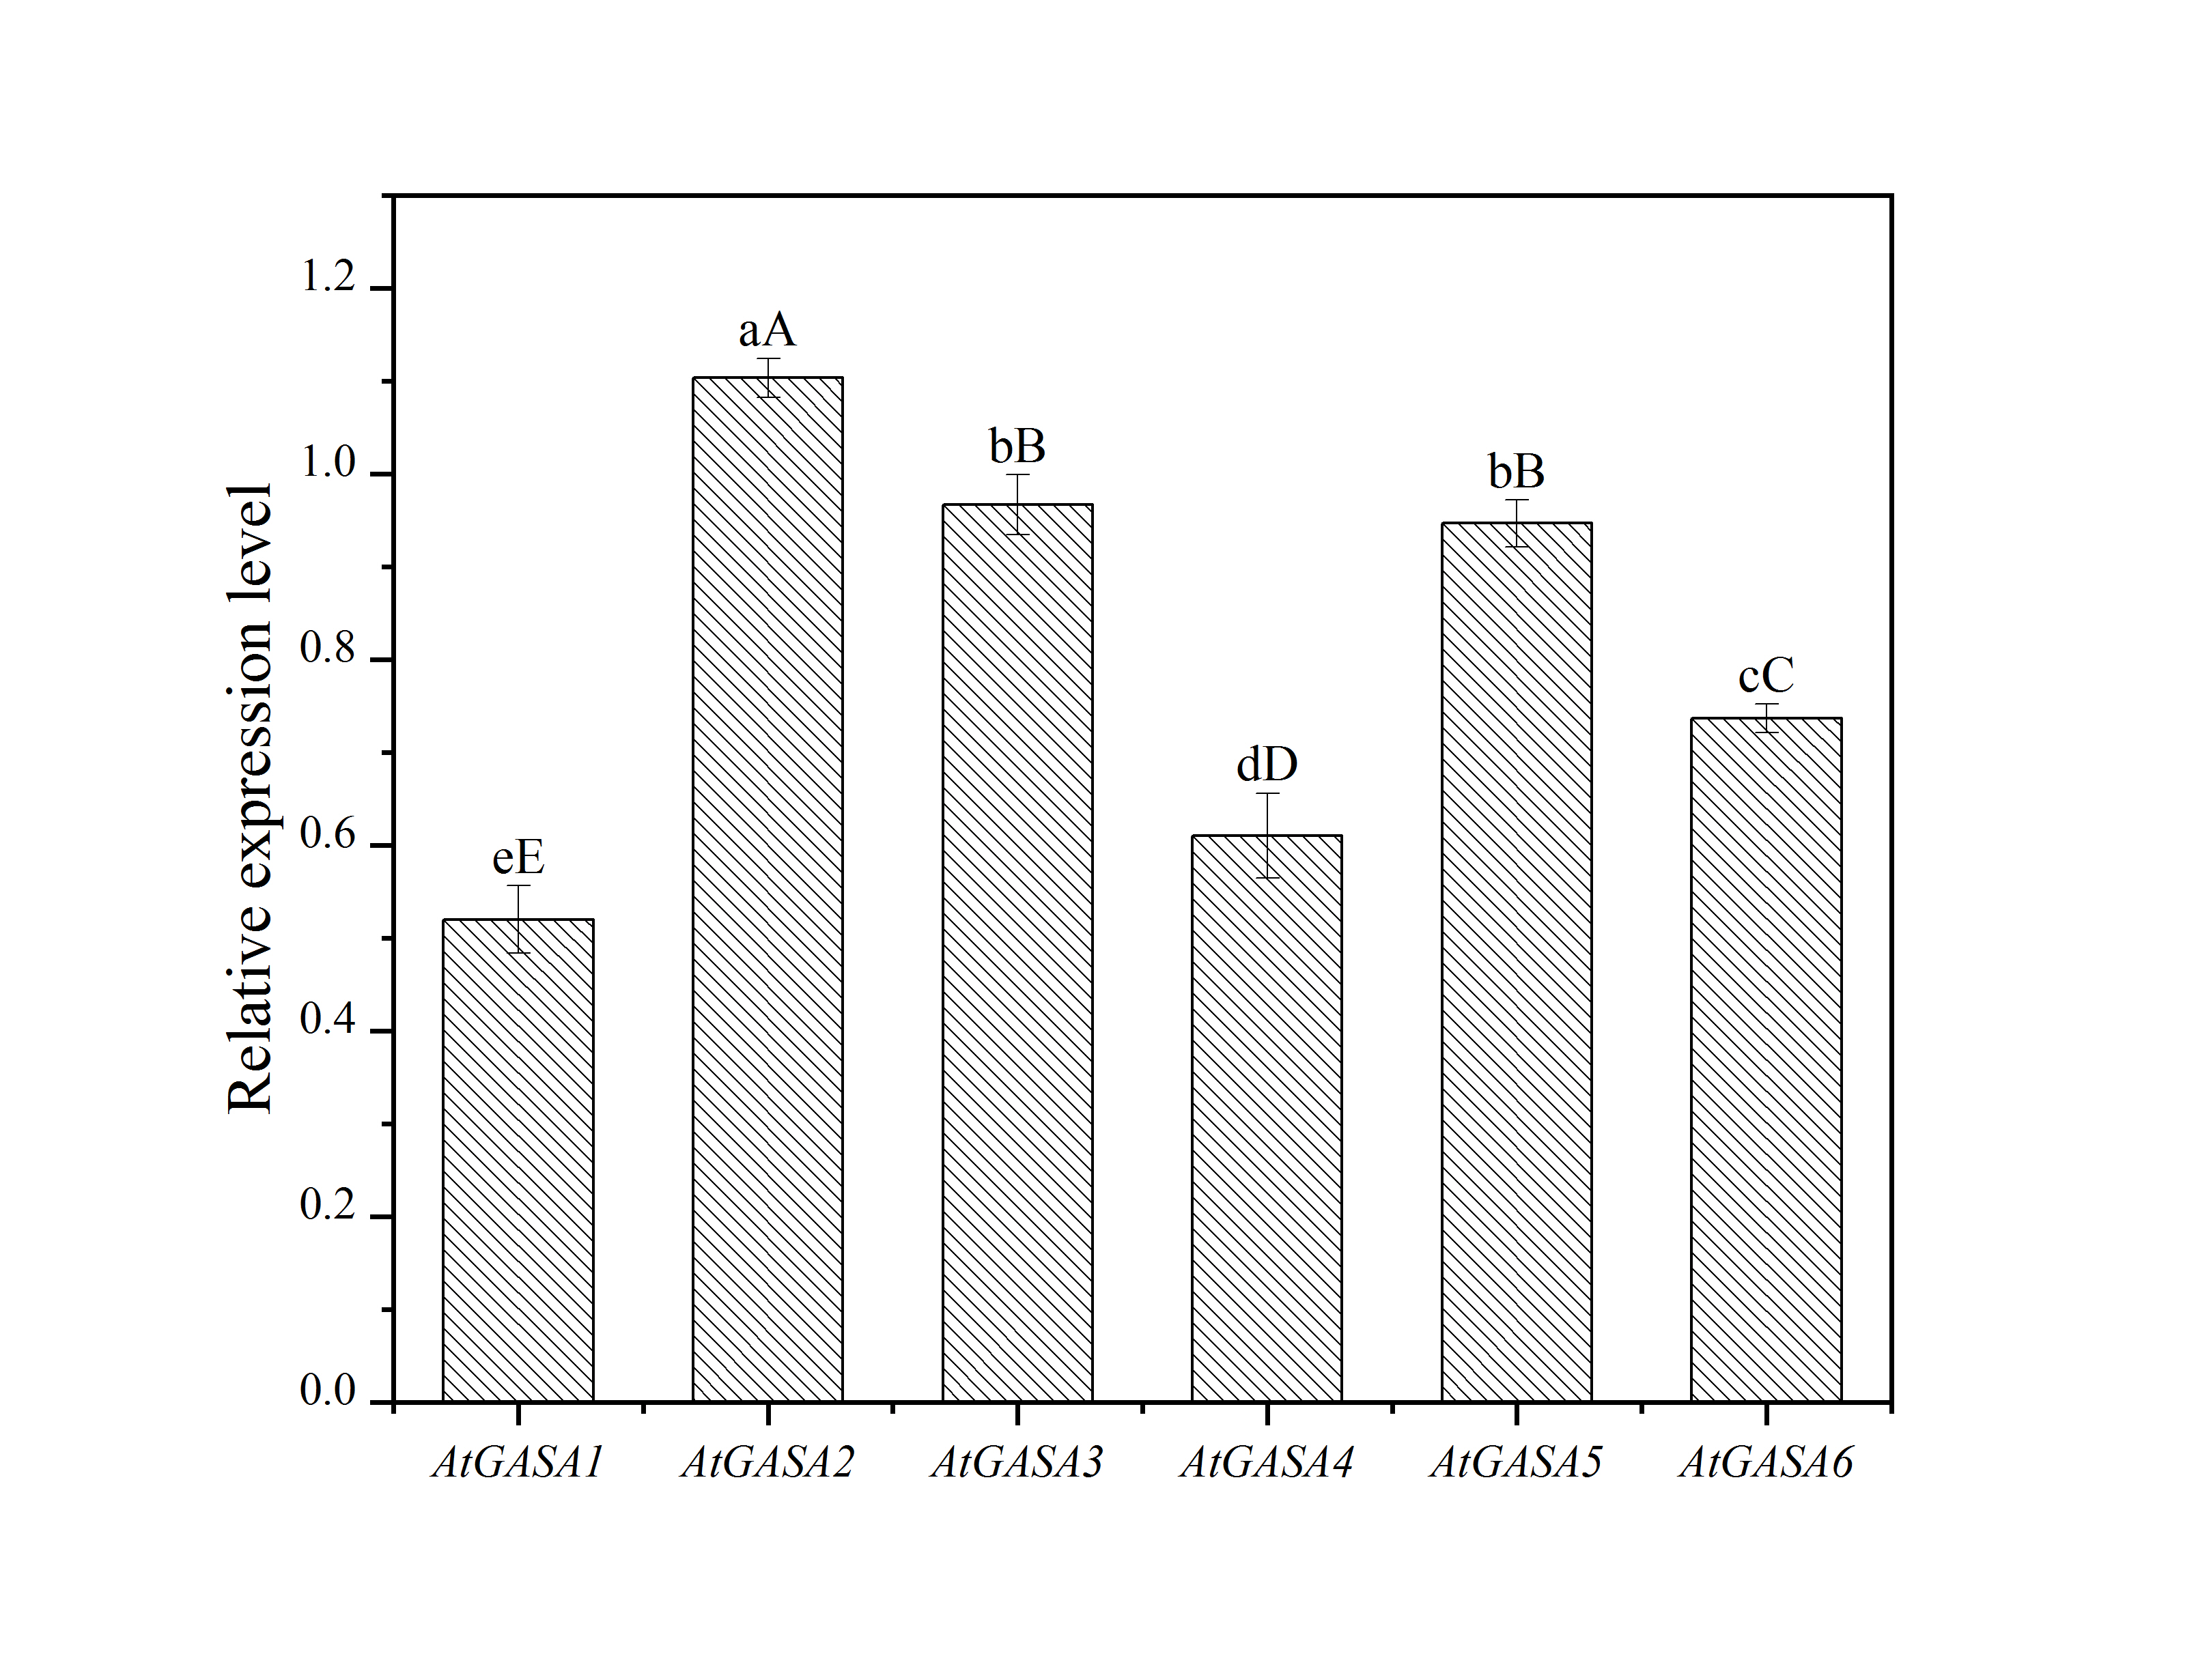
In order to characterize further LdGASA biological function in plant growth and development, homozygous overexpression (OX) transgenic plants LdGASA-OE and WT Arabidopsis plants were grown in a greenhouse and examined. The gene expression level of members of the AtGASA family in transgenic Arabidopsis L1 leaves is shown in Supplemental Fig. S2. It was observed that the plant flourish of LdGASA-OE was significantly more than that of the WT plants (Fig. 8c, d). Furthermore, compared with the WT plants, the plant height of LdGASA-OE increased. These results demonstrated that the overproduced functional LdGASA protein could promote increase in growth in Arabidopsis thaliana.
-
RNA sequencing (RNA-Seq) for analyzing the entire transcriptome composition and the gene expression patterns has been successfully applied for lily bulb development biological processes, i.e, the bulbil formation in Lilium lancifolium, stem bulblet formation in oriental lily, and bulblet formation and development of Lanzhou lily[10−12]. The results show that starch and sucrose metabolism and plant hormone signal transduction have proved to be crucial to bulb development. However, compared to gene transcription, proteins are directly related to biological function, the protein-mediated post-transcriptional and post-translational processes lead to the final cell products[21]. Thus, proteomics allows for the global analysis of gene products in the cellular physiological state[22]. This study provides valuable evidence for proteomic changes during bulb development in Lilium davidii var. unicolor based on iTRAQ profiling. We found that the metabolic pathway was extraordinarily valuable for bulblet formation, in accordance with branched spike development in tetraploid wheat (Triticum turgidum L.)[23]. To the best of our knowledge, this is the first proteome-profiling analysis in Lilium davidii var. unicolor, and the results will thus promote further studies to improve our understanding of the regulatory proteins and pathways affecting bulb development in this species.
The development of underground abnormal organs in bulbous and root crops is a complex process. There have already been many reports about underground abnormal organ development. Trihelix transcription factor (Tai6.25300) was found to be closely related to tuberous root enlargement in sweet potato by transcriptomic analysis[24]. Two lipoxygenase genes TgLOX4 and TgLOX5 were confirmed play key roles in the regulation of daughter bulb growth and development[25]. It was suggested that carbohydrates, especially starch and sugar play an extremely important role in the growth and development of Lanzhou lily bulbs in different periods[26]. In Lilium lancifolium, exogenous 6-BA treatment could induce bulblets formation by activating the expression of cytokinin receptors AHK2/3/4, activating ARR1/2/12 via AHP1, upregulating the expression of related genes involved in signaling and regulating downstream signaling[27]. Two WUSCHEL-related homeobox (WOX) genes LlWOX9 and LlWOX11 have been proved to be closely related to bulbil formation in Lilium lancifolium[28]. Based on transcriptome analysis, LoLOB18 gene was identified, and proved to be involvement in stem bulblet formation in lilies[11]. In our study, we first found the LdGASA played an extremely important role in the growth and development of Lanzhou lily bulbs.
The GASA/Snakin is a unique multigene family. GASA proteins are known to play diverse roles in plants. They are involved in the regulation of growth and development processes, including cell division[29], stem elongation[30], floral induction[31], seed germination[32], lateral root formation[33] and fruit development[34]. The GASA proteins are also linked to stress responses[35−37]. It has been implied that the GASA expression is regulated by GA and ABA[38], and GASA is a downstream target of GA[39], which can promote plant growth and development, flowering, and capsule formation. GASA influence various biological processes and signal transduction pathways, and then playing critical roles in plant growth and development in Salvia miltiorrhiza[40]. Due to complexities in functional mechanisms, different members of the GASA gene family have identical or diverse functions during the vegetative and reproductive stages[41]. In strawberry, FaGAST1 and FaGAST2 can both synergistically affect the fruit cell size[33]. The GASA gene is found in many plant species, but little is known about the function of GASA in lily. Here, we conducted identification, expression profiling study and biological function of GASA gene in lily bulblet development for the first time. The results confirmed that LdGASA could promote plant development.
-
In conclusion, we studied the proteomics profiling during the bulblets formation and development of Lilium davidii var. unicolor. The present study revealed that the metabolic pathway, biosynthesis of secondary metabolites and microbial metabolism in diverse environments were the most enriched pathways, which may promote energy formation, and protein synthesis process in lily bulblet development. LdGASA was confirmed to play a role in lily bulblet development. We believe that further functional analysis focusing on the single crucial proteins involved in the developmental process is a critical need for the future. That will provide more precise information about the mechanisms underlying lily bulb development.
-
The authors confirm contribution to the paper as follows: study conception and design: Yang Y, Liu W; data collection: Bai Y, Zhang R; analysis and interpretation of results: Li X, Hu X, Wang W; draft manuscript preparation: Li X, Zhou L. All authors reviewed the results and approved the final version of the manuscript.
-
The datasets generated during and/or analyzed during the current study are available from the corresponding author on reasonable request.
This work was supported by the China Postdoctoral Science Foundation (2021M693845) and the President Funding of Liaoning Academy of Agricultural Sciences (2023MS0501).
-
The authors declare that they have no conflict of interest.
- Supplemental Fig. S1 Venn diagram of DEPs among different bulblets development stages. The numbers of the unique and common differentially accumulated proteins among different stages are indicated. a The down-regulated DEPs, b The up-regulated DEPs.
- Supplemental Fig. S2 Quantitative RT-PCR analysis of AtGASAs transcript levels in transgenic Arabidopsis L1 leaves. The values are the mean ±SD of three independent biological replicates. Lowercase and uppercase letters indicate statistically significant differences at p < 0.05 and p < 0.01 respectively as determined by Duncan’s test.
- Supplemental Table S1 Sequences of primer used in this study.
- Supplemental Table S2 Pathway enrichment analysis of proteins during lily bulblets developtment.
- Supplemental Table S3 DEPs differentially expressed in all of the comparisons.
- Supplemental Table S4 Main parts of KEGG enrichment pathways
- Copyright: © 2024 by the author(s). Published by Maximum Academic Press, Fayetteville, GA. This article is an open access article distributed under Creative Commons Attribution License (CC BY 4.0), visit https://creativecommons.org/licenses/by/4.0/.
-
About this article
Cite this article
Li X, Bai Y, Hu X, Wang W, Zhou L, et al. 2024. iTRAQ-base quantitative proteomic analysis of bulblets development in Lilium davidii var. unicolor and LdGASA plays important roles during plant development. Ornamental Plant Research 4: e012 doi: 10.48130/opr-0024-0010 

iTRAQ-base quantitative proteomic analysis of bulblets development in Lilium davidii var. unicolor and LdGASA plays important roles during plant development
- Received: 28 December 2023
- Revised: 01 March 2024
- Accepted: 04 March 2024
- Published online: 06 May 2024
Abstract: Lilium davidii var. unicolor is an important edible Llilium species in China. In this study, we investigated the regulatory proteins and pathways affecting bulblet development through analyzing the proteomes among three developmental stages using the isobaric tags for relative and absolute quantitation proteomics approach. A total of 4,802 proteins were detected, 529, 735, and 637 proteins were differentially expressed between the 0 d vs 15 d, 15 d vs 30 d, 0 d vs 30 d stages, respectively. The Gene Otology and Kyoto Encyclopedia of Genes and Genomes analysis indicated that the metabolic pathway, biosynthesis of secondary metabolites and microbial metabolism in diverse environments were the most enriched pathways, which may promote energy formation and protein synthesis processes. Starch and sucrose metabolism was vital to Lilium bulblets development, and energy needed was opposite in the early and later stage of lily bulblets development. Many proteins were significantly regulated, among them LdGASA was detected as being extremely differentially expressed. We cloned the full length of LdGASA, analyzed its expression profile during lily bulblet development, and constructed its overexpression vector and transformed into Arabidopsis thaliana. The results showed that the full length of LdGASA was 725 bp, and the CDS sequence was 336 bp, LdGASA was mainly expressed at the morphogenesis and development stages of bulblets, and reached the highest at the basic morphogenesis of bulblets (35 d), Arabidopsis thaliana transformation with LdGASA presented stronger growth. These results not only deepened our understanding of the bulblets proteome, but also uncovered new insights into lily bulblet enlargement.