-
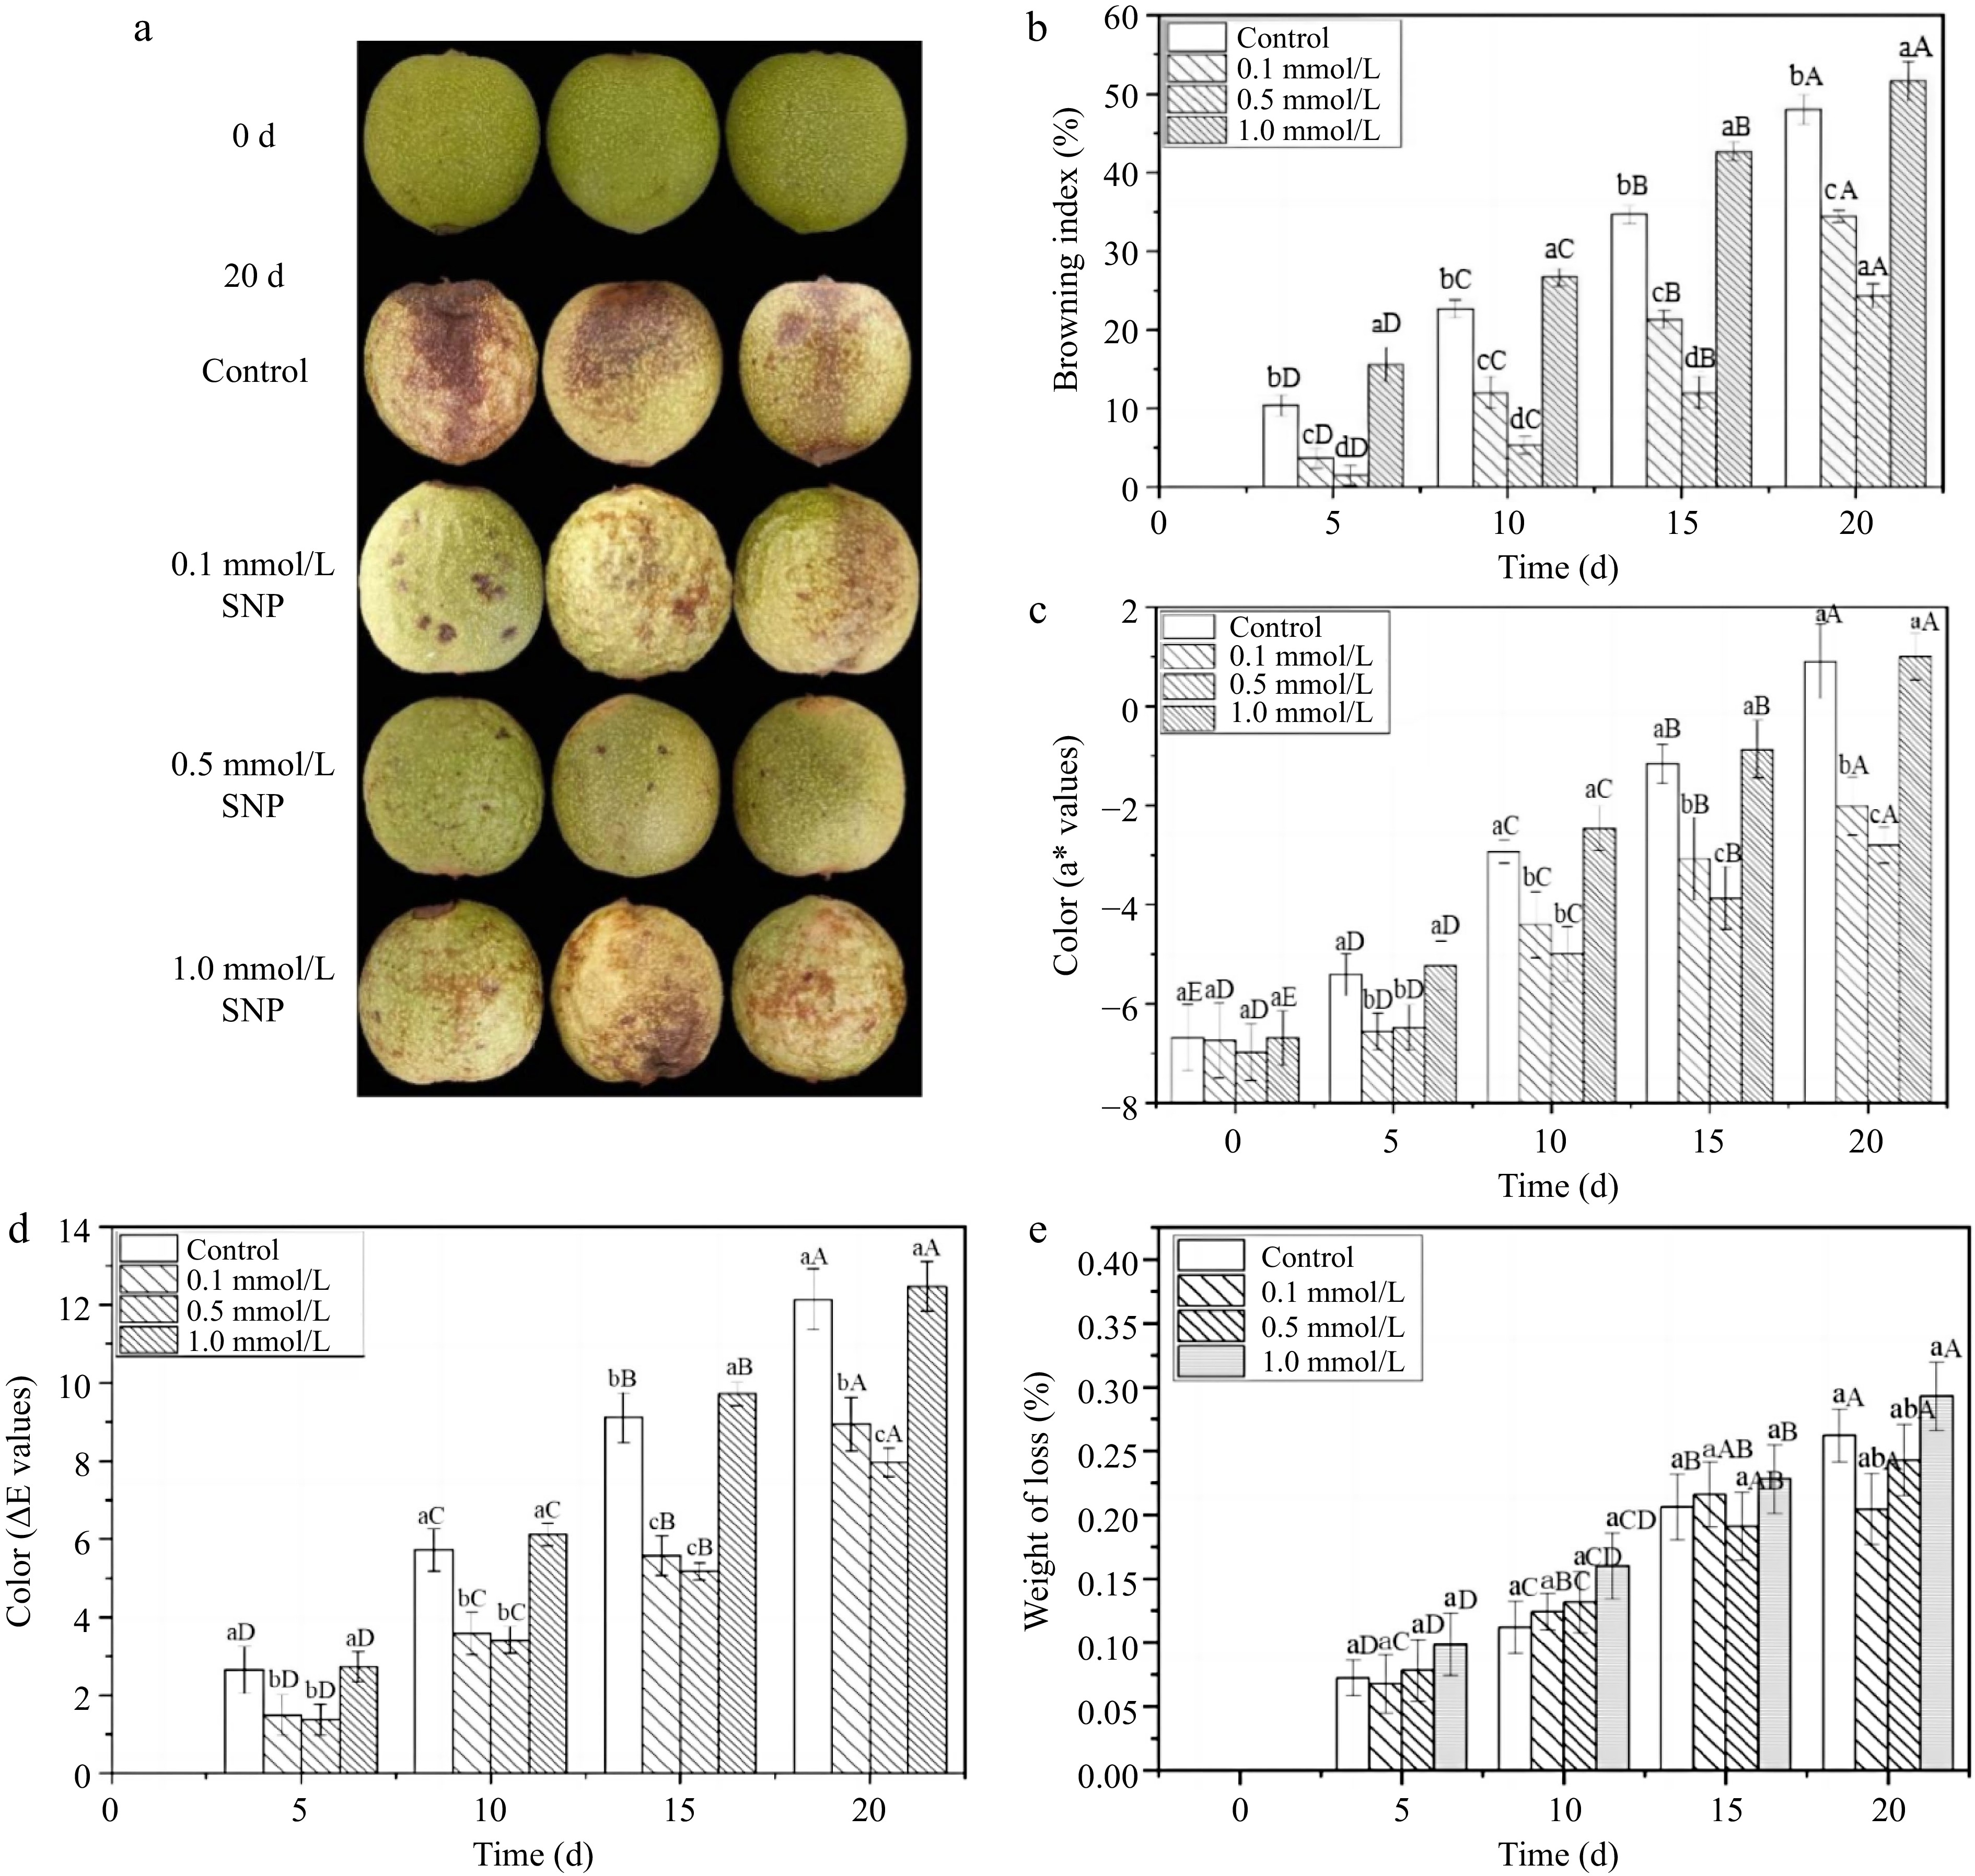
Figure 1.
The appearance quality and freshness of fresh walnut peels under different treatments. (a) Photographs, (b) browning index, (c) a* value changes, (d) ΔE total chromatic difference, (e) weight of loss in distilled water (Control) and SNP (0.1%, 0.5%, and 1.0%) during storage at 24 °C. Values are presented as the means ± standard errors. Lowercase letters indicate different processing groups under the same time conditions; capital letters indicate different times at the same treatment group level. The different letters indicate significant difference (p ≤ 0.05).
-

Figure 2.
The decay rate and disease resistance of fresh walnut peels under different treatments. (a) Decay index, (b) CHI activities, (c) GLU activities in distilled water (Control) and SNP (0.1%, 0.5%, and 1.0%) during storage at 24°C. Values are presented as the means ± standard errors. Lowercase letters indicate different processing groups under the same time conditions; capital letters indicate different times at the same treatment group level. The different letters indicate significant difference (p ≤ 0.05).
-
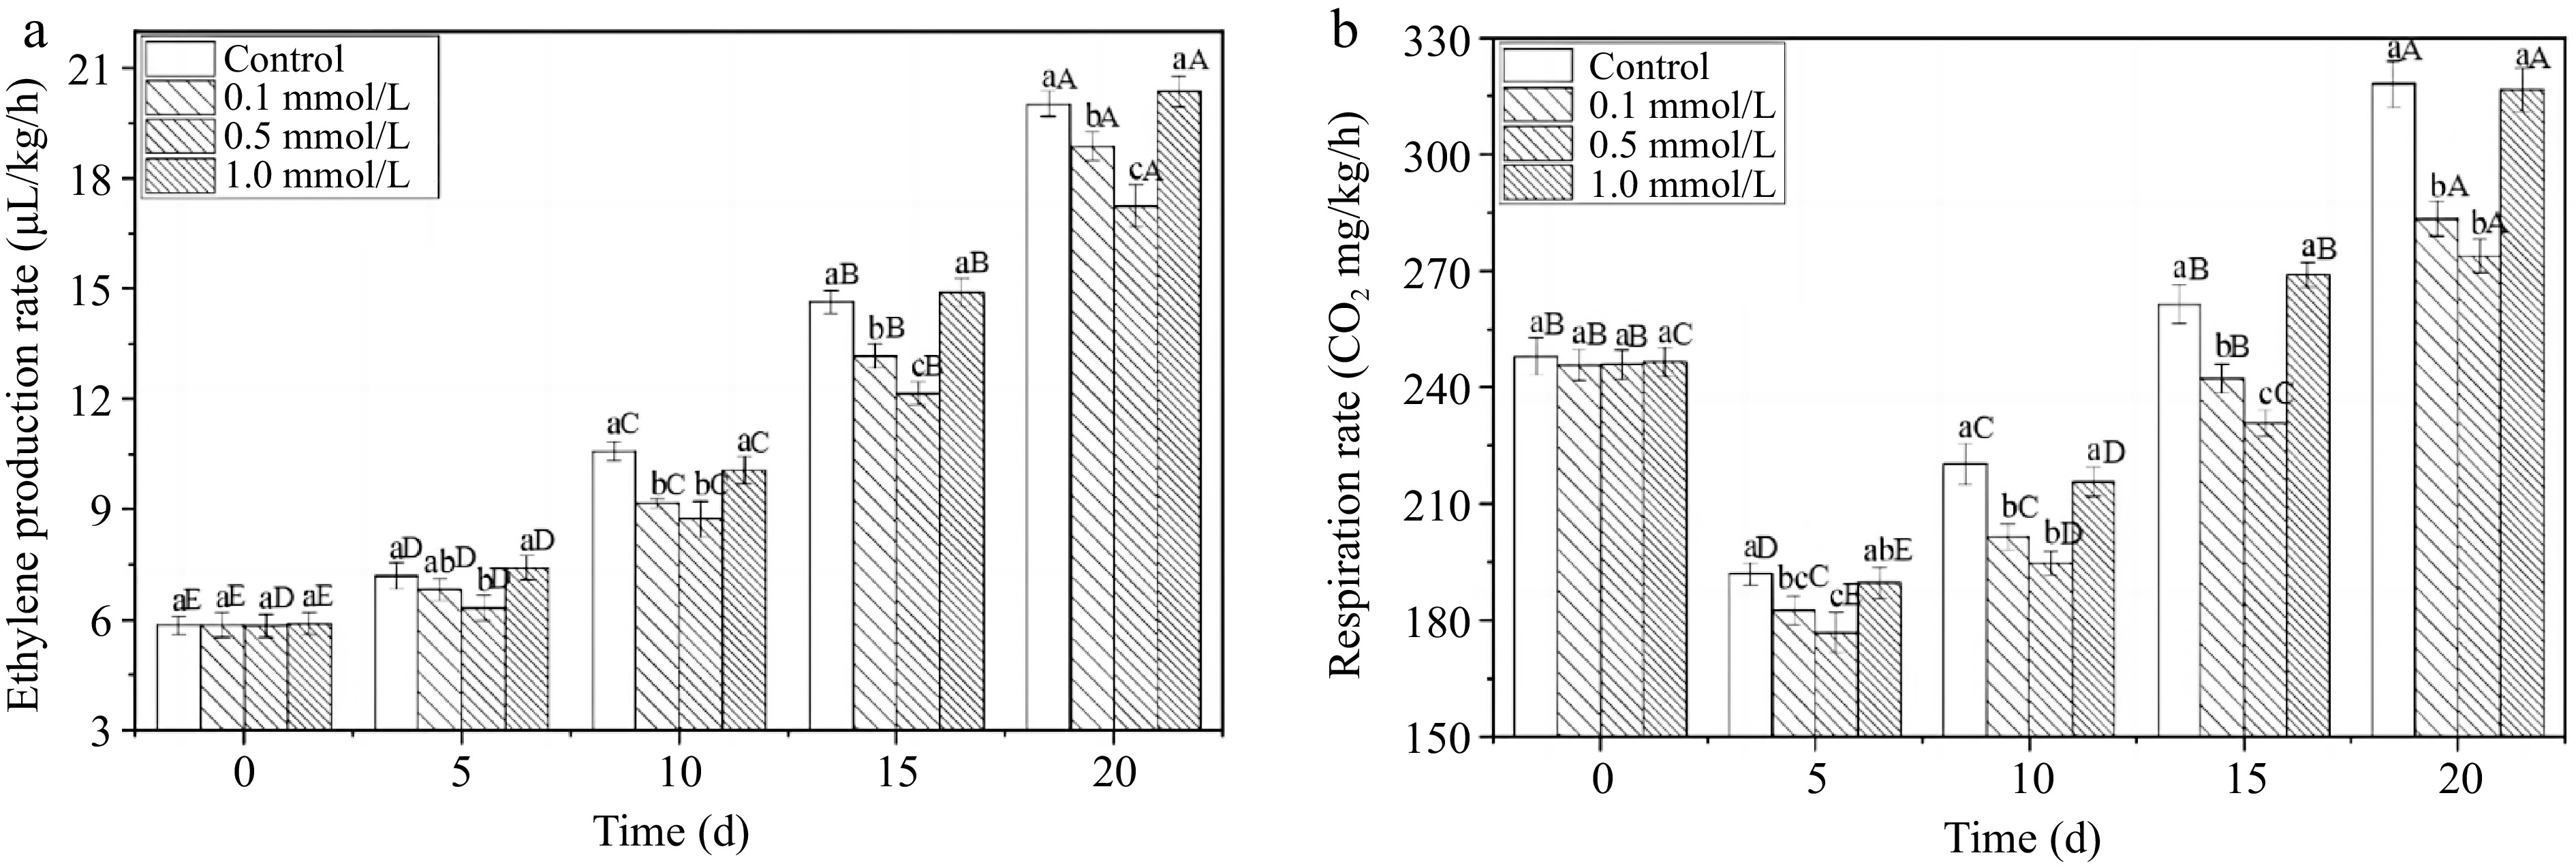
Figure 3.
The ethylene production rate and respiration rate of fresh walnut peels under different treatments. (a) Ethylene production rate, (b) respiration rate in distilled water (Control) and SNP (0.1%, 0.5%, and 1.0%) during storage at 24 °C. Values are presented as the means ± standard errors. Lowercase letters indicate different processing groups under the same time conditions; capital letters indicate different times at the same treatment group level. The different letters indicate significant difference (p ≤ 0.05).
-
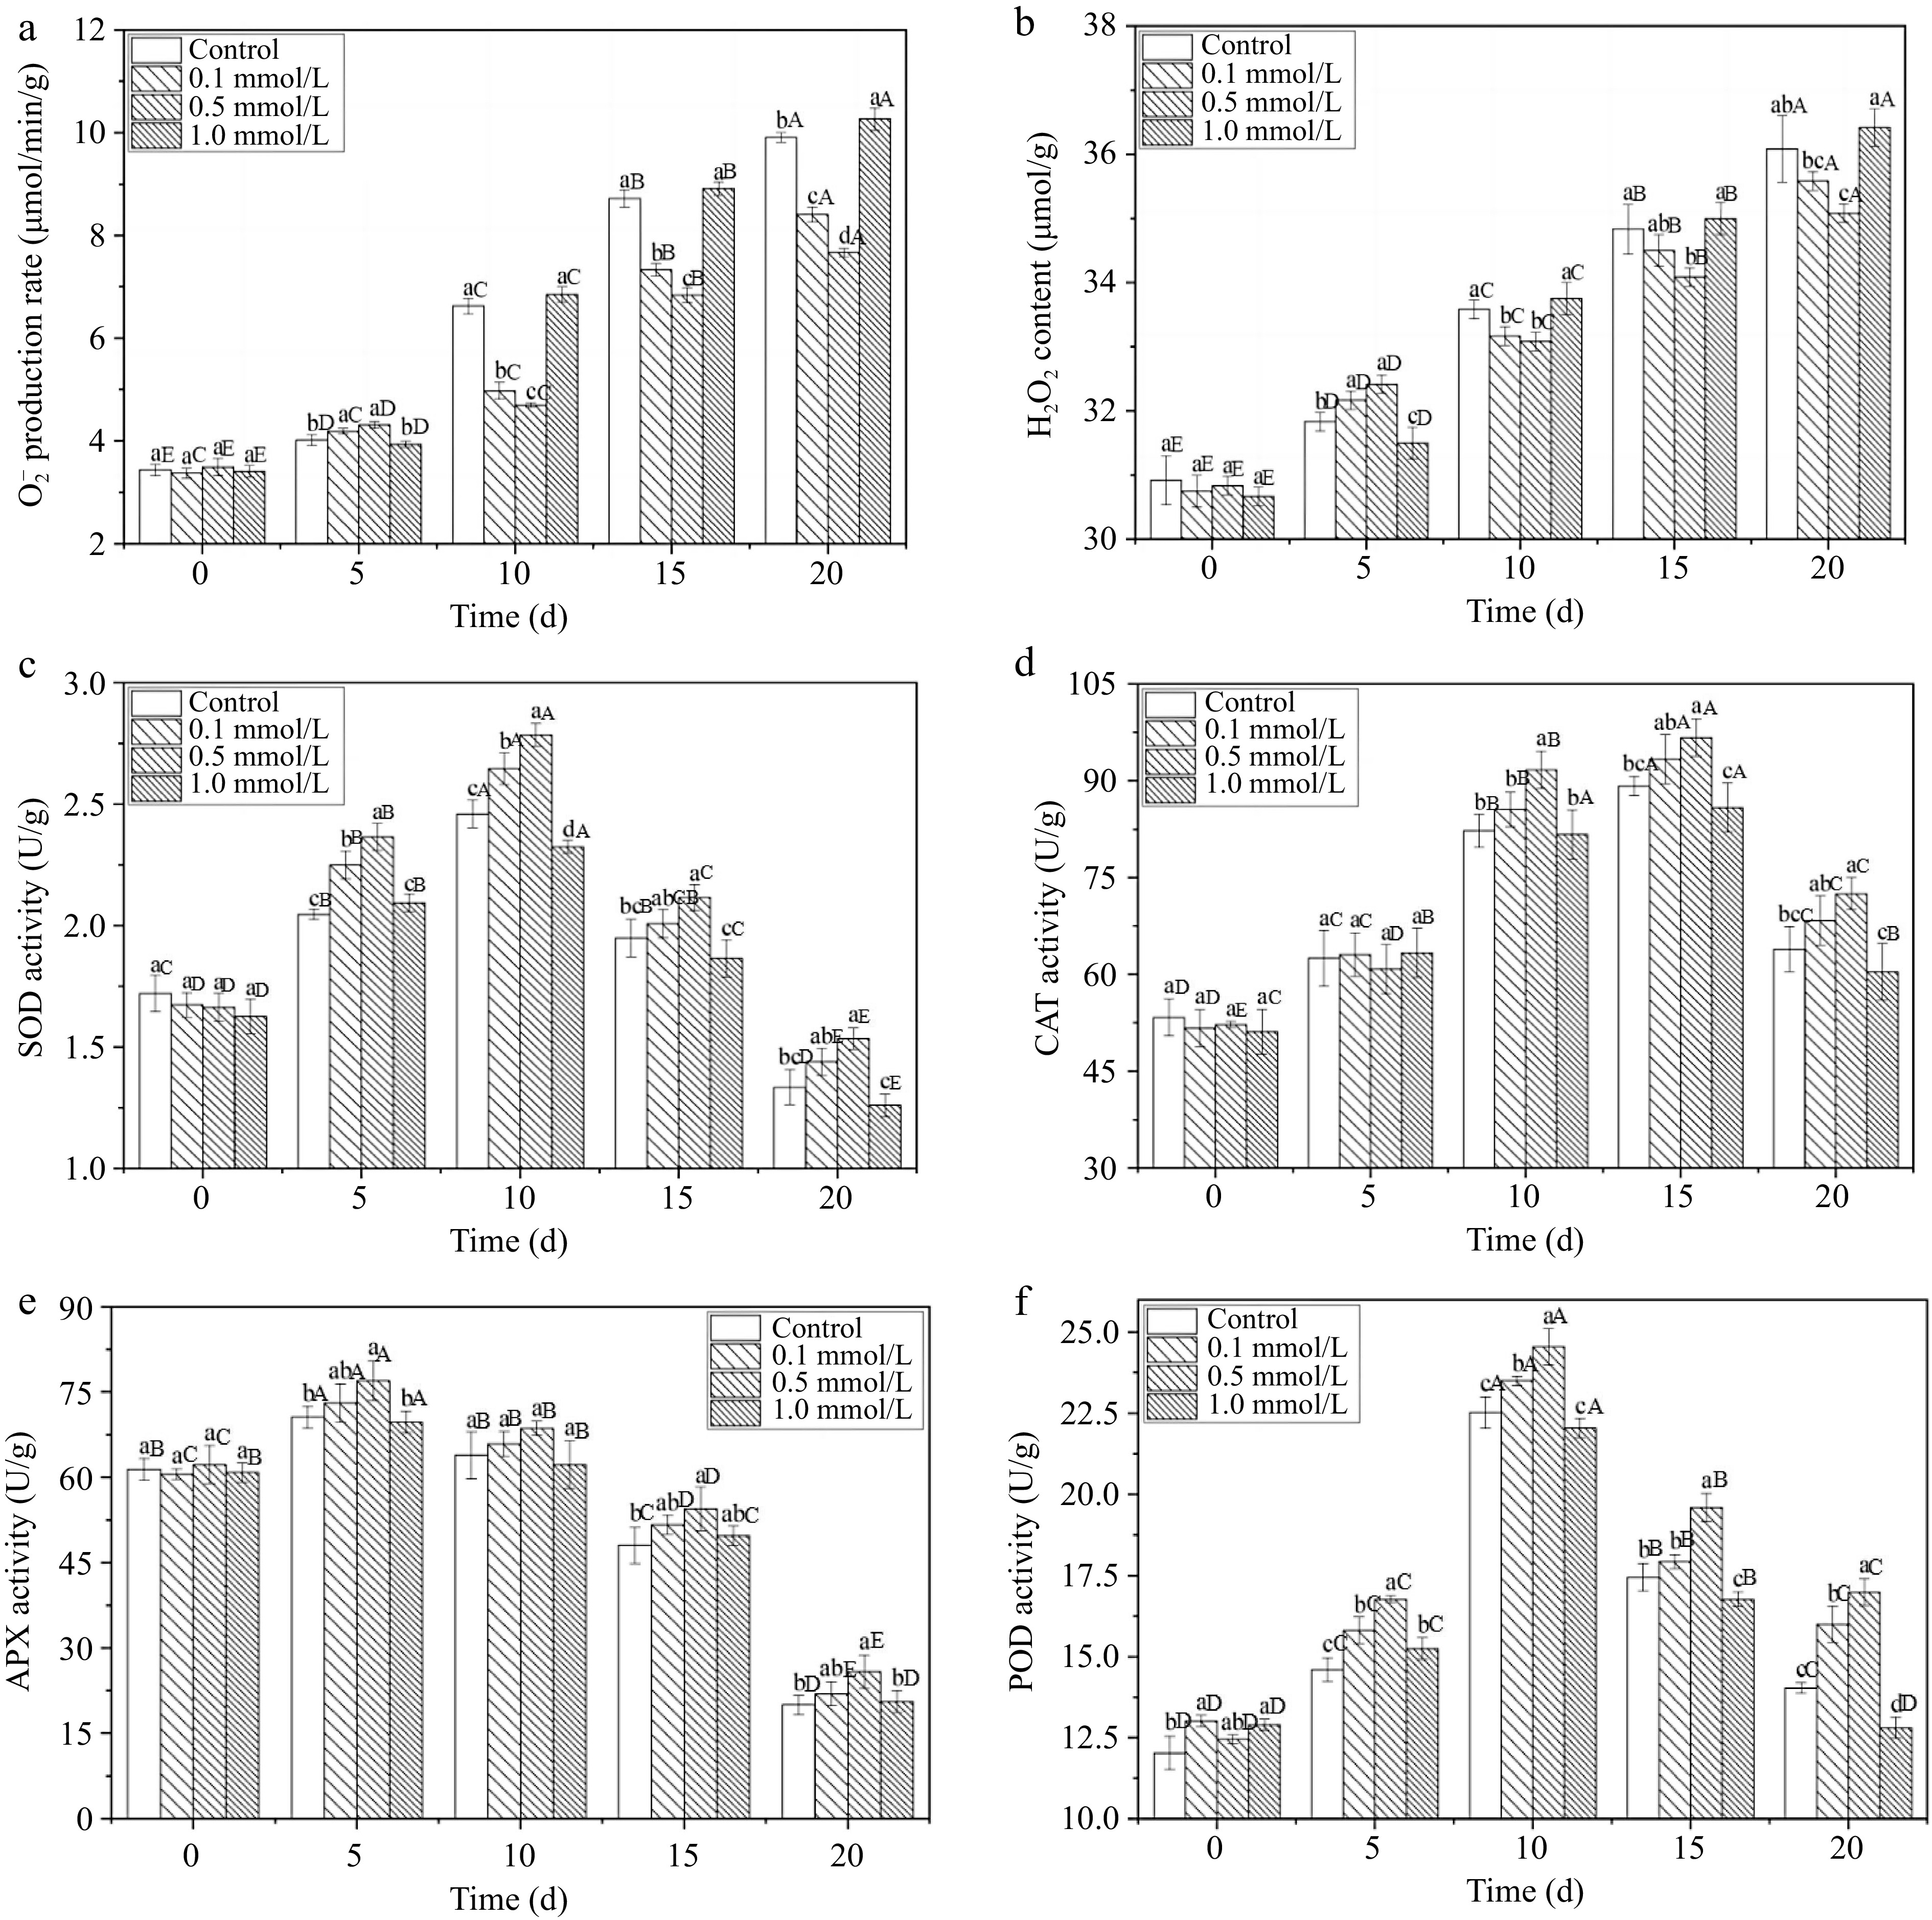
Figure 4.
The ROS-redox balance of fresh walnut peels under different treatments. (a) O2•− production rate, (b) H2O2 content, (c) SOD: superoxide dismutase, (d) CAT: catalase, (e) APX: ascorbic acid peroxidase, (f) POD: peroxidase in distilled water (Control) and SNP (0.1%, 0.5%, and 1.0%) during storage at 24°C. Values are presented as the means ± standard errors. Lowercase letters indicate different processing groups under the same time conditions; capital letters indicate different times at the same treatment group level. The different letters indicate significant difference (p ≤ 0.05).
-
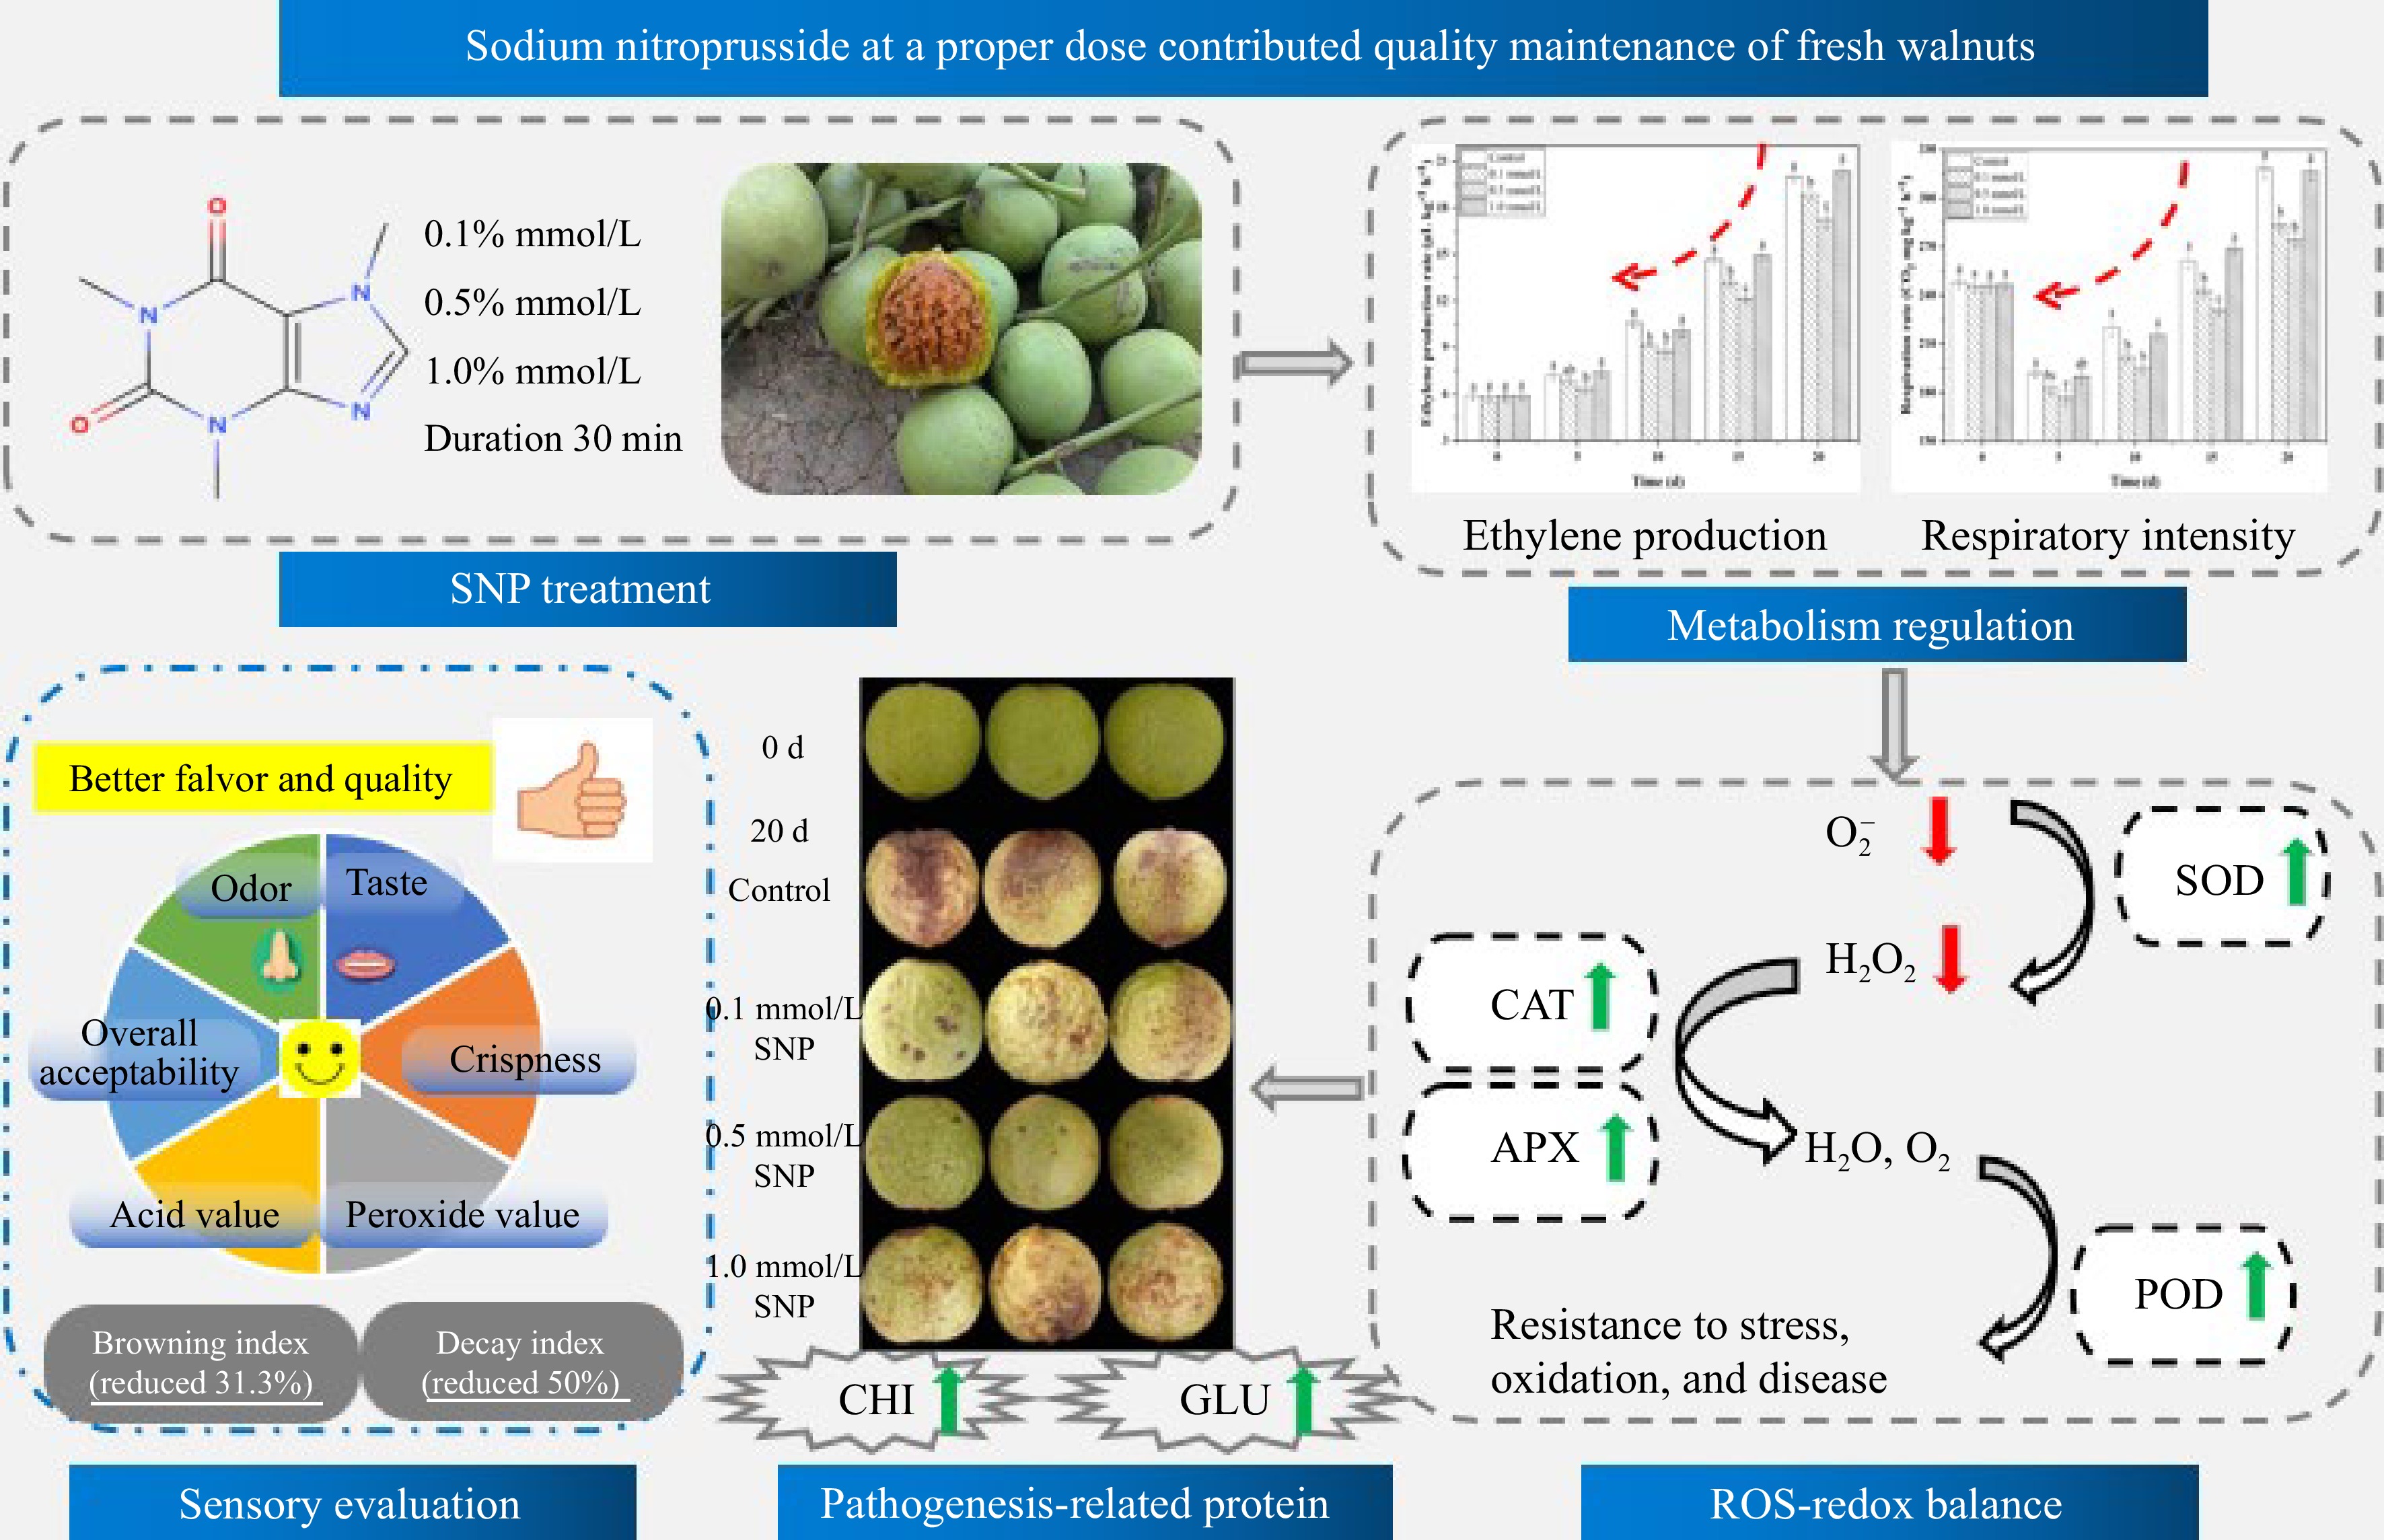
Figure 5.
Possible mechanism whereby treatments of SNP treatment maintain the postharvest quality of fresh walnuts.
-
0 d 20 d CK 0.1 mmol/L SNP 0.5 mmol/L SNP 1.0 mmol/L SNP CK 0.1 mmol/L SNP 0.5 mmol/L SNP 1.0 mmol/L SNP Color of seeds 9.00 ± 0.00aA 9.00 ± 0.00aA 9.00 ± 0.00aA 9.00 ± 0.00aA 3.40 ± 0.51bB 3.87 ± 0.64abB 4.33 ± 0.72aB 3.53 ± 0.52bB Color of walnut kernel 9.00 ± 0.00aA 9.00 ± 0.00aA 9.00 ± 0.00aA 9.00 ± 0.00aA 6.67 ± 0.72bB 6.93 ± 0.80abB 7.33 ± 0.49aB 6.60 ± 0.51bB Odor 9.00 ± 0.00aA 9.00 ± 0.00aA 9.00 ± 0.00aA 9.00 ± 0.00aA 4.20 ± 0.77bB 5.53 ± 0.64aB 6.07 ± 0.80aB 4.13 ± 0.52bB Taste 9.00 ± 0.00aA 9.00 ± 0.00aA 9.00 ± 0.00aA 9.00 ± 0.00aA 4.33 ± 0.62bB 5.33 ± 0.90aB 5.67 ± 0.98aB 4.26 ± 0.59bB Crispness 9.00 ± 0.00aA 9.00 ± 0.00aA 9.00 ± 0.00aA 9.00 ± 0.00aA 4.87 ± 0.64bcB 5.47 ± 0.64bB 6.67 ± 0.90aB 4.53 ± 0.74cB Overll consumer
acceptance9.00 ± 0.00aA 9.00 ± 0.00aA 9.00 ± 0.00aA 9.00 ± 0.00aA 4.69 ± 0.26cB 5.43 ± 0.45bB 6.01 ± 0.29aB 4.61 ± 0.31cB AV (mg/g) 0.39 ± 0.01aB 0.37 ± 0.04aB 0.36 ± 0.04aB 0.37 ± 0.04aB 0.99 ± 0.05aA 0.87 ± 0.07aA 0.71 ± 0.06bA 0.95 ± 0.09aA POV (mg/100g) 0.11 ± 0.01aB 0.10 ± 0.01aB 0.11 ± 0.01aB 0.10 ± 0.01aB 0.32 ± 0.03aA 0.28 ± 0.01abA 0.25 ± 0.01bA 0.31 ± 0.02aA Lowercase letters indicate different processing groups under the same time conditions; uppercase letters indicate different times at the same treatment group level. The different letters indicate significant difference (p ≤ 0.05). Table 1.
Sensory evaluation, acid value, and peroxide value of fresh walnut kernels in distilled water (Control) and SNP (0.1%, 0.5%, and 1.0%) during storage at 24°C.
Figures
(5)
Tables
(1)