-
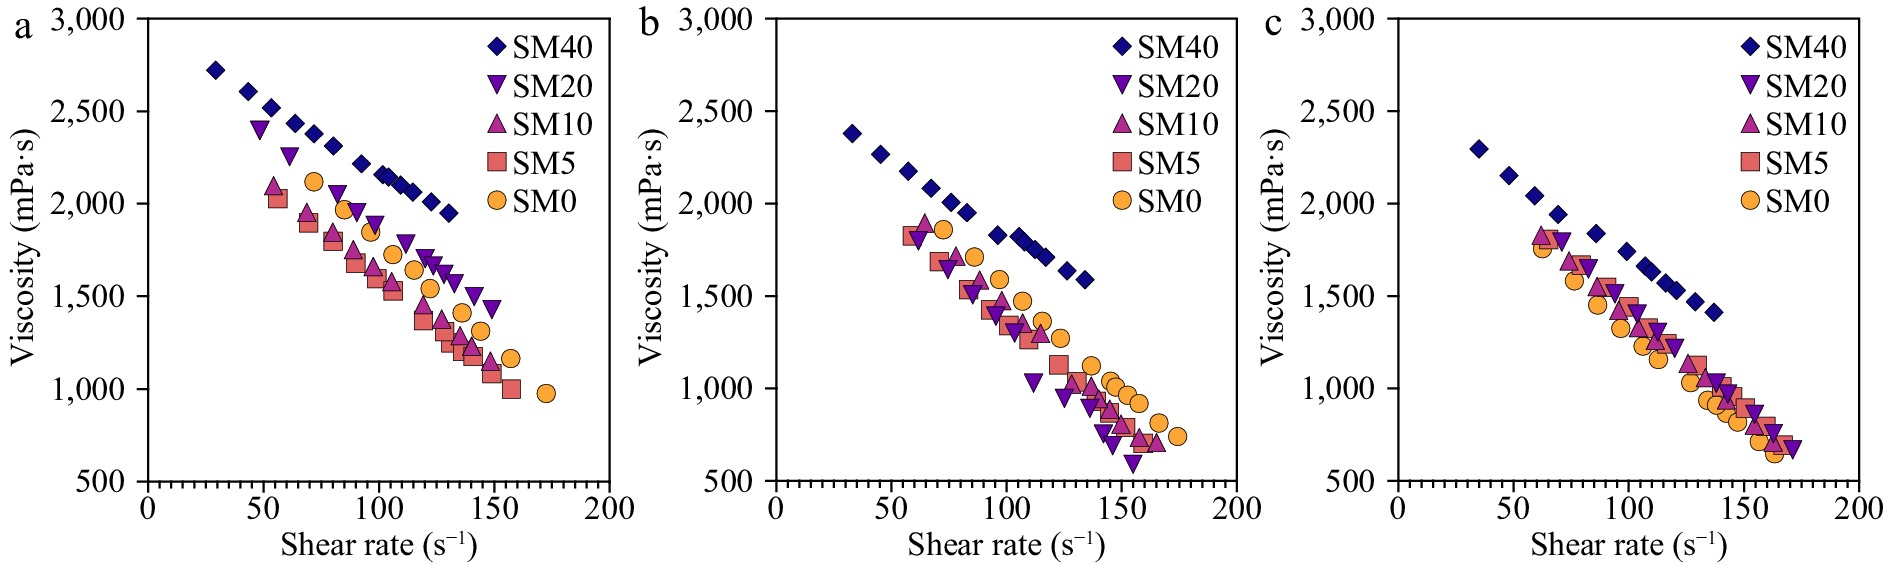
Figure 1.
Viscosity curves for diluted avocado pulp at (a) 4 °C, (b) 25 °C, and (c) 37 °C.
-
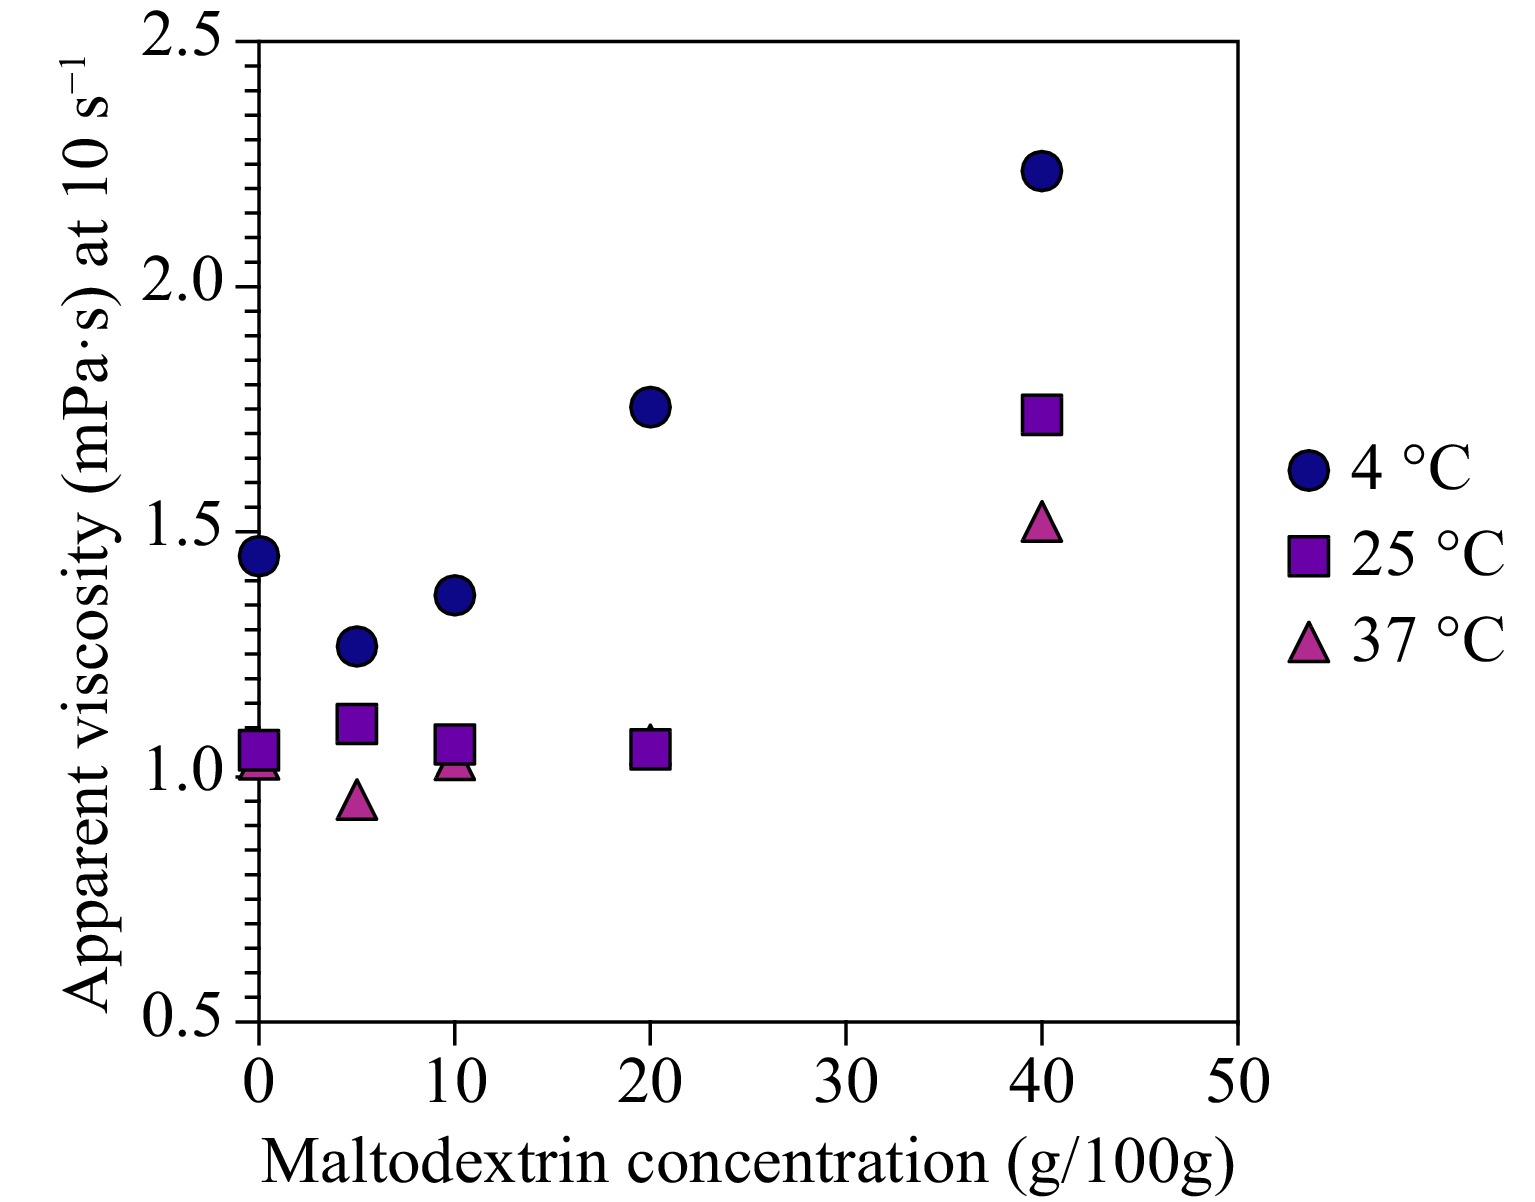
Figure 2.
Effect of maltodextrin concentration on the apparent viscosity of diluted avocado pulp at 10 s−1 shear rate.
-
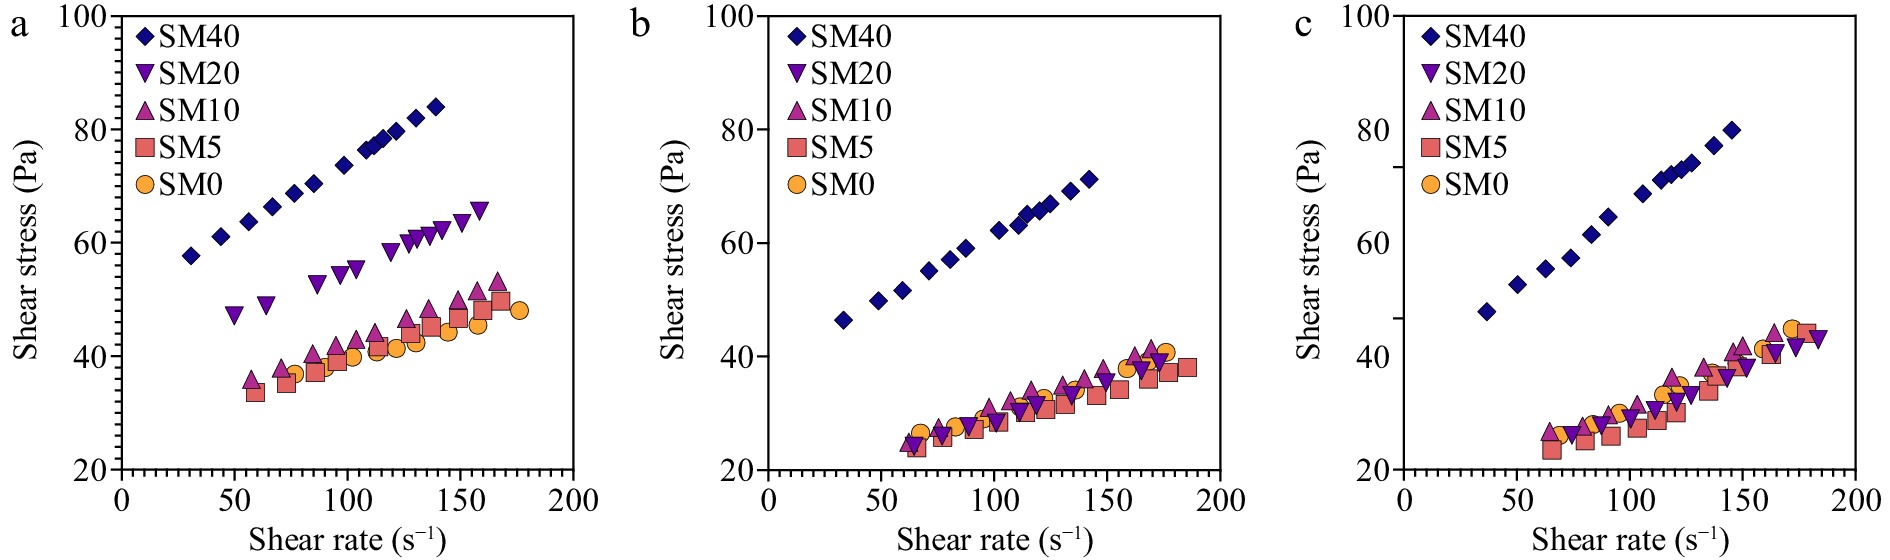
Figure 3.
–Flow curves for avocado formulations at (a) 4 °C, (b) 25 °C, and (c) 37 °C modelled using Ostwald-Waelle models.
-
Formulations Unit SM0 SM5 SM10 SM20 SM40 Avocado g 450 450 450 450 450 Water g 1000 1000 1000 1000 1000 Maltodextrin g 0 75.5 151 302 604 Chemical composition Water g/100 g 91.40 ± 0.12 86.89 ± 0.21 82.72 ± 0.20 75.62 ± 0.17 64.53 ± 0.19 Protein g/100 g 0.61 ± 0.007 0.59 ± 0.004 0.55 ± 0.002 0.50 ± 0.002 0.42 ± 0.001 Lipids g/100 g 4.78 ± 0.005 4.61 ± 0.005 4.33 ± 0.003 3.95 ± 0.005 3.35 ± 0.003 Ash g/100 g 0.52 ± 0.008 0.46 ± 0.0007 0.47 ± 0.001 0.45 ± 0.002 0.38 ± 0.005 Carbohydrates g/100 g 2.68 ± 0.005 7.52 ± 0.05 11.86 ± 0.04 19.45 ± 0.04 31.31 ± 0.03 Table 1.
Tested avocado formulations and respective chemical composition.
-
Samples Temperature (°C) τ0 (Pa·s) K (Pa·s) R2 K (Pa·sn) n R2 η0 (Pa·s) αC (s) γC (s−1) m R2 SM0 4 18.26 ± 0.15 0.057 ± 0.002 0.9709 8.764 ± 0.1 0.22 ± 0.01 0.9985 1.1E+03 ± 100 1145 ± 115 8.7E-04 ± 0.0001 0.8 ± 0.08 0.9986 25 13.17 ± 0.12 0.060 ± 0.003 0.9956 5.681 ± 0.08 0.27 ± 0.01 0.9995 1.4E+04 ± 1400 1486 ± 149 6.7E-04 ± 0.00007 0.86 ± 0.086 0.9965 37 13.00 ± 0.10 0.054 ± 0.002 0.9833 5.819 ± 0.07 0.25 ± 0.01 0.9966 9.4E+03 ± 940 4450 ± 445 2.2E-04 ± 0.00002 0.75 ± 0.075 0.9987 SM5 4 16.04 ± 0.18 0.095 ± 0.004 0.9839 6.503 ± 0.09 0.29 ± 0.01 0.9998 5.2E+03 ± 520 3661 ± 366 2.7E-04 ± 0.00003 0.70 ± 0.07 0.9998 25 13.75 ± 0.13 0.044 ± 0.002 0.9896 6.508 ± 0.08 0.23 ± 0.01 0.9965 2.4E+04 ± 2400 9180 ± 918 1.1E-04 ± 0.00001 0.77 ± 0.077 0.9996 37 11.96 ± 0.11 0.057 ± 0.003 0.9910 5.135 ± 0.06 0.27 ± 0.01 0.9948 2.2E+04 ± 2200 15803 ± 1580 6.3E-05 ± 0.000006 0.75 ± 0.075 0.9970 SM10 4 16.88 ± 0.14 0.105 ± 0.004 0.9886 6.738 ± 0.1 0.31 ± 0.01 0.9986 1.7E+03 ± 170 22939 ± 2294 4.4E-05 ± 0.000004 0.69 ± 0.069 0.9983 25 13.13 ± 0.12 0.071 ± 0.003 0.9784 5.452 ± 0.07 0.29 ± 0.01 0.9936 1.2E+03 ± 120 6864 ± 686 1.5E-04 ± 0.000015 0.75 ± 0.075 0.9993 37 12.94 ± 0.09 0.062 ± 0.003 0.9717 5.578 ± 0.06 0.27 ± 0.01 0.9953 9.9E+03 ± 990 4938 ± 494 2.0E-04 ± 0.00002 0.75 ± 0.075 0.9993 SM20 4 21.38 ± 0.20 0.179 ± 0.005 0.9932 7.831 ± 0.11 0.35 ± 0.01 0.9975 1.4E+04 ± 1400 24449 ± 2445 4.1E-05 ± 0.000004 0.66 ± 0.066 0.9991 25 12.71 ± 0.11 0.063 ± 0.002 0.9915 5.393 ± 0.07 0.31 ± 0.01 0.9920 1.2E+04 ± 1200 17054 ± 1705 5.9E-05 ± 0.000006 0.72 ± 0.072 0.9894 37 13.08 ± 0.10 0.047 ± 0.002 0.9914 6.081 ± 0.08 0.27 ± 0.01 0.9917 2.8E+04 ± 2800 14109 ± 1411 7.1E-05 ± 0.000007 0.77 ± 0.077 0.9994 SM40 4 24.84 ± 0.25 0.472 ± 0.01 0.9946 7.429 ± 0.12 0.48 ± 0.02 0.9991 3.7E+03 ± 370 41626 ± 4163 2.4E-05 ± 0.000002 0.53 ± 0.053 0.9989 25 19.41 ± 0.18 0.314 ± 0.008 0.9874 6.026 ± 0.09 0.46 ± 0.02 0.9976 6.3E+03 ± 630 131529 ± 13153 7.6E-06 ± 0.00000076 0.54 ± 0.054 0.9961 37 17.28 ± 0.15 0.248 ± 0.007 0.9872 5.509 ± 0.07 0.44 ± 0.02 0.9975 6.4E+03 ± 640 42249 ± 4225 2.4E-05 ± 0.000002 0.59 ± 0.059 0.9632 Table 2.
Parameters determined for Bingham and Ostwald-Waelle flow model, and Cross Viscosity Model.
-
Activation energy (kJ/mol) A (Pa·s) R2 SM0 5.96 ± 0.6 1.8E-2 ± 0.0016 0.9635 SM5 7.35 ± 0.33 1.1E-2 ± 0.0023 0.9734 SM10 8.32 ± 0.65 7.52E-3 ± 0.00049 0.9798 SM20 12.93 ± 0.34 2.25E-4 ± 0.0000345 0.9666 SM40 10.36 ± 0.23 8.23E-3 ± 0.000431 0.9943 Table 3.
Arrhenius-type equation parameters for apparent viscosity of diluted avocado pulp samples.
-
Maltodextrin
concentrationTemperature
(°C)Cohesiveness Consistency
(N)Firmness
(N)Viscosity
index (Pa·s)0 4 0.22 ± 0.01 7.81 ± 0.05 0.35 ± 0.02 0.47 ± 0.03 0 25 0.18 ± 0.01 6.97 ± 0.04 0.33 ± 0.02 0.31 ± 0.02 0 37 0.16 ± 0.01 5.69 ± 0.03 0.27 ± 0.01 0.17 ± 0.01 5% 4 0.22 ± 0.01 8.06 ± 0.05 0.36 ± 0.02 0.42 ± 0.03 5% 25 0.18 ± 0.01 7.52 ± 0.04 0.34 ± 0.02 0.37 ± 0.02 5% 37 0.17 ± 0.01 6.25 ± 0.03 0.29 ± 0.01 0.22 ± 0.01 10% 4 0.24 ± 0.01 8.14 ± 0.05 0.38 ± 0.02 0.44 ± 0.03 10% 25 0.19 ± 0.01 7.53 ± 0.04 0.35 ± 0.02 0.37 ± 0.02 10% 37 0.18 ± 0.01 7.29 ± 0.04 0.32 ± 0.01 0.27 ± 0.01 20% 4 0.32 ± 0.02 10.72 ± 0.06 0.42 ± 0.02 0.79 ± 0.04 20% 25 0.19 ± 0.01 7.82 ± 0.04 0.35 ± 0.02 0.35 ± 0.02 20% 37 0.17 ± 0.01 6.94 ± 0.04 0.35 ± 0.02 0.19 ± 0.01 40% 4 0.34 ± 0.02 12.09 ± 0.07 0.58 ± 0.03 0.99 ± 0.05 40% 25 0.28 ± 0.02 11.72 ± 0.06 0.57 ± 0.03 0.76 ± 0.04 40% 37 0.23 ± 0.01 8.75 ± 0.05 0.42 ± 0.02 0.42 ± 0.02 Table 4.
Instrumental texture analysis of avocado pulp samples with different maltodextrin concentrations at different temperatures.
Figures
(3)
Tables
(4)