-
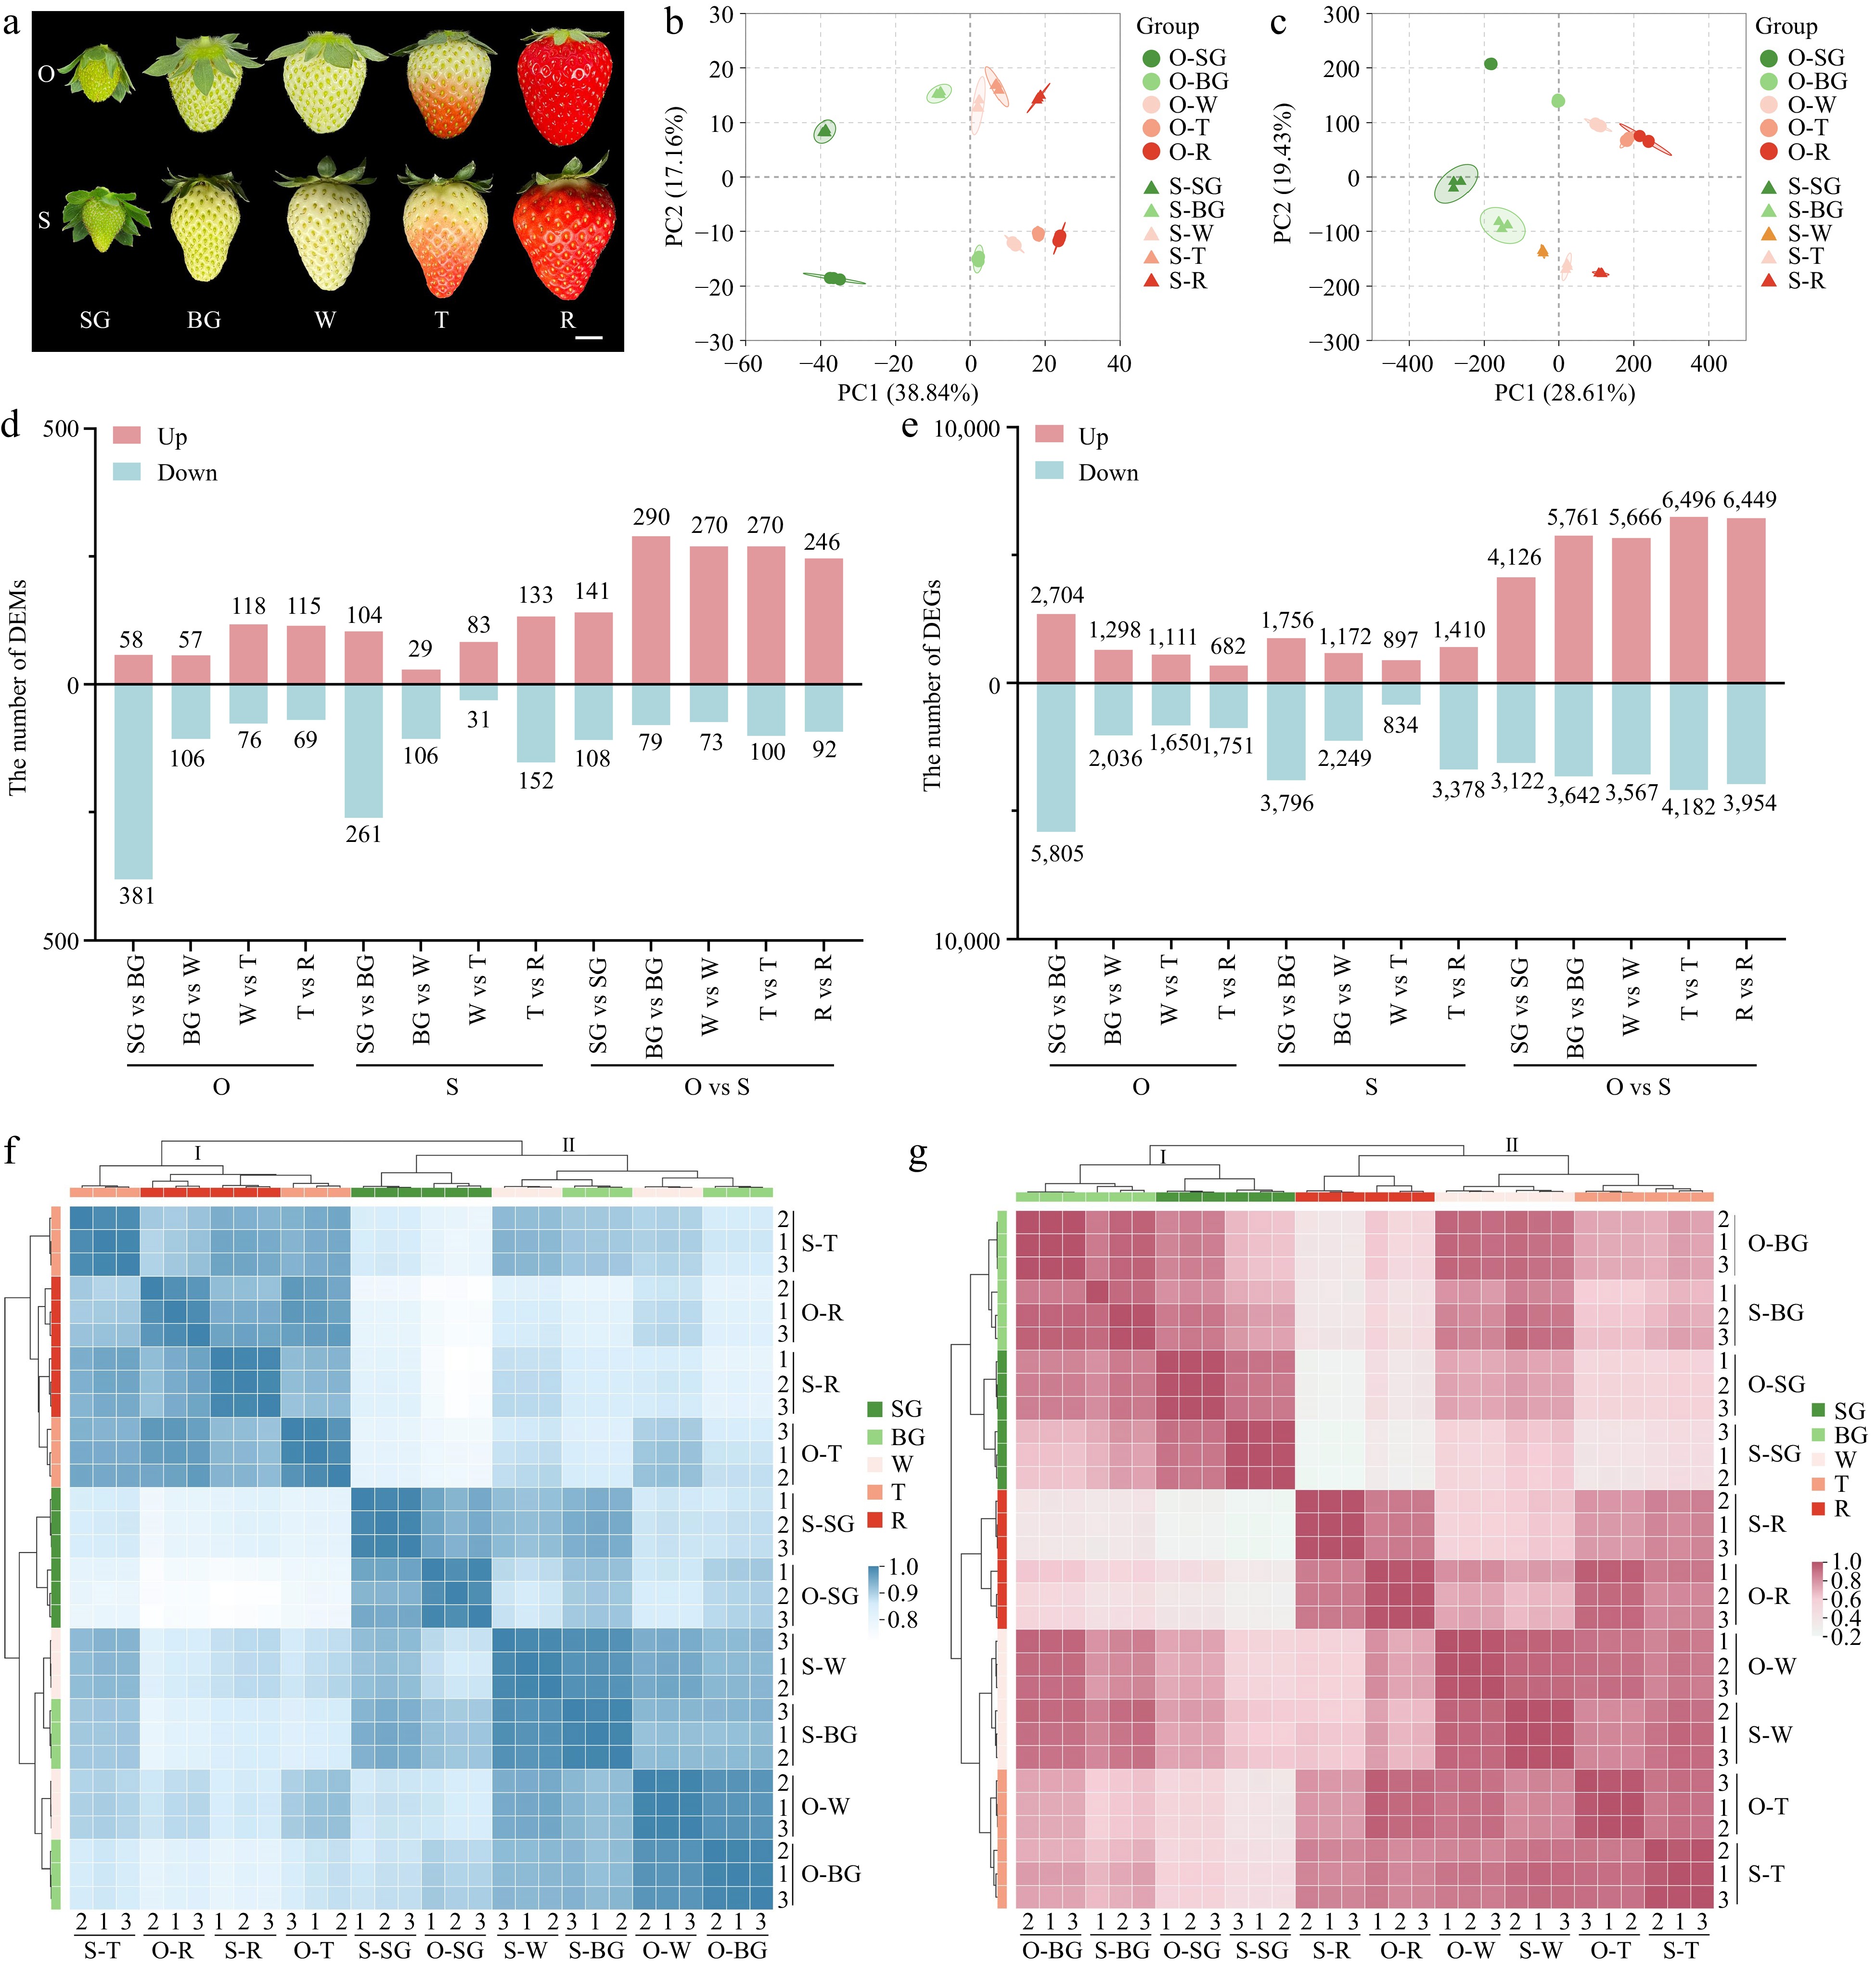
Figure 1.
Overview of metabolome and transcriptome. (a) Five developmental stages of 'OiC berry' and 'Sweet Charlie'. Small green fruit stage (SG), big green fruit stage (BG), white fruit stage (W), turning stage (T), red stage (R), O, 'OiC berry', S, 'Sweet Charlie'. Scale bar: 1 cm. Principal component analysis for (b) metabolome and (c) transcriptome. The number of (d) differentially accumulation metabolites (DAMs) and (e) genes (DEGs). Cluster analysis for (f) metabolome and (g) transcriptome.
-
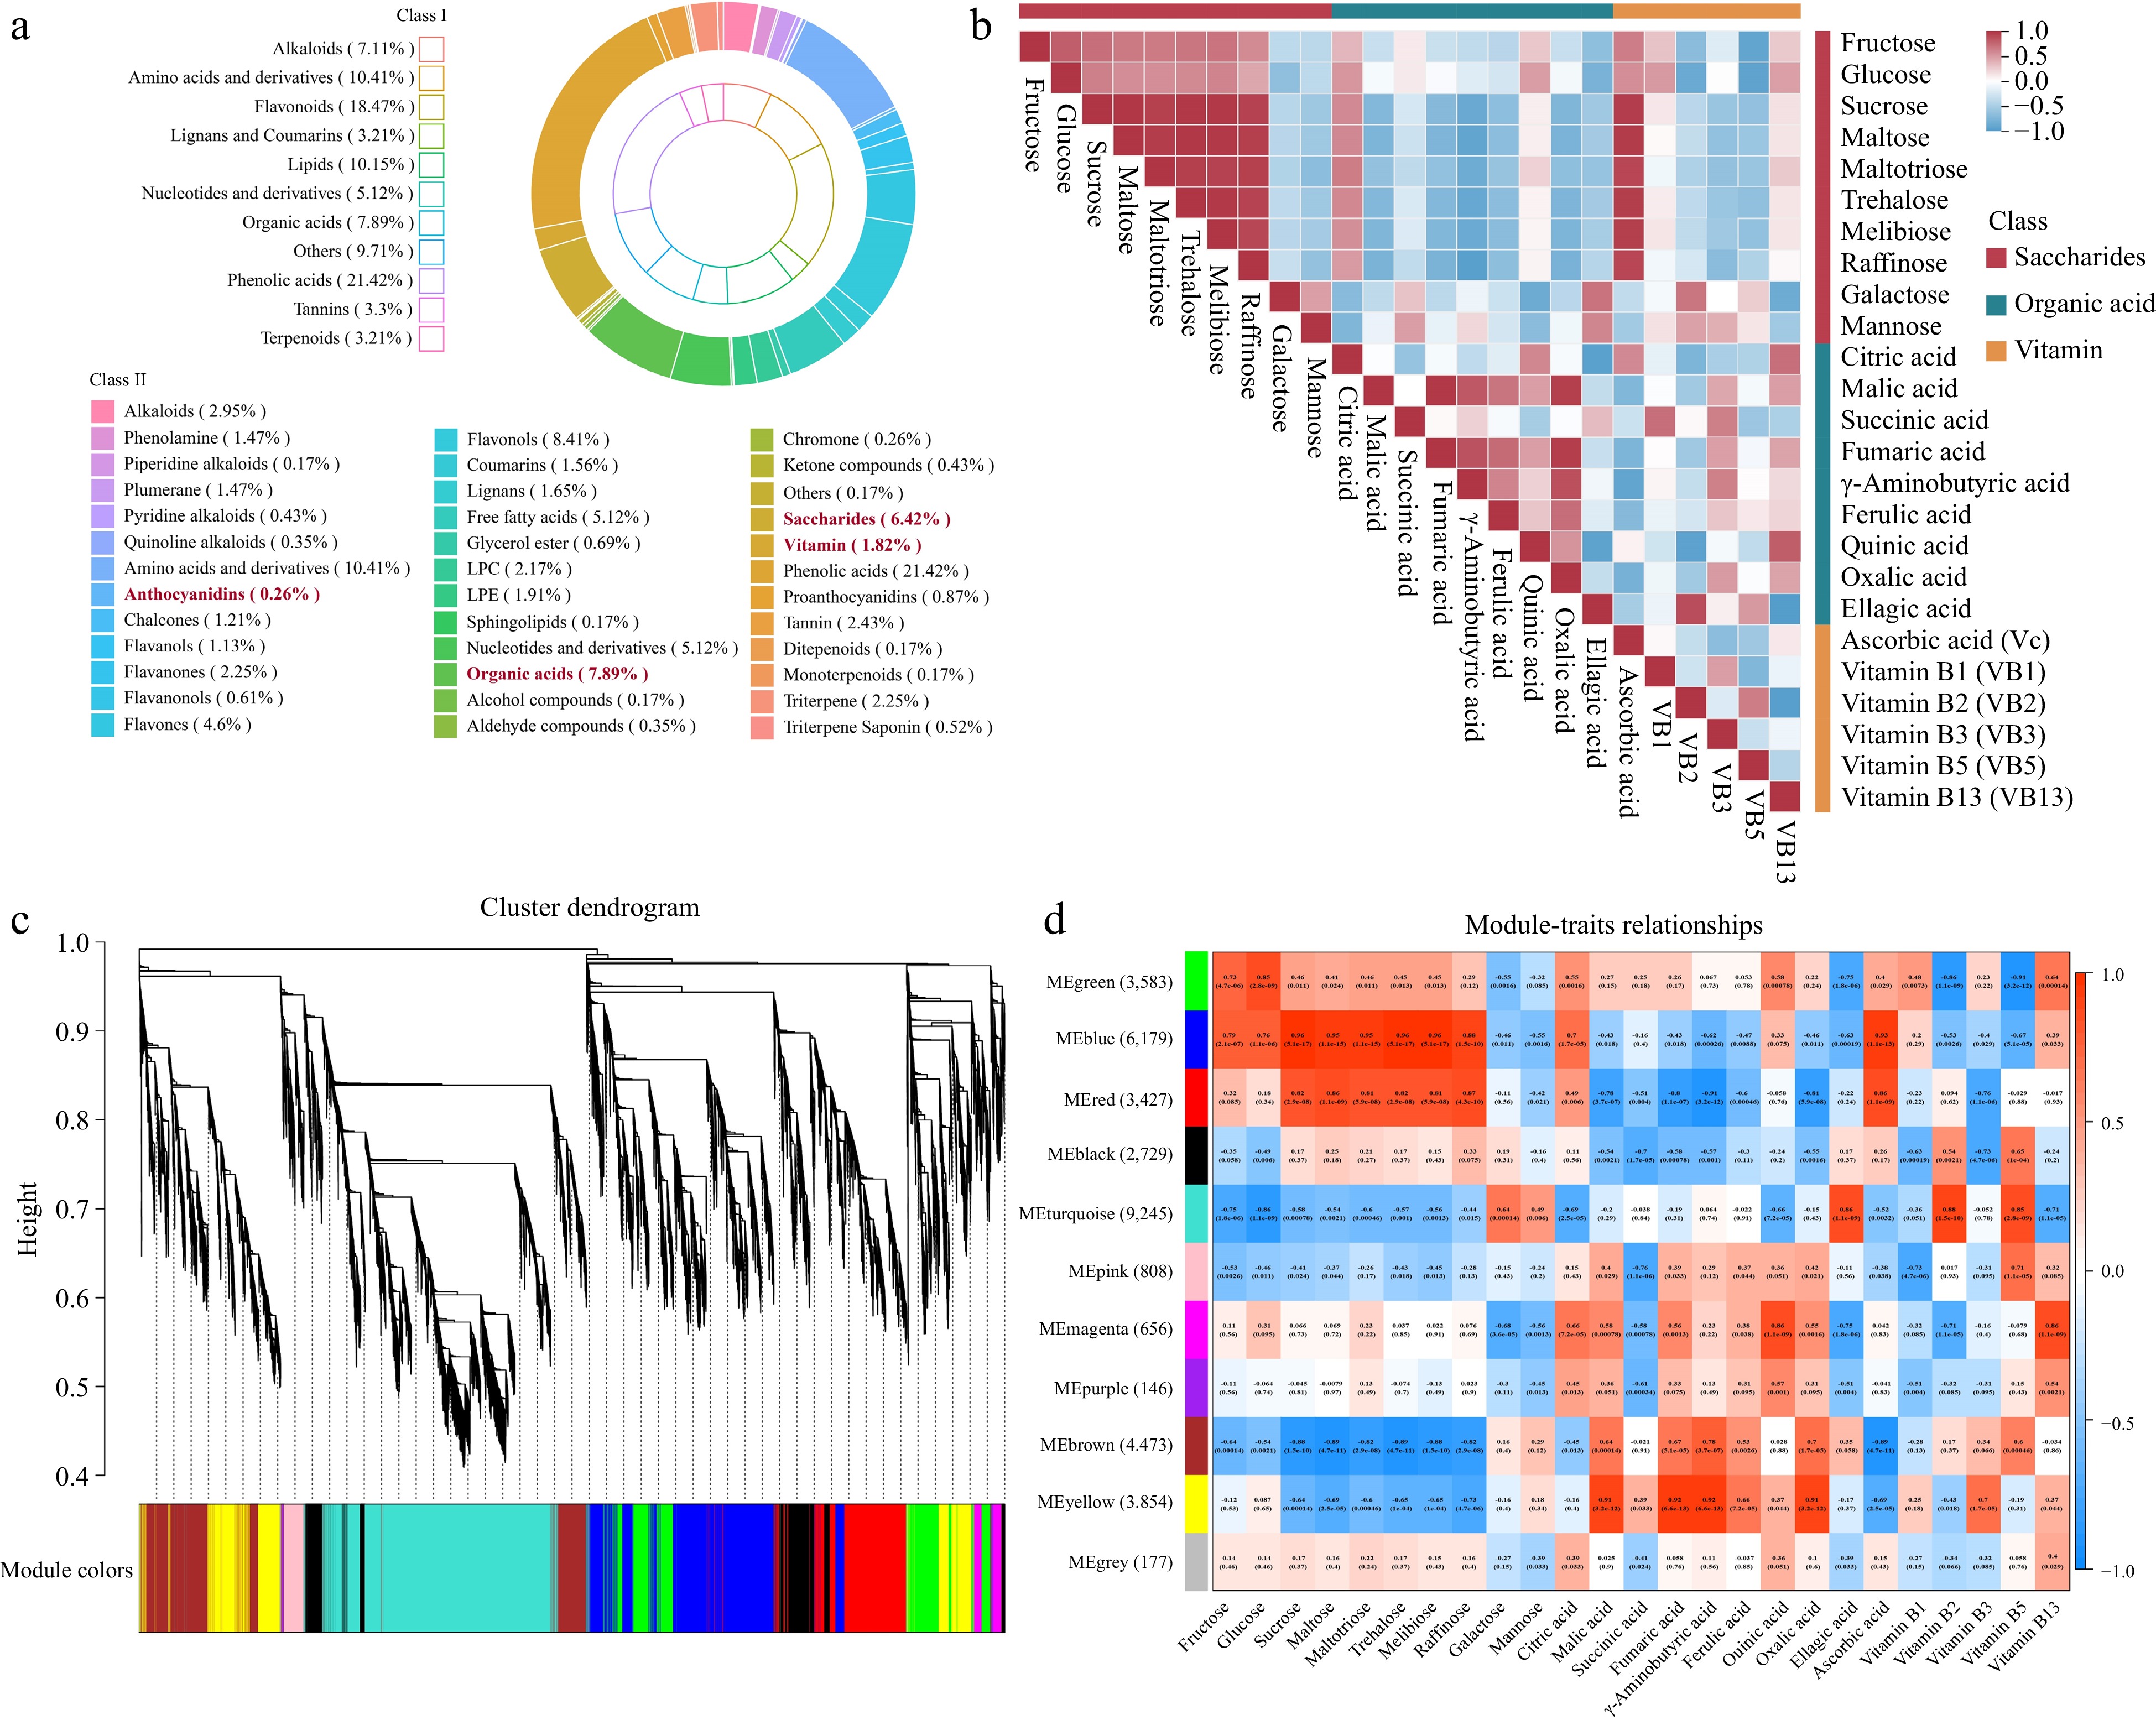
Figure 2.
Correlation analysis of transcriptomic and metabolic during five fruit stages in strawberry. (a) The different categories of metabolites in five developmental stages of 'OiC berry' and 'Sweet Charlie'. (b) Heatmap of correlations between metabolites. (c) Dendrogram indicating co-expression modules analyzed by WGCNA during five fruit stages. (d) Heatmap showing correlations between gene modules and metabolites. Each column in different colors representative a gene module. Every row represents a metabolite. Red color and blue color indicate positive and negative correlation between the gene clusters and the metabolites respectively.
-
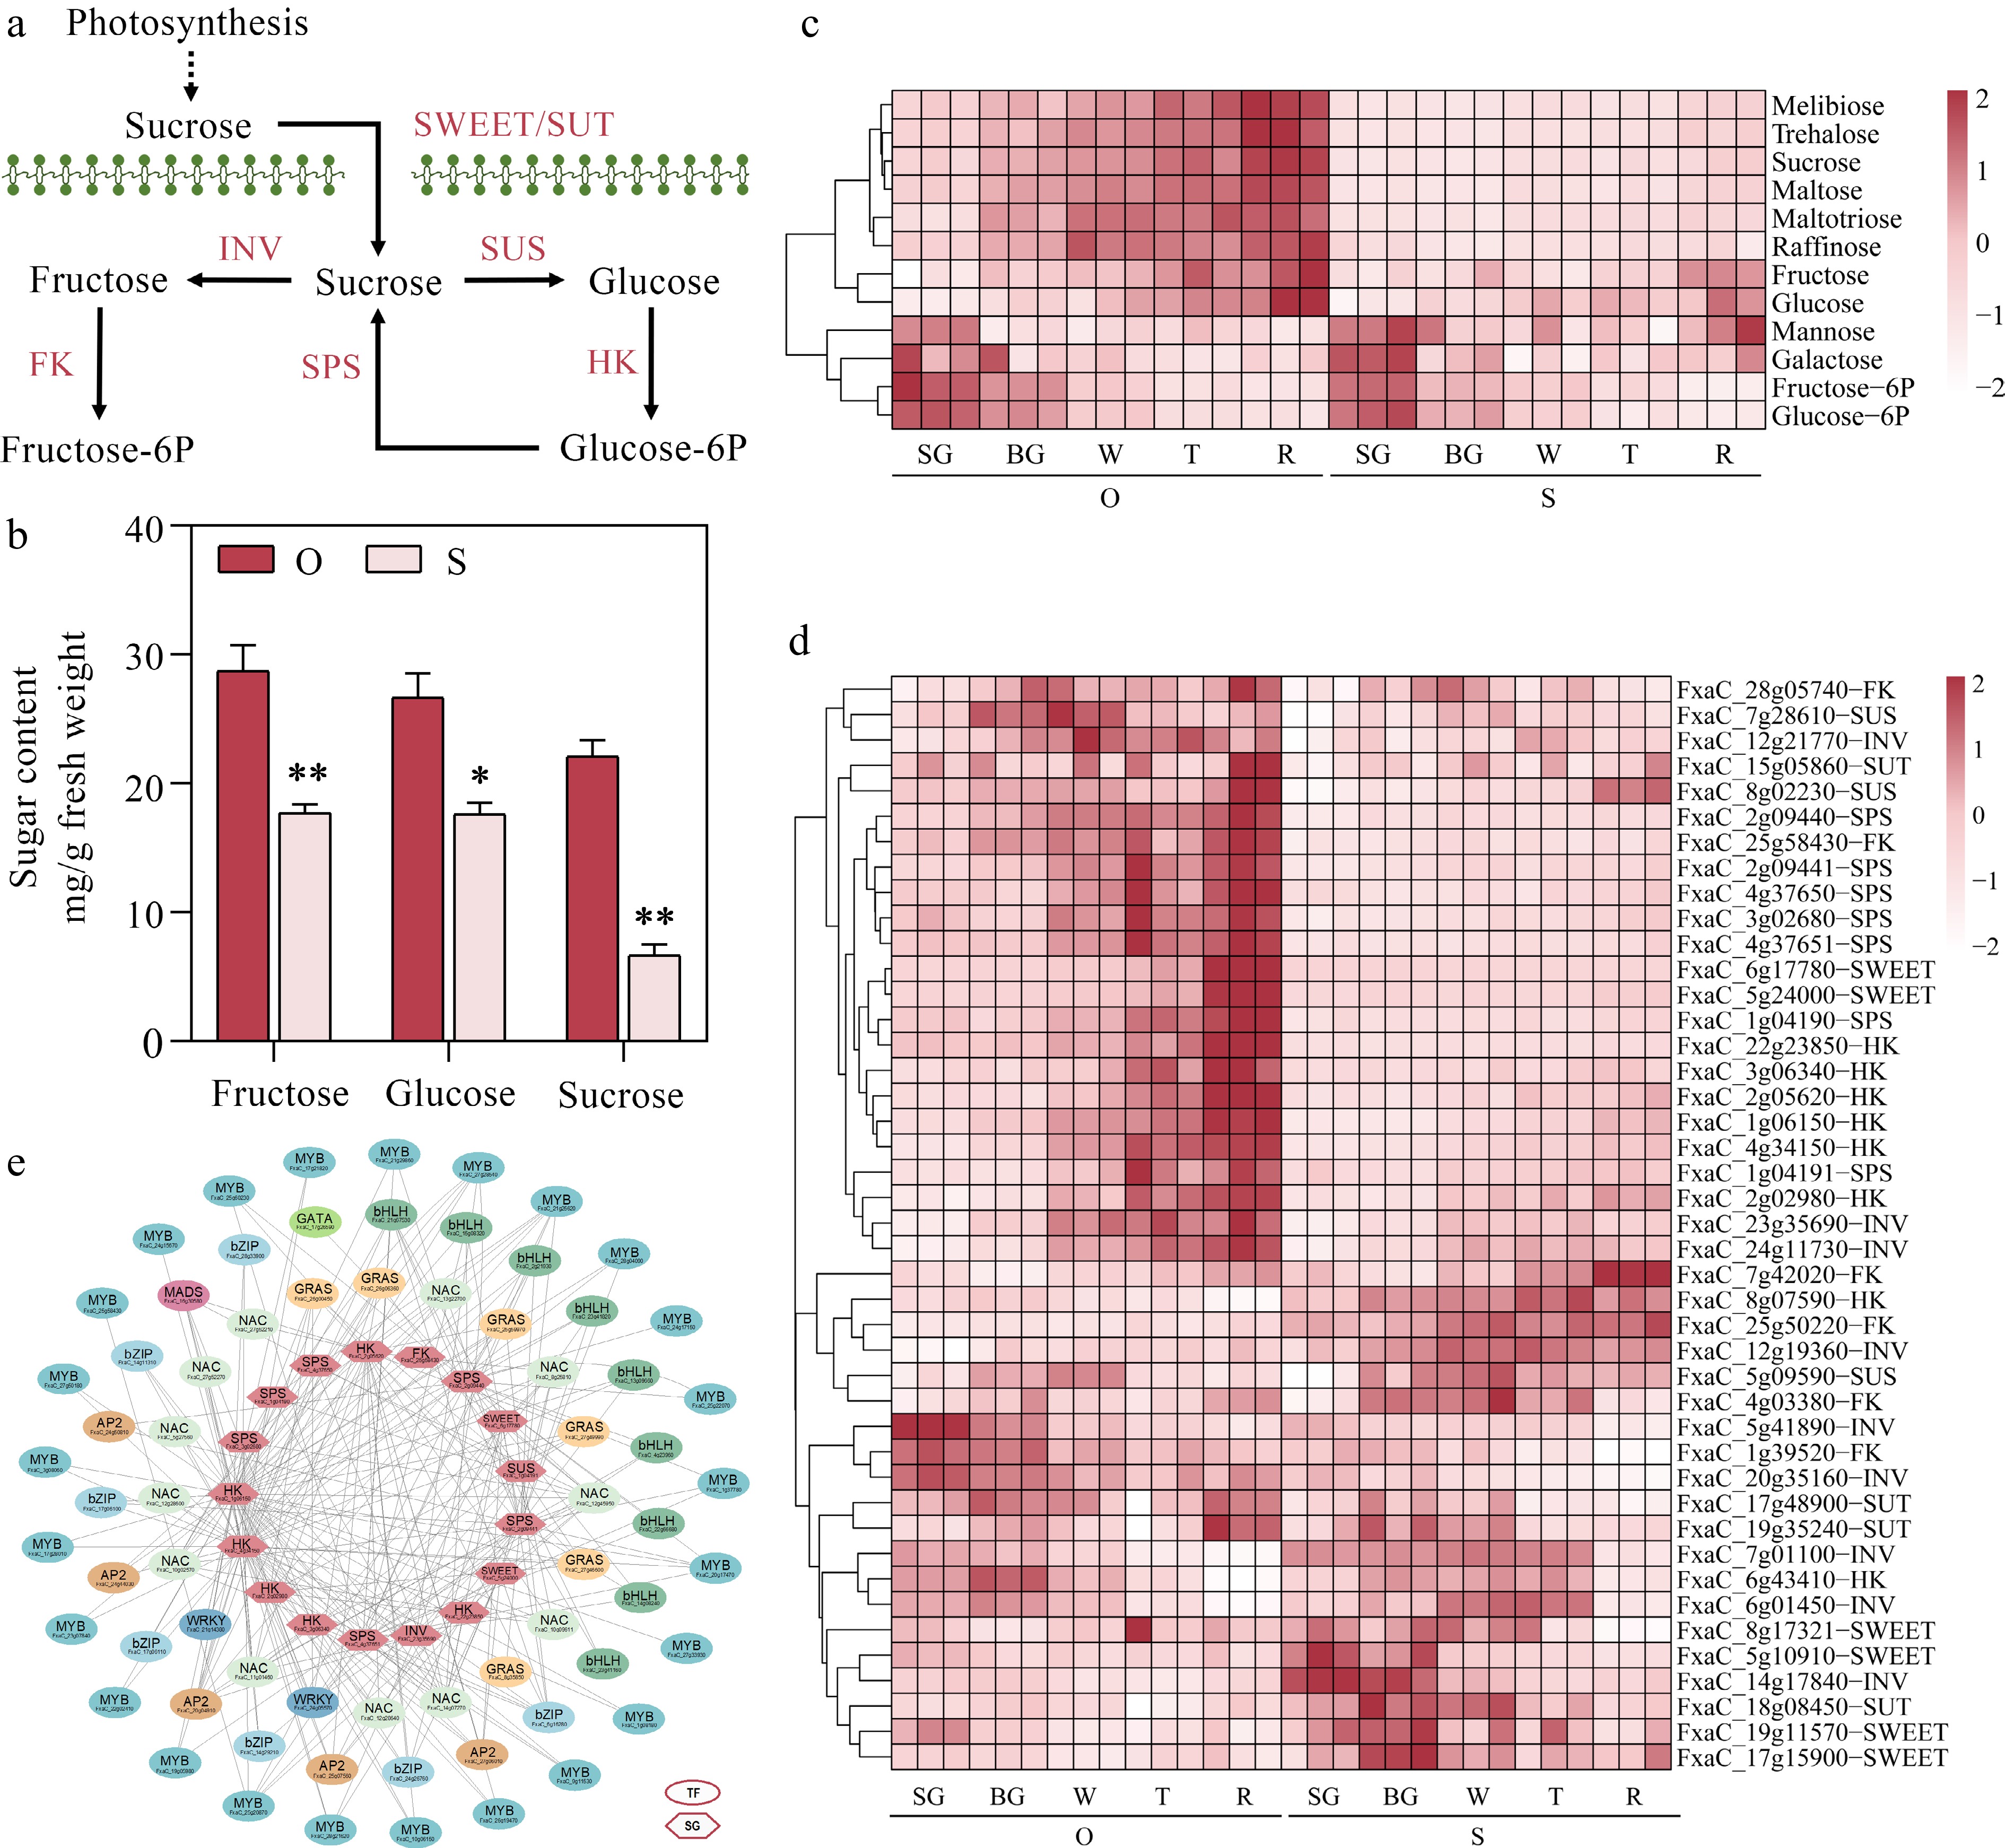
Figure 3.
Identifying potential regulatory factors in strawberry soluble sugar accumulation. (a) Metabolic pathways of soluble sugar. SWEET, Sugars will eventually be exported transporters; SUT, Sucrose transporter; INV, Sucrose invertase; SUS, Sucrose synthase; SPS, Sucrose phosphate synthetases; HK, Hexokinase; FK, Fructokinase. (b) Fructose, glucose and sucrose content during five developmental stages in the two strawberry cultivars. (c) Heatmap showing metabolites in metabolic pathways of soluble sugar. (d) Heatmap showing genes in metabolic pathways of soluble sugar. (e) Soluble sugar metabolic regulatory network. TF, transcription factors; SG, structural genes. Statistical significance was determined by Student's t test (* p < 0.05, ** p < 0.01).
-
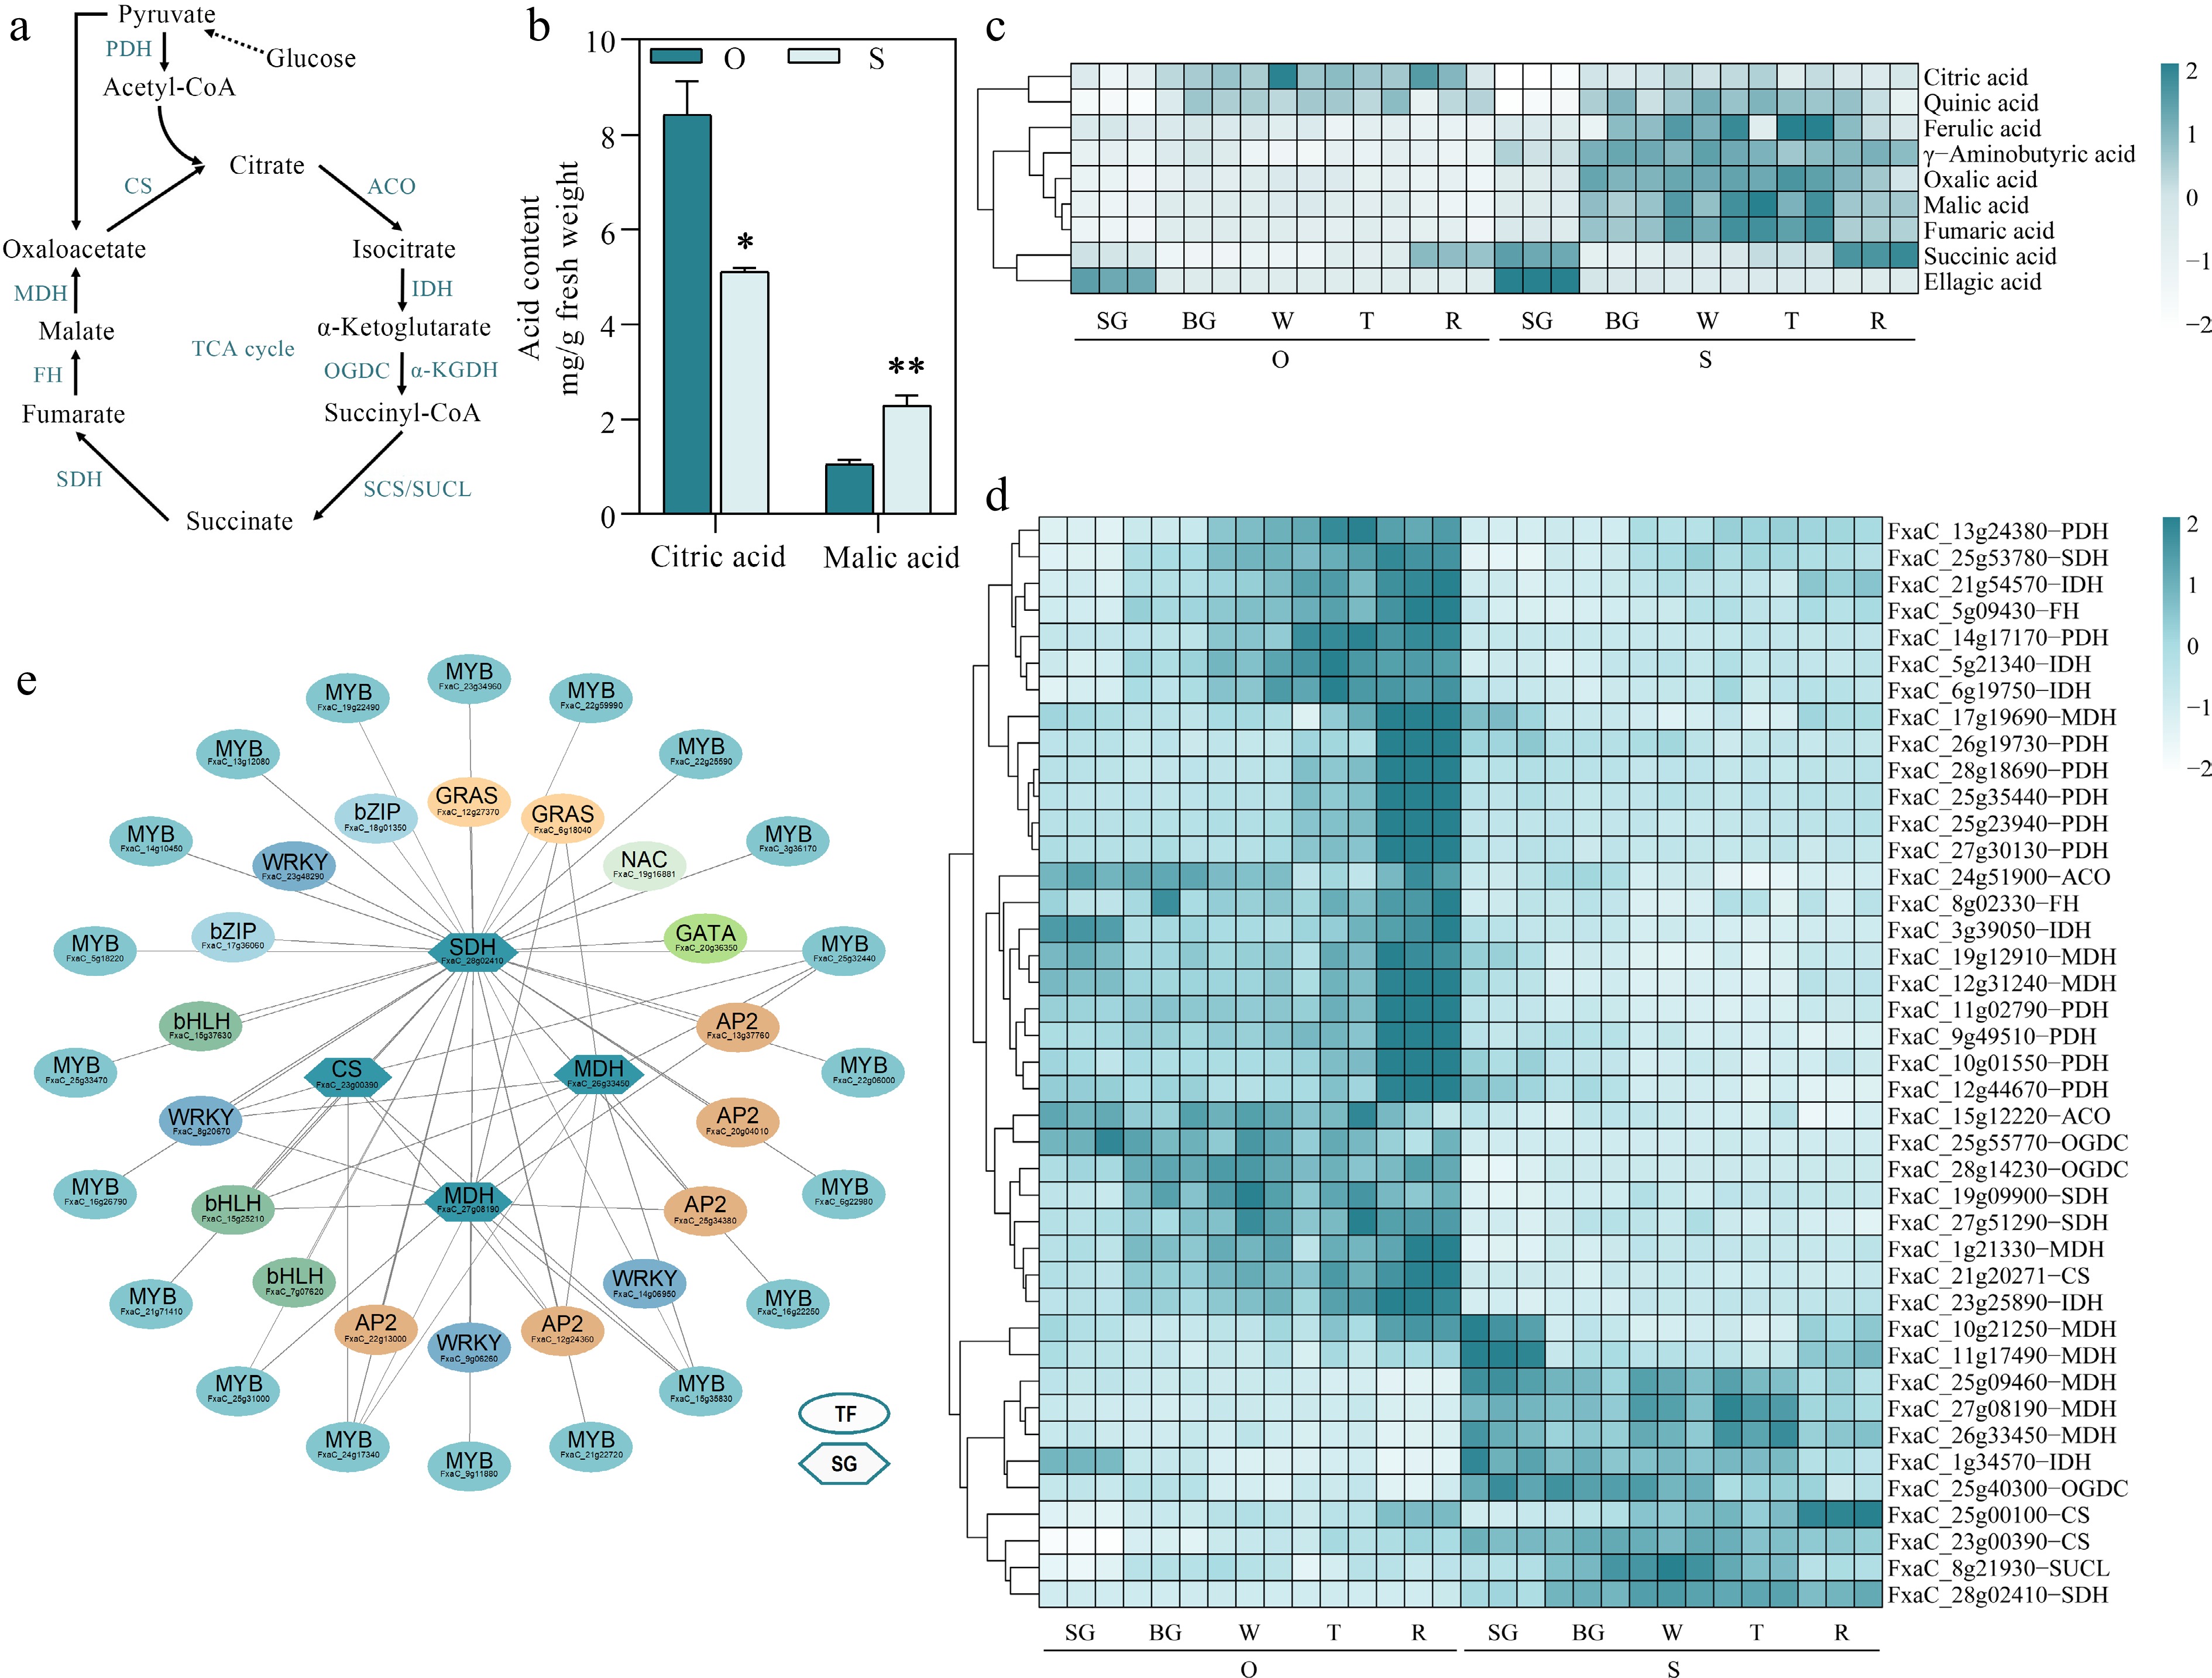
Figure 4.
Identifying potential regulatory factors in strawberry organic acid accumulation. (a) Organic acid metabolism pathways. PDH, Pyruvate dehydrogenase; CS, Citrate synthase; ACO, Aconitase; IDH, Isocitrate dehydrogenase; OGDC, Oxoglutarate dehydrogenase; SUCL, Succinyl-CoA ligase; SDH, Succinate dehydrogenase; FH, fumarate hydratase; MDH, Malate dehydrogenase. (b) Citric acid and malic acid content during five developmental stages in the two strawberry cultivars. (c) Heatmap showing metabolites in organic acid metabolic pathways. (d) Heatmap showing genes in organic acid metabolic pathways. (e) Organic acid metabolic regulatory network. TF, transcription factors; SG, structural genes. Statistical significance was determined by Student's t test (* p < 0.05, ** p < 0.01).
-
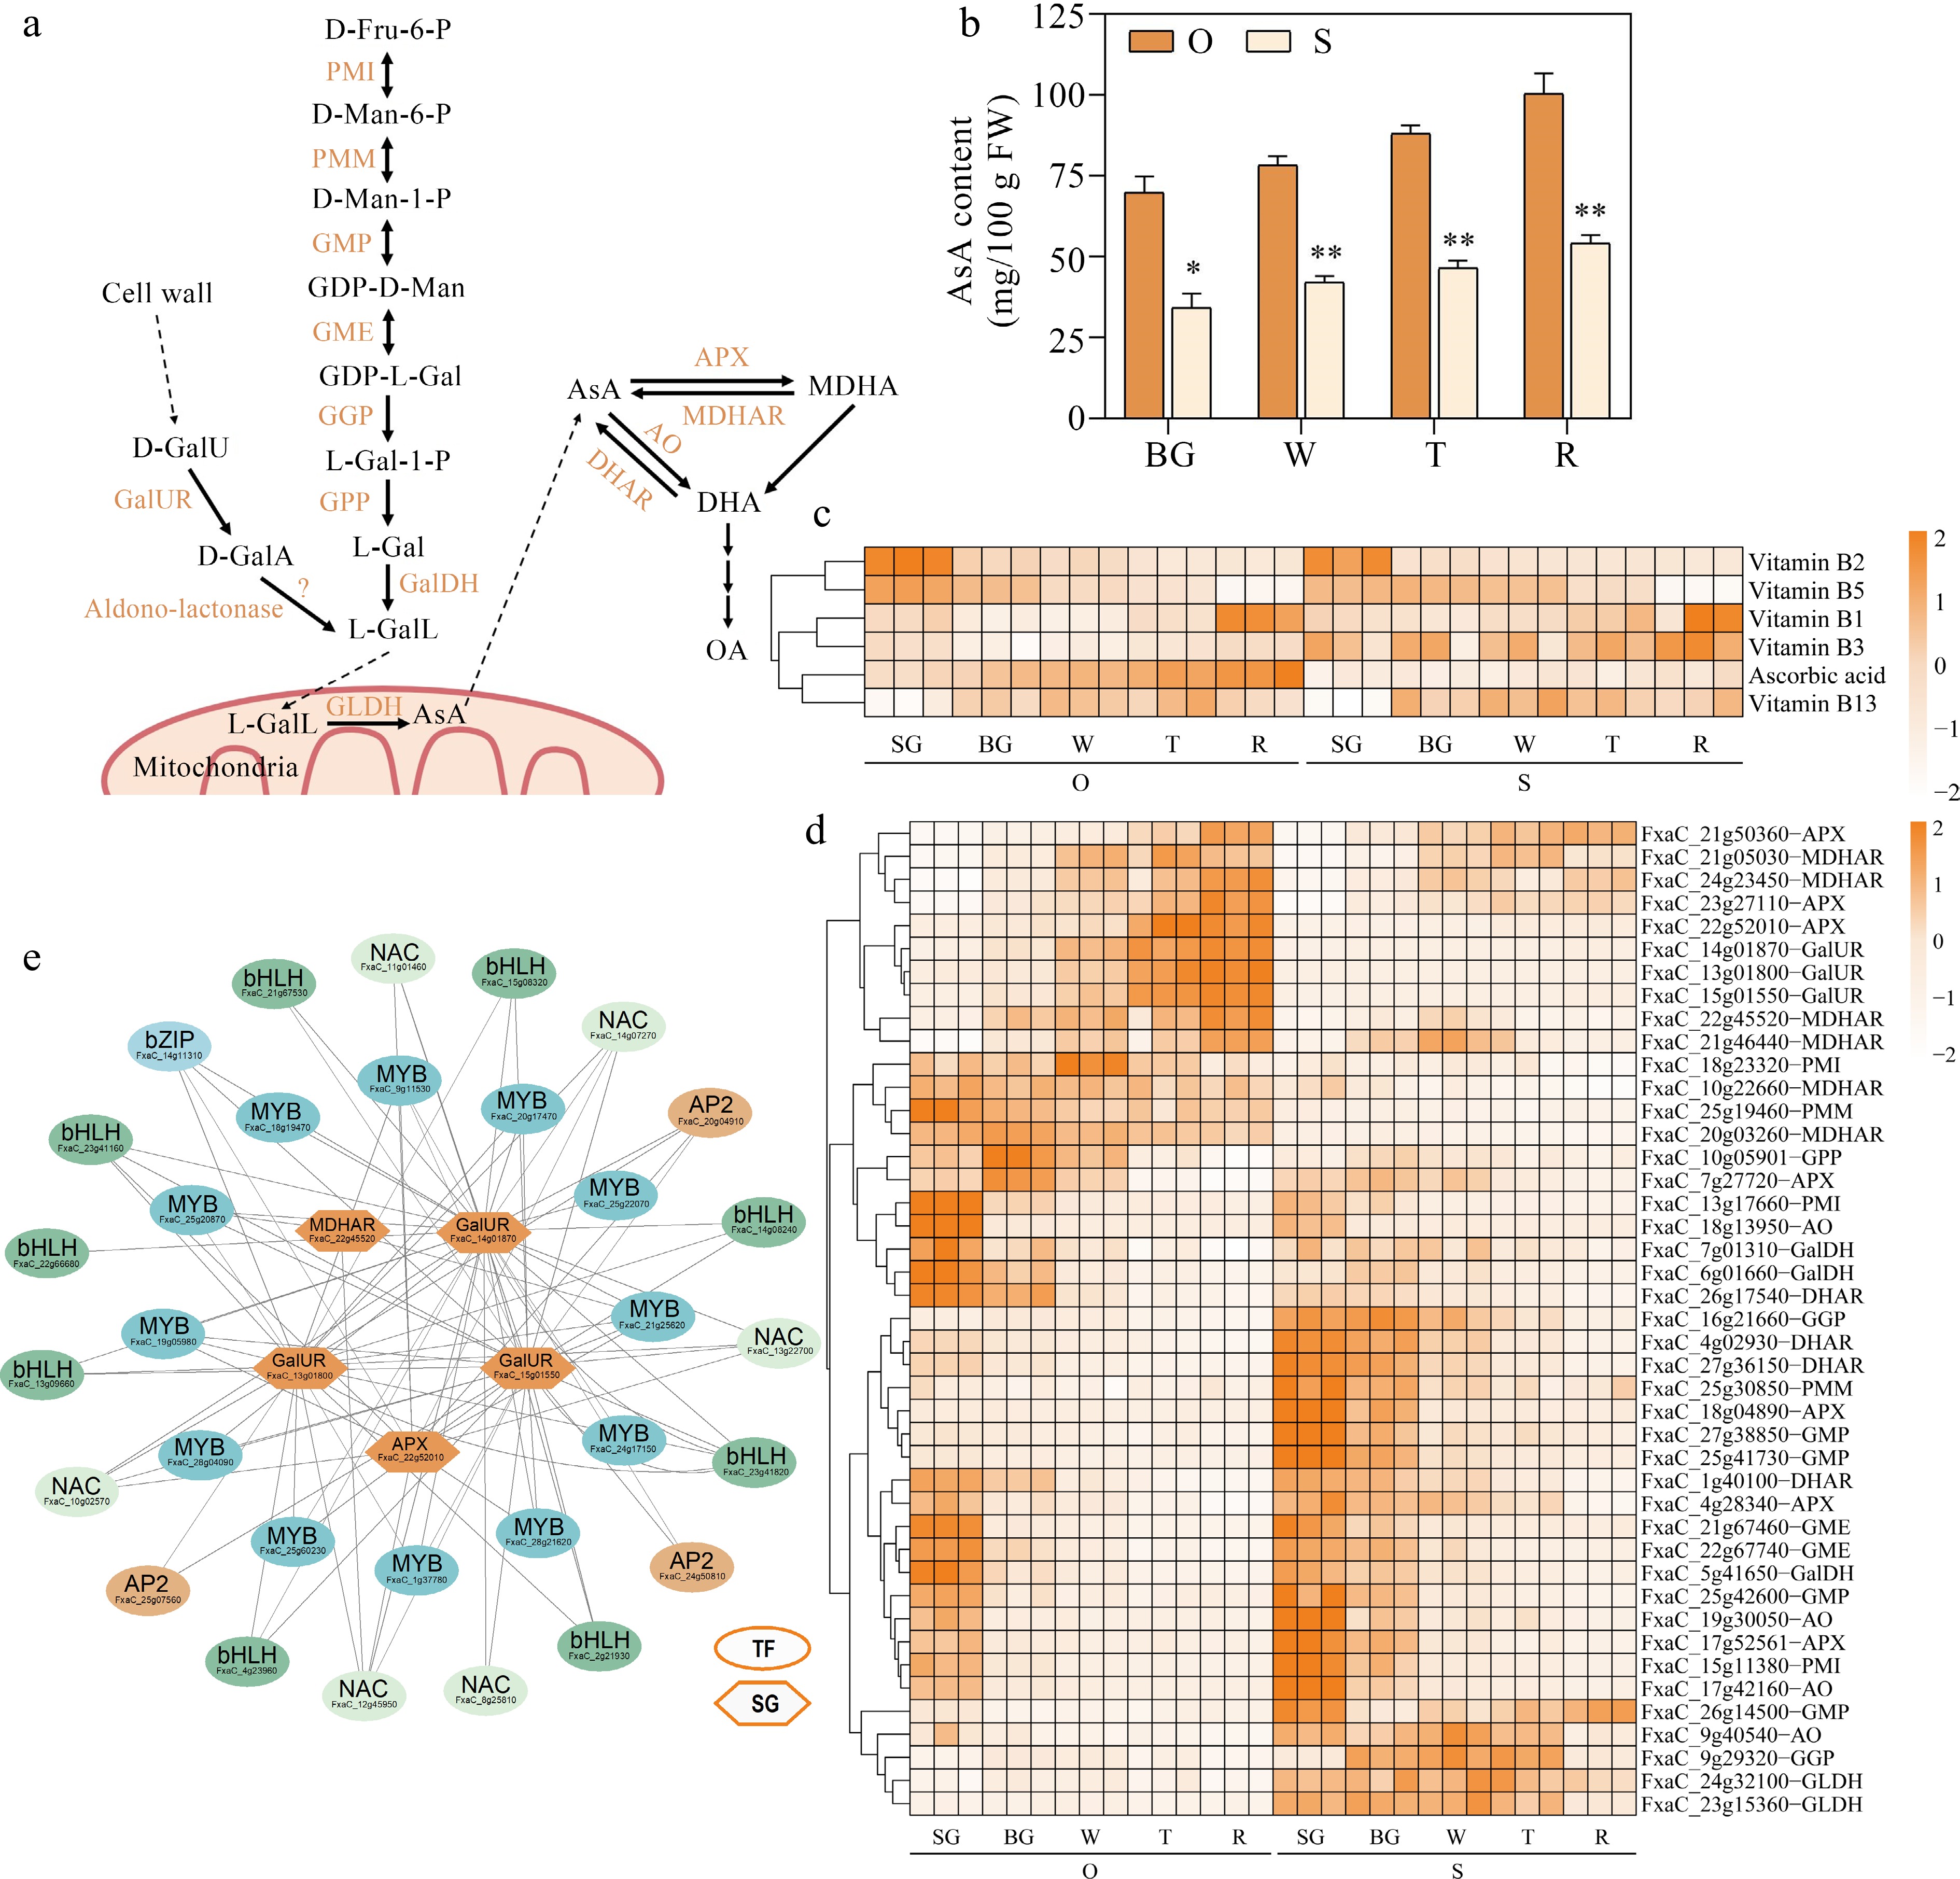
Figure 5.
Identifying potential regulatory factors in strawberry AsA accumulation. (a) AsA metabolism pathways. PMI, Phosphomannose isomerase; PMM, Phosphomannose mutase; GMP, GDP-D-mannose pyrophosphorylase; GME, GDP-D-mannose-3',5'-epimerase; GGP, GDP-L-galactose phosphorylase; GPP, L-galactose-1-phosphate phosphatase; GalDH, L-galactose dehydrogenase; GalUR, D-galacturonate reductase; GLDH, L-galactono-1,4-lactone dehydrogenase; DHAR, dehydroascorbate reductase; AO, L-ascorbate oxidase; MDHAR, monodehydroascorbate reductase; APX, L-ascorbate peroxidase. (b) AsA content during five developmental stages in the two strawberry cultivars. (c) Heatmap showing metabolites in AsA metabolic pathways. (d) Heatmap showing genes in AsA metabolic pathways. (e) AsA metabolic regulatory network. TF, transcription factors; SG, structural genes. Statistical significance was determined by Student's t test (* p < 0.05, ** p < 0.01).
-
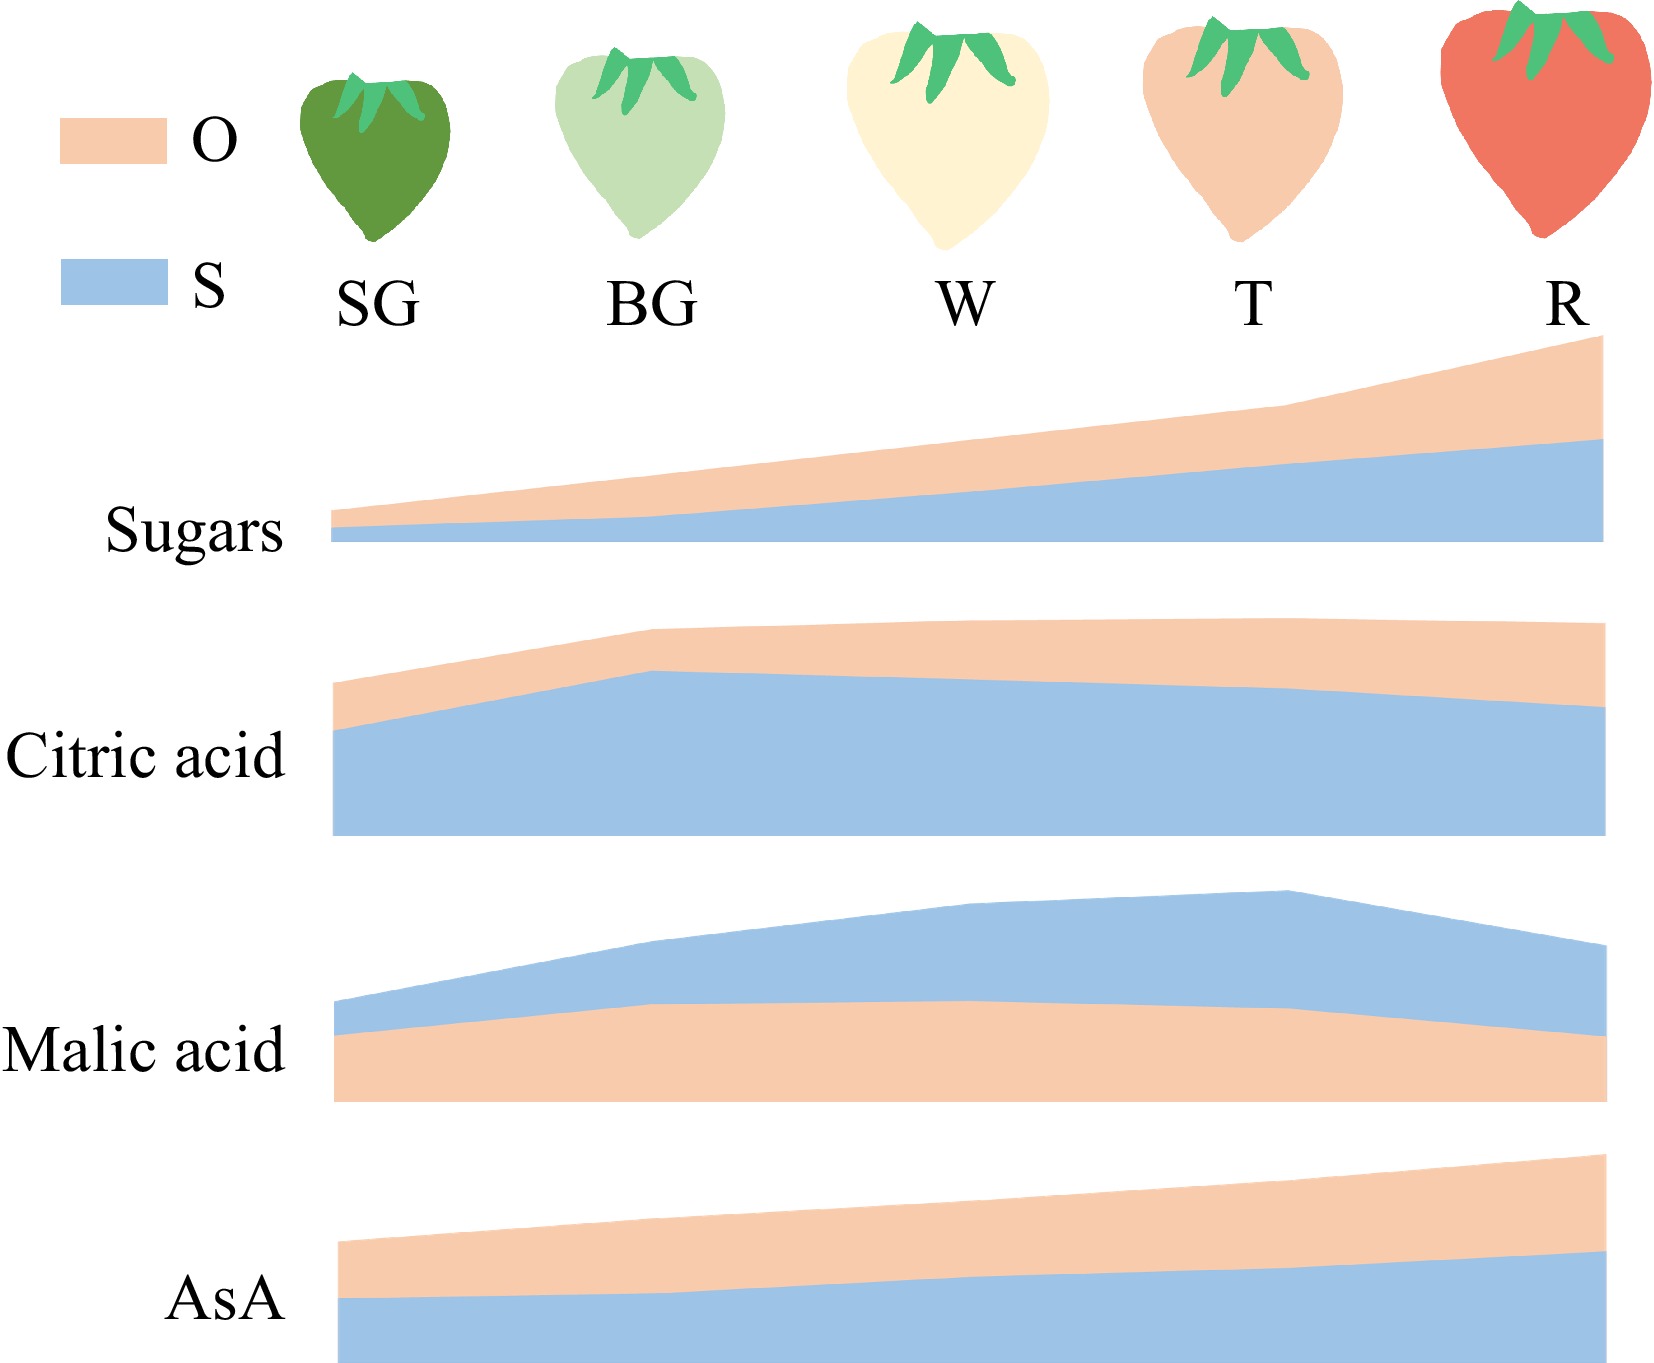
Figure 6.
Schematic diagram indicates the accumulation patterns of major quality metabolites during fruit ripening of two cultivars strawberry. O, 'Oic berry'; S, 'Sweet Charlie'. The content of sugars, citric acid, malic acid and AsA at different fruit stages were standardized to 0−1. The areas of each metabolite from the two cultivars are calculated using the same baseline.
Figures
(6)
Tables
(0)