-
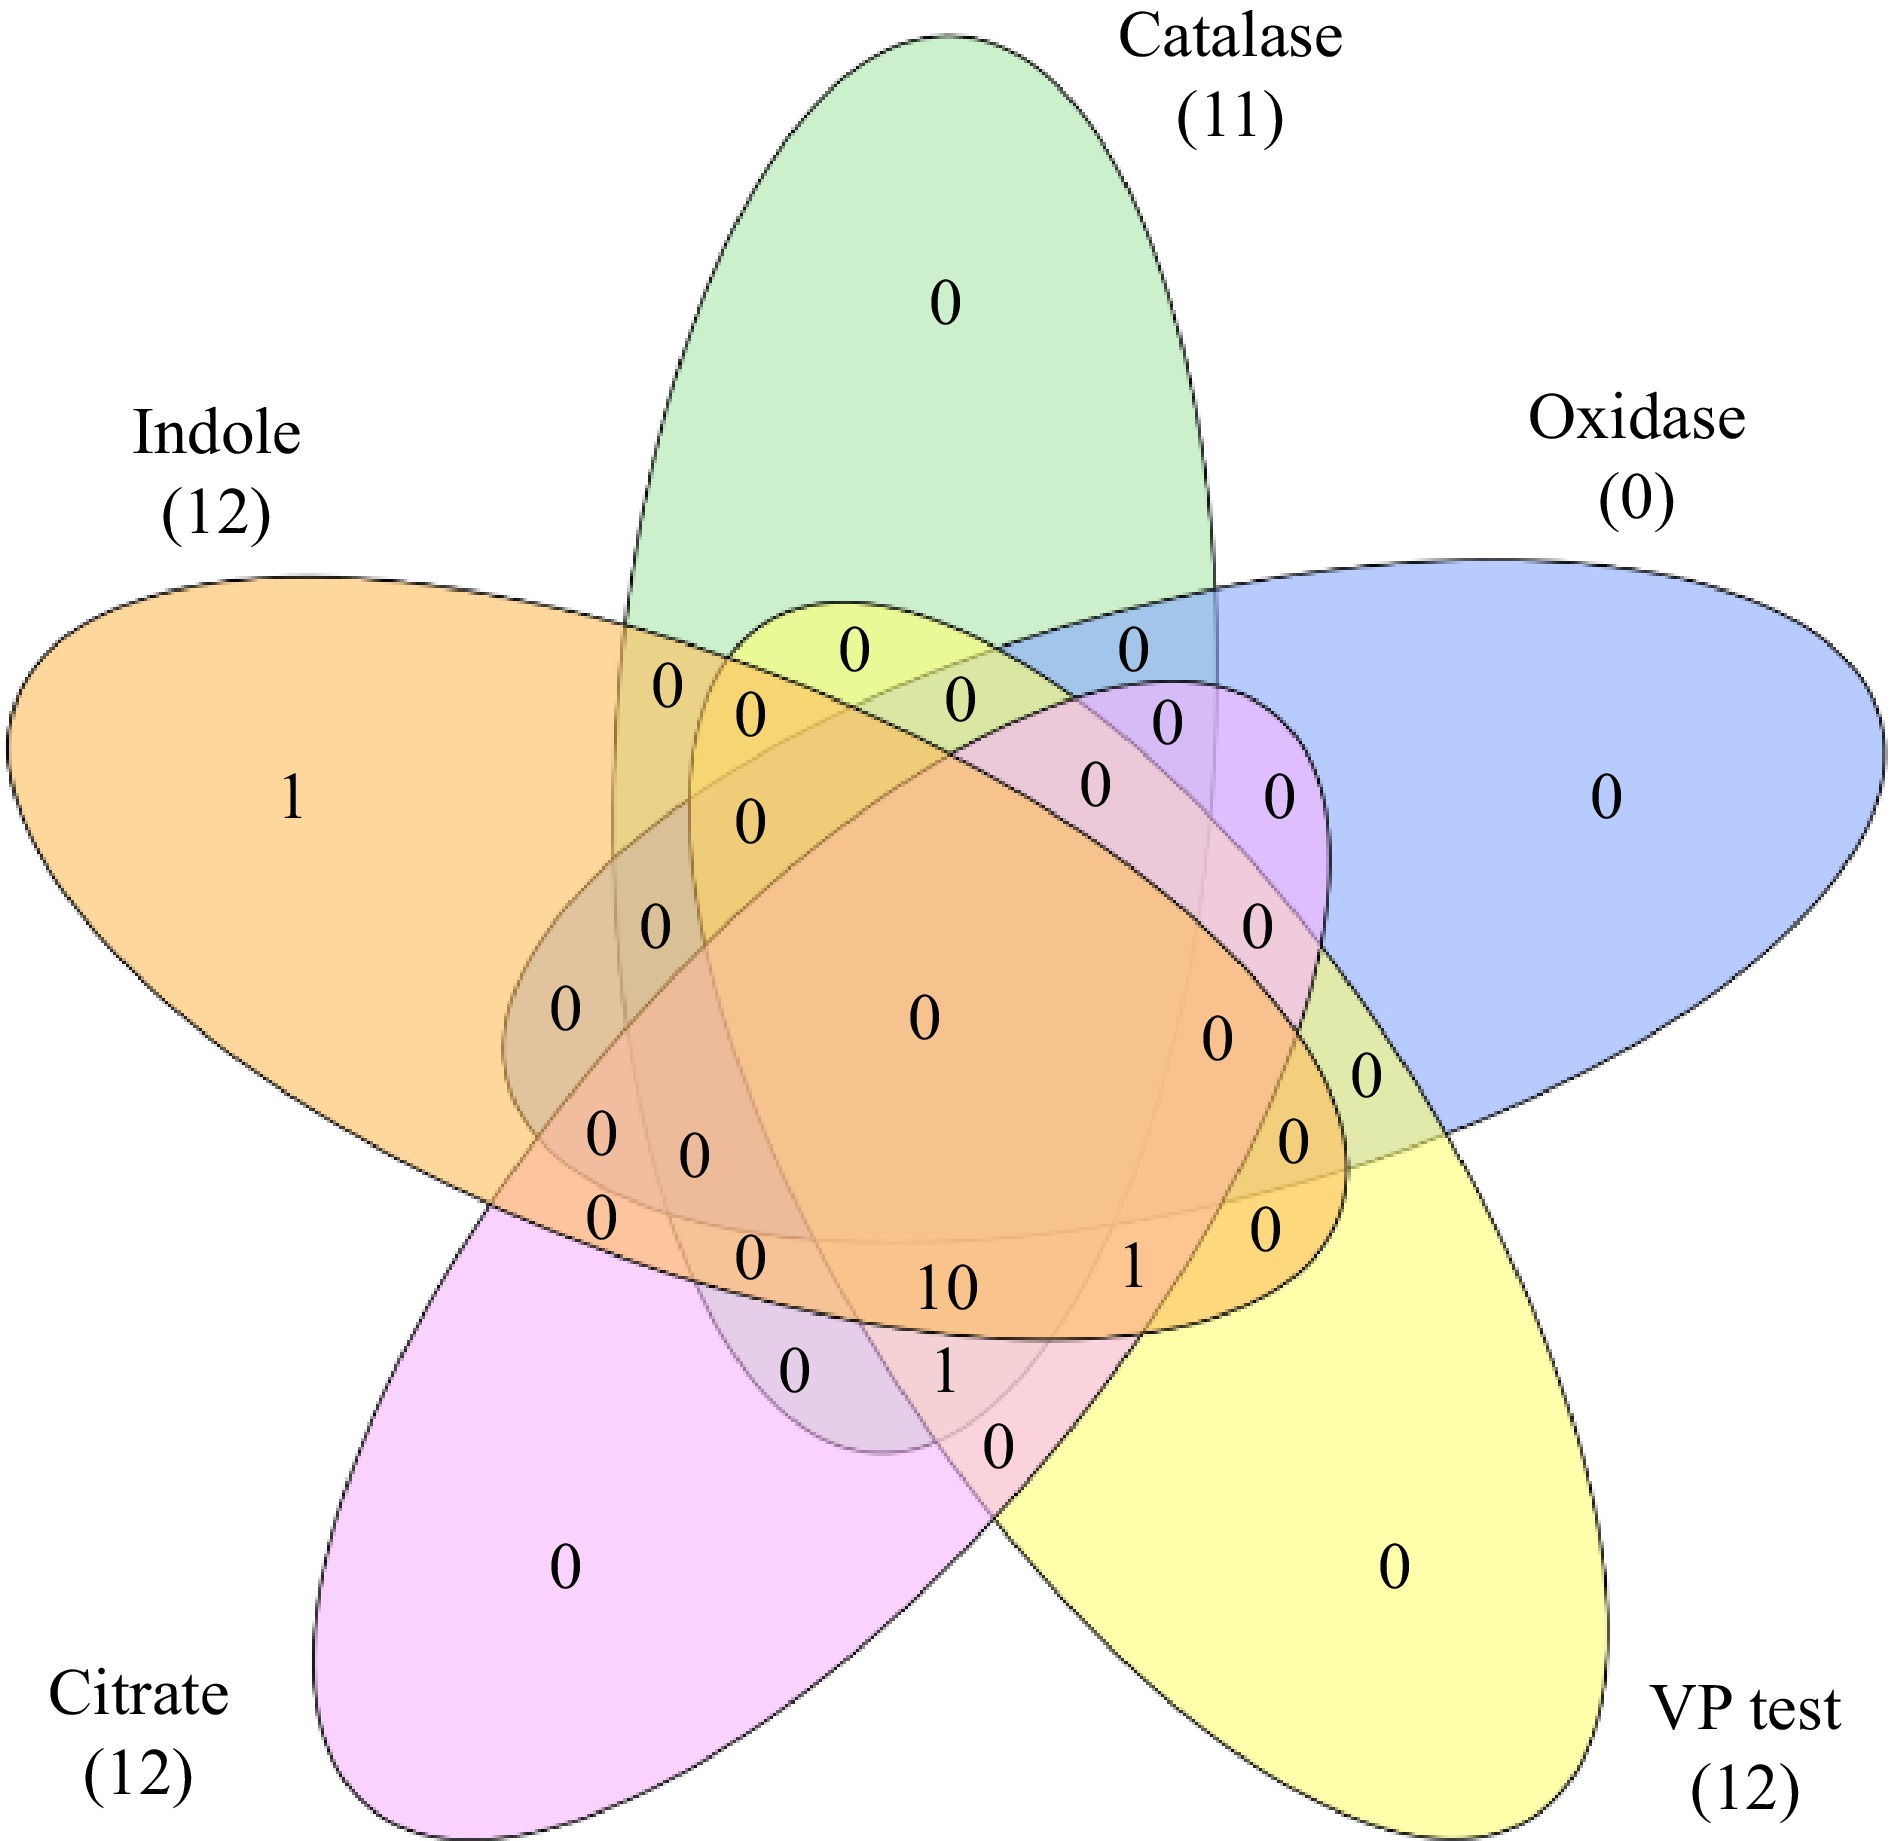
Figure 1.
Venn diagram showing biochemical characterization of bacterial endophytes.
-
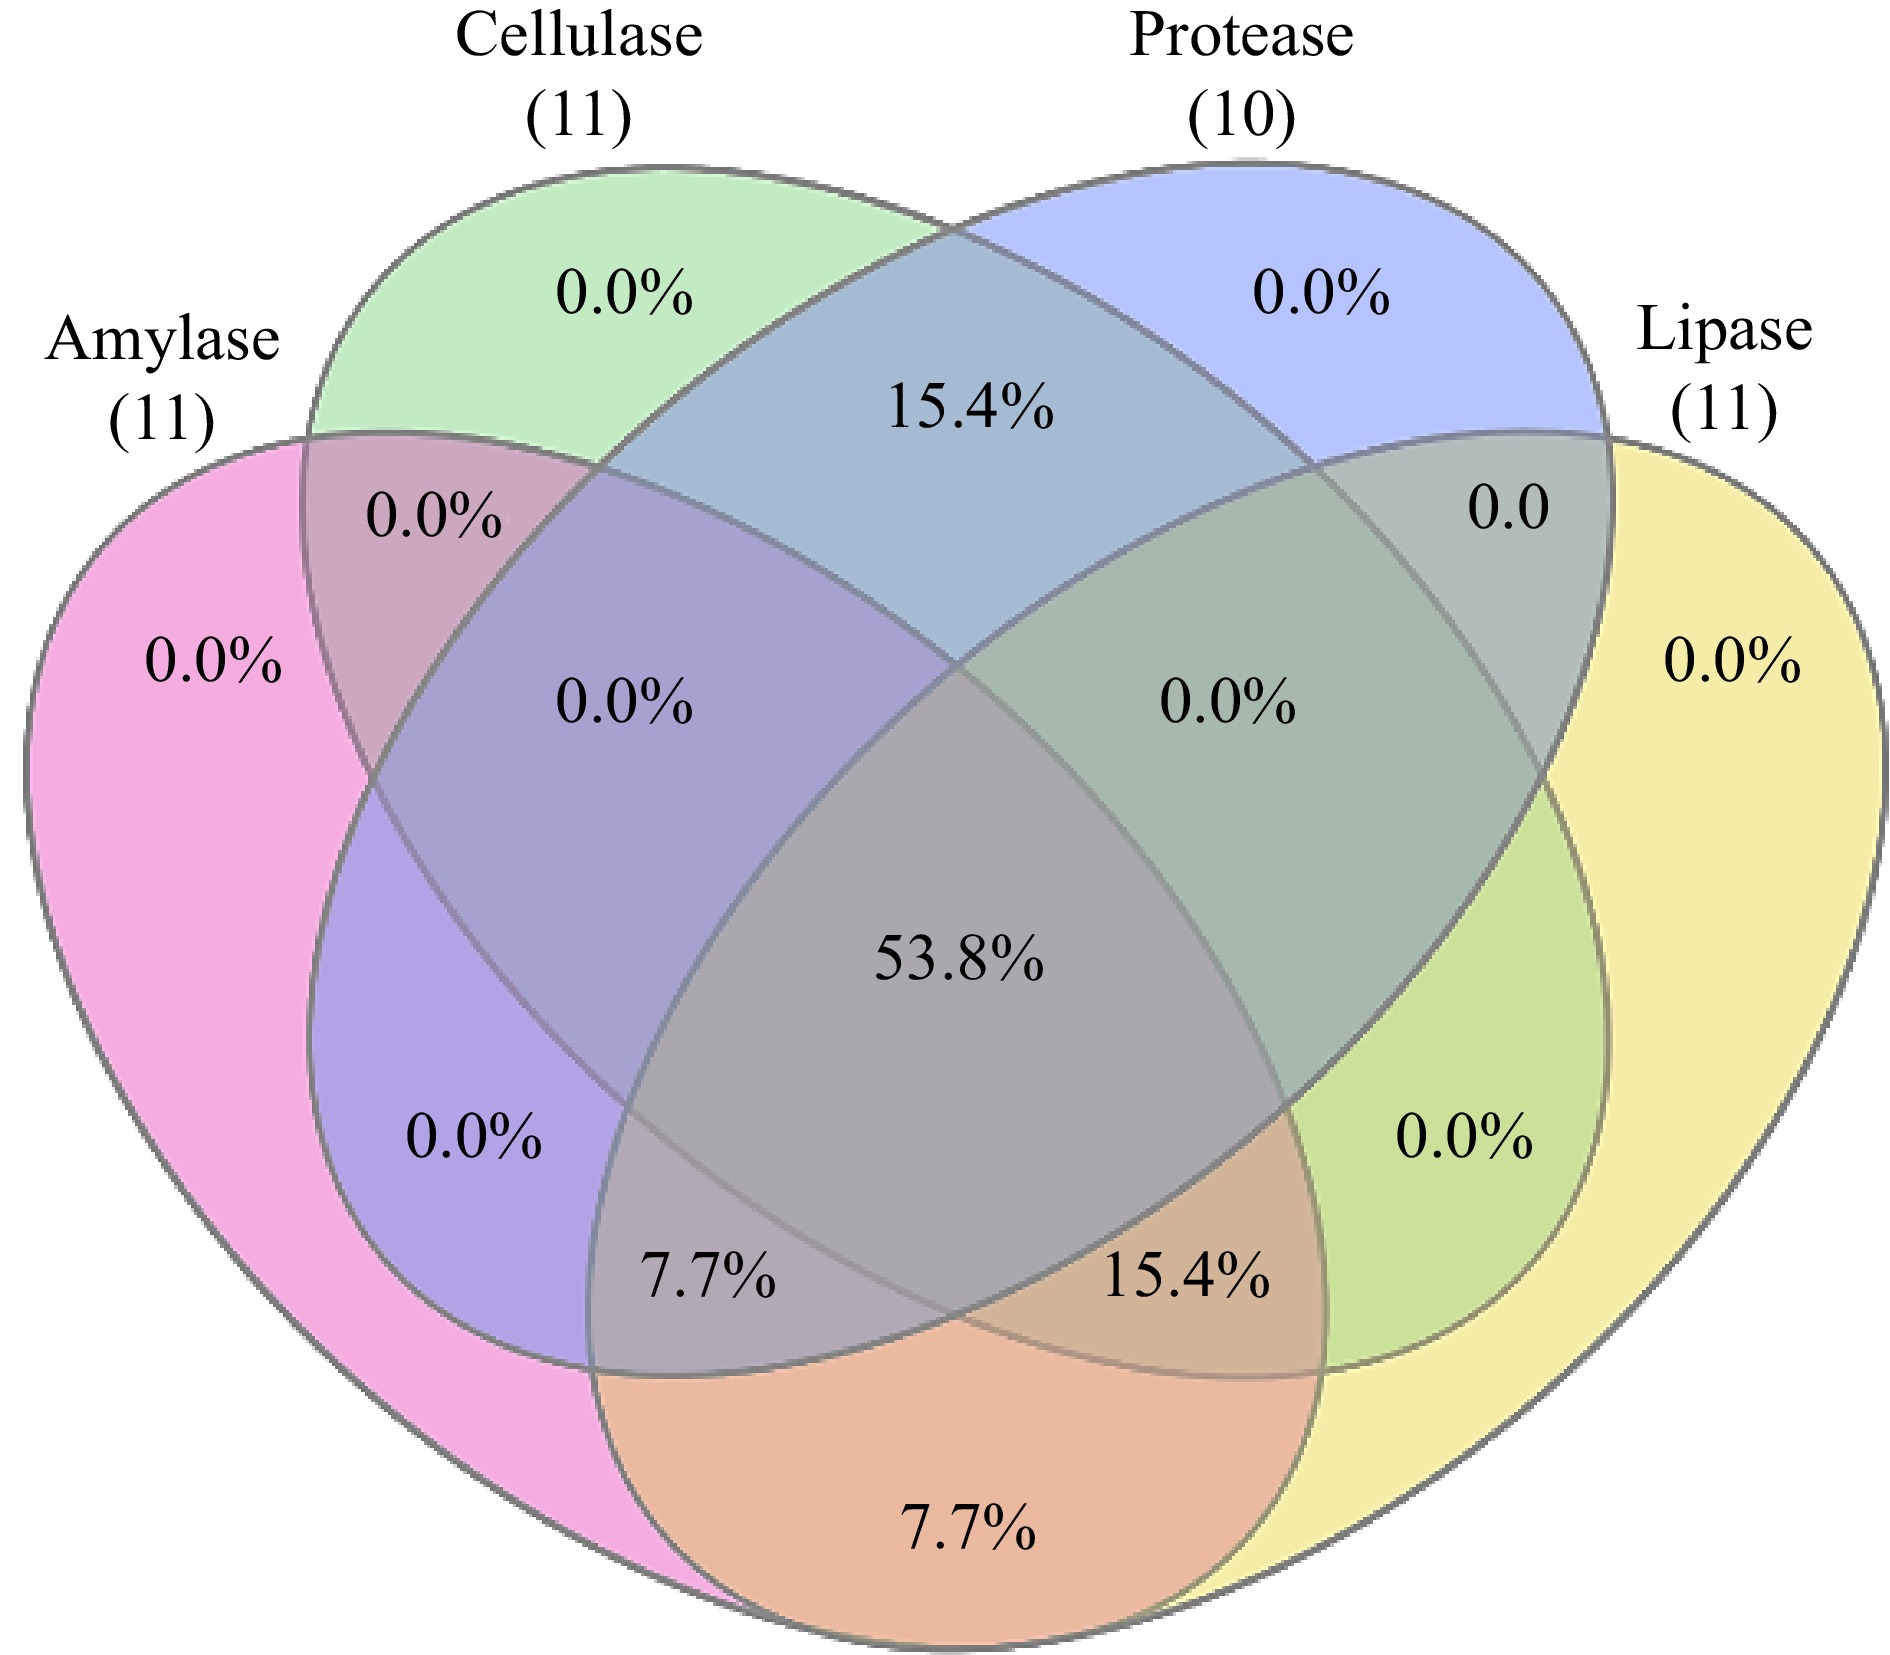
Figure 2.
Venn diagram showing extracellular enzyme assay exhibited by bacterial endophytes.
-
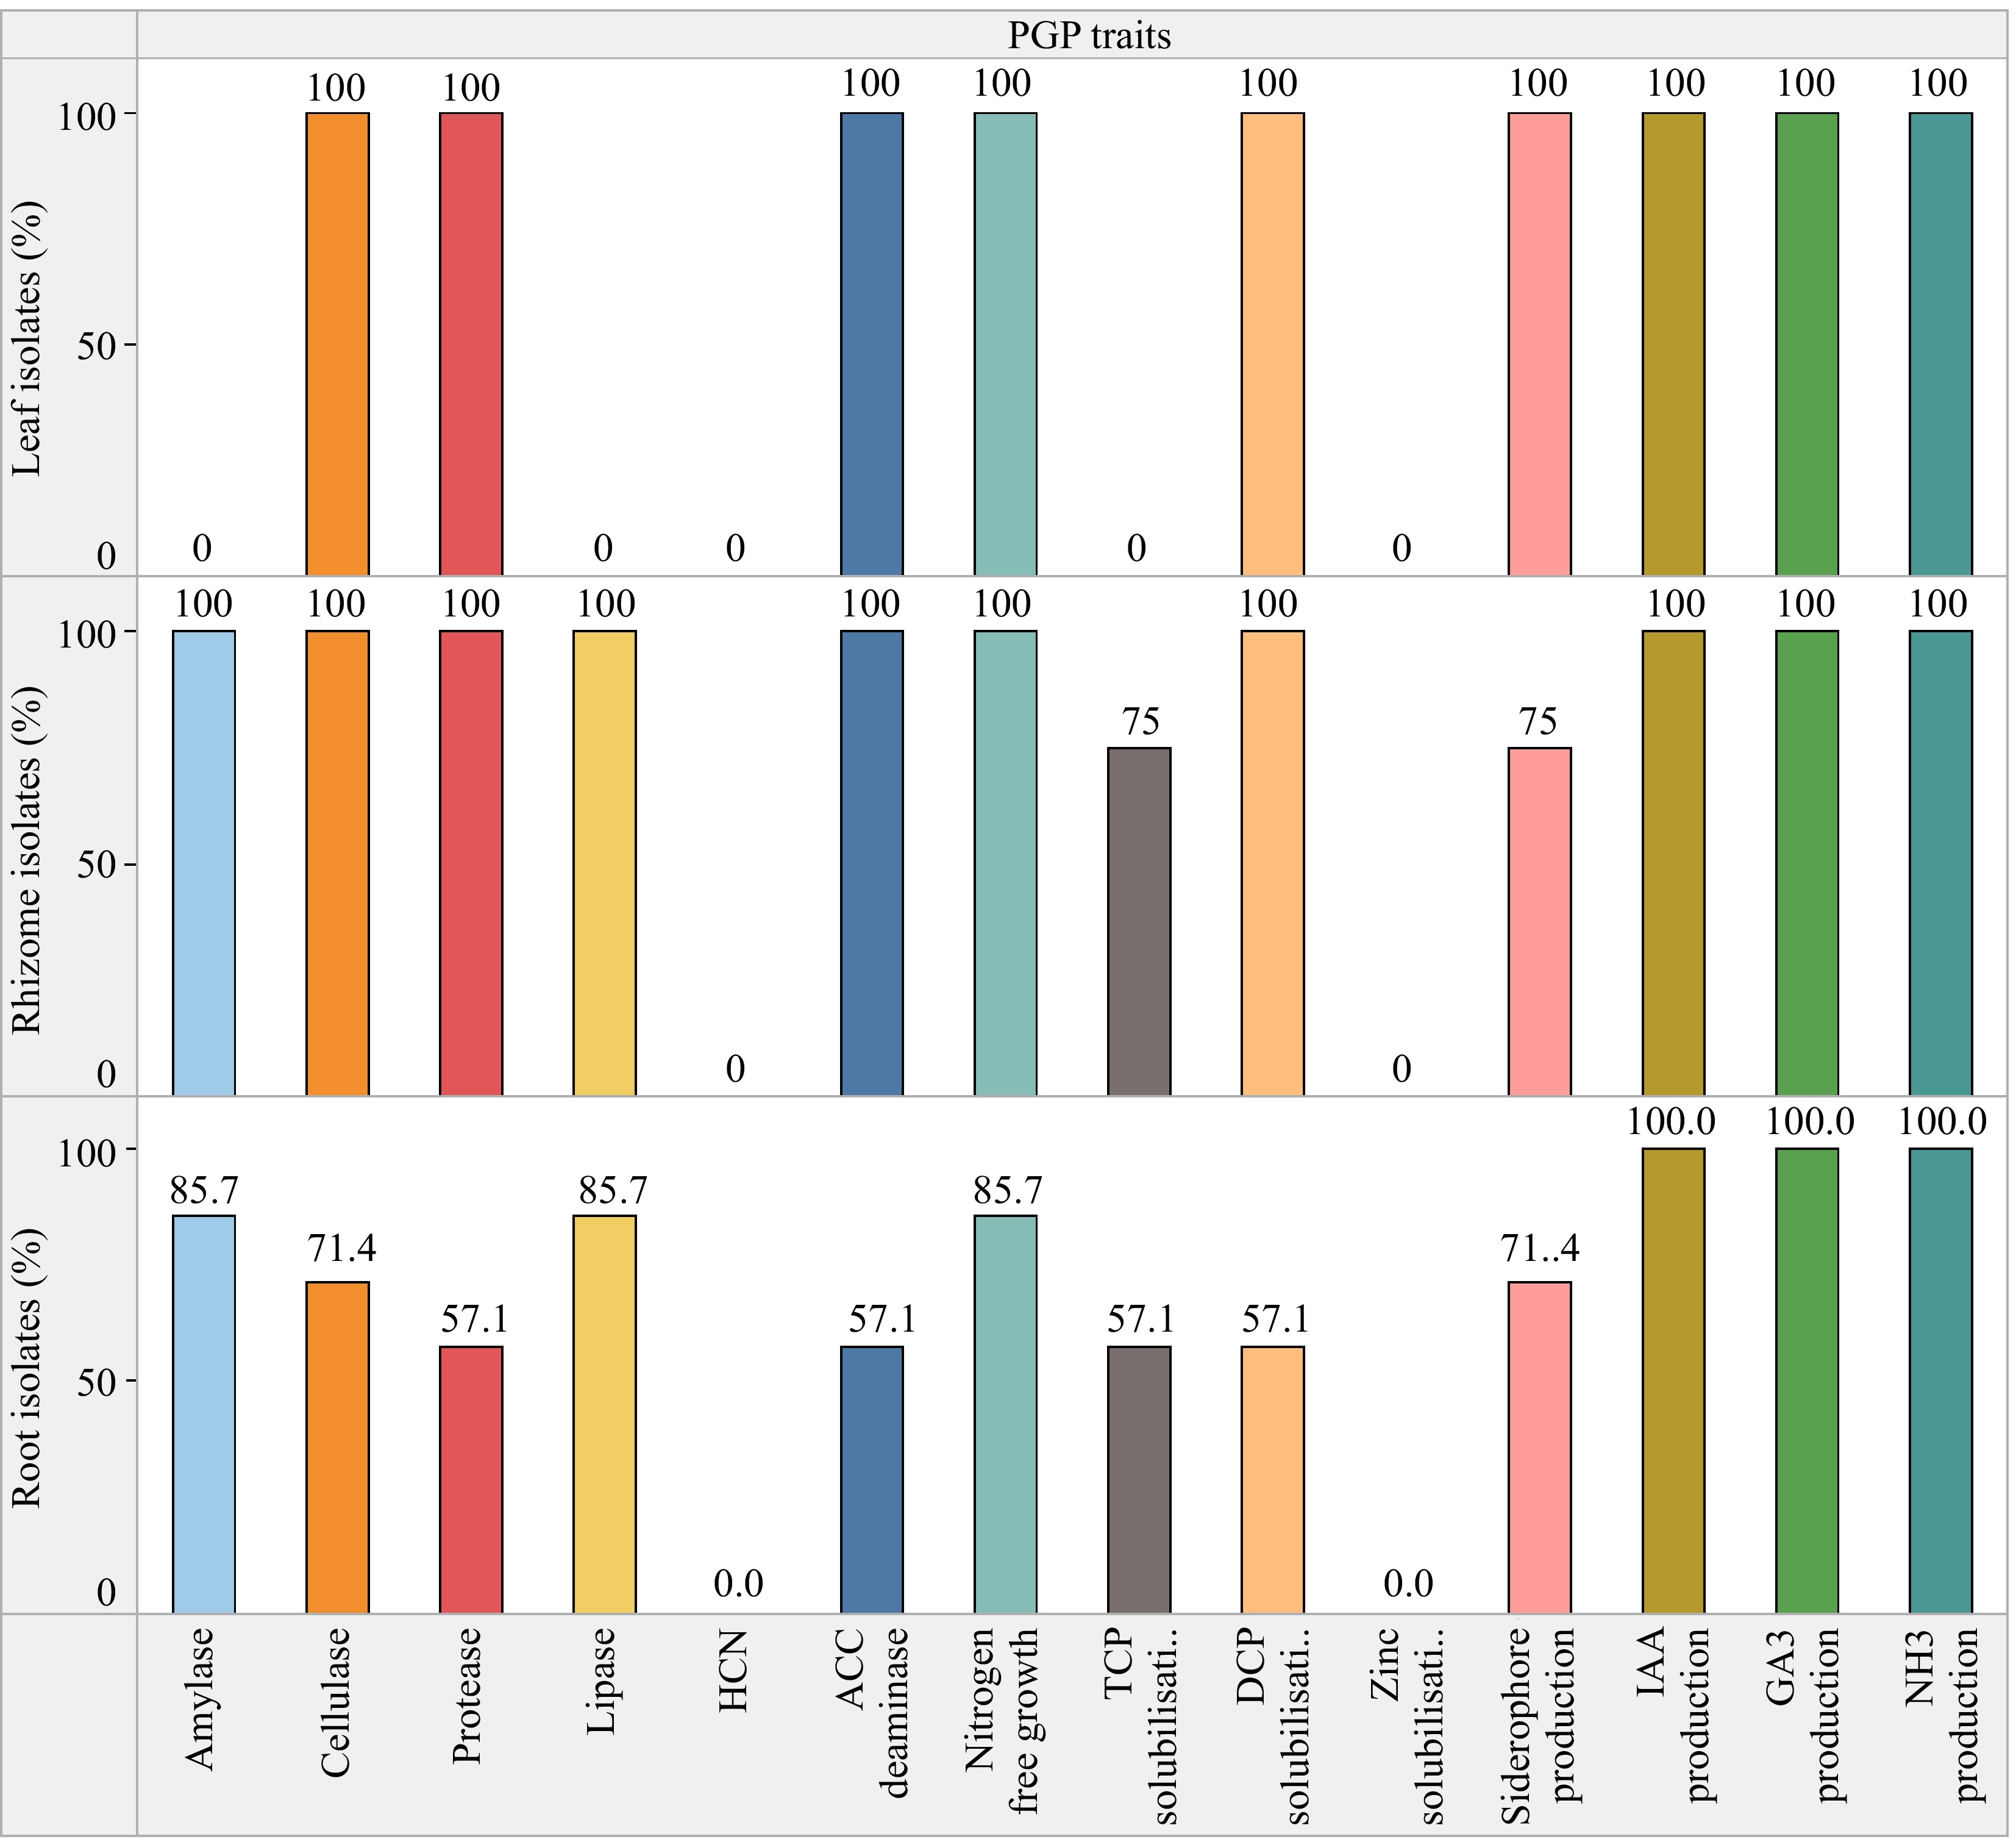
Figure 3.
% Bacterial endophytes of C. virgata with PGP activity.
-
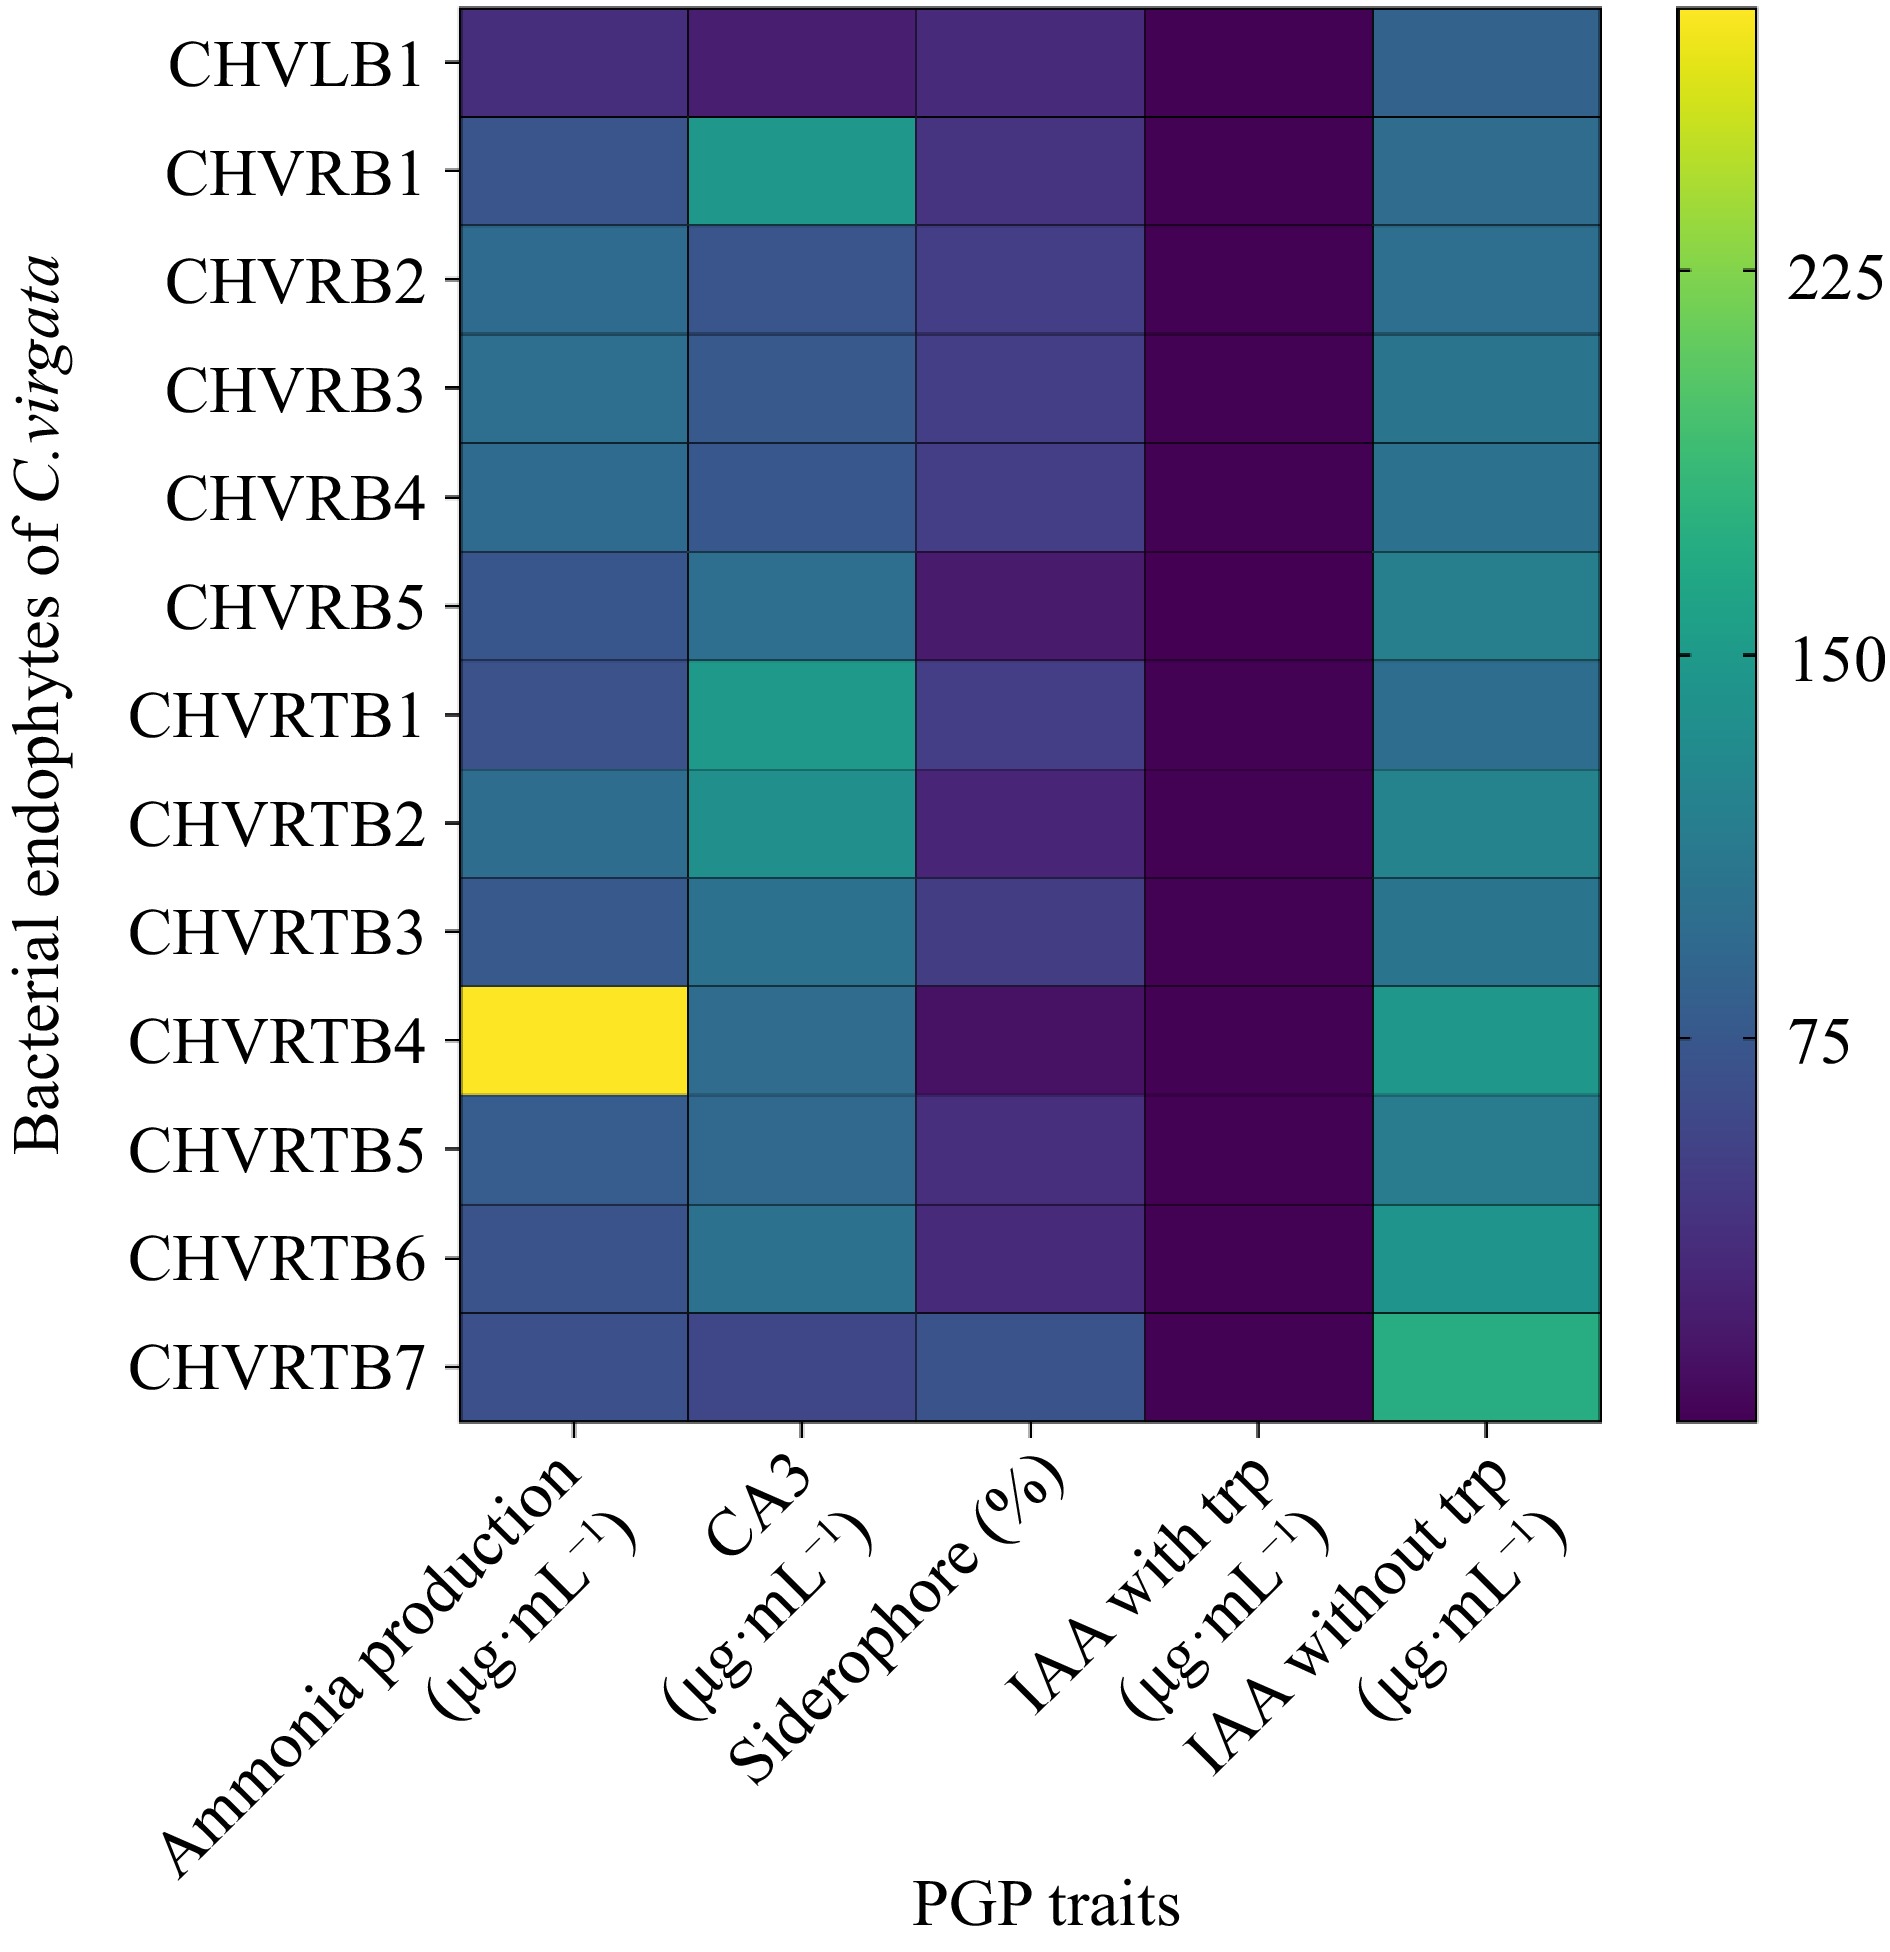
Figure 4.
Heatmap for plant growth promoting traits of the bacterial endophytes was prepared in terms of color intensity by normalisation of mean values of the results.
-
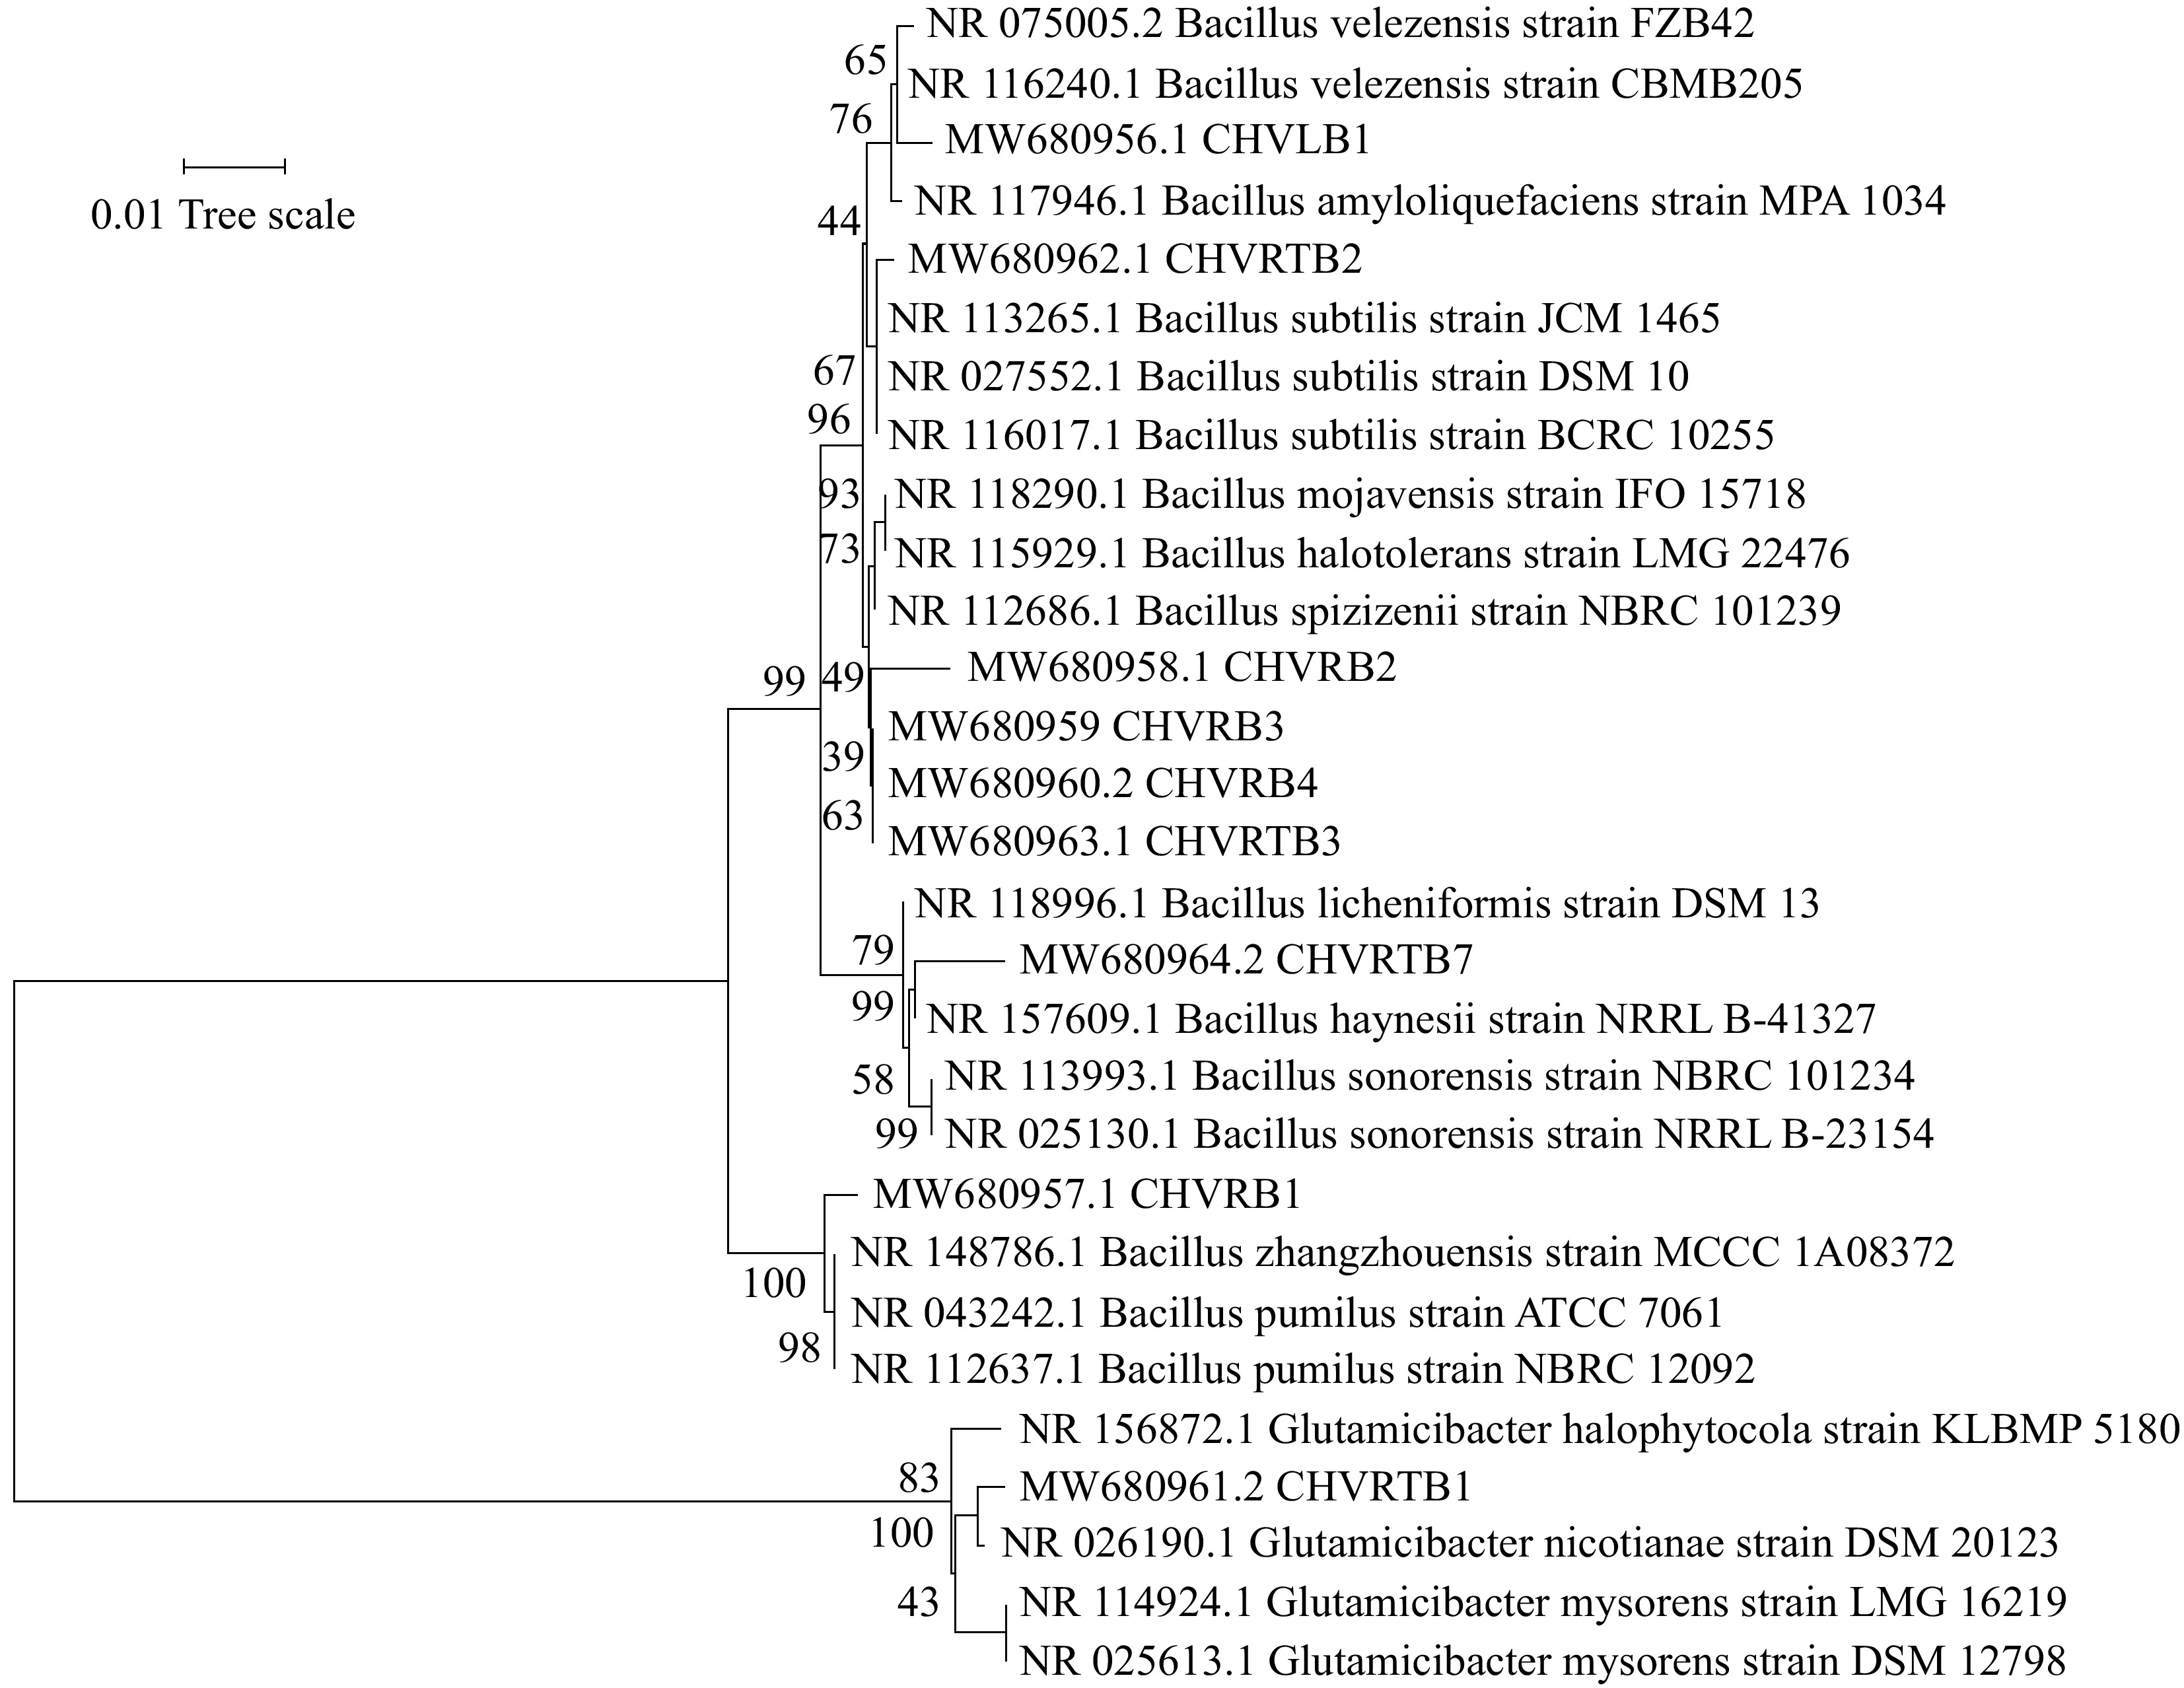
Figure 5.
Neighbor-joining phylogenetic tree based on the partial sequence of the 16S rRNA gene of bacterial isolates from C. virgata and their related type strains. The evolutionary distances were computed using the p-distance. Bootstrap values are given at branch nodes and are based on 1,000 replicates.
-
Isolates Colour Surface Shape Edge/margin Elevation Opacity CHVLB1 Off-white Shiny Circular Smooth Raised Opaque CHVRB1 Off-white Irregular − Lobate Flat Opaque CHVRB2 Off-white to pink Irregular − Undulate Raised Opaque CHVRB3 Off-white to pink Shiny Circular Lobate Raised Opaque CHVRB4 Off-white to pink Mucoidal, glistening − Entire Raised Opaque CHVRB5 Off-white − − Lobate Flat Opaque CHVRTB1 Off-white Dull Circular Entire Raised Opaque CHVRTB2 Yellow − Irregular Undulate Raised Opaque CHVRTB3 Off-white − Irregular Undulate Raised Opaque CHVRTB4 Off-white − − − Flat Opaque CHVRTB5 Off-white Irregular − Lobate Flat Opaque CHVRTB6 Off-white Irregular − Lobate Raised Opaque CHVRTB7 Off-white Slimy, glistening Circular Entire Raised Opaque * CHVLB: Chloris virgata Leaf bacteria; CHVRB: Chloris virgata Rhizome bacteria; CHVRTB: Chloris virgata Root bacteria. Table 1.
Morphological characteristic of endophytic bacterial isolates from Chloris virgata.
-
Isolates Indole production Catalase Oxidase Methyl Red test Voges-Proskauer test Citrate utillisation Oxidative fermentation NO3− With oil Without oil CHVLB1 − + − − + + + + + CHVRB1 + + − − + + + + − CHVRB2 + + − − + + + + + CHVRB3 + + − − + + − + + CHVRB4 + + − − + + + + + CHVRB5 + + − − + + + + + CHVRTB1 + + − − + + + + + CHVRTB2 + + − − + + + + − CHVRTB3 + + − − + + + + + CHVRTB4 + + − + + + + + + CHVRTB5 + − − − + + + + − CHVRTB6 + − − + − − + + + CHVRTB7 + + − − + + + + + (+) = presence of activity; (−) = absence of activity. Table 2.
Biochemical characterization of endophytic bacteria.
-
Isolates Enzyme activity Phosphate utillisation Siderophore production Ammonia production HCN
productionAcc deaminase Nitrogen free growth Amylase Cellulase Protease Lipase TCP DCP CHVLB1 − +++ +++ − − + +++ ++ − + +++ CHVRB1 +++ ++ − +++ − + + +++ − + + CHVRB2 +++ +++ ++ +++ + + ++ +++ − + + CHVRB3 +++ +++ +++ +++ + + + +++ − + + CHVRB4 +++ +++ +++ +++ + + +++ +++ − + + CHVRB5 +++ +++ ++ +++ − + − +++ − + + CHVRTB1 +++ +++ +++ +++ − + +++ ++ − + +++ CHVRTB2 +++ +++ +++ +++ + + +++ ++ − + +++ CHVRTB3 − +++ +++ − + + +++ ++ − + +++ CHVRTB4 +++ − − +++ + − +++ ++ − − − CHVRTB5 +++ + − +++ − + − +++ − − + CHVRTB6 +++ + − +++ − − + +++ − − + CHVRTB7 + − +++ + + − − +++ − + + * HCN: Hydrogen cyanide; TCP: Tricalcium phosphate, DCP: Dicalcium phosphate; Number of (+) sign indicates strength of activity, (−) indicates absence of activity. Table 3.
Qualitative observation of PGP traits of the endophytic isolates.
-
Isolates Indole acetic acid production (µg·mL−1) Gibberellic acid production (µg·mL−1)
(540 nm)Siderophore production (CAS ASSAY)
% PSUAmmonia production
(µg·mL−1)Without trp With trp CHVLB1 0.033 ± 0.006 13.50 ± 0.004 22.22 ± 0.003 32.71 ± 0.008 35.45 ± 0.004 CHVRB1 0.036 ± 0.006 16.91 ± 0.008 146.72 ± 0.004 41.05 ± 0.012 71.28 ± 0.031 CHVRB2 0.039 ± 0.003 17.62 ± 0.006 70.64 ± 0.009 49.40 ± 0.003 95.27 ± 0.009 CHVRB3 0.038 ± 0.005 20.76 ± 0.003 74.92 ± 0.007 49.30 ± 0.003 98.33 ± 0.006 CHVRB4 0.044 ± 0.004 17.84 ± 0.004 73.93 ± 0.009 48.96 ± 0.006 94.86 ± 0.005 CHVRB5 0.028 ± 0.009 23.95 ± 0.005 97.64 ± 0.008 8.16 ± 0.003 73.64 ± 0.032 CHVRTB1 0.038 ± 0.004 12.19 ± 0.007 *c149.03 ± 0.012 49.08 ± 0.002 69.05 ± 0.003 CHVRTB2 0.035 ± 0.014 18.14 ± 0.004 136.84 ± 0.006 27.50 ± 0.025 97.29 ± 0.031 CHVRTB3 0.037 ± 0.01 11.53 ± 0.002 103.57 ± 0.005 48.83 ± 0.002 74.89 ± 0.015 CHVRTB4 0.032 ± 0.007 *b29.53 ± 0.008 96.33 ± 0.005 *d69.77 ± 0.063 *e276.13 ± 0.13 CHVRTB5 *a0.054 ± 0.012 16.42 ± 0.008 92.05 ± 0.003 36.55 ± 0.10 79.97 ± 0.01 CHVRTB6 0.033 ± 0.016 22.96 ± 0.004 102.26 ± 0.005 32.04 ± 0.004 70.09 ± 0.007 CHVRTB7 0.037 ± 0.02 24.25 ± 0.005 57.79 ± 0.003 11.01 ± 0.002 66.54 ± 0.003 *a = highest IAA produced without trp supplement; *b = highest IAA produced with trp supplement; *c = highest GA3 concentration produced; *d = highest PSU released; *e = highest concentration of ammonia released. Table 4.
Quantitative observation of PGP traits of the endophytic isolates.
-
Isolates 5%
NaCl10%
NaCl15%
NaCl20%
NaCl0.15
MPA0.49
MPA1.03
MPACHLB1 + + − − + + + CHRB1 + + − − + + + CHRB2 + + − − + + + CHRB3 + + − − + + + CHRB4 + + − − + + + CHRB5 + − − − + + +++ CHRTB1 + + − − + + + CHRTB2 + + − − + + +++ CHRTB3 + + − − + + ++ CHRTB4 + + − − + + +++ CHRTB5 + + − − + + ++ CHRTB6 + − − − + + ++ CHRTB7 + − − − + + +++ Number of (+) sign indicates the increased appearance of colonies on media, (−) indicates absence of activity. Table 5.
Screening for salinity and osmotic stress tolerance on minimal DF (Dworkin and Foster) media.
-
Endophytic isolates Accession number Bacterial genus with highest similarity Accession number of closest match Identity % CHVLB1 MW680956 Bacillus sp. NR_116240.1 99.45 CHVRB1 MW680957 Bacillus sp. NR_148786.1 98.97 CHVRB2 MW680958 Bacillus sp. NR_112686.1 98.64 CHVRB3 MW680959 Bacillus sp NR_112686.1 99.75 CHVRB4 MW680960 Bacillus sp. NR_112686.1 99.84 CHVRTB1 MW680961 Glutamicibacter sp. NR_026190.1 99.21 CHVRTB2 MW680962 Bacillus sp. NR_113265.1 99.84 CHVRTB3 MW680963 Bacillus sp. NR_112686.1 99.92 CHVRTB4 MW680964 Bacillus sp. NR_157609.1 99.25 Table 6.
Taxonomic identification and sequence homology of isolated bacterial endophytes with genus or species affiliation and corresponding identity percentage in the NCBI database.
Figures
(5)
Tables
(6)