-
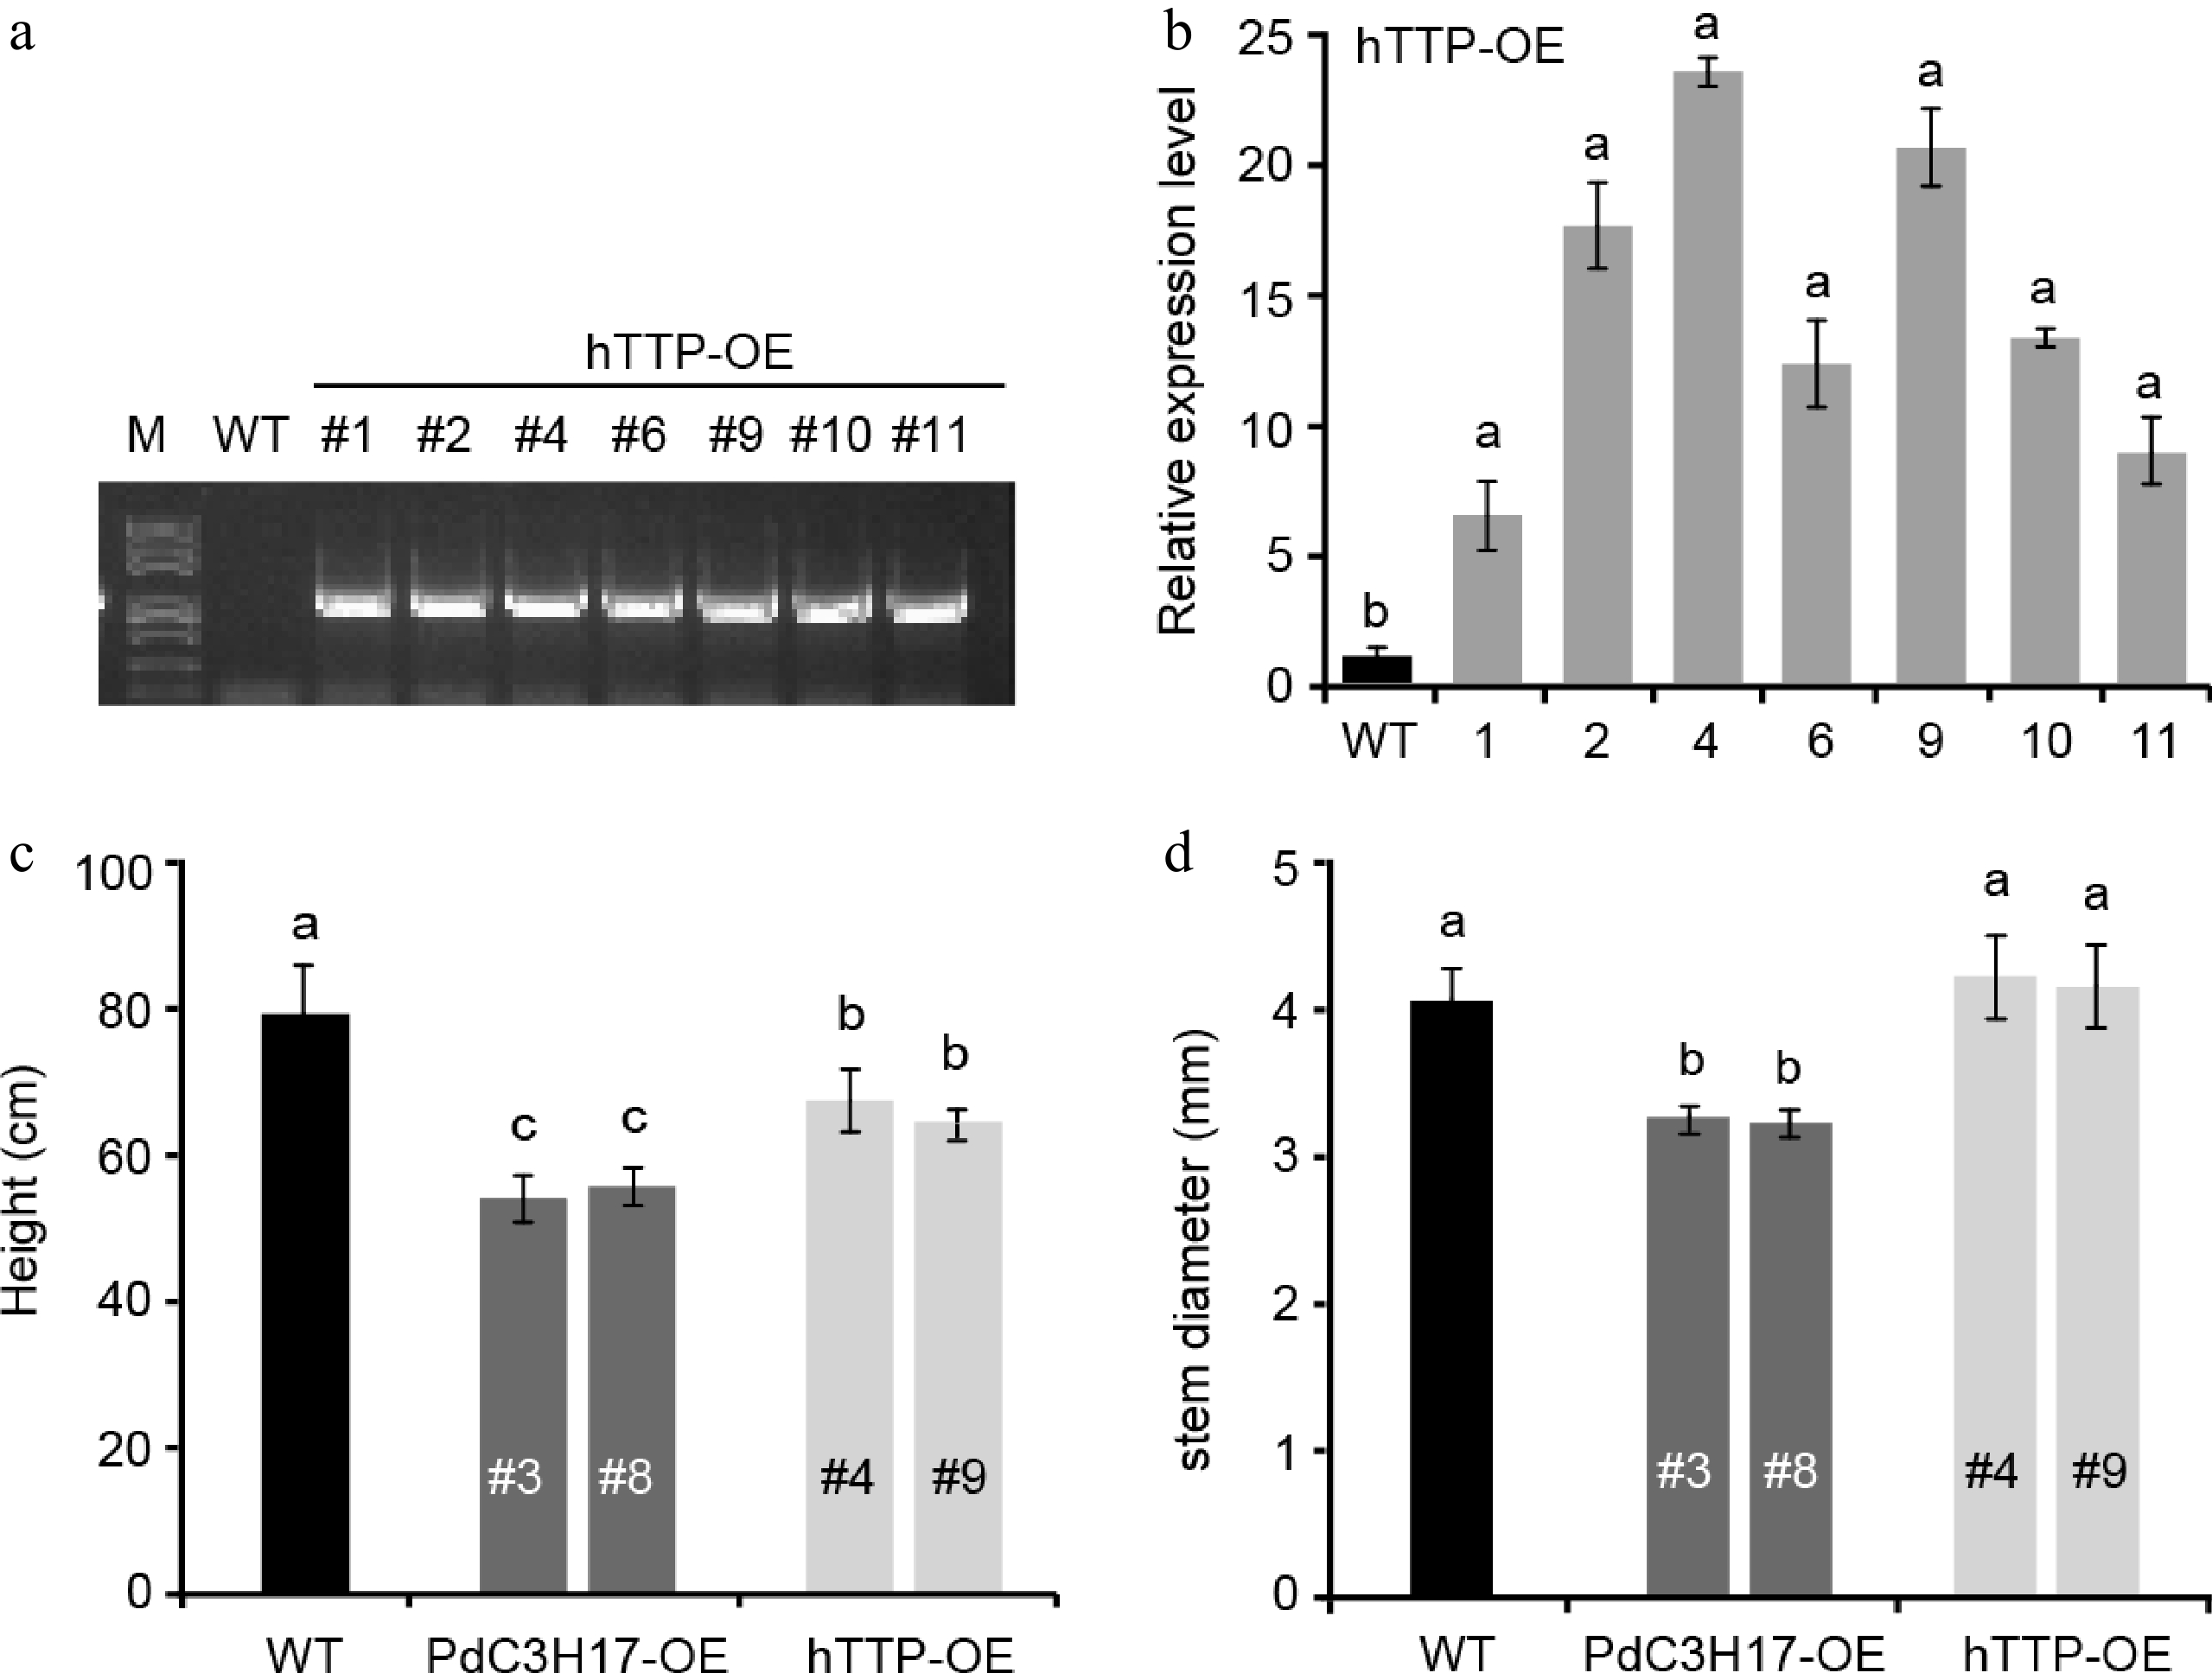
Figure 1.
Phenotypes of hTTP overexpression poplar lines. (a) PCR identification of representative hTTP overexpression (hTTP-OE) poplar lines on genomic DNAs using pro35S and hTTP-specific primers. Wild-type (WT) poplar was used as a control. (b) qRT-PCR analysis of hTTP expression levels in seven hTTP-OE lines. (c), (d) Height and stem diameter of 3-month-old WT, PdC3H17 overexpression (PdC3H17-OE), and hTTP-OE lines. In (b)−(d), different lowercase letters above bars indicate significant differences at p < 0.01 by ANOVA.
-
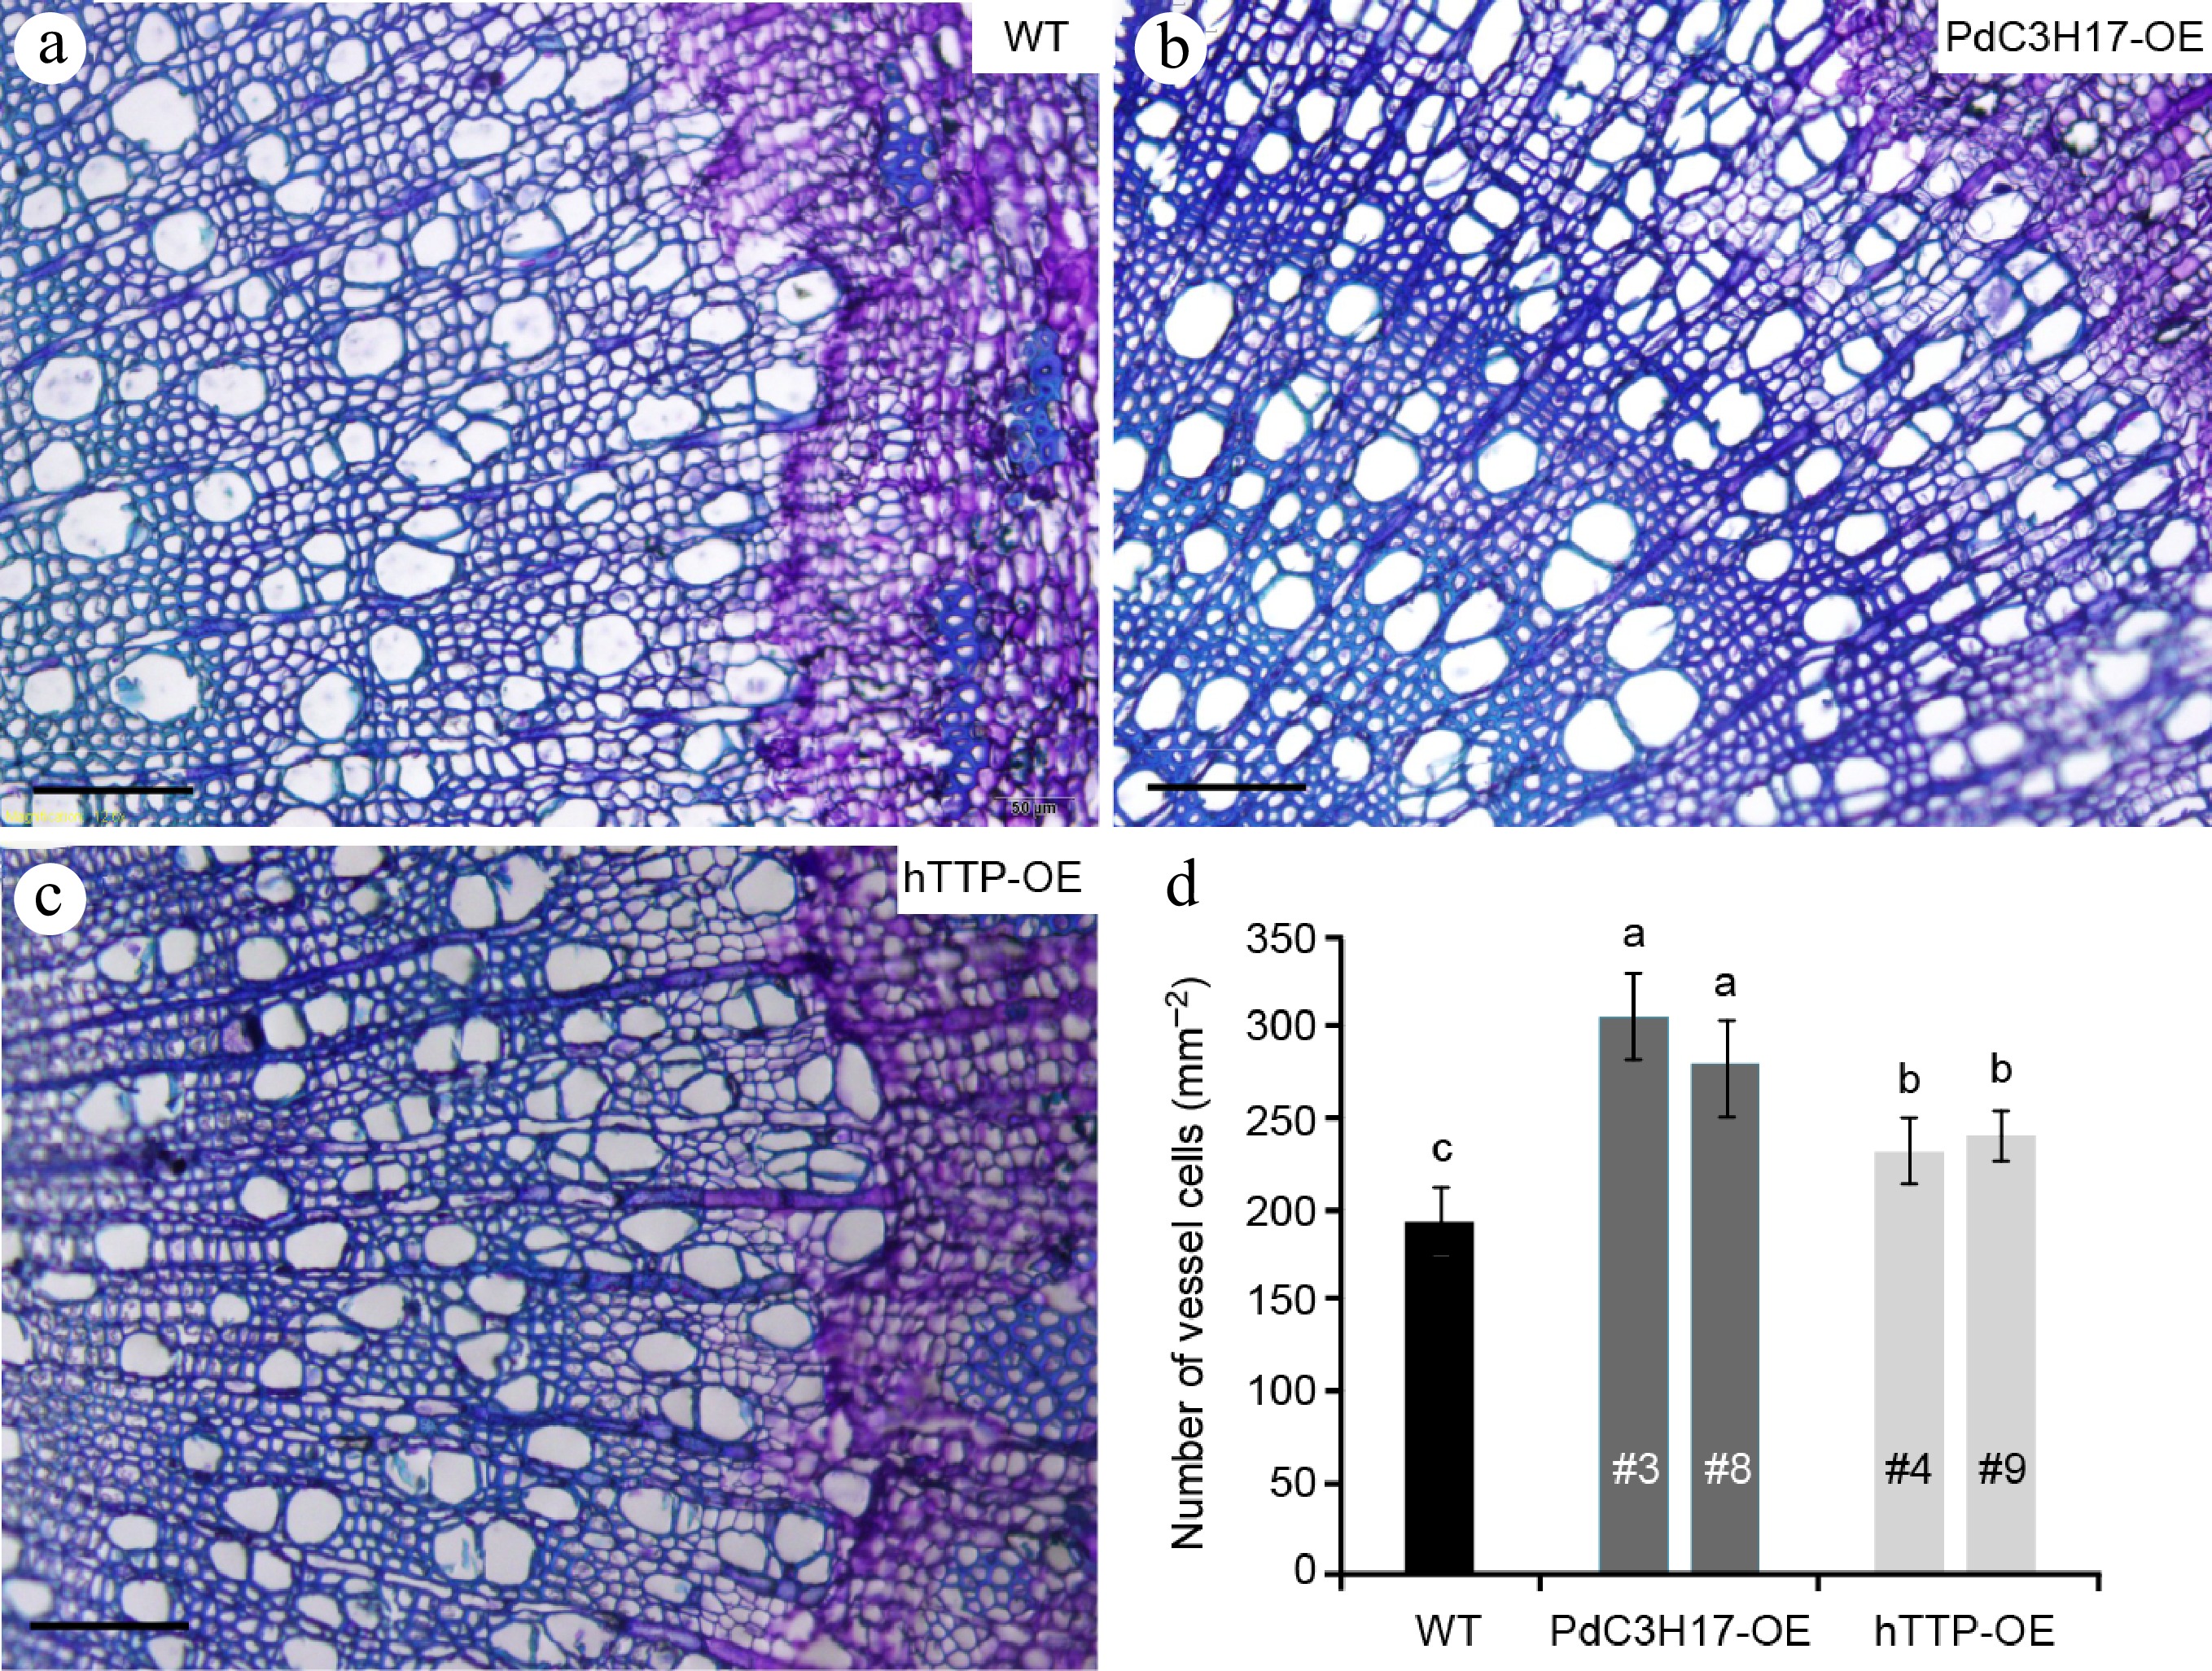
Figure 2.
Overexpression of hTTP in poplar increases the number of stem xylem vessel cells. (a)−(c) Basal stem sections of 3-month-old WT, PdC3H17-OE and hTTP-OE plants. Bars = 100 um. (d) Statistical analysis of the number of xylem vessel cells in WT, PdC3H17-OE and hTTP-OE plants shown in (a)−(c). For each line, at least 15 locations close to the cambium from five plants were selected for measurement. Data are presented as mean ± SD. Different letters denote significant differences between samples (p < 0.01).
-
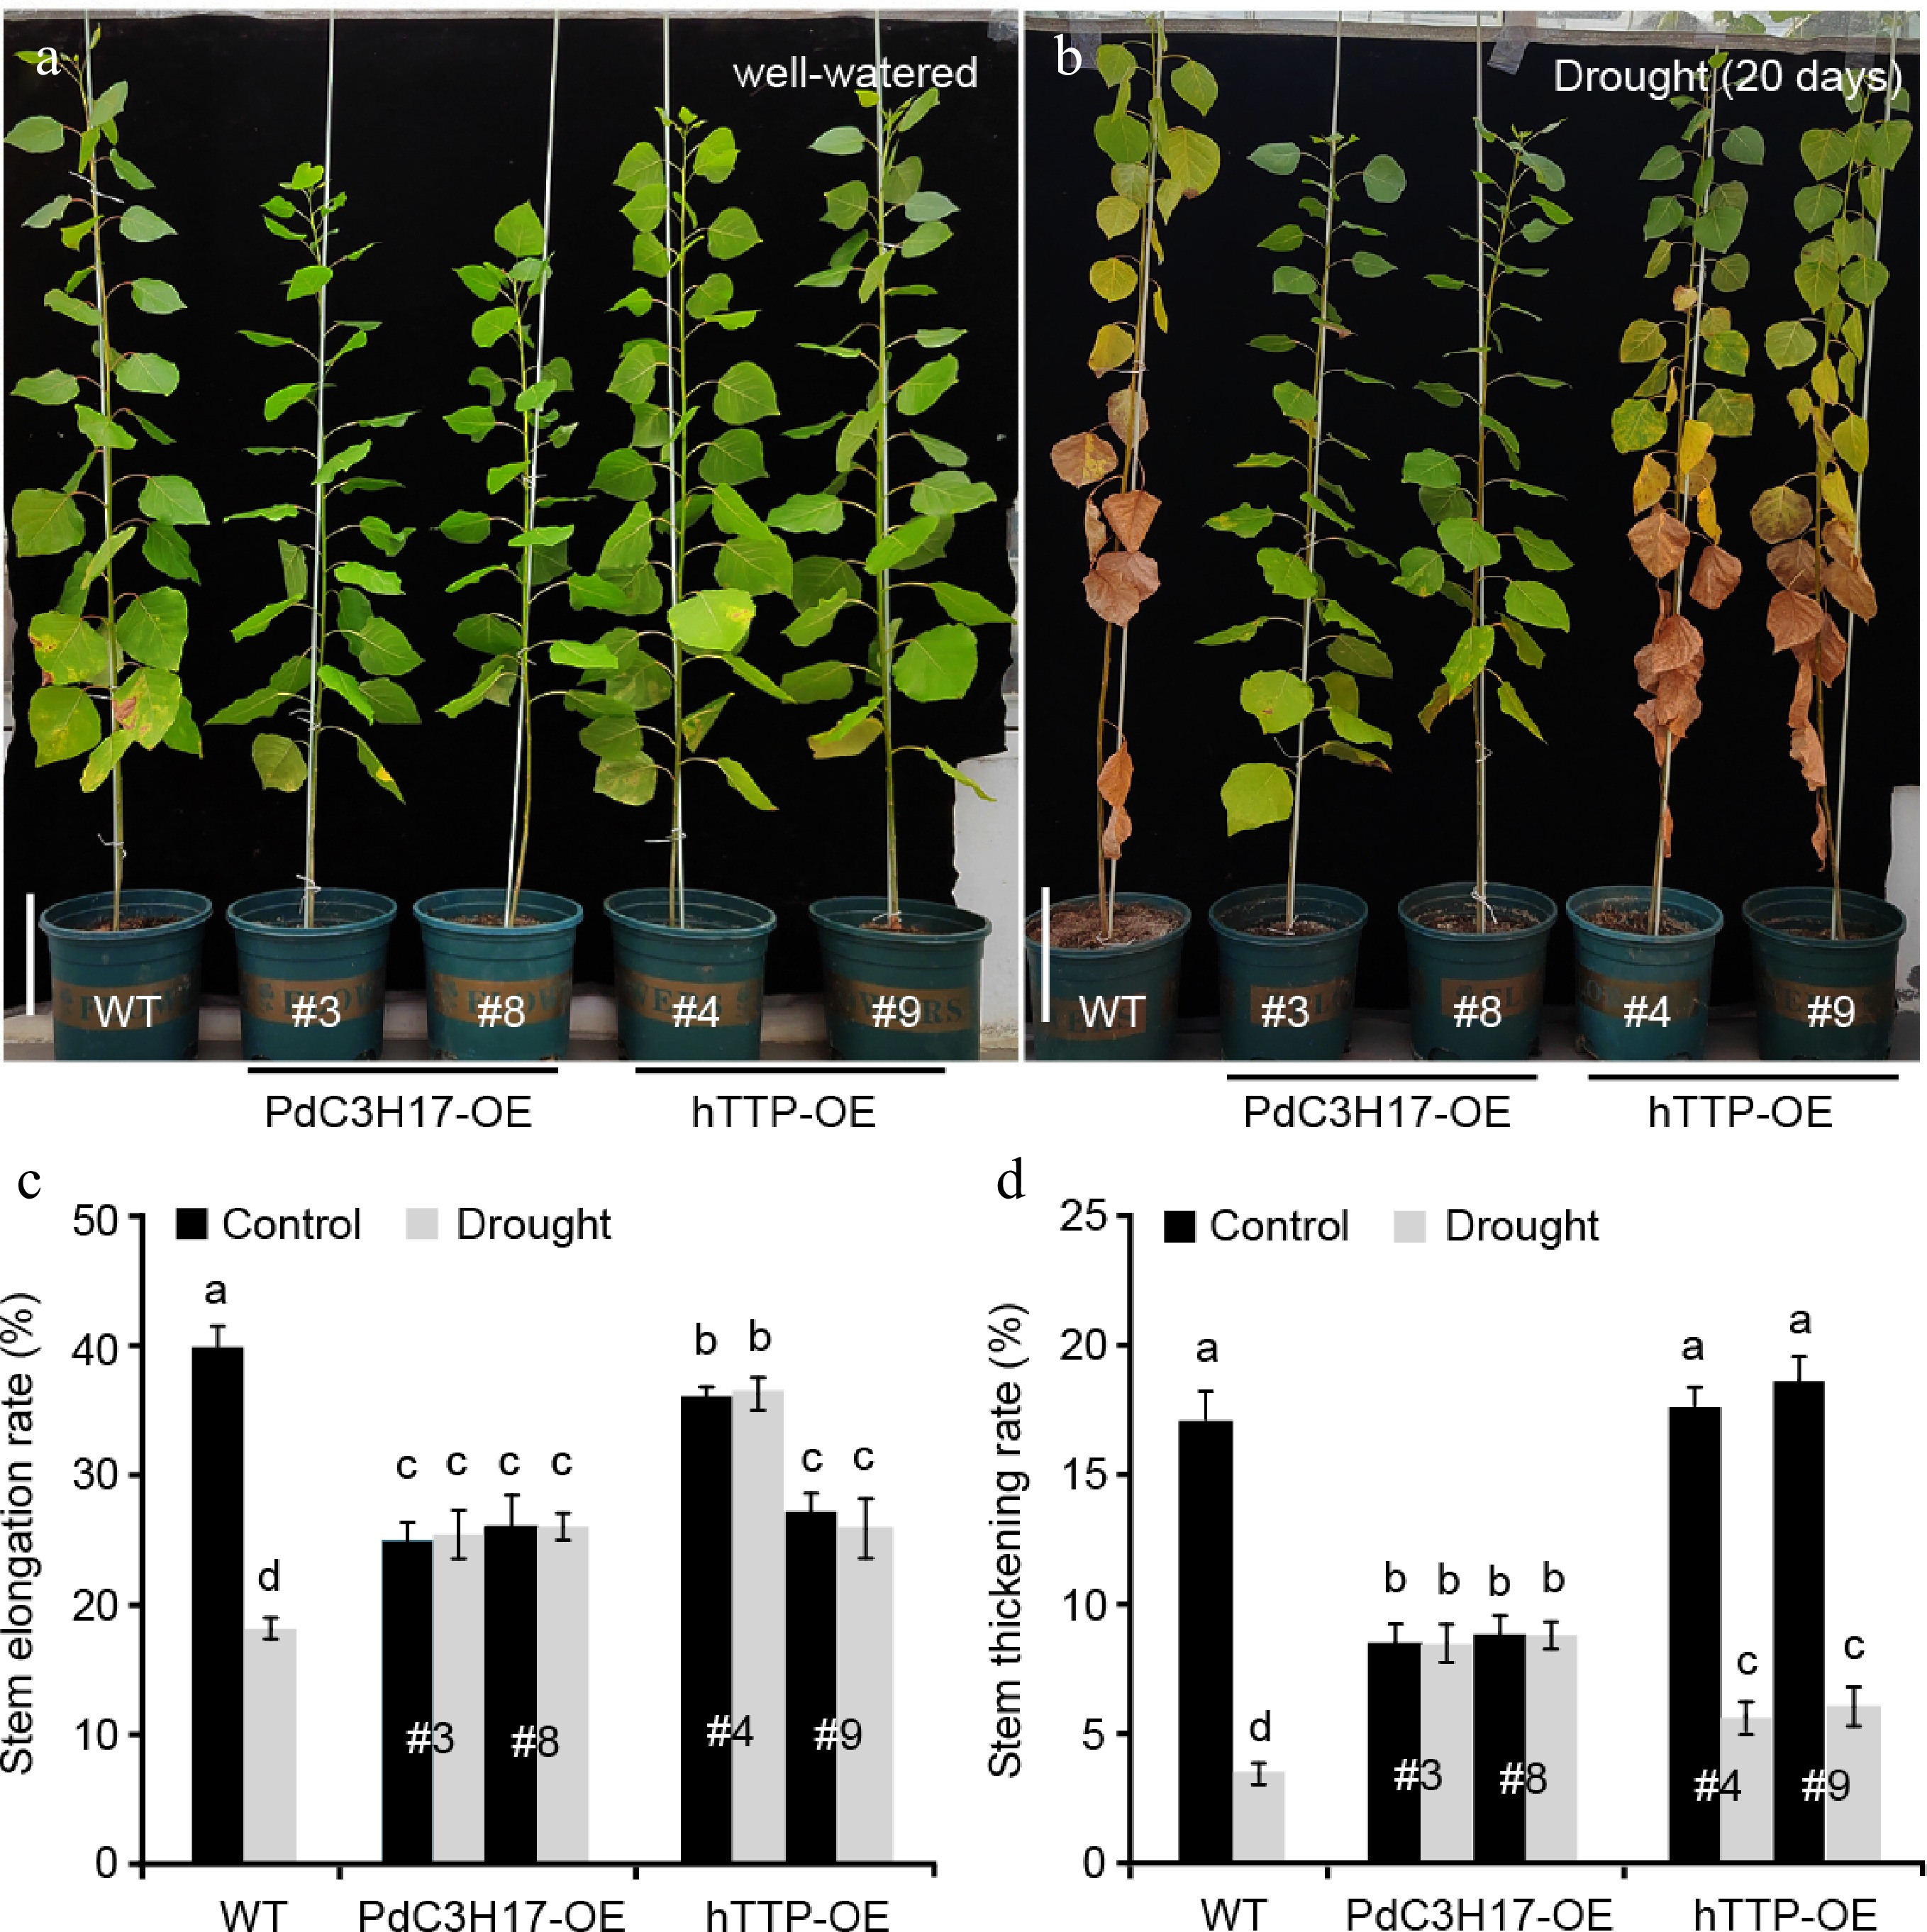
Figure 3.
Transgenic poplar lines overexpressing hTTP show enhanced drought tolerance. (a), (b) Drought responses of 3-month-old WT, PdC3H17-OE and hTTP-OE poplar lines. Bars = 10 cm in (a). (c), (d) Stem elongation and thickening rates of WT, PdC3H17-OE and hTTP-OE plants shown in (a), (b). For each line, at least five plants were used for measurement. Data are presented as mean ± SD. Different letters indicate significant differences between samples (p < 0.01).
-
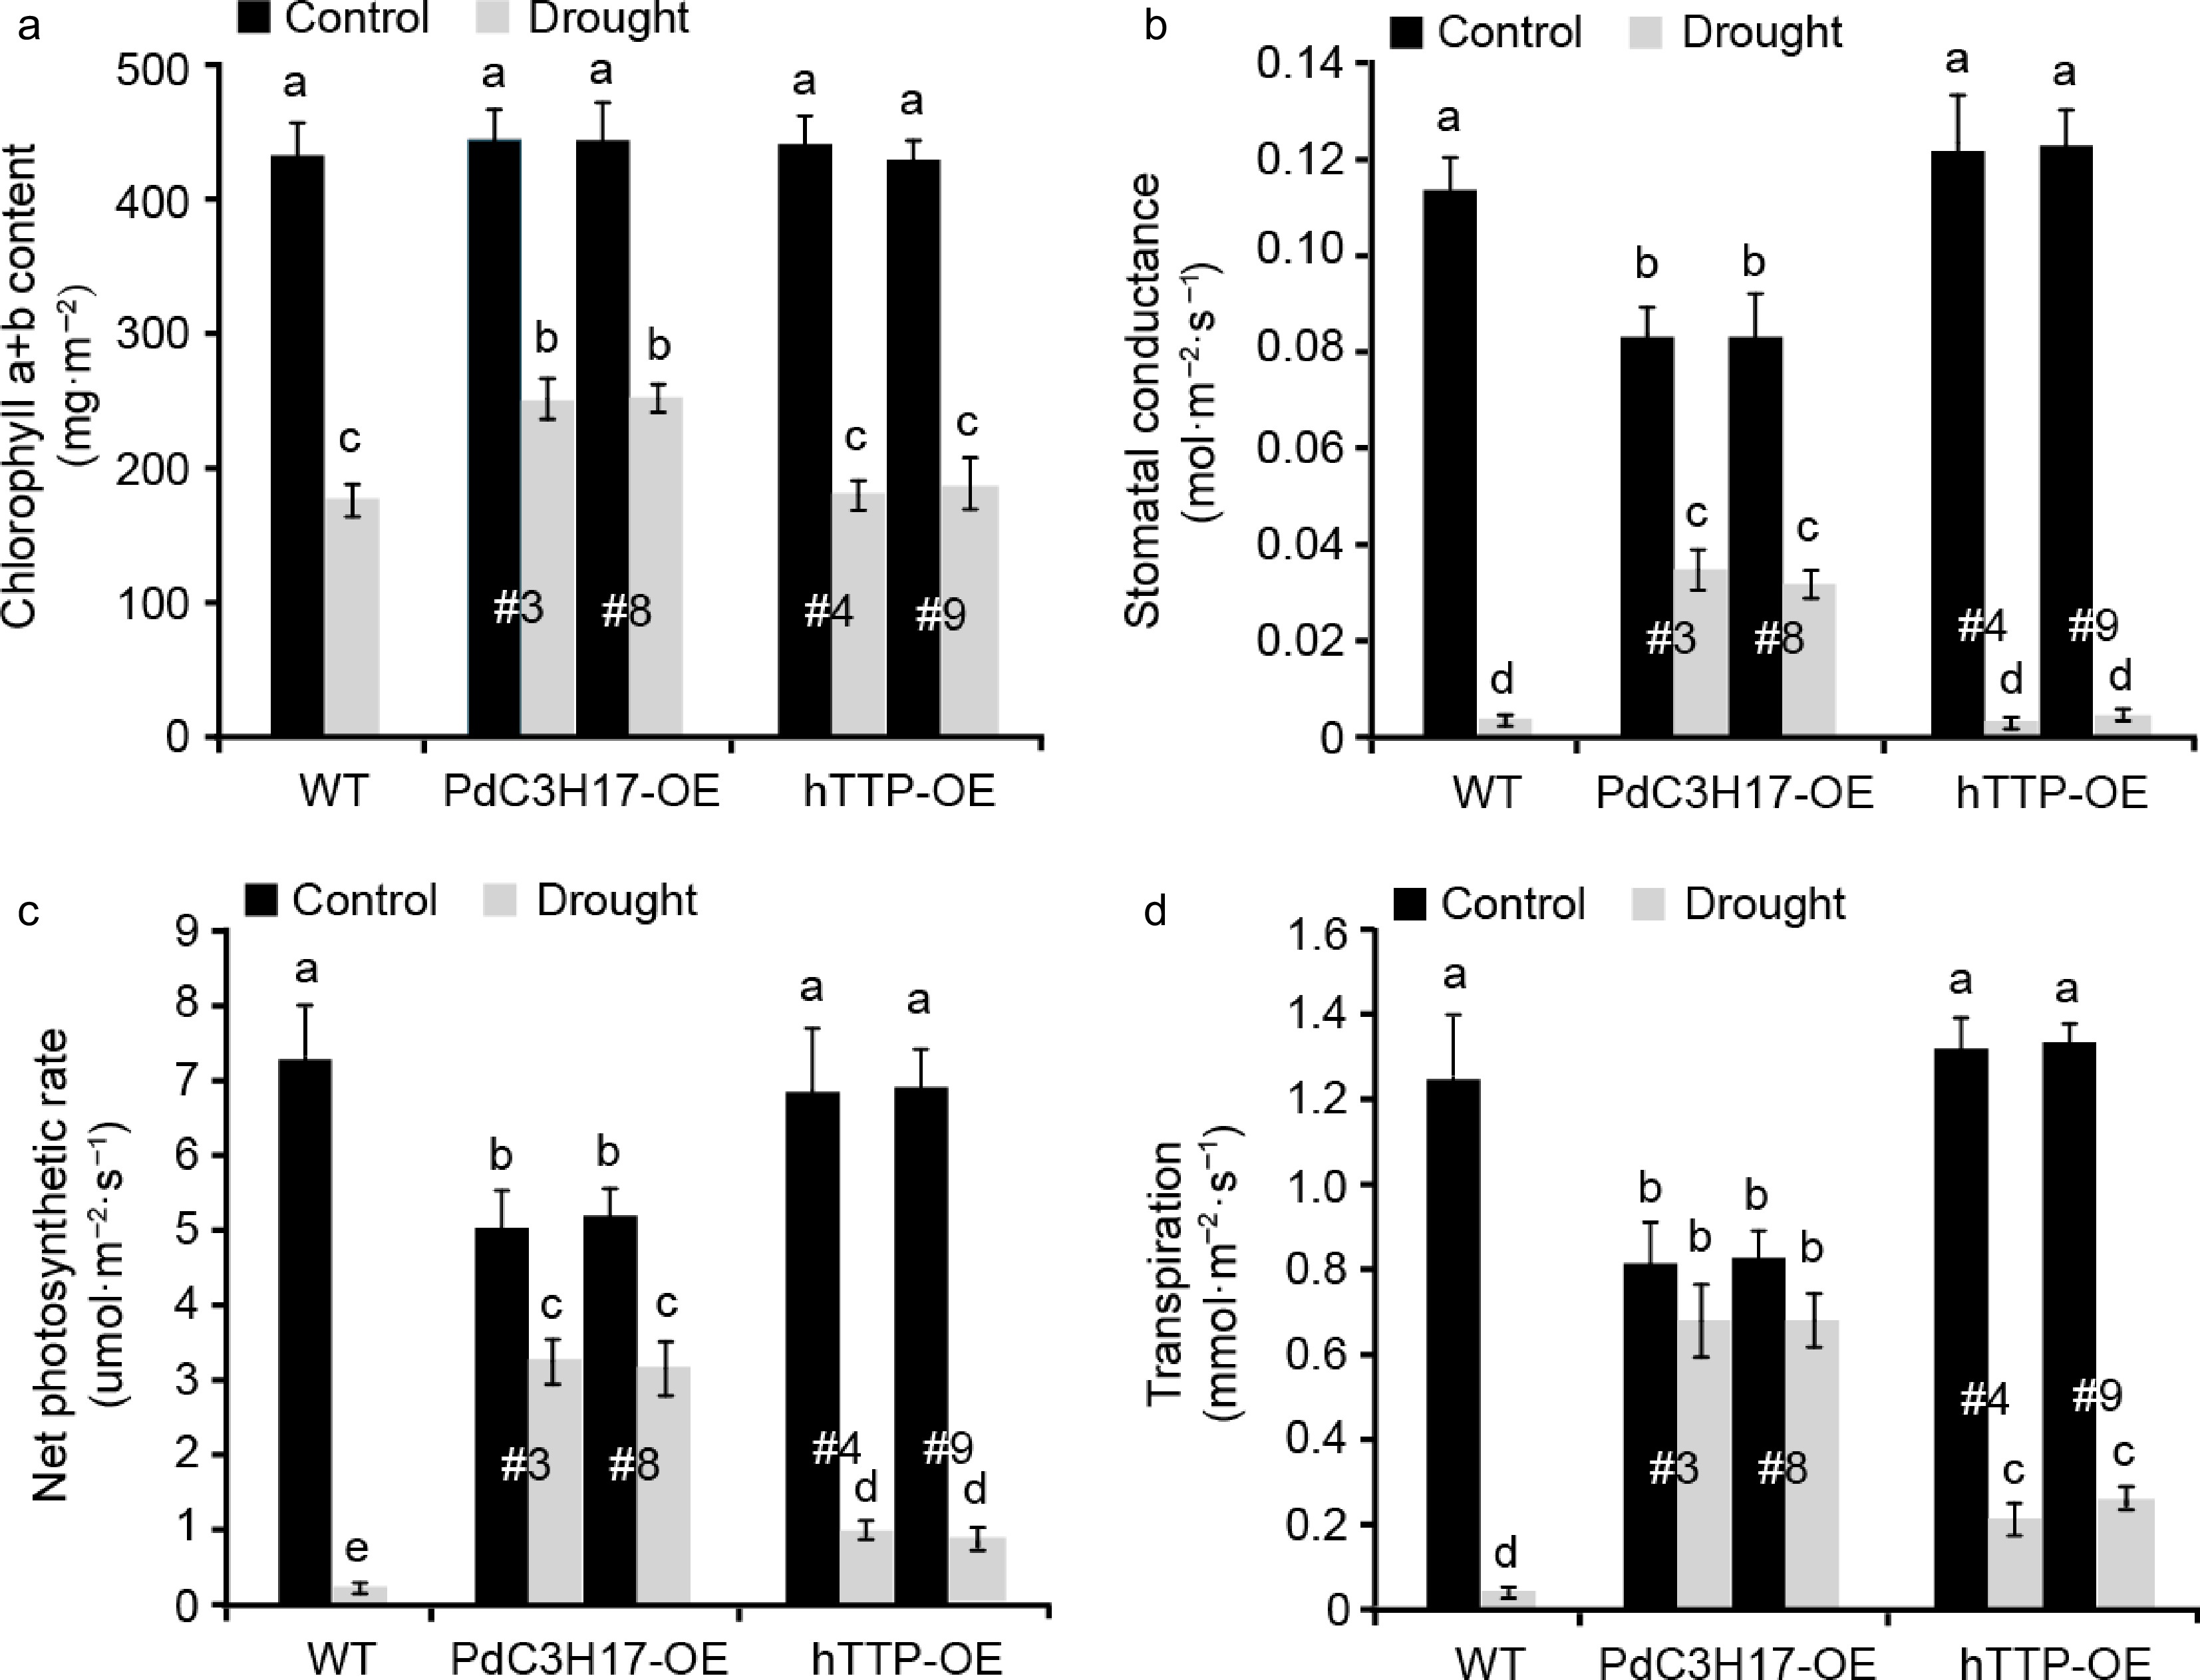
Figure 4.
Transgenic poplar lines overexpressing hTTP have higher photosynthetic capacities than control plants after drought treatment. (a)−(d) Effects of hTTP overexpression in poplar on chlorophyll a+b content, stomatal conductance, net photosynthetic rate and transpiration under drought treatment. For each line, at least five plants were used for measurement. Data are presented as mean ± SD. Different letters indicate significant differences between samples (p < 0.01).
-
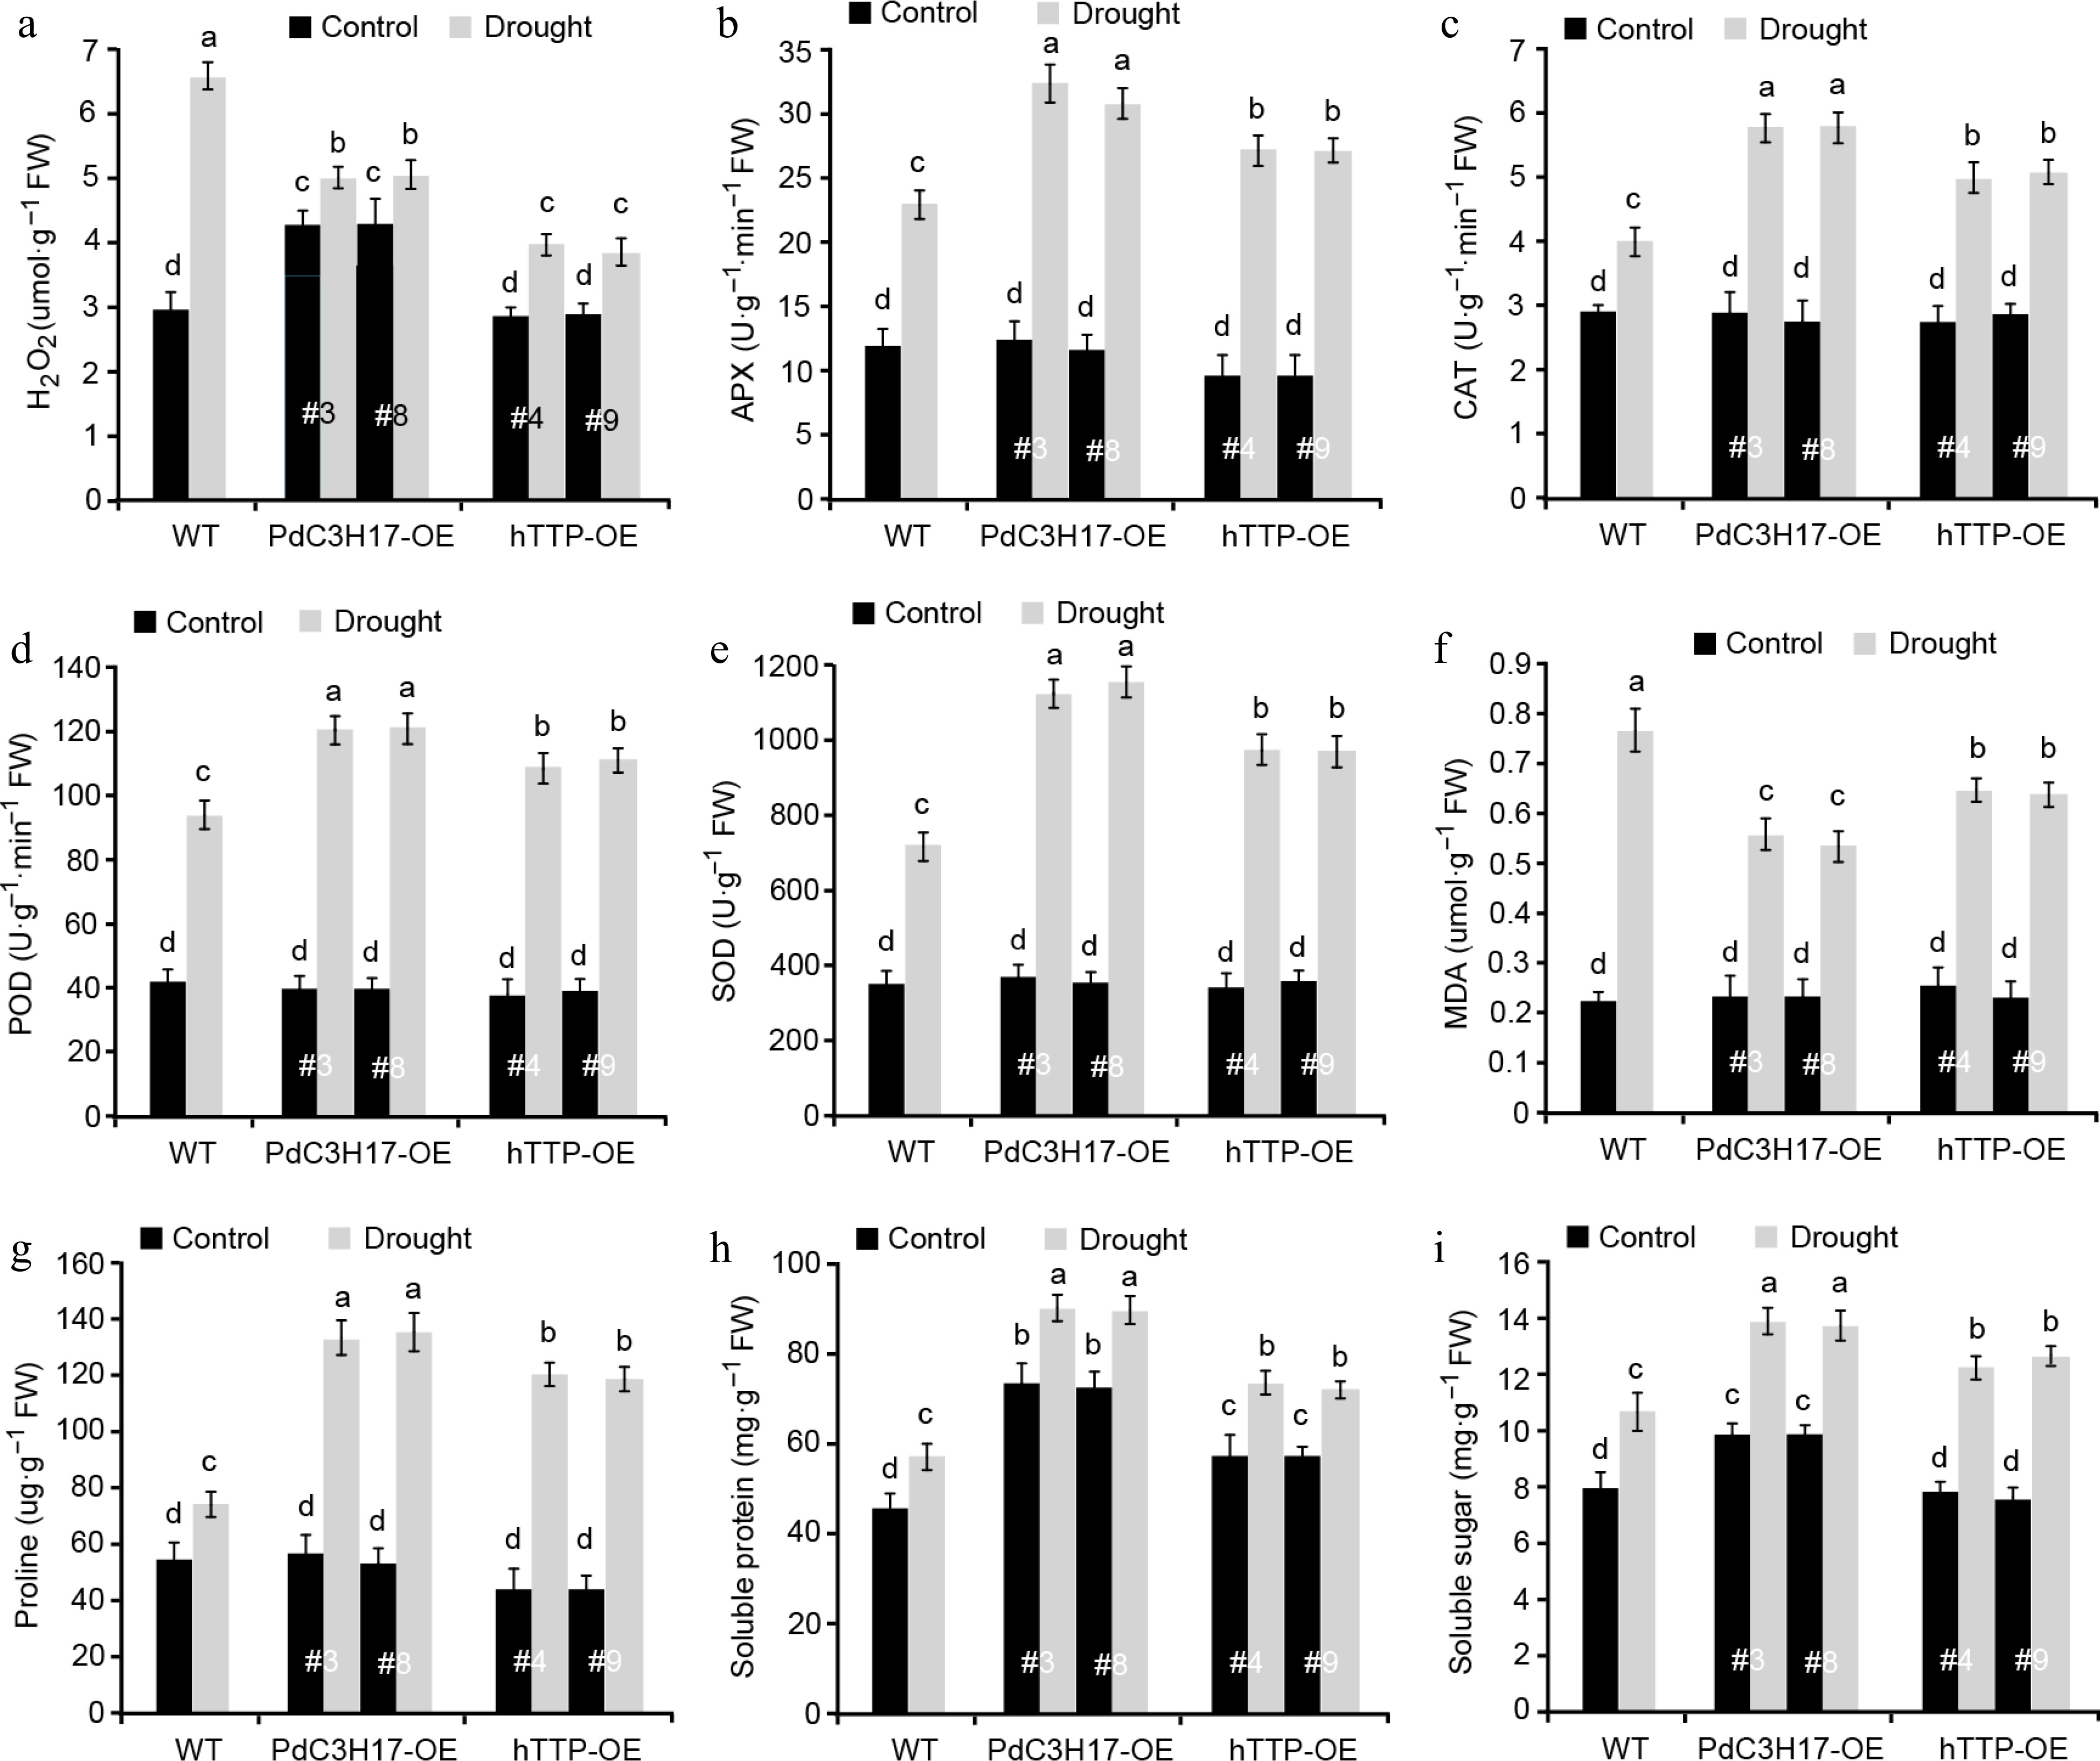
Figure 5.
Transgenic poplar lines overexpressing hTTP show stronger ROS-scavenging abilities than control plants after drought treatment. H2O2, hydrogen peroxide. MDA, malondialdehyde. APX, ascorbate peroxidase. CAT, catalase. POD, peroxidase. SOD, superoxide dismutase. For each line, at least five plants were used for measurement. Data are presented as mean ± SD. Different letters indicate significant differences between samples (p < 0.01).
-
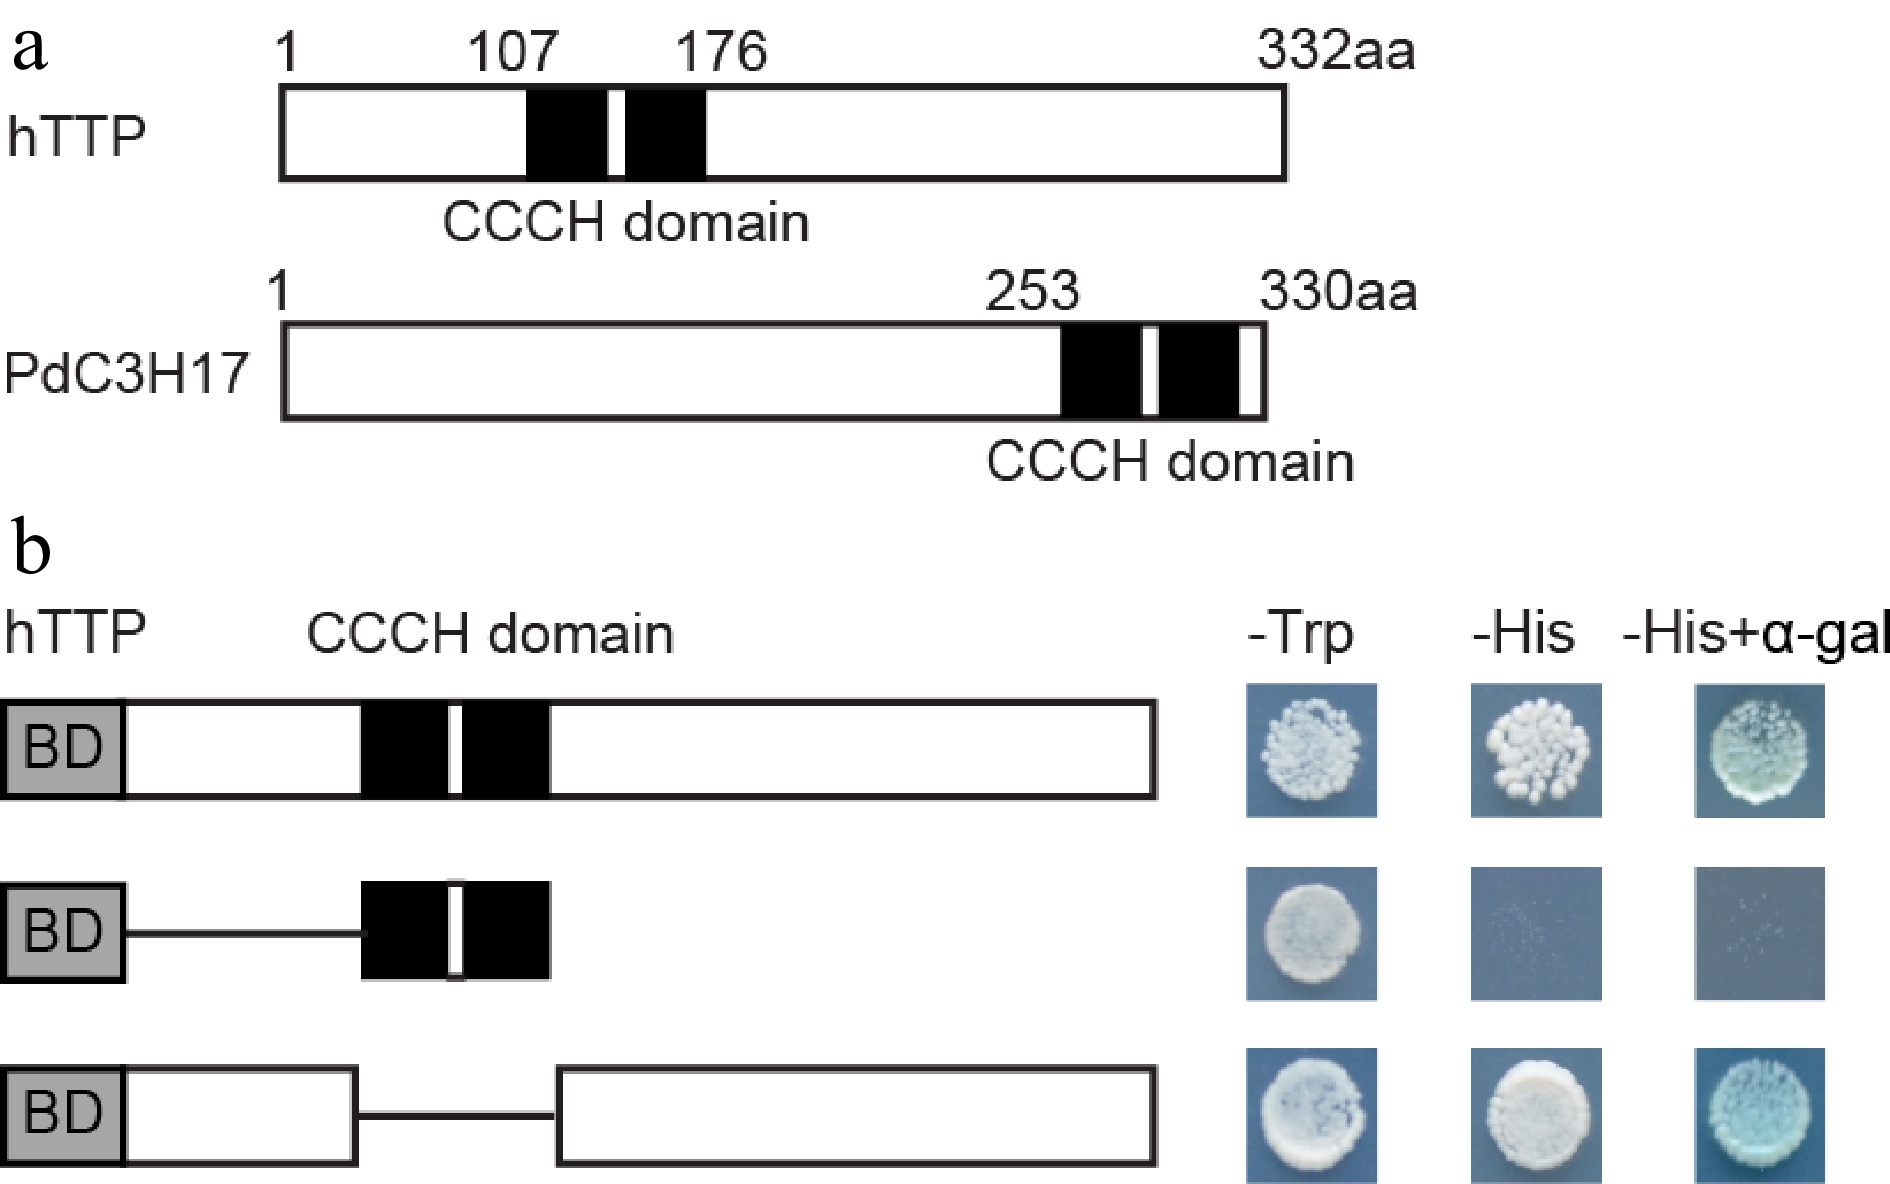
Figure 6.
Transcription activation activity of hTTP. (a) Diagram of hTTP and PdC3H17 proteins. (b) GAL4 DNA binding domain fused with full-length or truncated hTTP sequences were expressed in the yeast strain AH109. LacZ activity was observed in SD/-His medium containing X-α-Gal. pGBKT7 was used as a negative control. aa, amino acid.
-
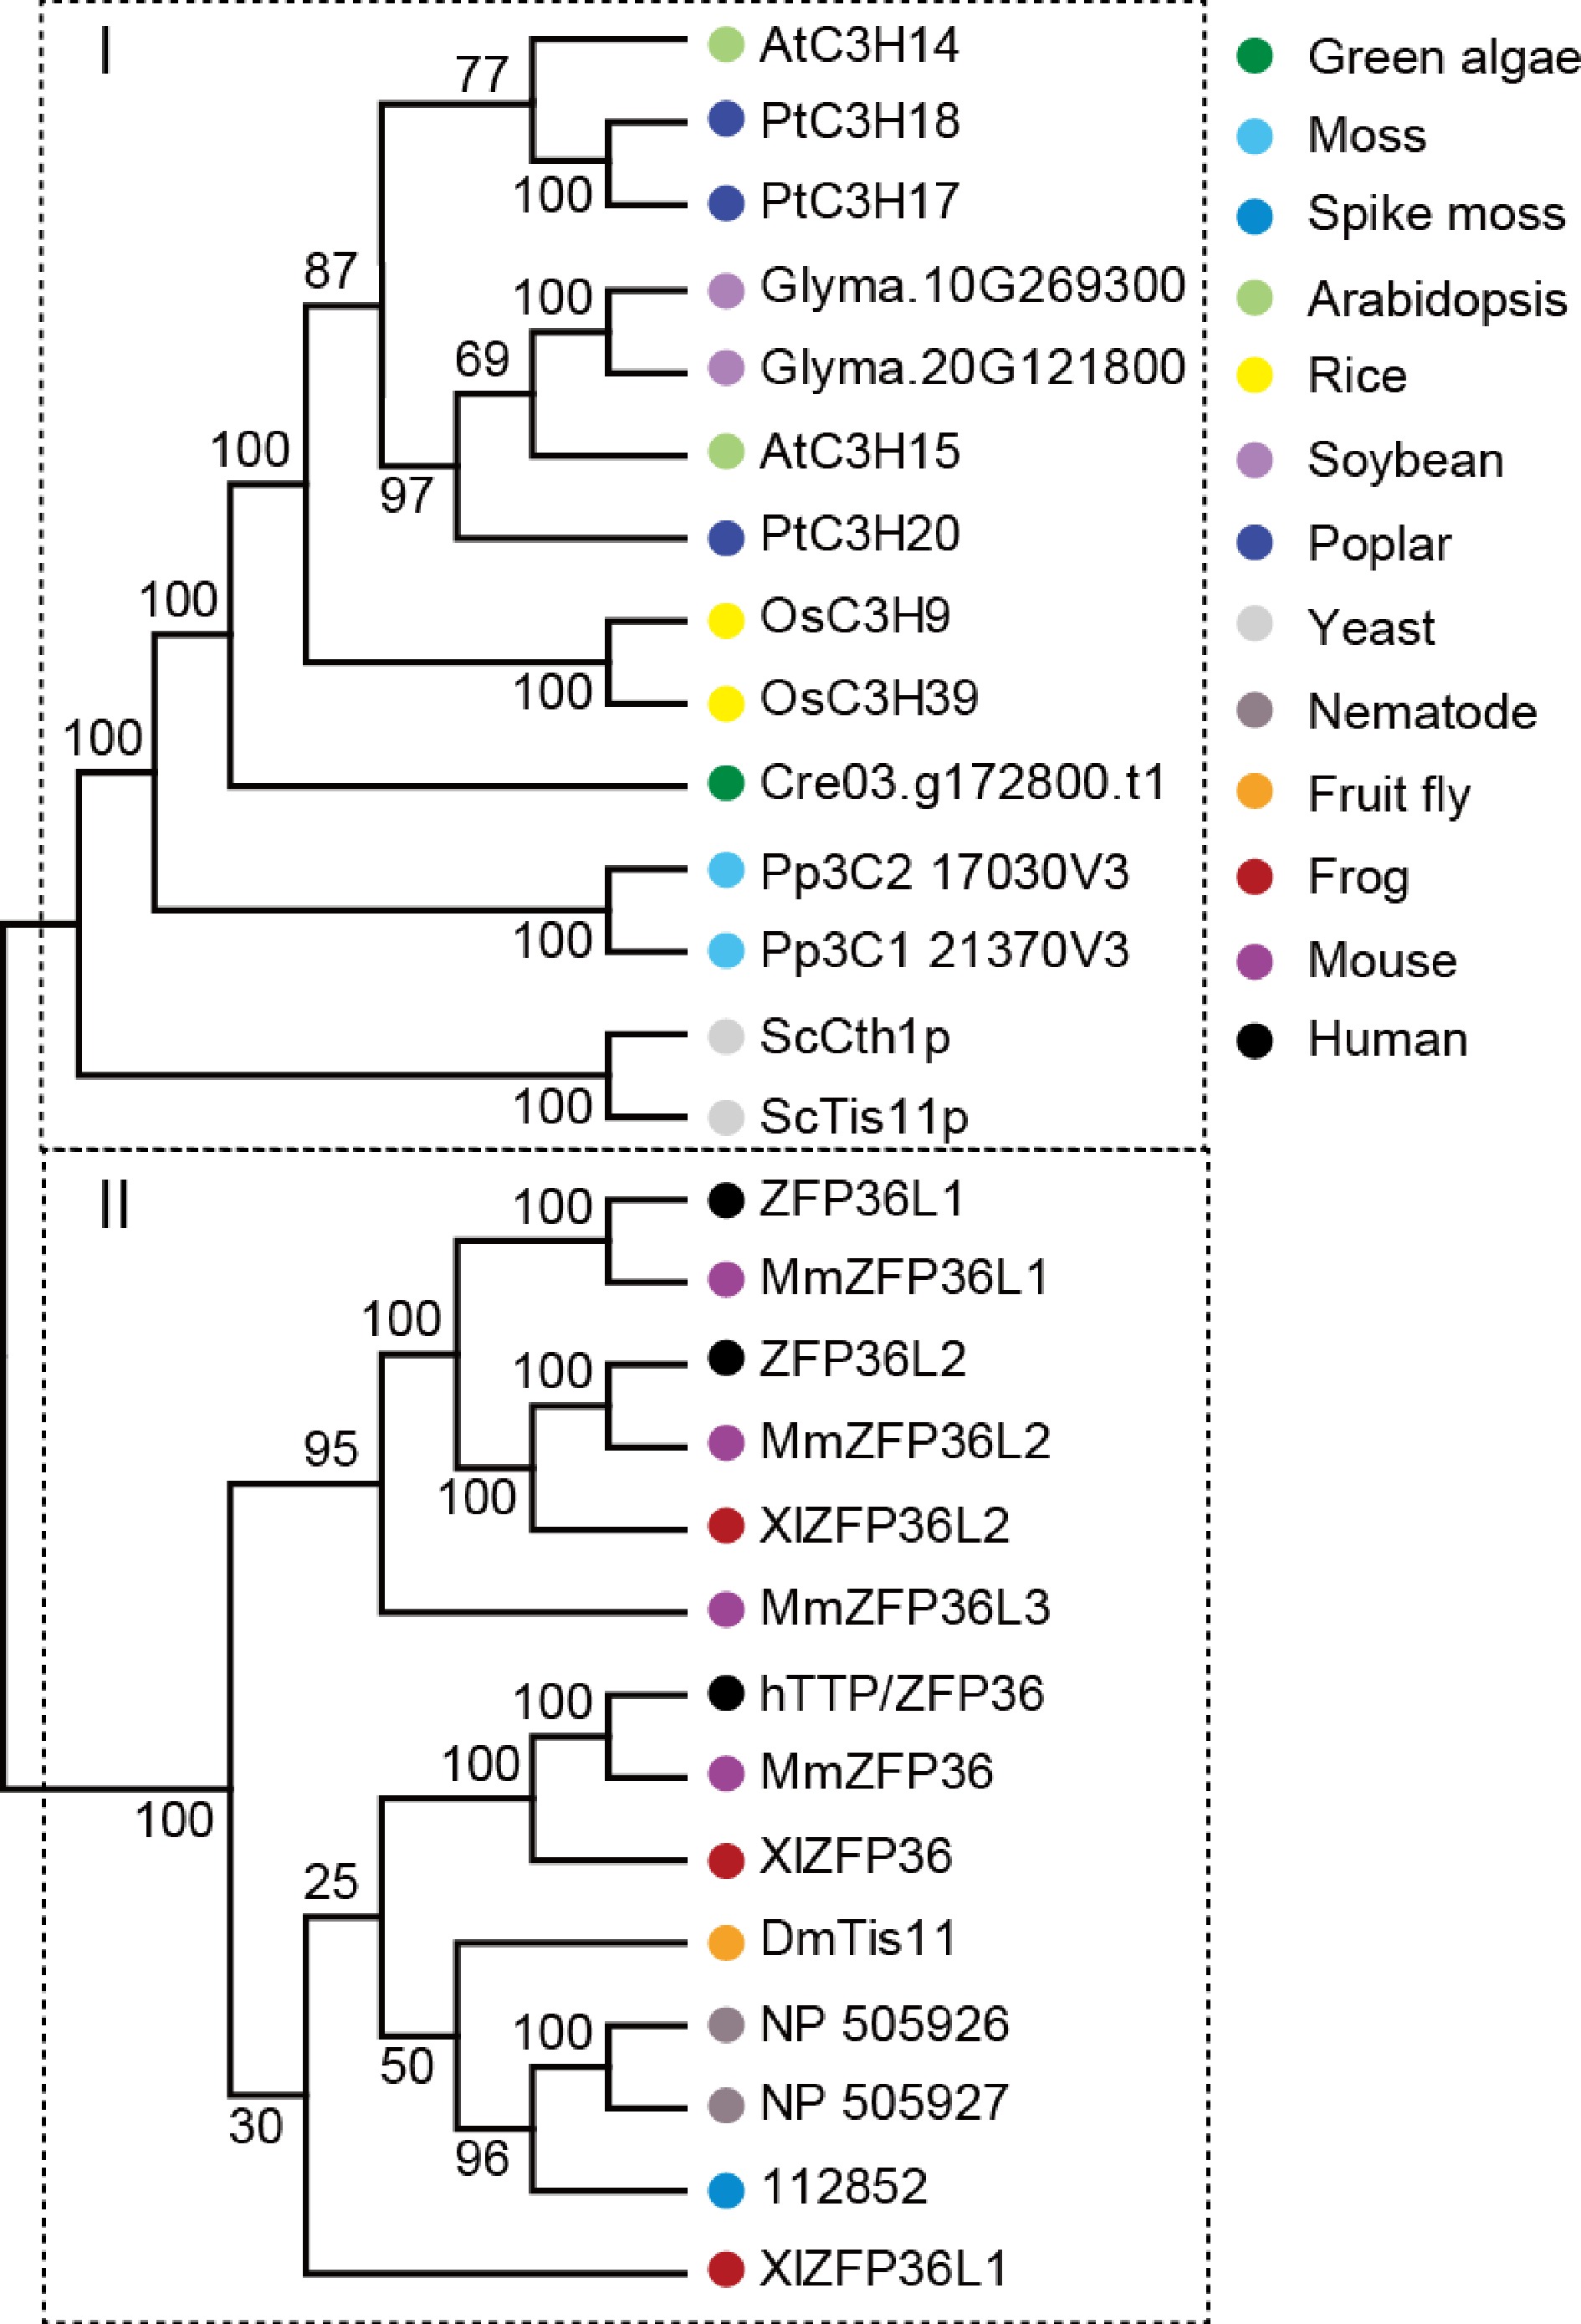
Figure 7.
Phylogenetic analysis of hTTP and its homologous proteins from 13 representative species. The neighbor-joining (NJ) tree was constructed based on the alignment of full-length protein sequences. MEGA 7.0 was used with 1,000 bootstrap replicates.
Figures
(7)
Tables
(0)