-
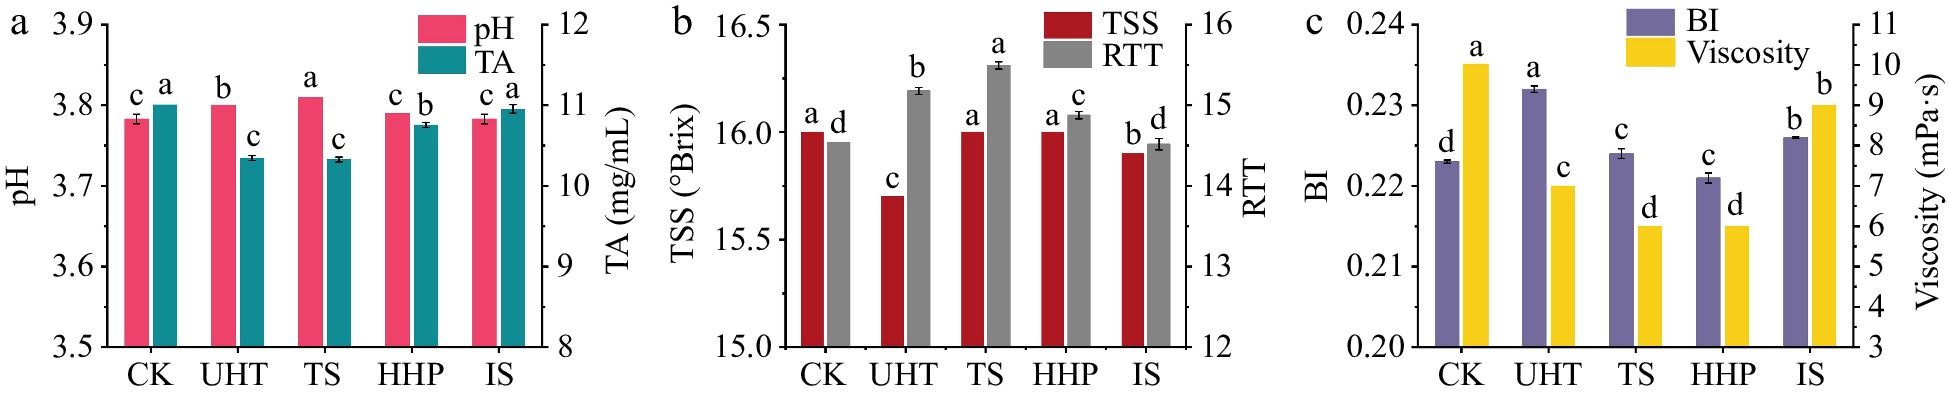
Figure 1.
Influences of various sterilization methods on the physicochemical indexes of AMJ. (a) pH and TA; (b) TSS and RTT; (c) BI and viscosity. Different lowercase letters in the figure indicate significant differences (p < 0.05).
-
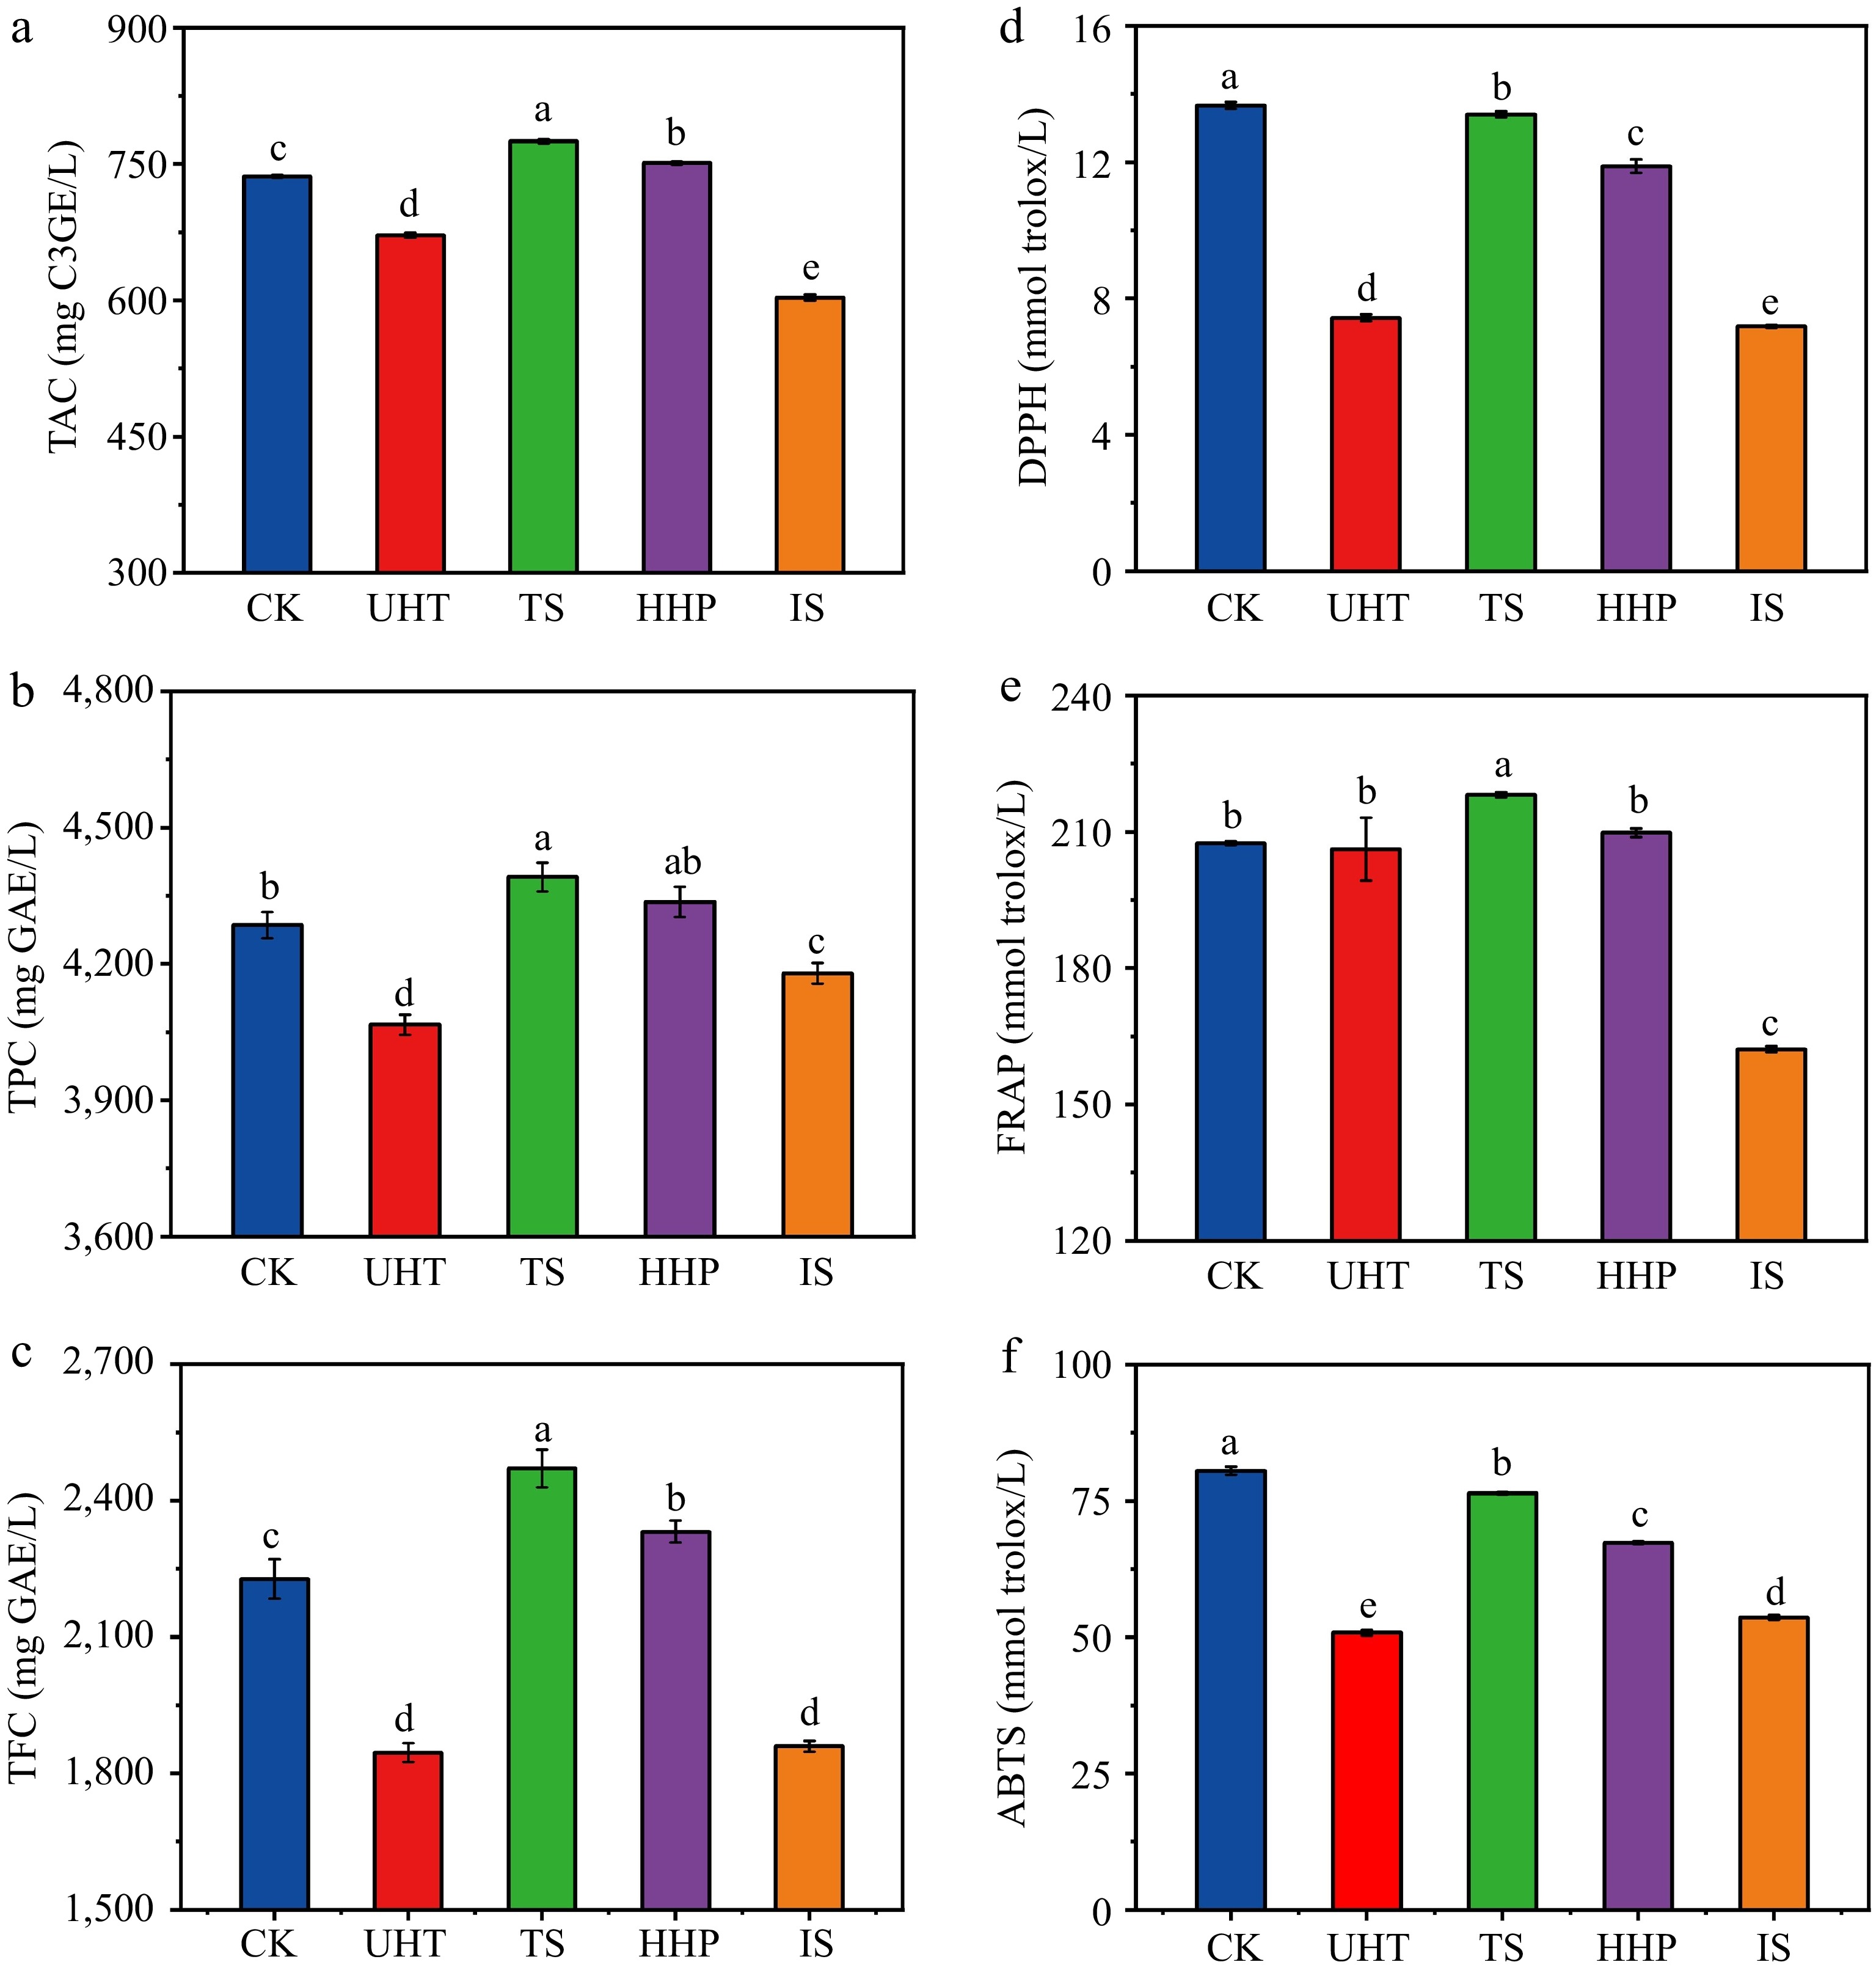
Figure 2.
Effects of different sterilization methods on functional indexes and antioxidant capacities of AMJ. (a) TAC; (b) TPC; (c) TFC; (d) DPPH; (e) FRAP; (f) ABTS. Different lowercase letters express significant differences (p < 0.05).
-
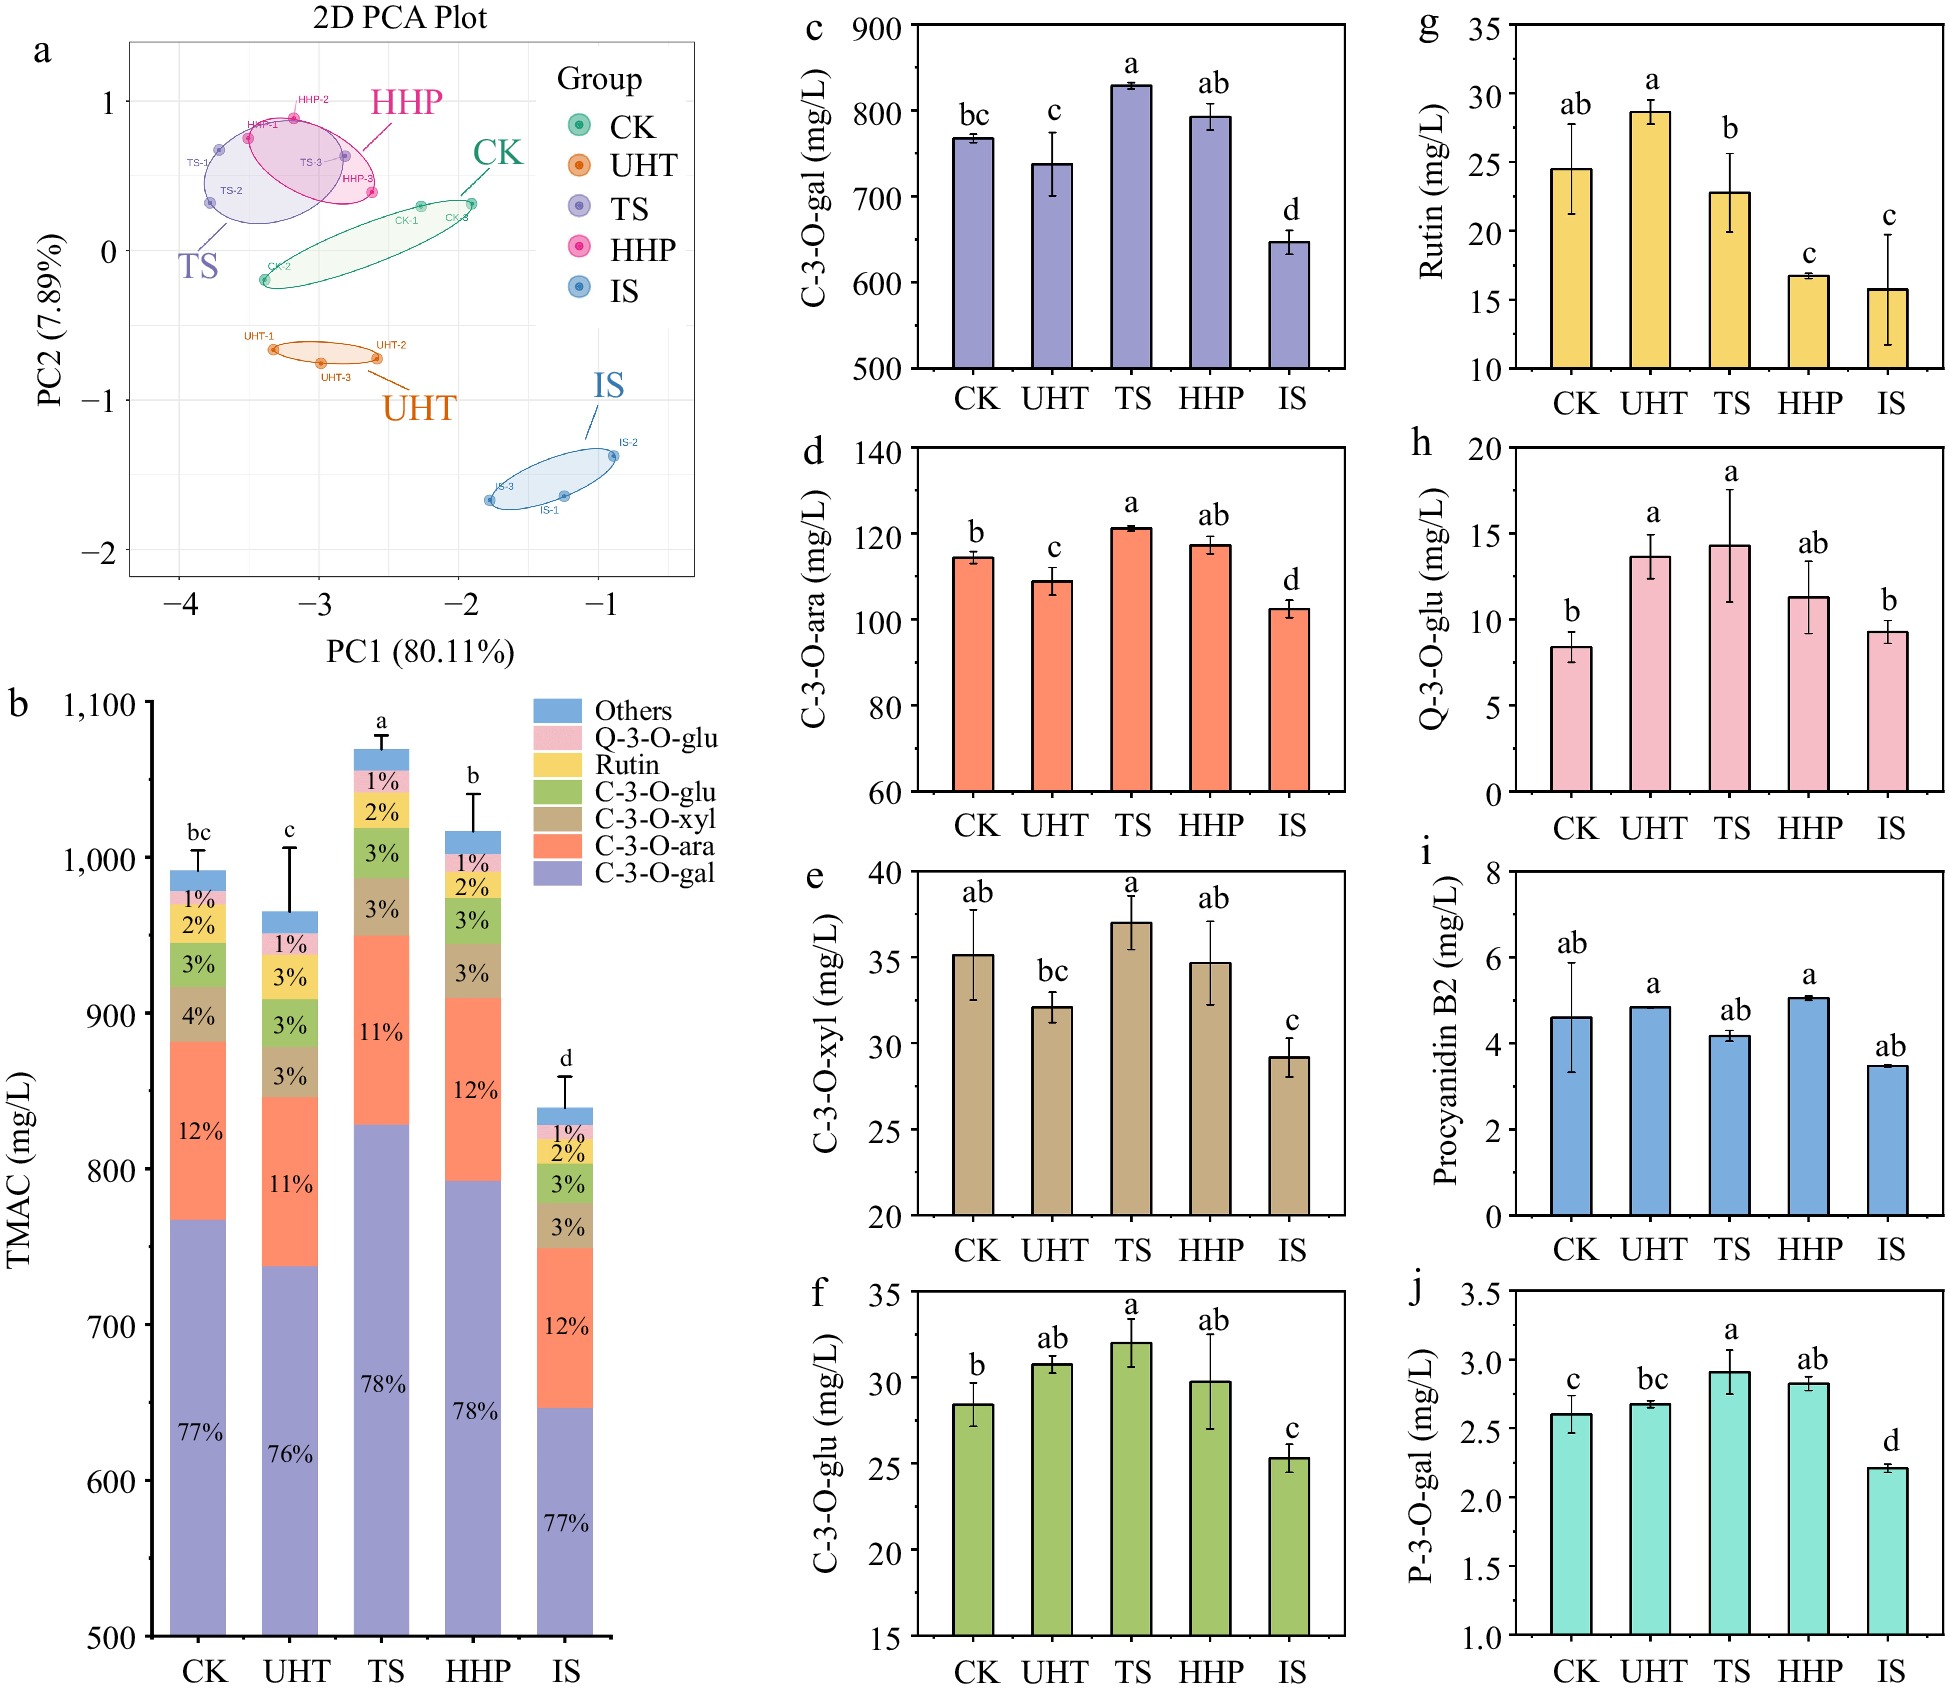
Figure 3.
(a) The PCA score map, (b) TMAC, and (c)–(j) main anthocyanin monomer (> 2.5 mg/L) content of AMJ. Different lowercase letters express significant differences (p < 0.05).
-

Figure 4.
Differential metabolites analysis. (a) Venn diagrams of differential anthocyanin metabolites from CK compared to other groups; (b) Venn diagrams of differential anthocyanin metabolites from UHT compared to other groups; (c) Venn diagrams of differential anthocyanin metabolites from TS compared to other groups; (d) Venn diagrams of differential anthocyanin metabolites from HHP compared to other groups; (e) Venn diagrams of differential anthocyanin metabolites from IS compared to other groups; and the content and structure maps of the marker differential anthocyanin metabolites produced by the (f), (g) CK, (h) TS, (i) HHP, and (j) IS treatments. Log2FC indicates the differential multiplicity of metabolites as a logarithmic result of a base value of 2. '*' expresses significant correlation (p < 0.05).
-
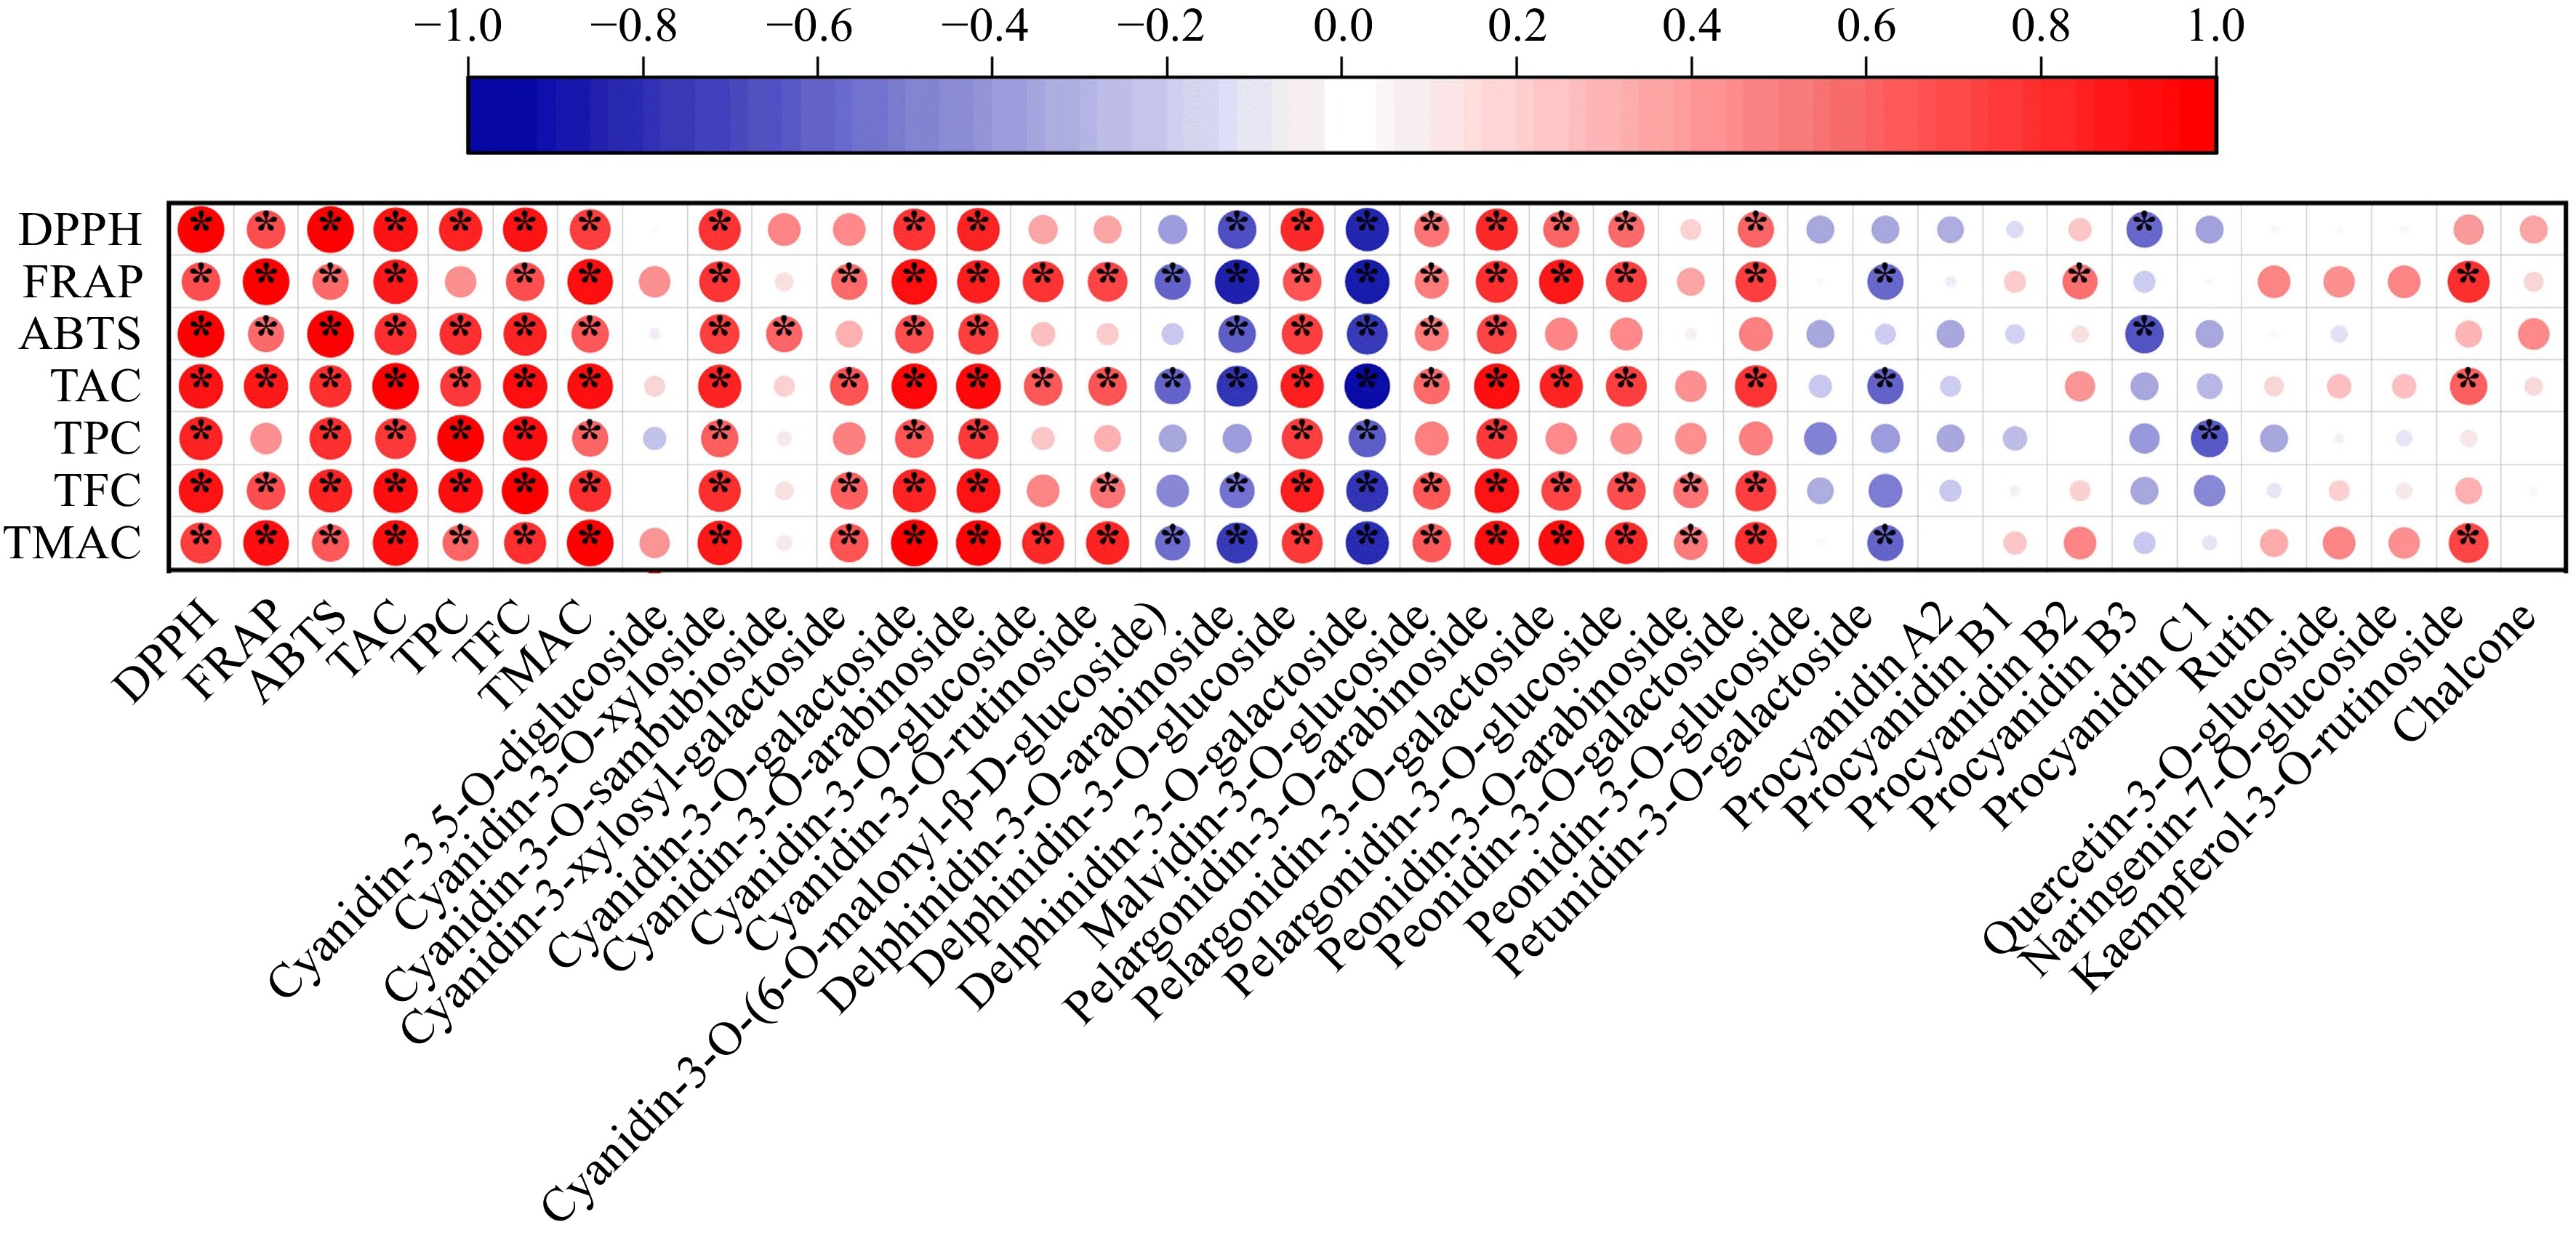
Figure 5.
Heatmap of correlation between DPPH, FRAP, ABTS, TAC, TPC, TFC, TMAC and each detected anthocyanin monomers in AMJ. '*' expresses significant correlation (p < 0.05).
-
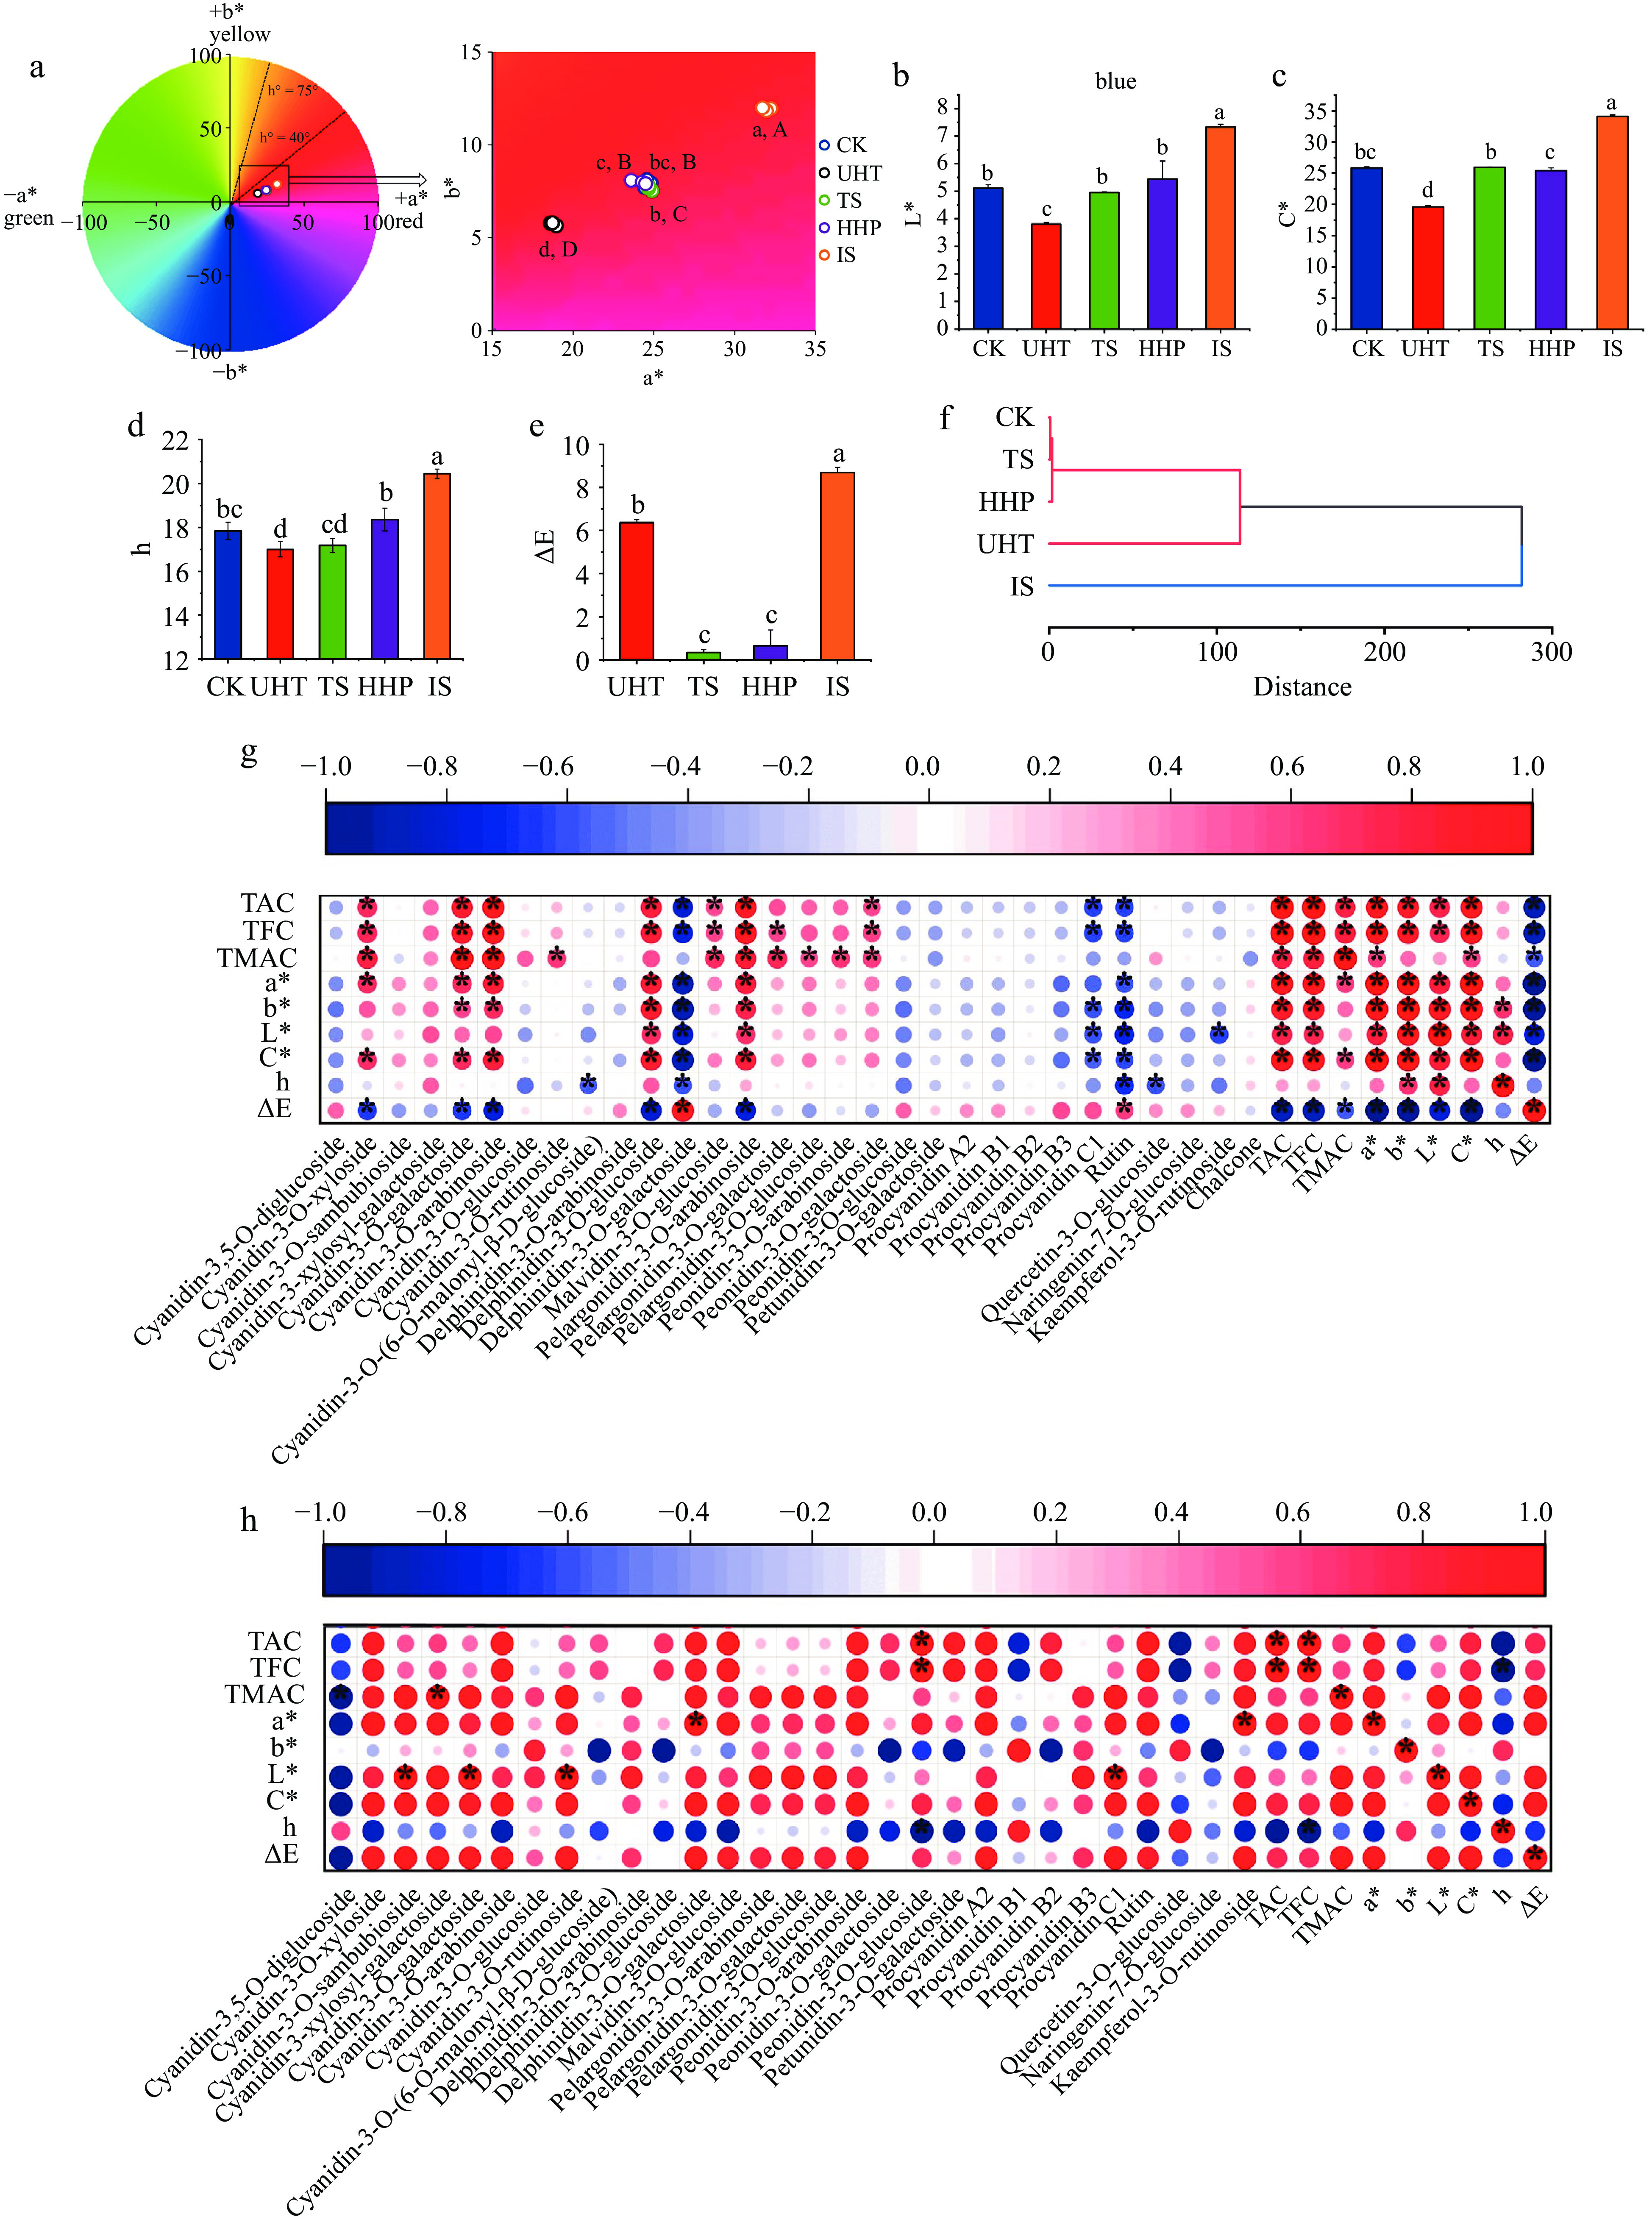
Figure 6.
The color analysis of AMJ under different sterilization methods. (a) Chromaticity distribution map; (b) L*; (c) C*; (d) h; (e) ΔE; (f) HCA analysis; (g) Heatmap of correlation between color indexes, TAC, TFC, TMAC and each detected anthocyanin monomers of CK, UHT, TS and HHP groups; (h) Heatmap of correlation between color indexes, TAC, TFC, TMAC and each detected anthocyanin monomers of IS group. Different lowercase letters express significant differences (p < 0.05); different capital letters in (a) express significant differences of b* (p < 0.05); '*' expresses significant correlation (p < 0.05).
Figures
(6)
Tables
(0)