-
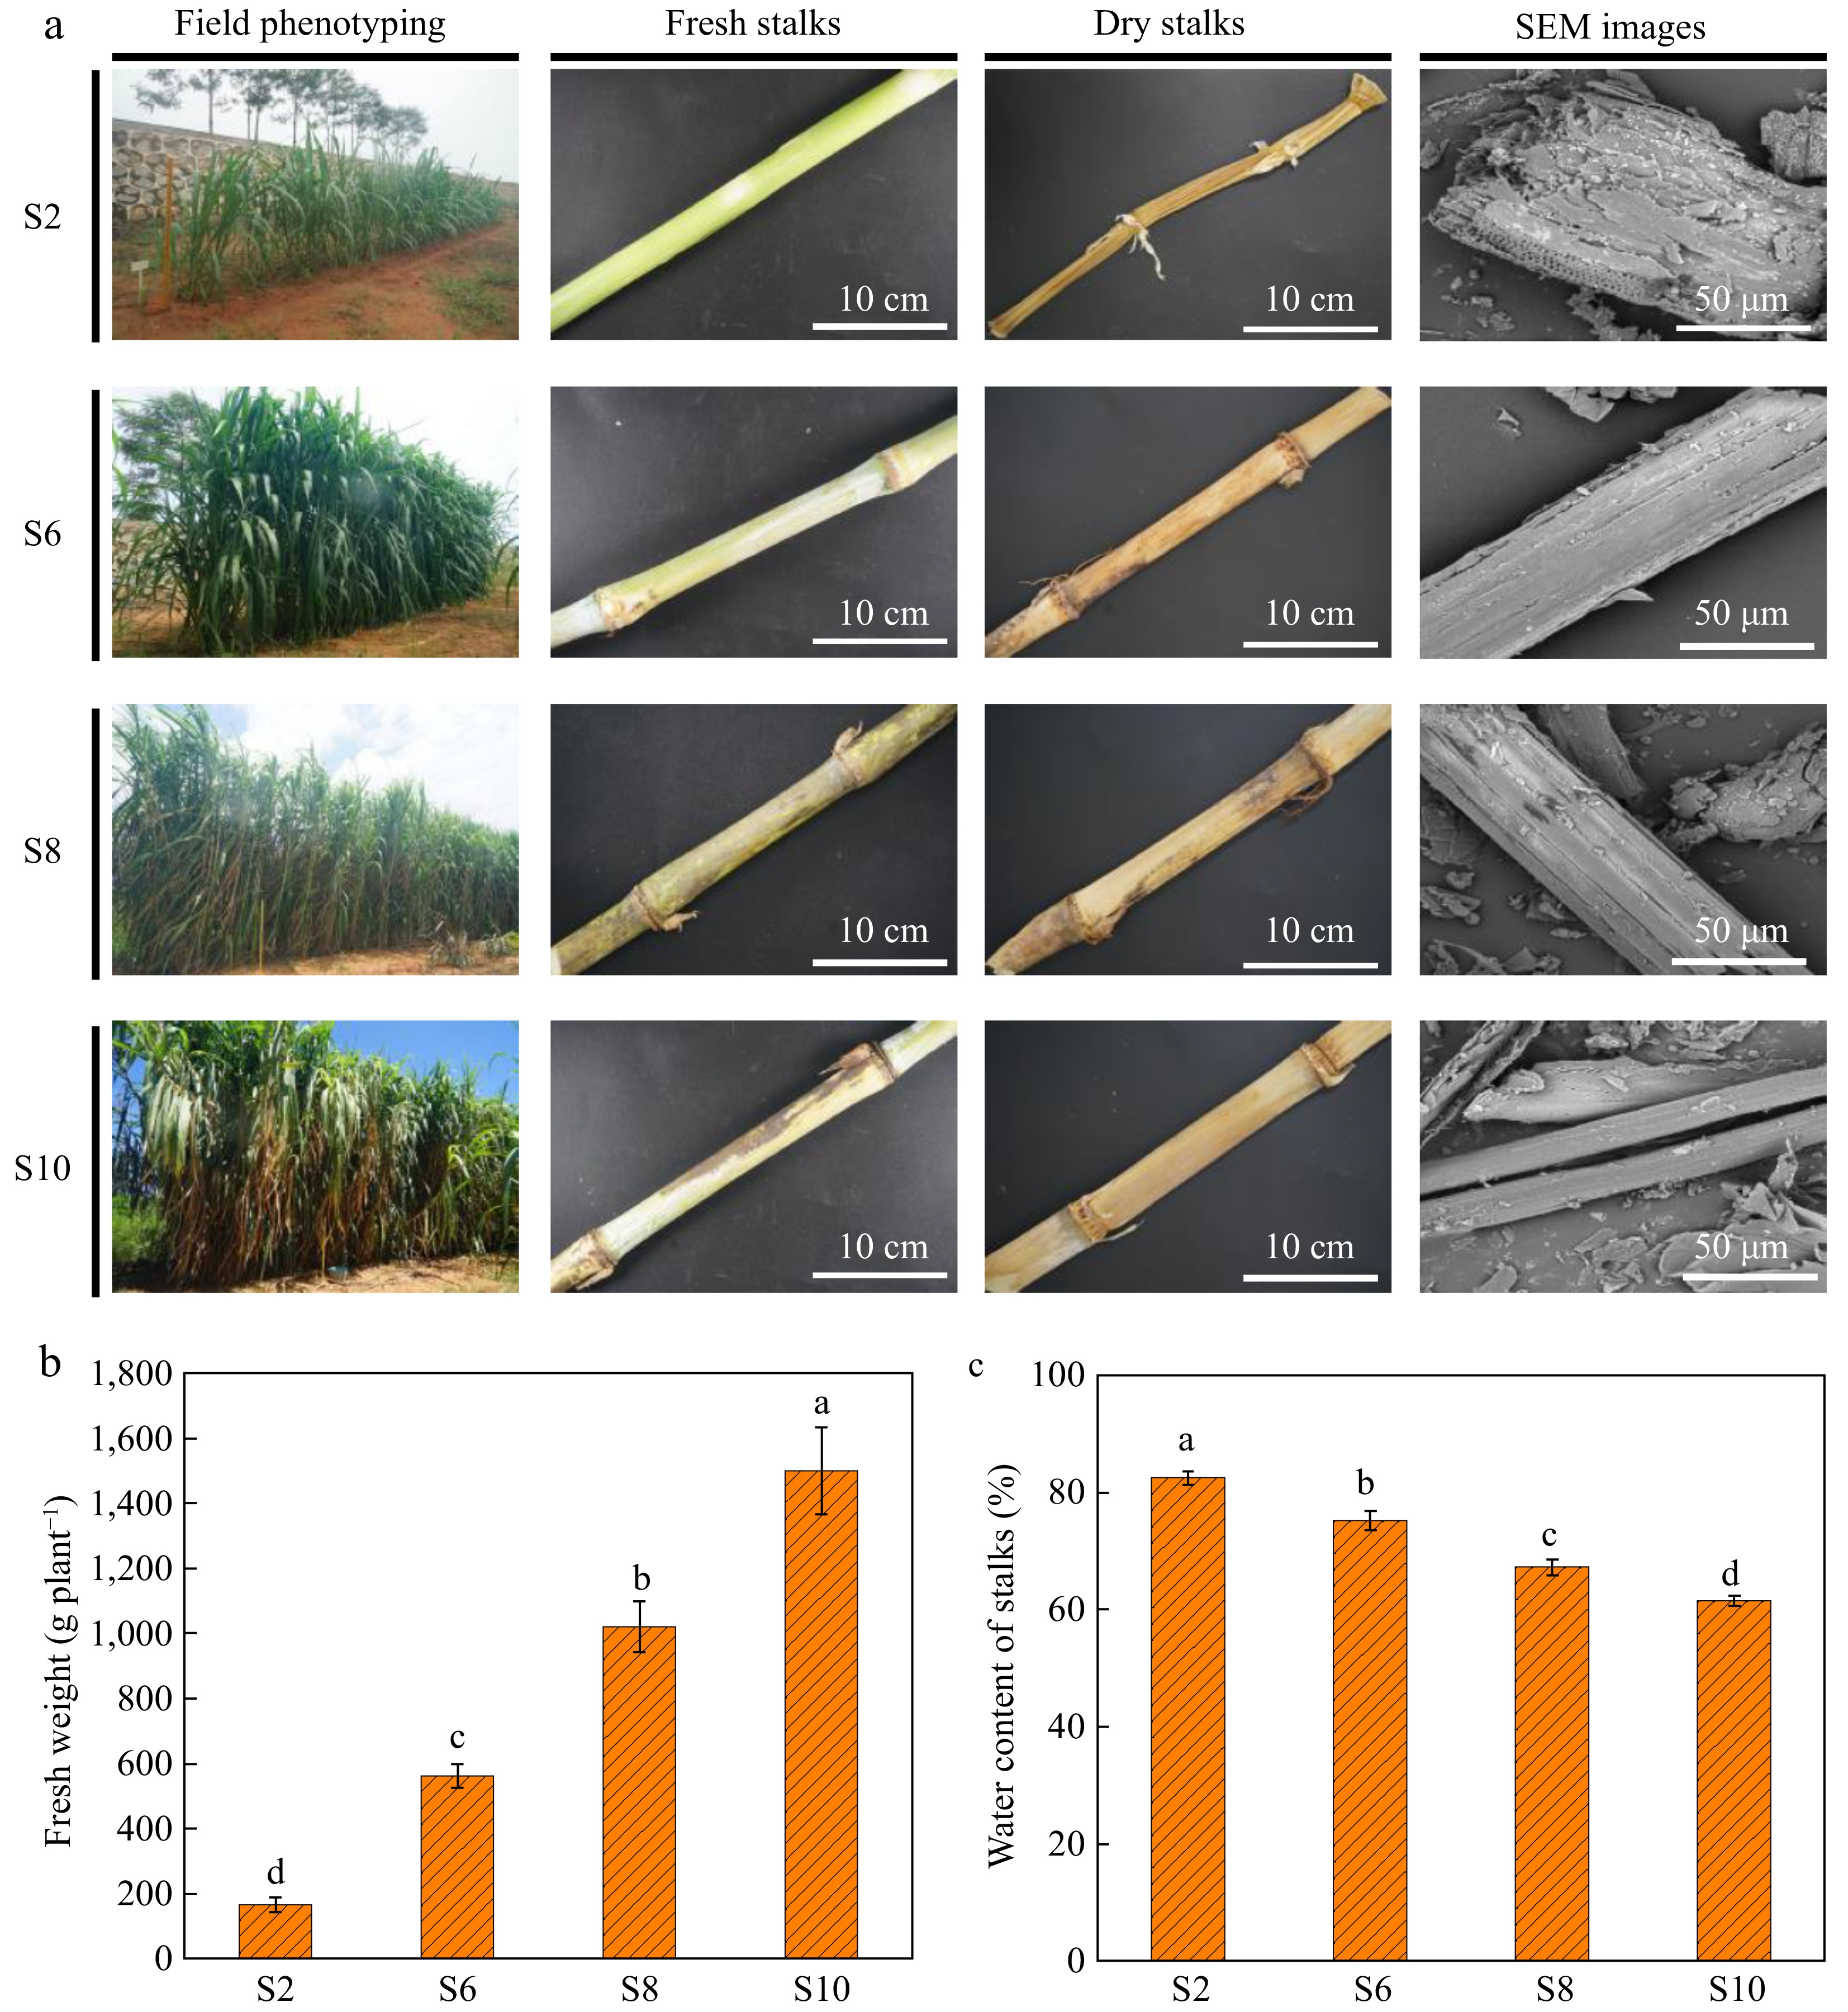
Figure 1.
(a) Field phenotype and stalk morphology of elephant grass. S2, S6, S8, and S10 represent the growth stages of elephant grass in the 2nd, 6th, 8th and 10th months, respectively. SEM (Scanning Electron Microscope) images depict samples of elephant grass stalks at various growth stages. (b) Fresh weight of elephant grass at different growth stages. (c) Water content of elephant grass stalks at different growth stages. Data are means ± SE of three biological replicates. Different letters indicate significant differences (p < 0.05).
-
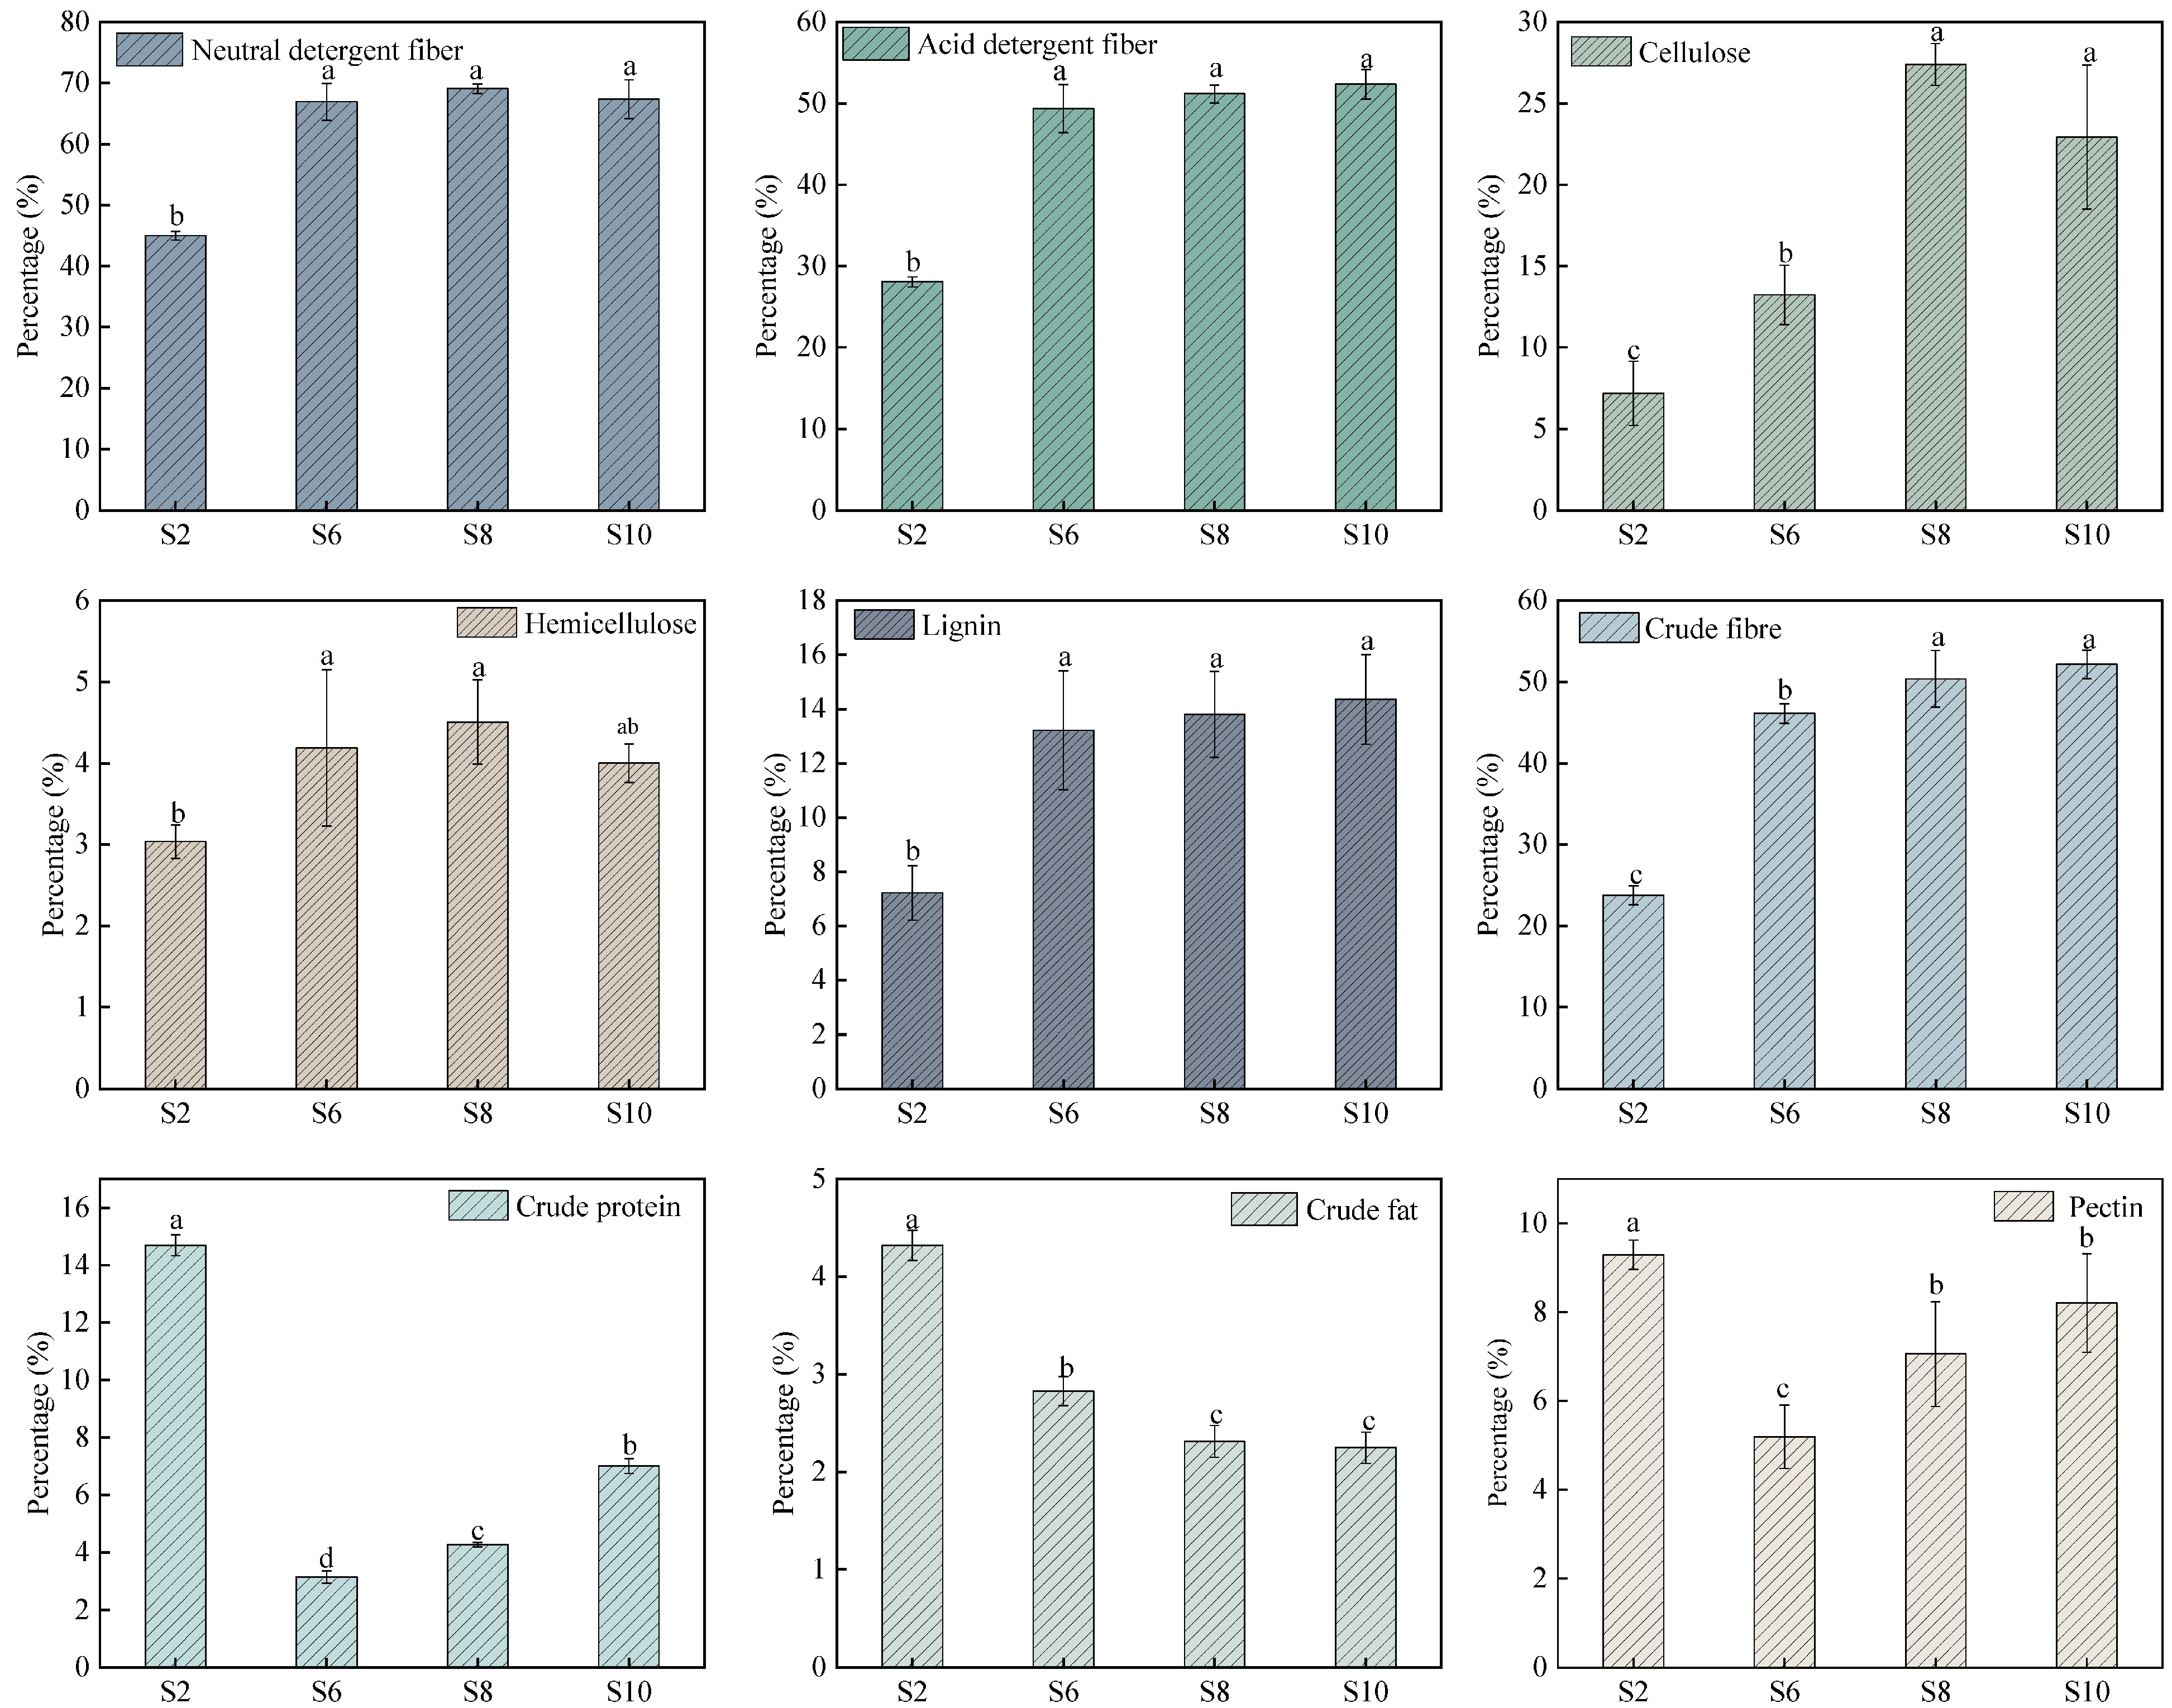
Figure 2.
Changes in the chemical composition content of elephant grass stalks at different growth stages. S2, S6, S8, and S10 represent the growth stages of elephant grass in the 2nd, 6th, 8th and 10th months, respectively. Data are means ± SE of three biological replicates. Different letters indicate significant differences (p < 0.05).
-
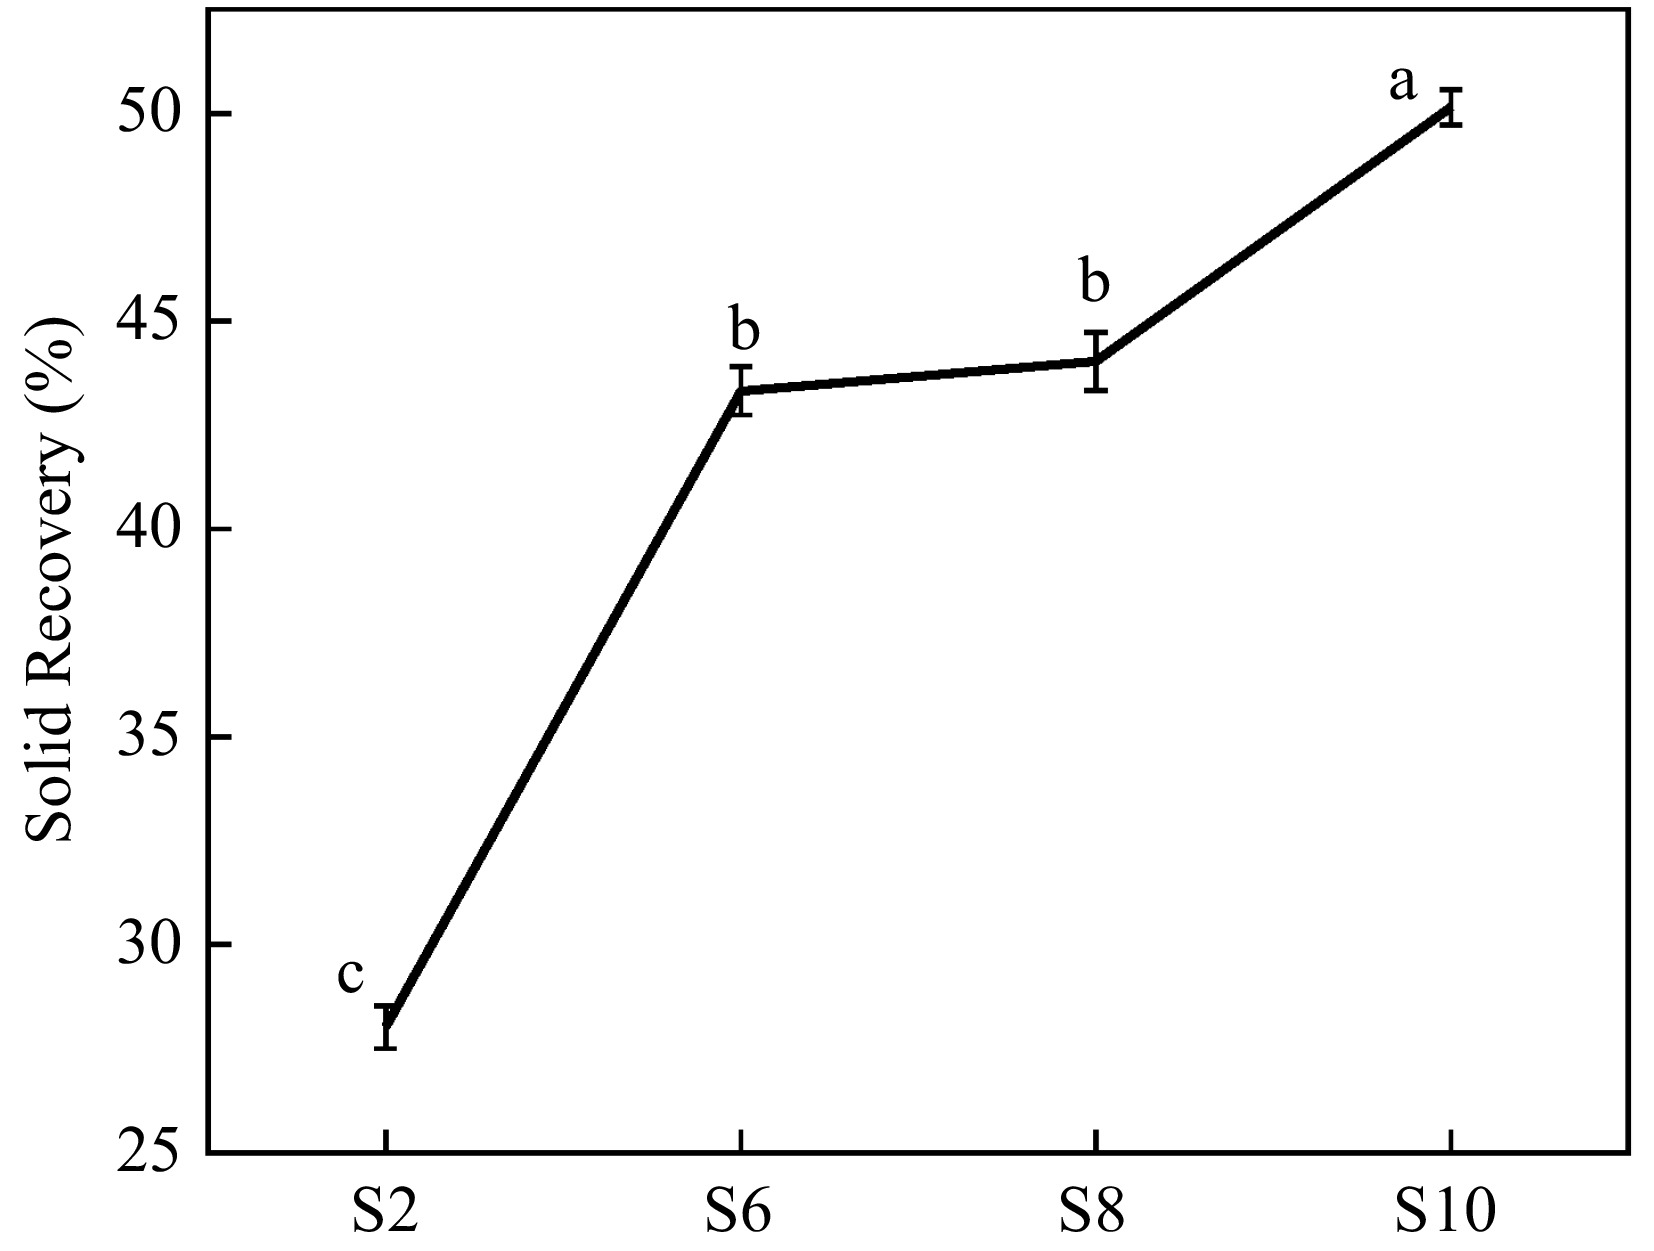
Figure 3.
The solid recovery of crude cellulose. S2, S6, S8, and S10 represent the growth stages of elephant grass in the 2nd, 6th, 8th and 10th months, respectively. Data are means ± SE of three biological replicates. Different letters indicate significant differences (p < 0.05).
-

Figure 4.
Scanning Electron Microscope (SEM) image of the isolated crude cellulose from elephant grass stalks. S2, S6, S8, and S10 represent the growth stages of elephant grass in the 2nd, 6th, 8th and 10th months, respectively.
-
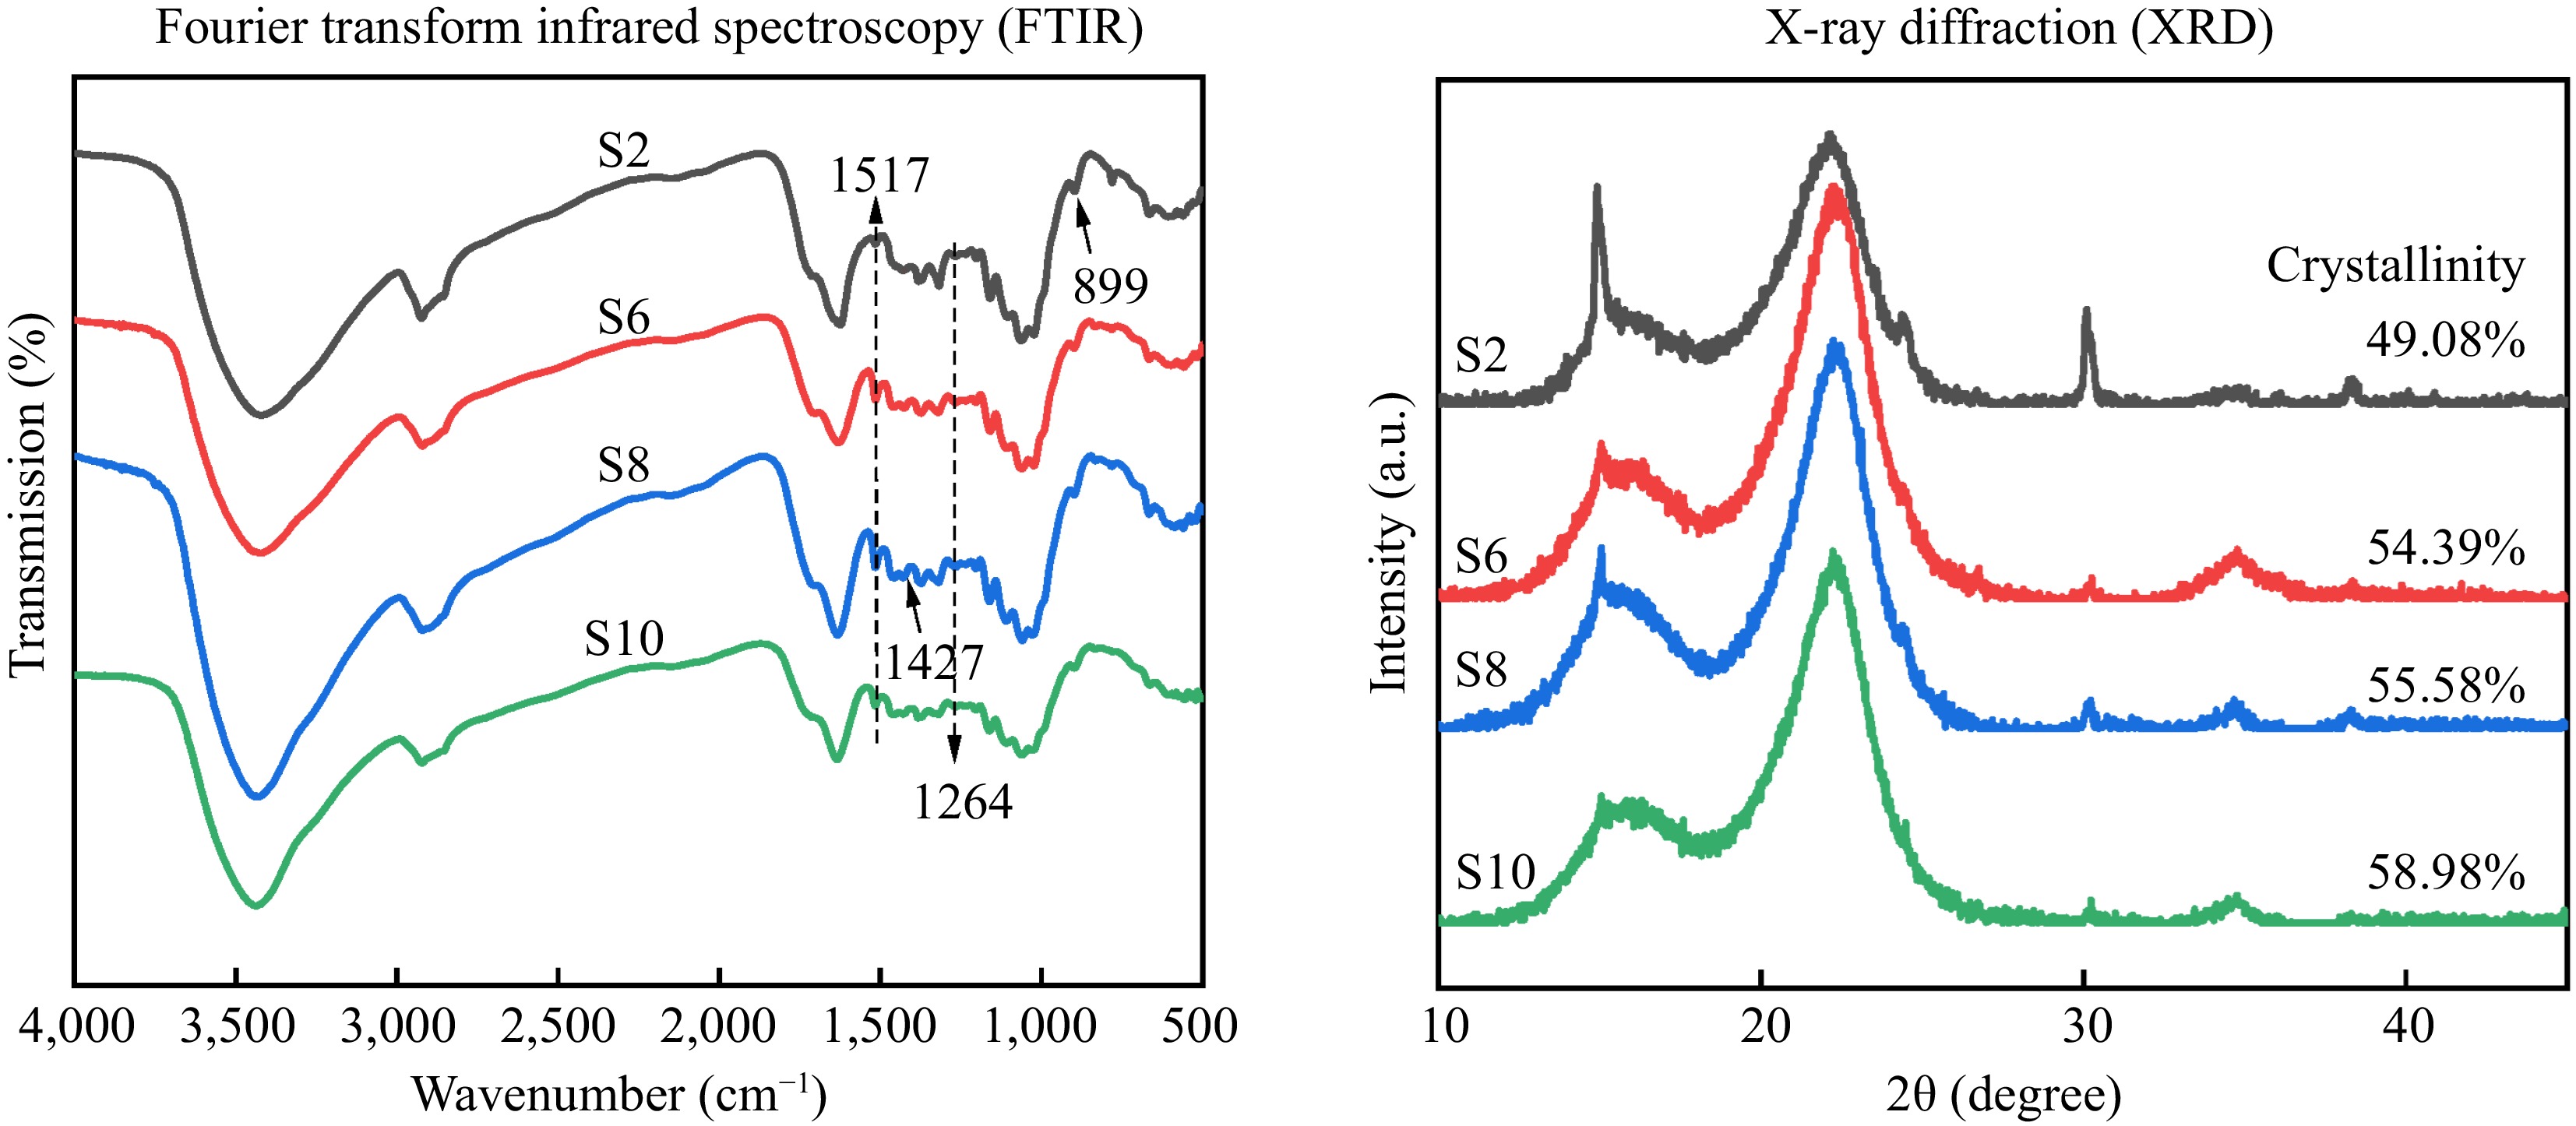
Figure 5.
Chemical structure of crude cellulose. S2, S6, S8, and S10 represent the growth stages of elephant grass in the 2nd, 6th, 8th and 10th months, respectively.
-
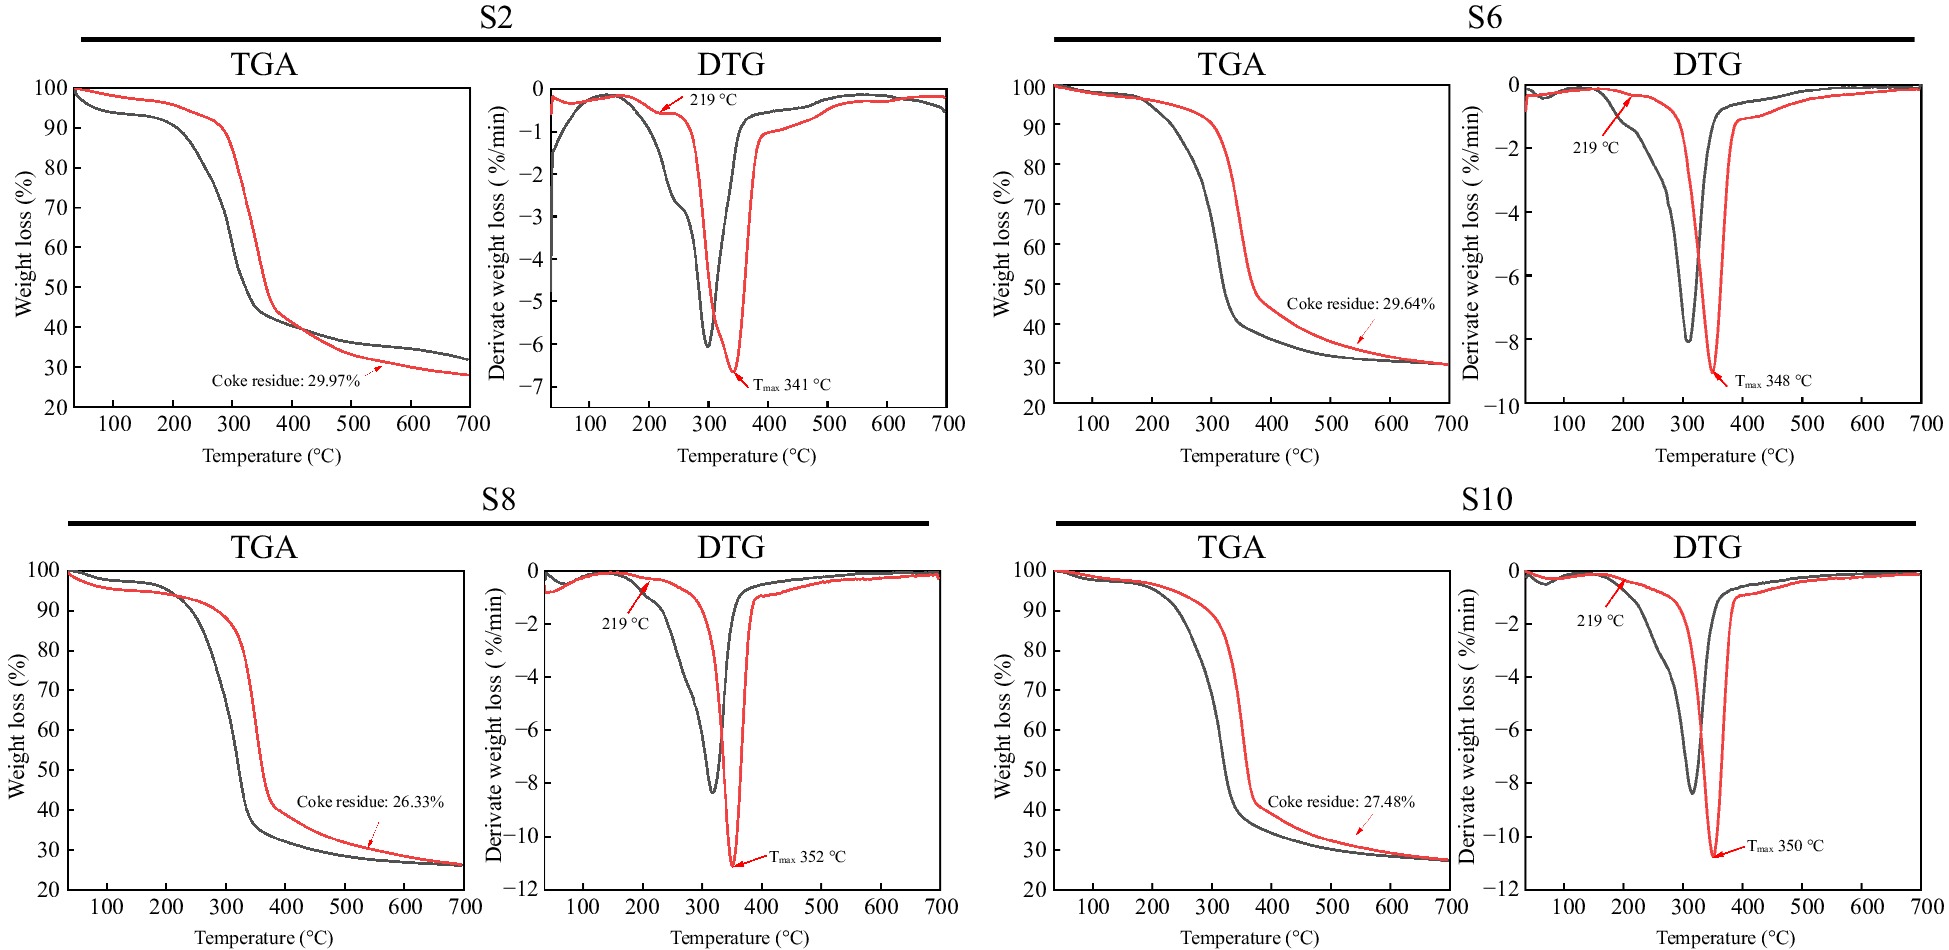
Figure 6.
Thermal gravimetric analysis (TGA) and derivative thermogravimetric analysis (DTG) of elephant grass stalks and crude cellulose isolated from them. The black curve represents elephant grass stalks, while the red curve represents isolated crude cellulose from the stalks. S2, S6, S8, and S10 represent the growth stages of elephant grass in the 2nd, 6th, 8th, and 10th months, respectively.
Figures
(6)
Tables
(0)