-
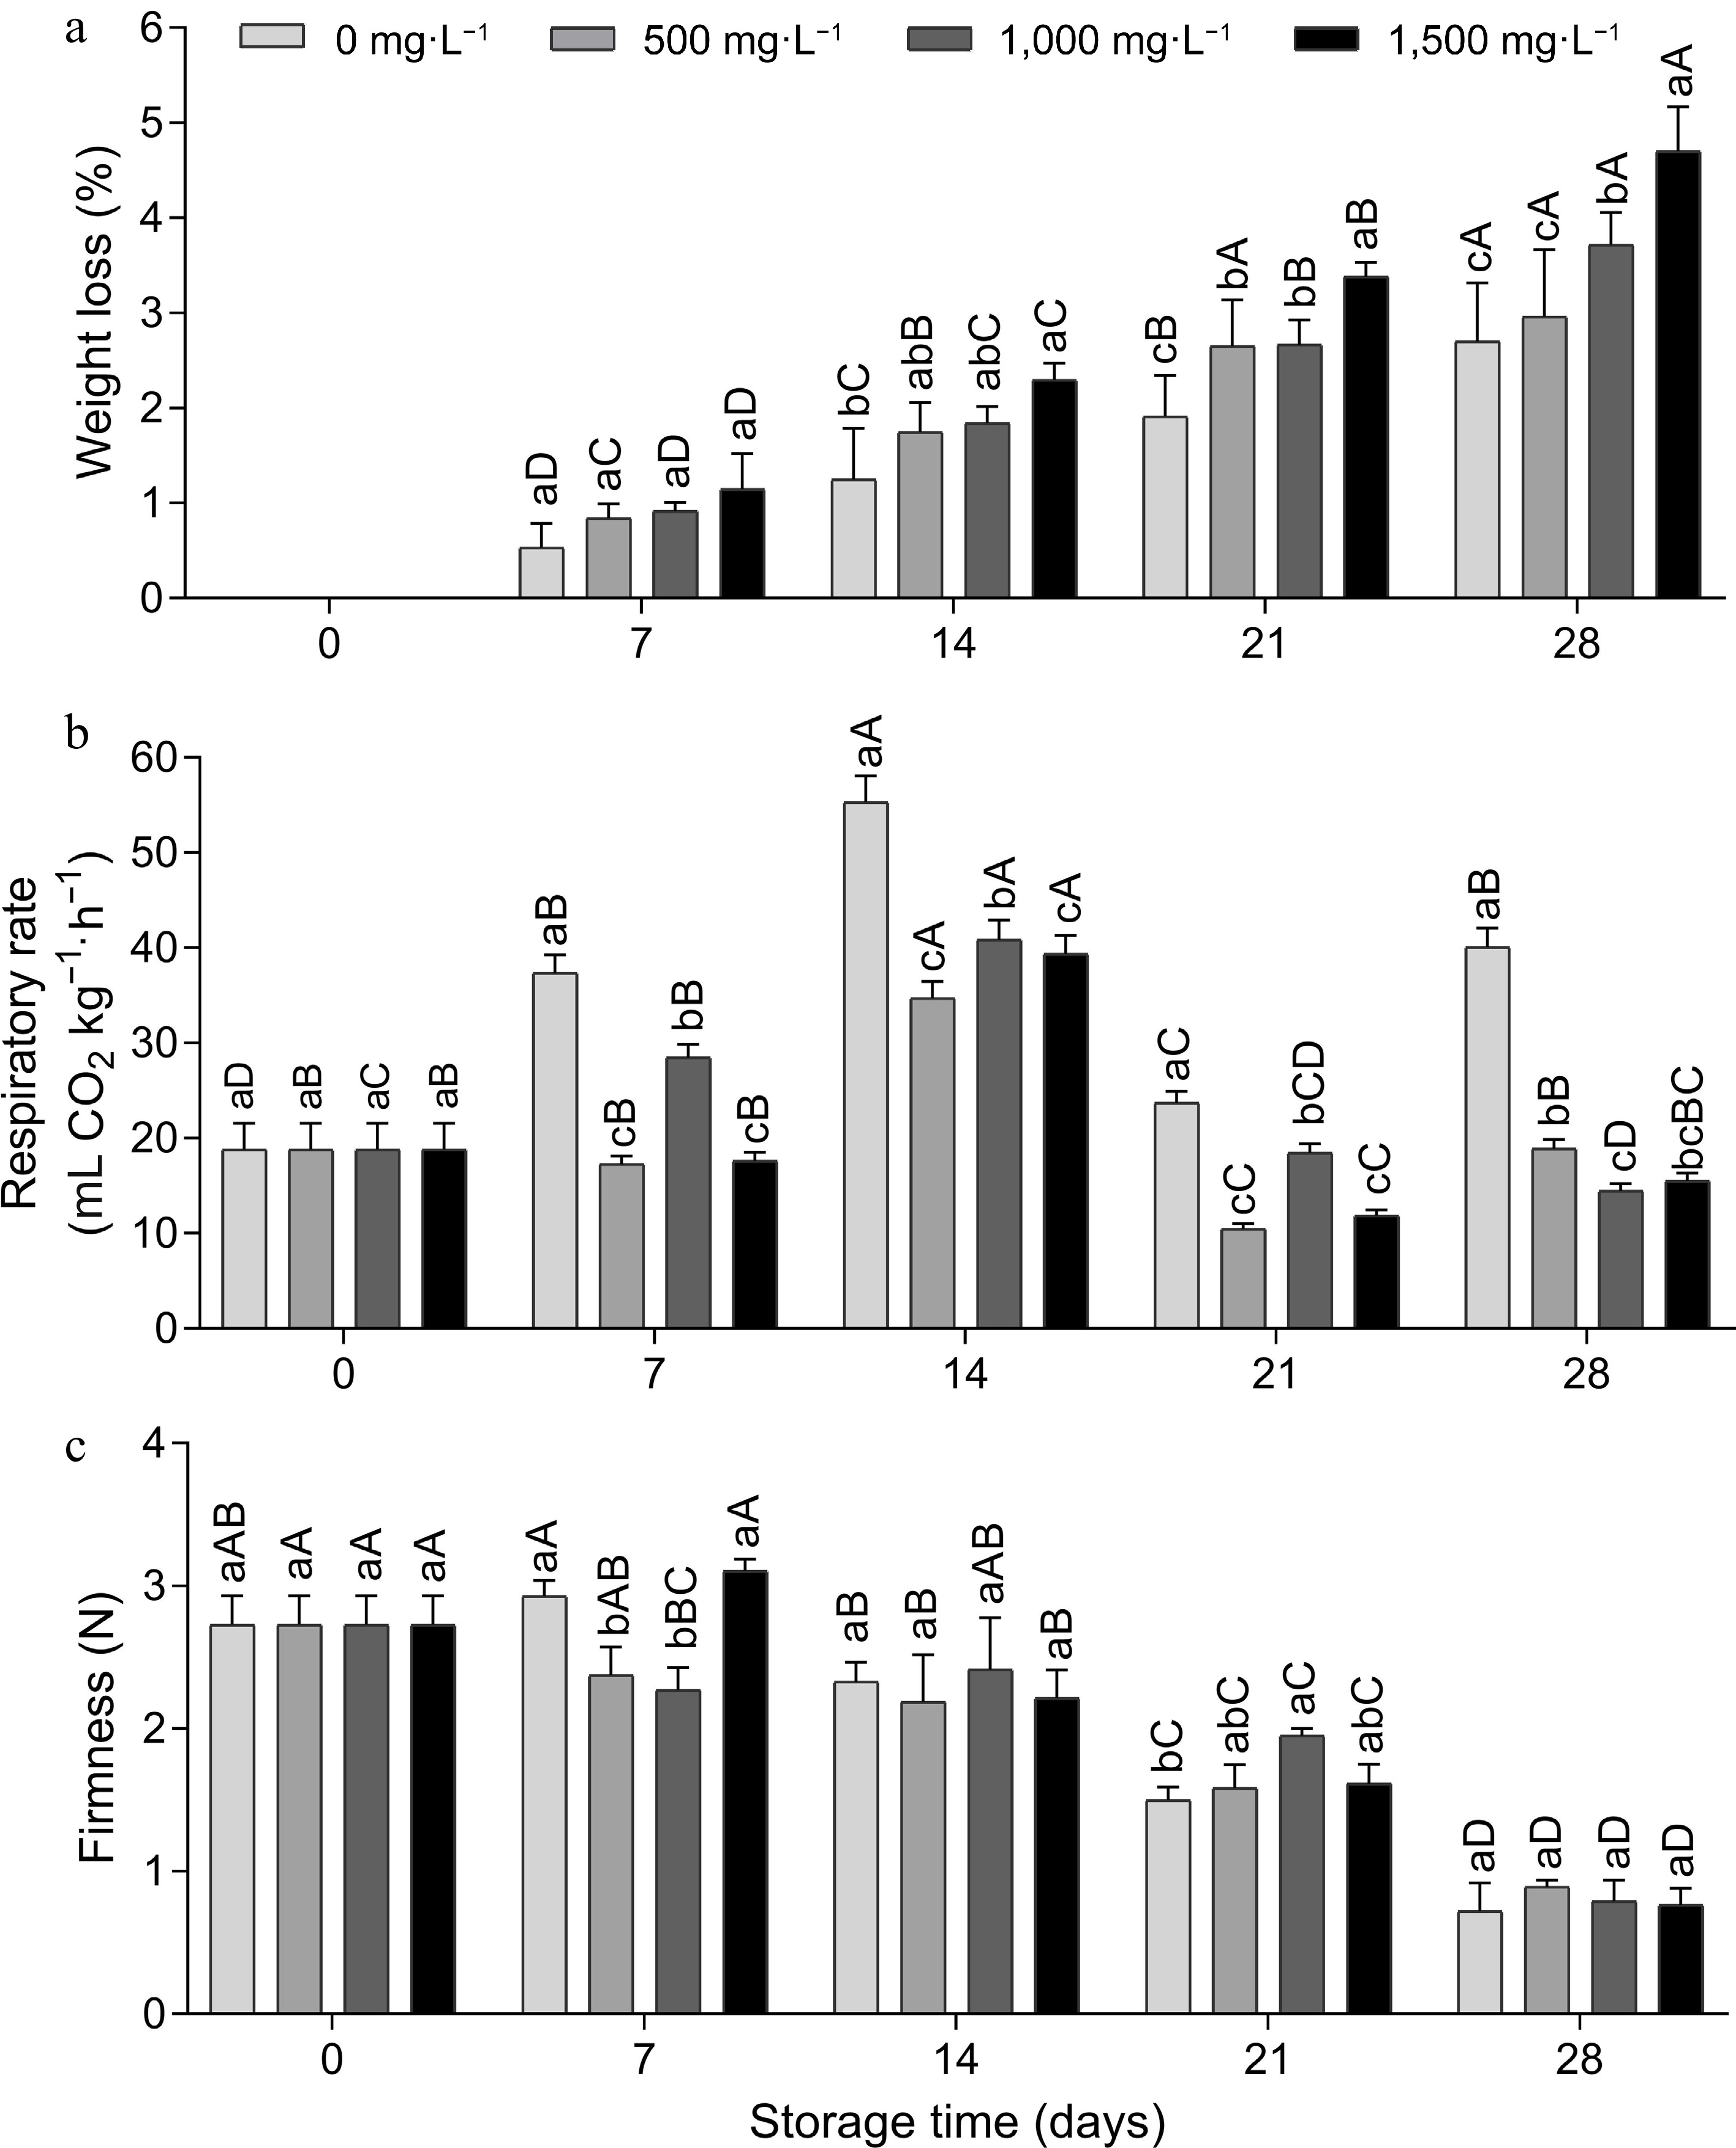
Figure 1.
(a) Weight loss, (b) respiration rate and (c) firmness of tomato fruit treated with doses of aminoethoxyvinylglycine (AVG) and stored (15 ± 1 °C and RH 90% ± 5 %) for 28 d. Lowercase letters differ the doses in a single storage time and capital letters differ the storage times in a single dose, according to the Tukey test (p < 0.05).
-
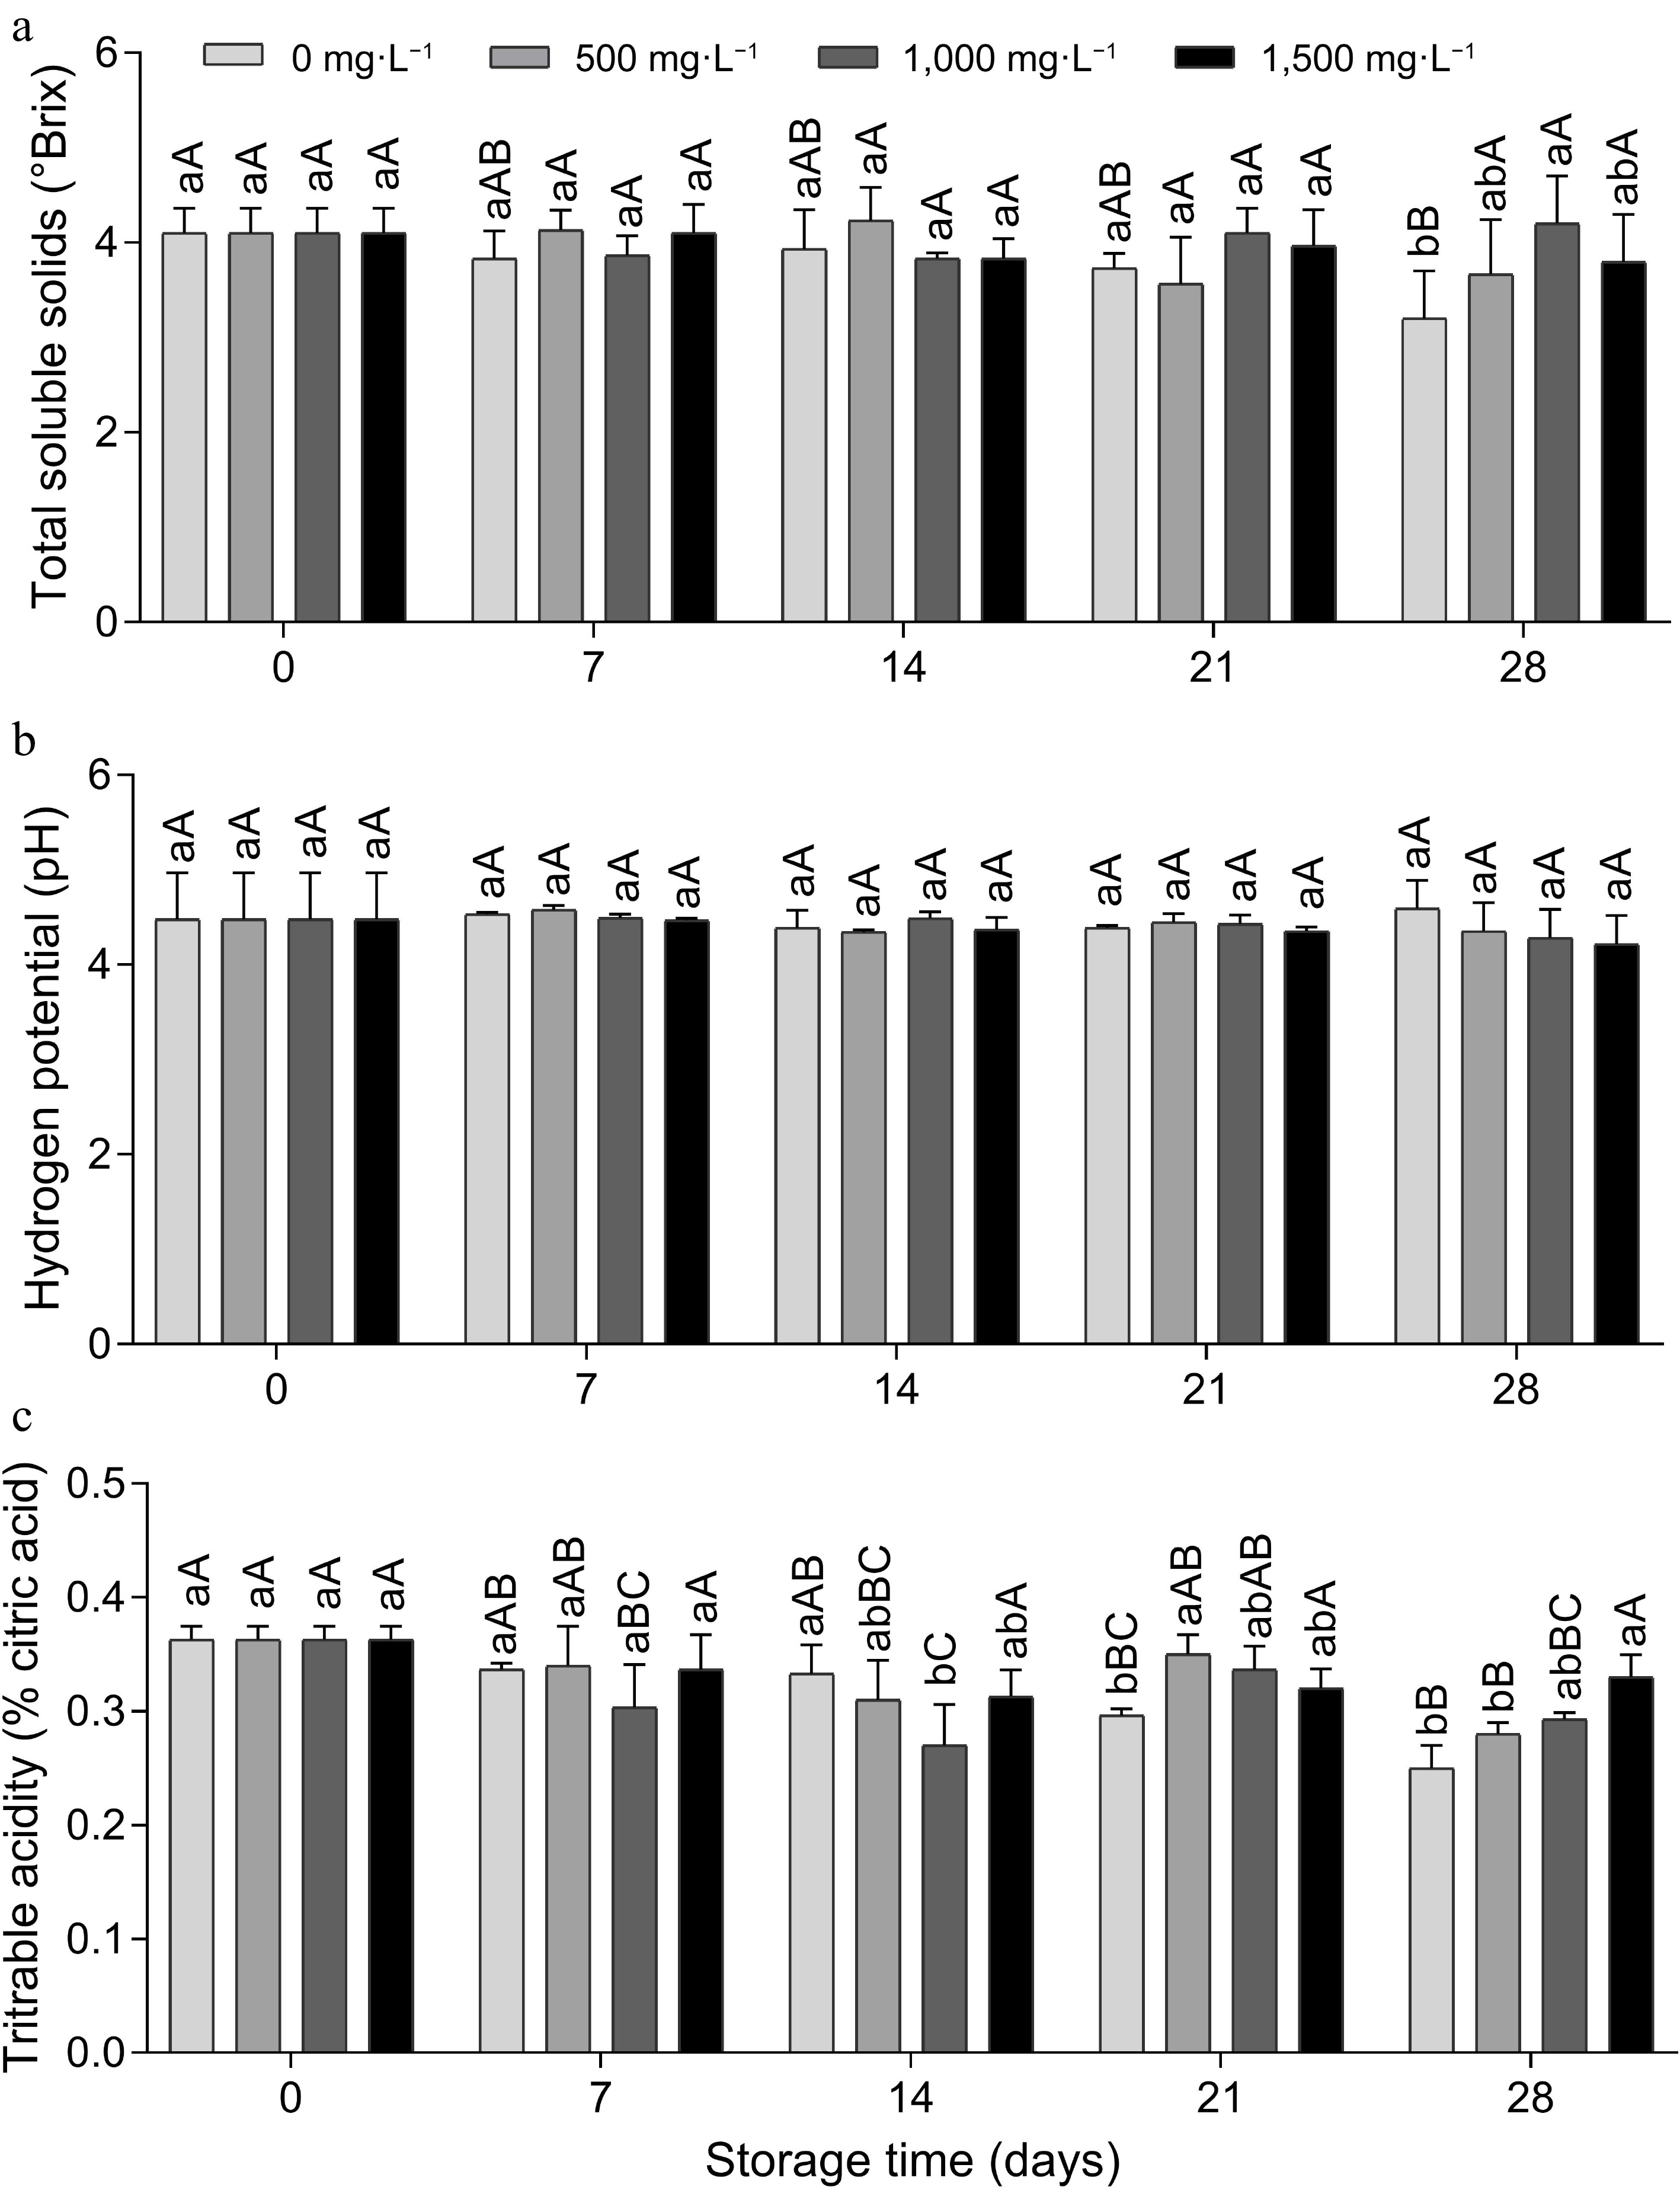
Figure 2.
(a) Total soluble solids, (b) pH and (c) titratable acidity of tomato fruit treated with doses of aminoethoxyvinylglycine and stored (15 ± 1 °C and RH 90% ± 5 %) for 28 d. Lowercase letters differ the doses in a single storage time and capital letters differ the storage times in a single dose, according to the Tukey test (p < 0.05).
-
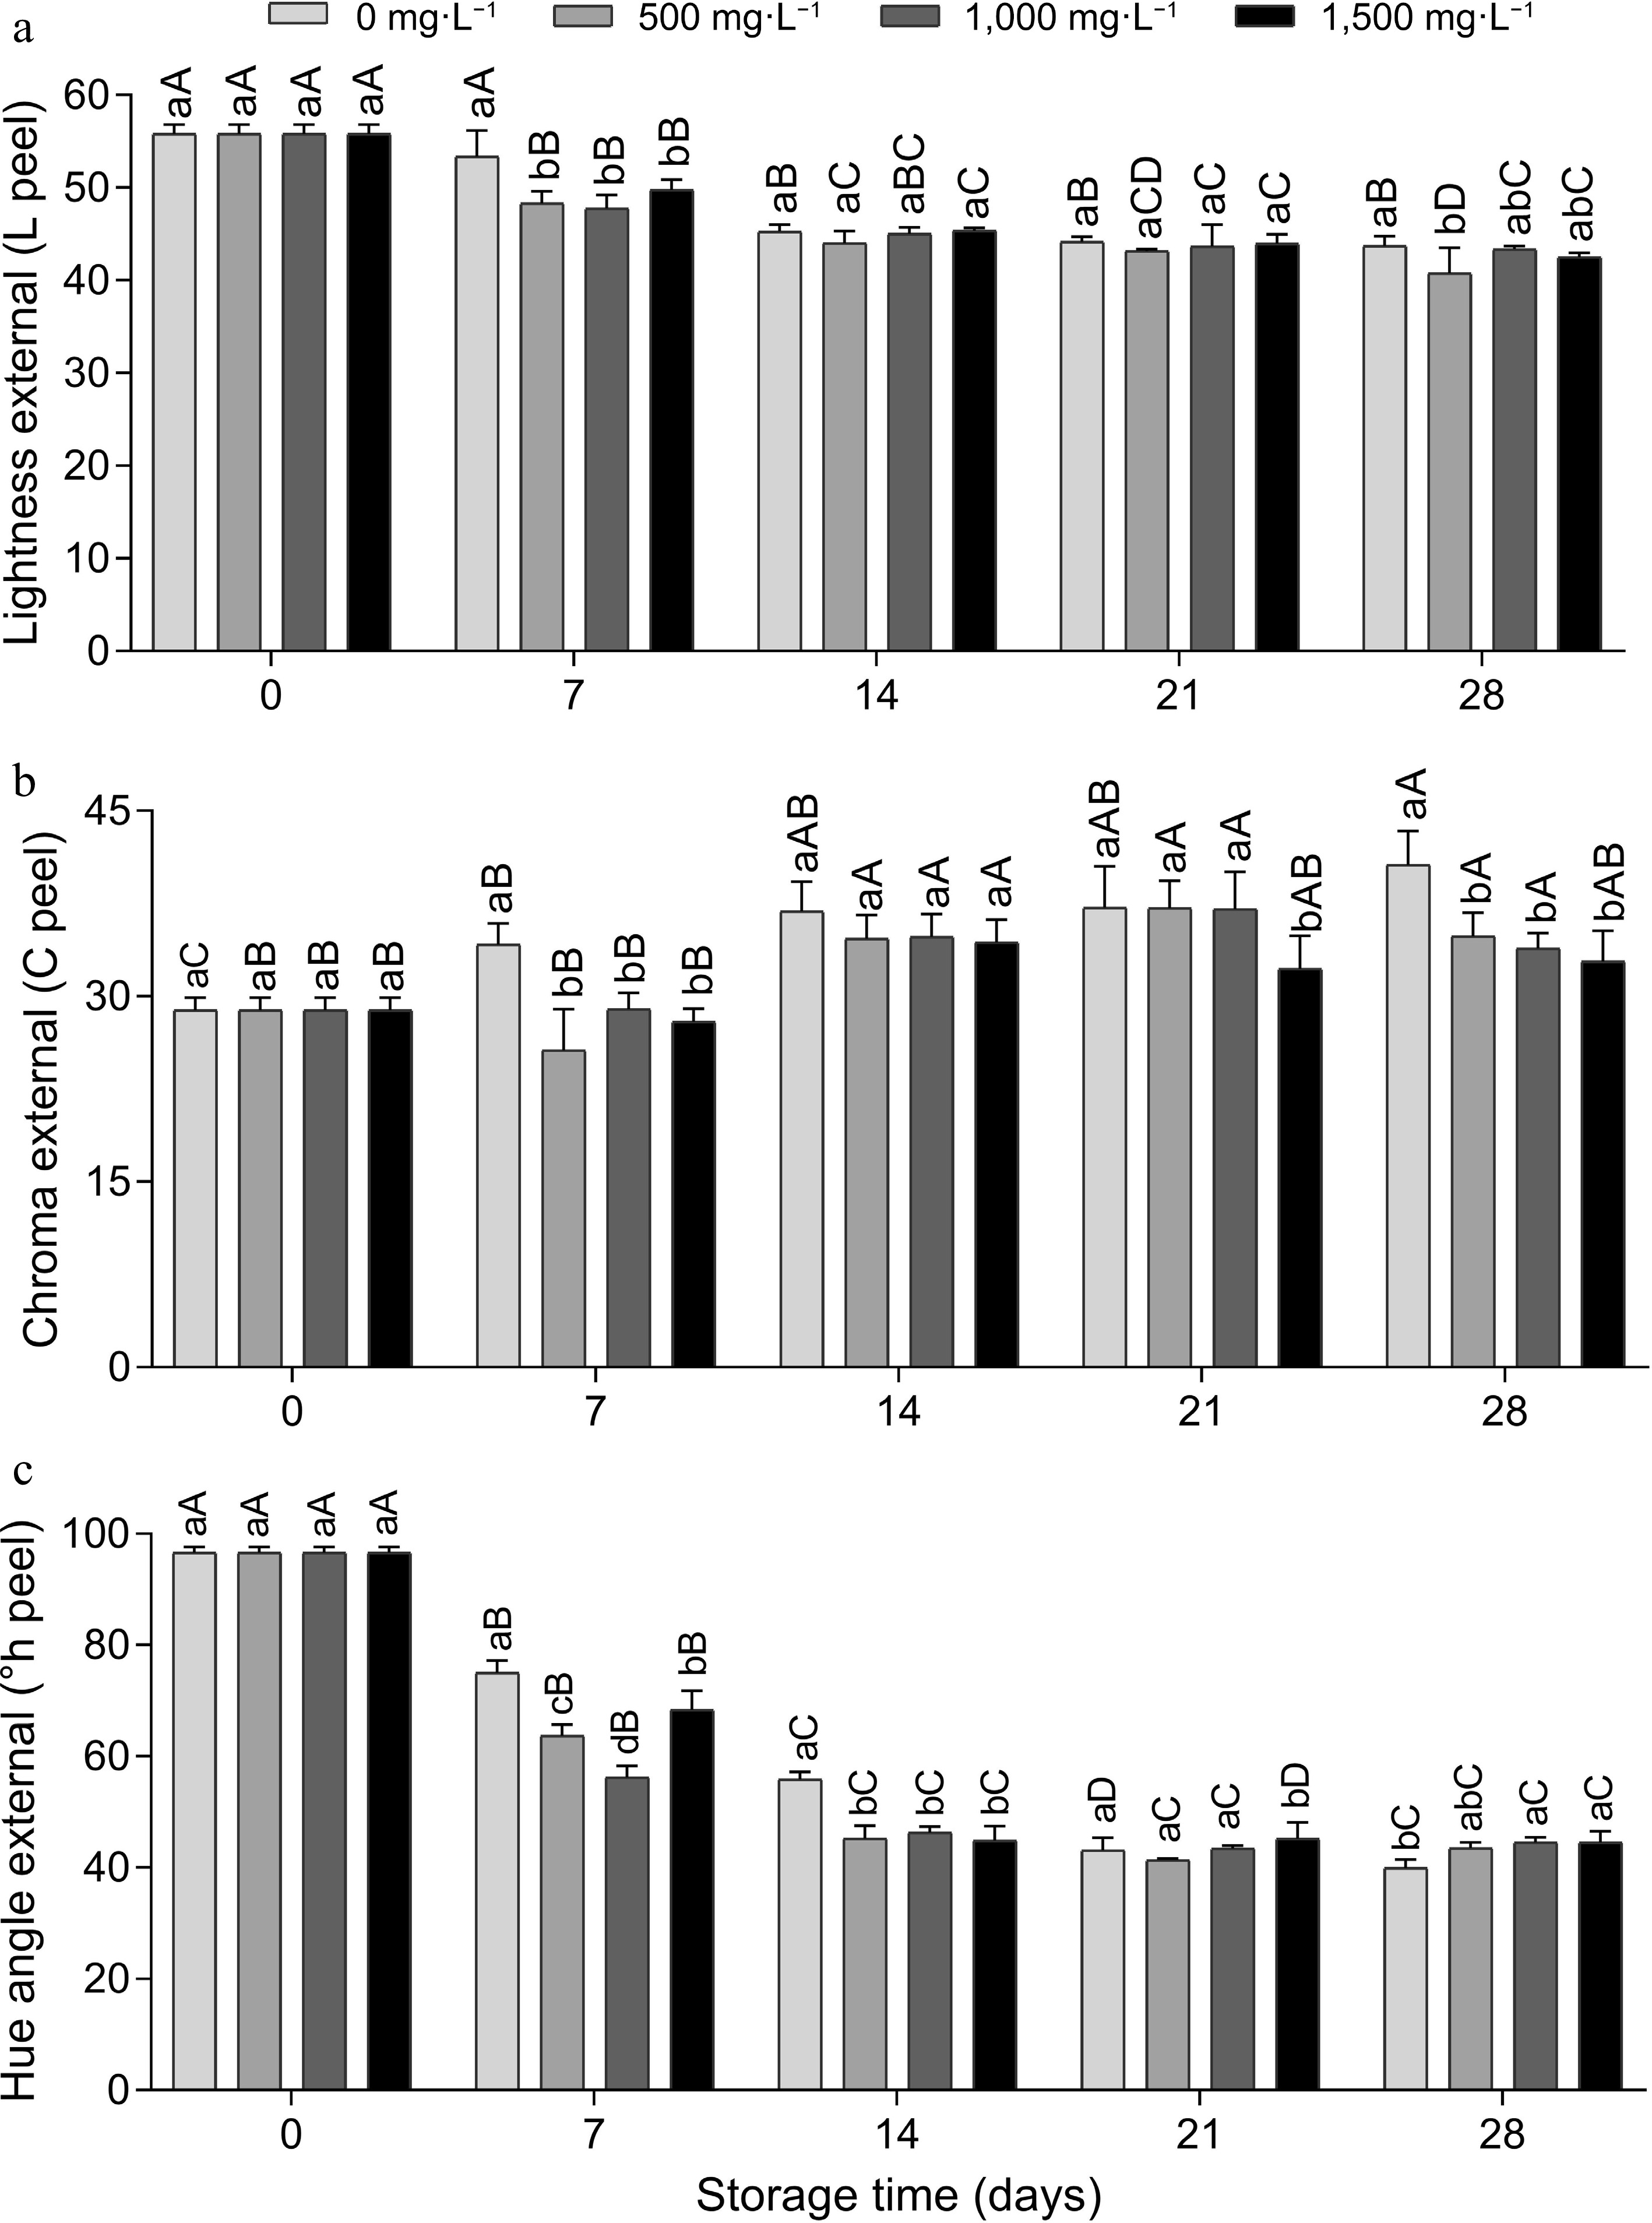
Figure 3.
External instrumental color (peel), (a) luminosity, (b) chroma and (c) hue angle of tomato fruits treated with doses of AVG and stored (15 ± 1 °C and RH 90% ± 5 %) for 28 d. Lowercase letters differ the doses in a single storage time and capital letters differ the storage times in a single dose, according to the Tukey test (p < 0.05).
-
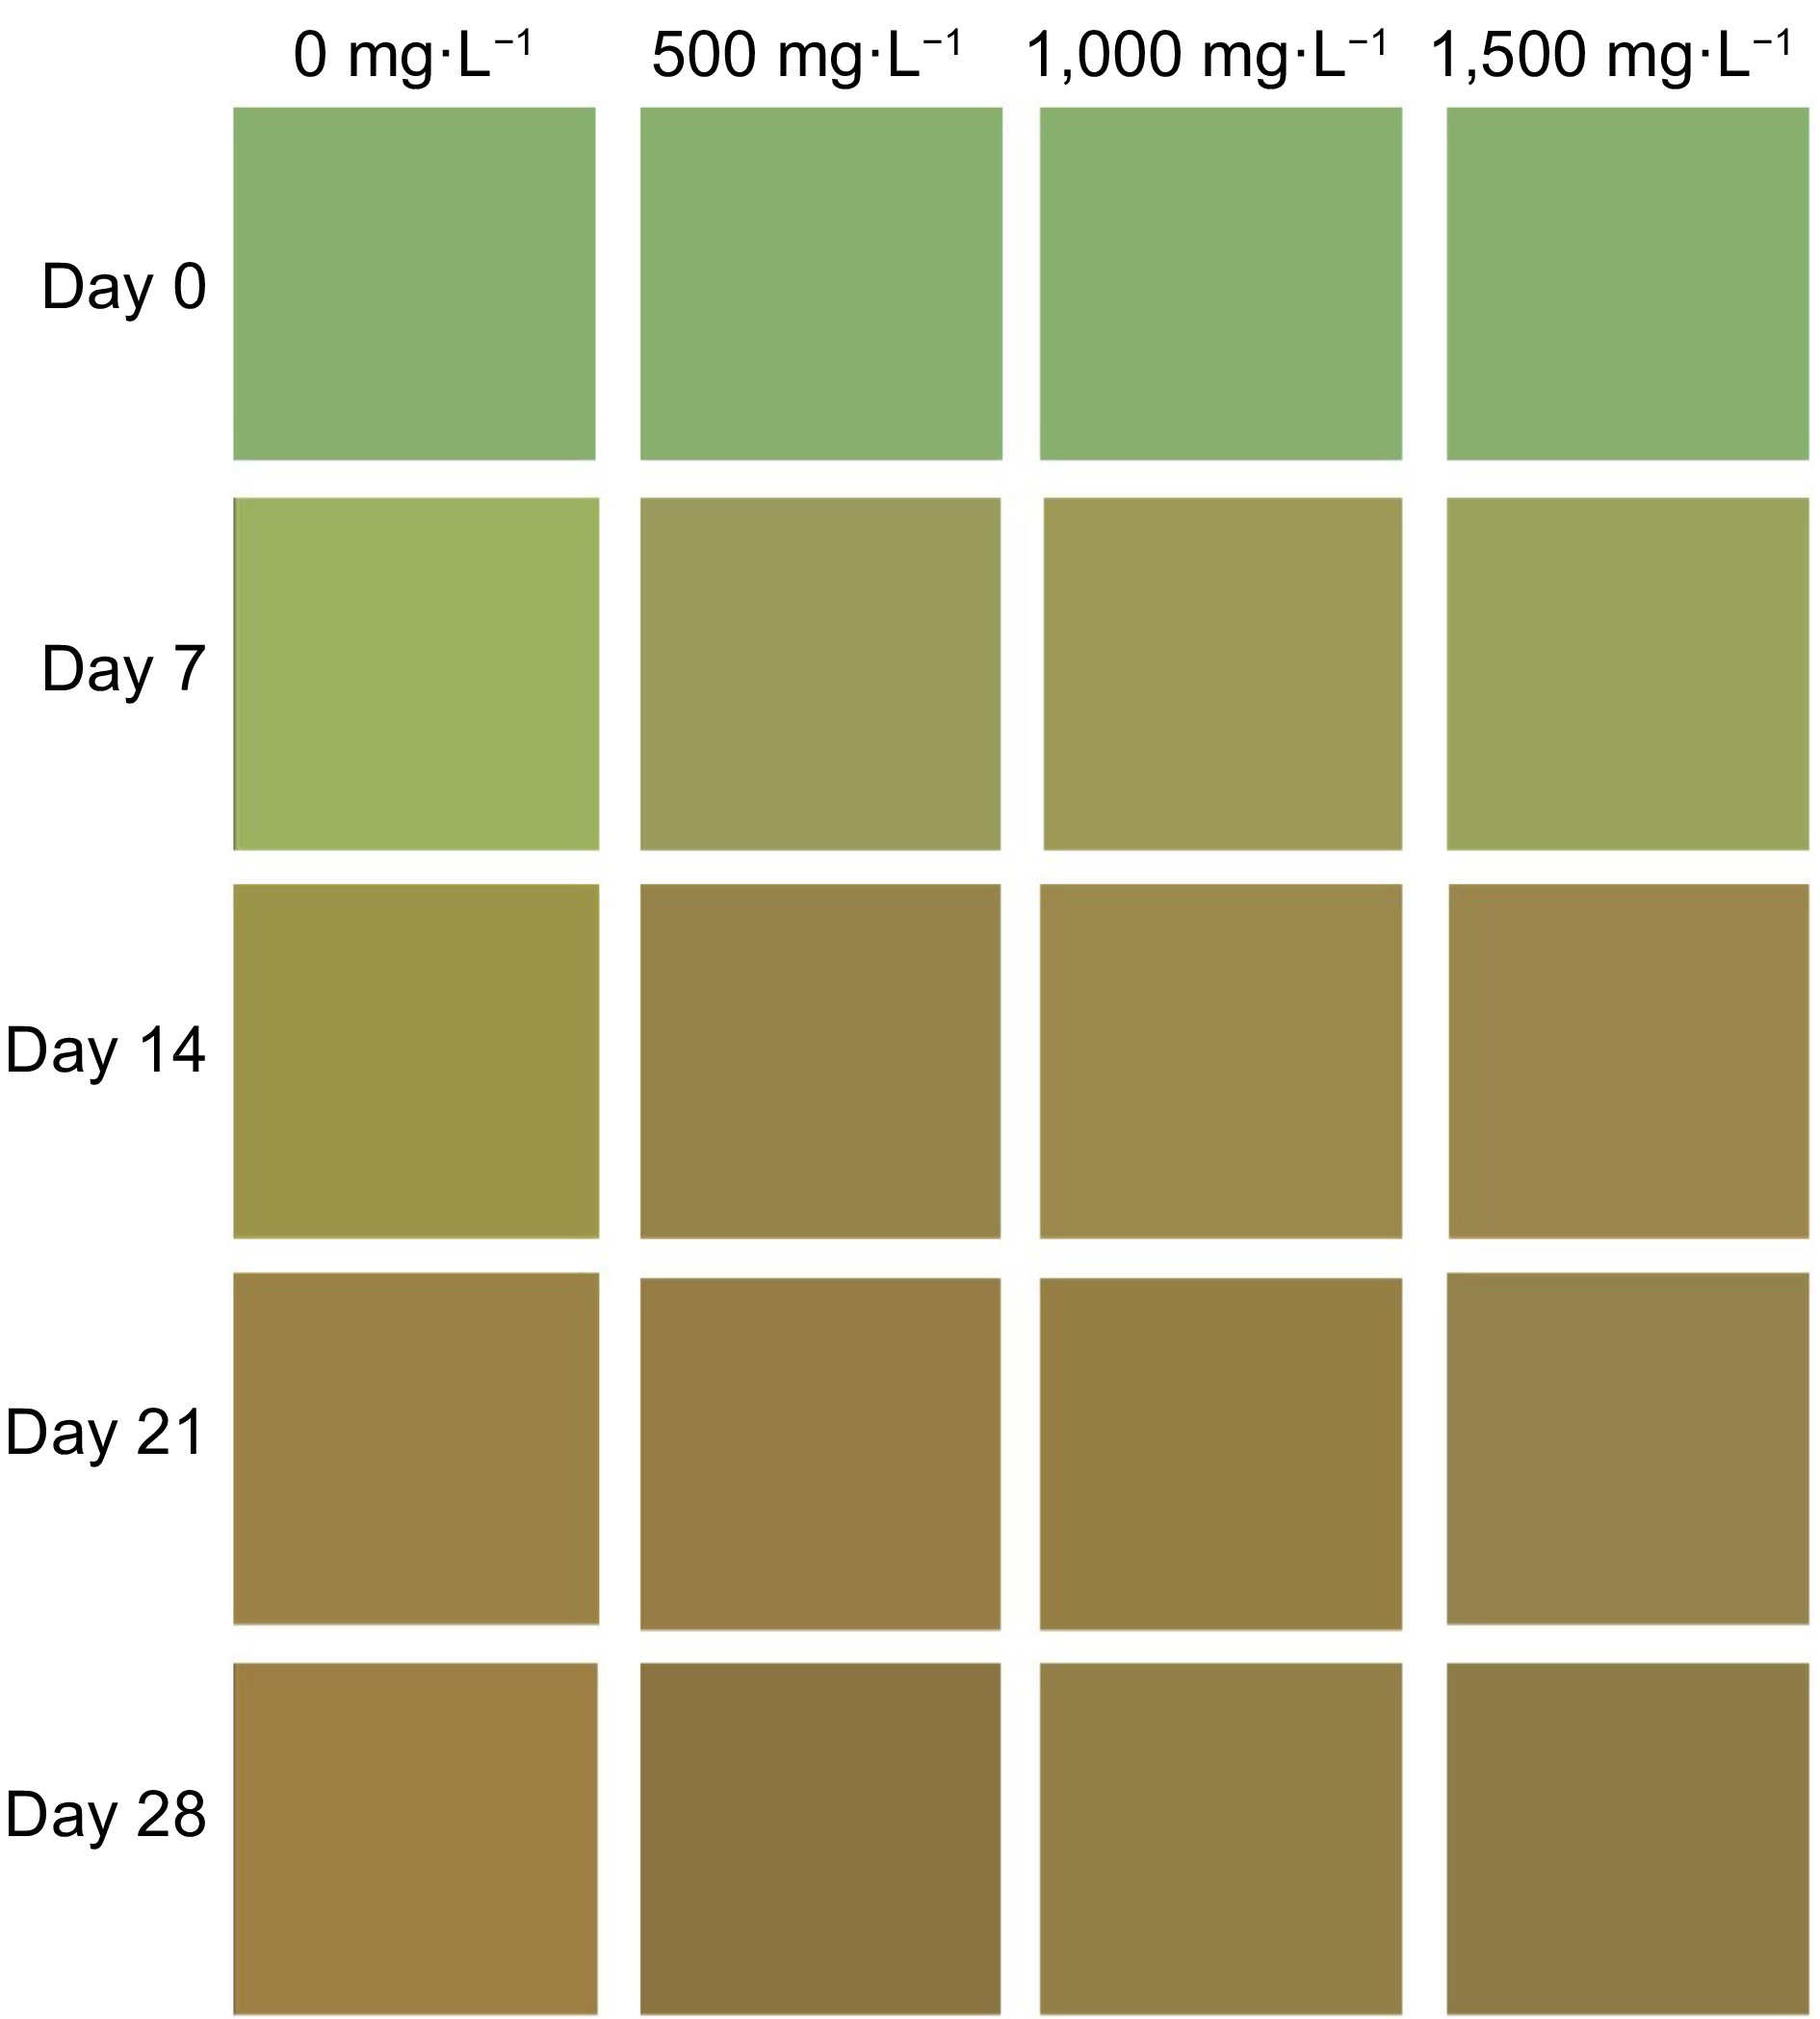
Figure 4.
Approximate reproduction of the color profile of the peel of tomato fruit treated with doses of AVG and stored (15 ± 1 °C and RH 90% ± 5%) for 28 d, determined using a Konica Minolta colorimeter, with Luminosity, Chroma and °Hue values fed into the colorizer.org platform.
-
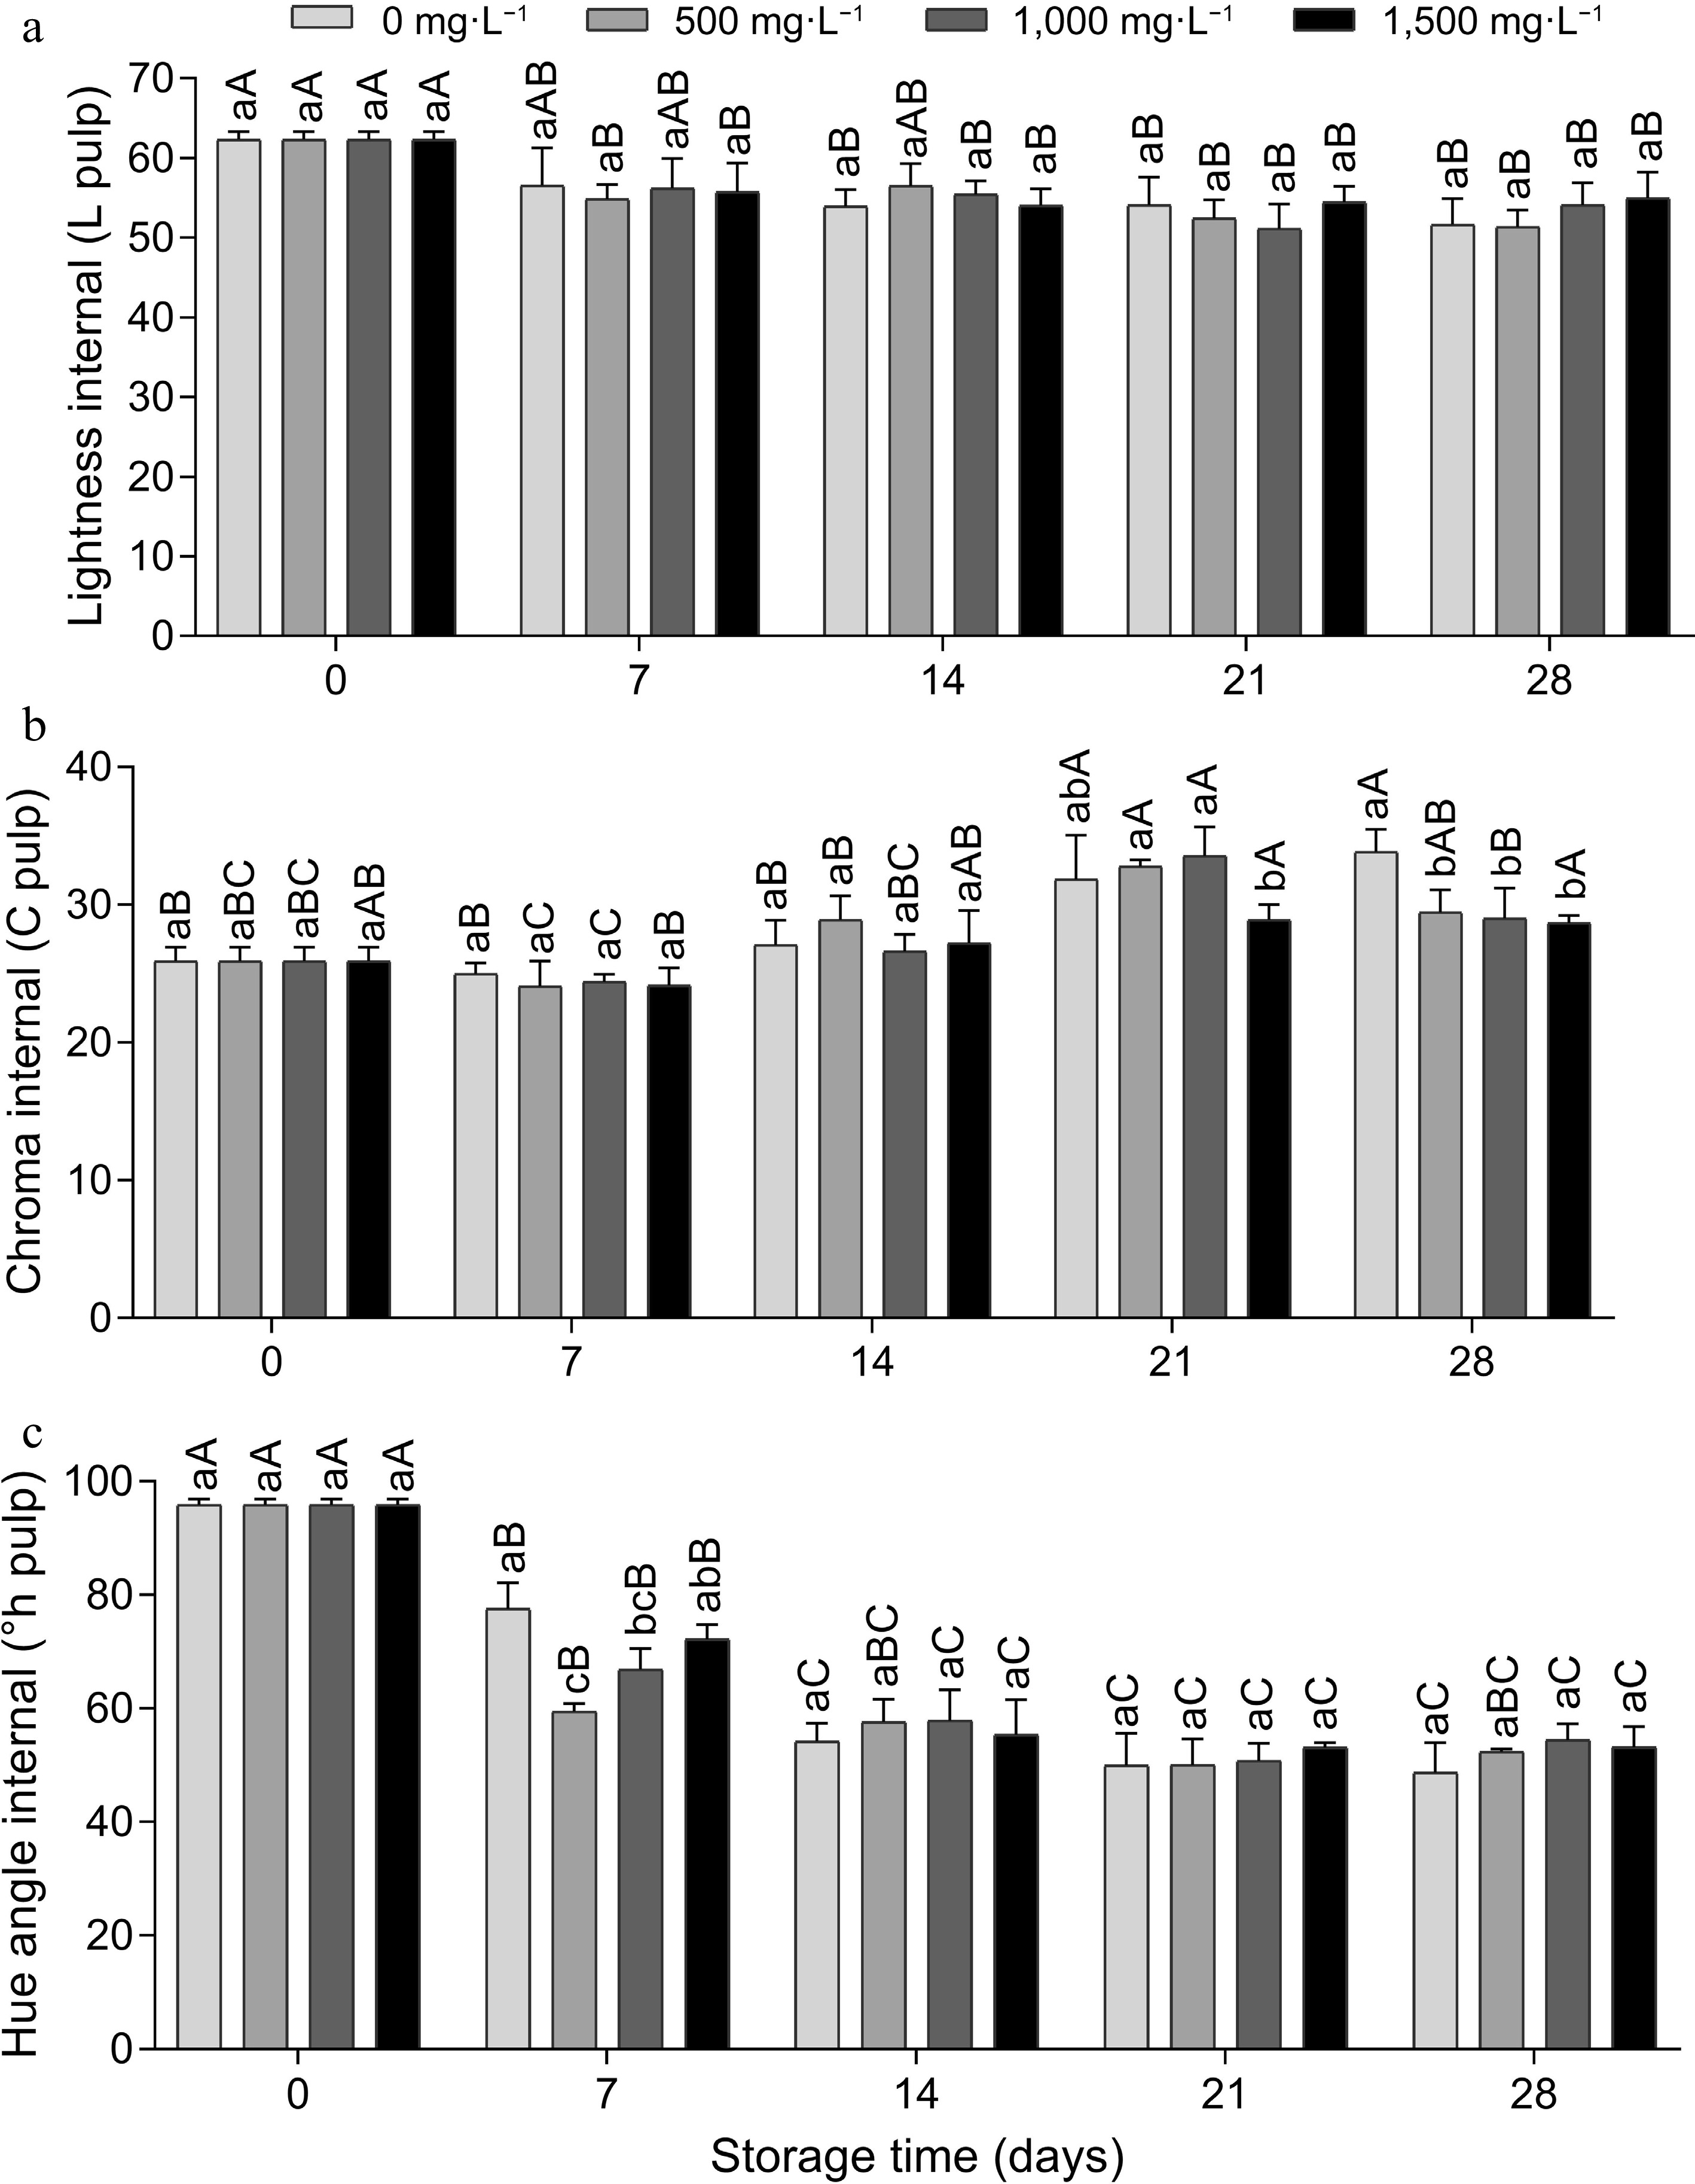
Figure 5.
Internal instrumental color (pulp), (a) luminosity, (b) chroma and (c) hue angle of tomato fruit treated with doses of AVG and stored (15 ± 1 °C and 90% ± 5% RH) for 28 d. Lowercase letters differ the doses in a single storage time and capital letters differ the storage times in a single dose, according to the Tukey test (p < 0.05).
-
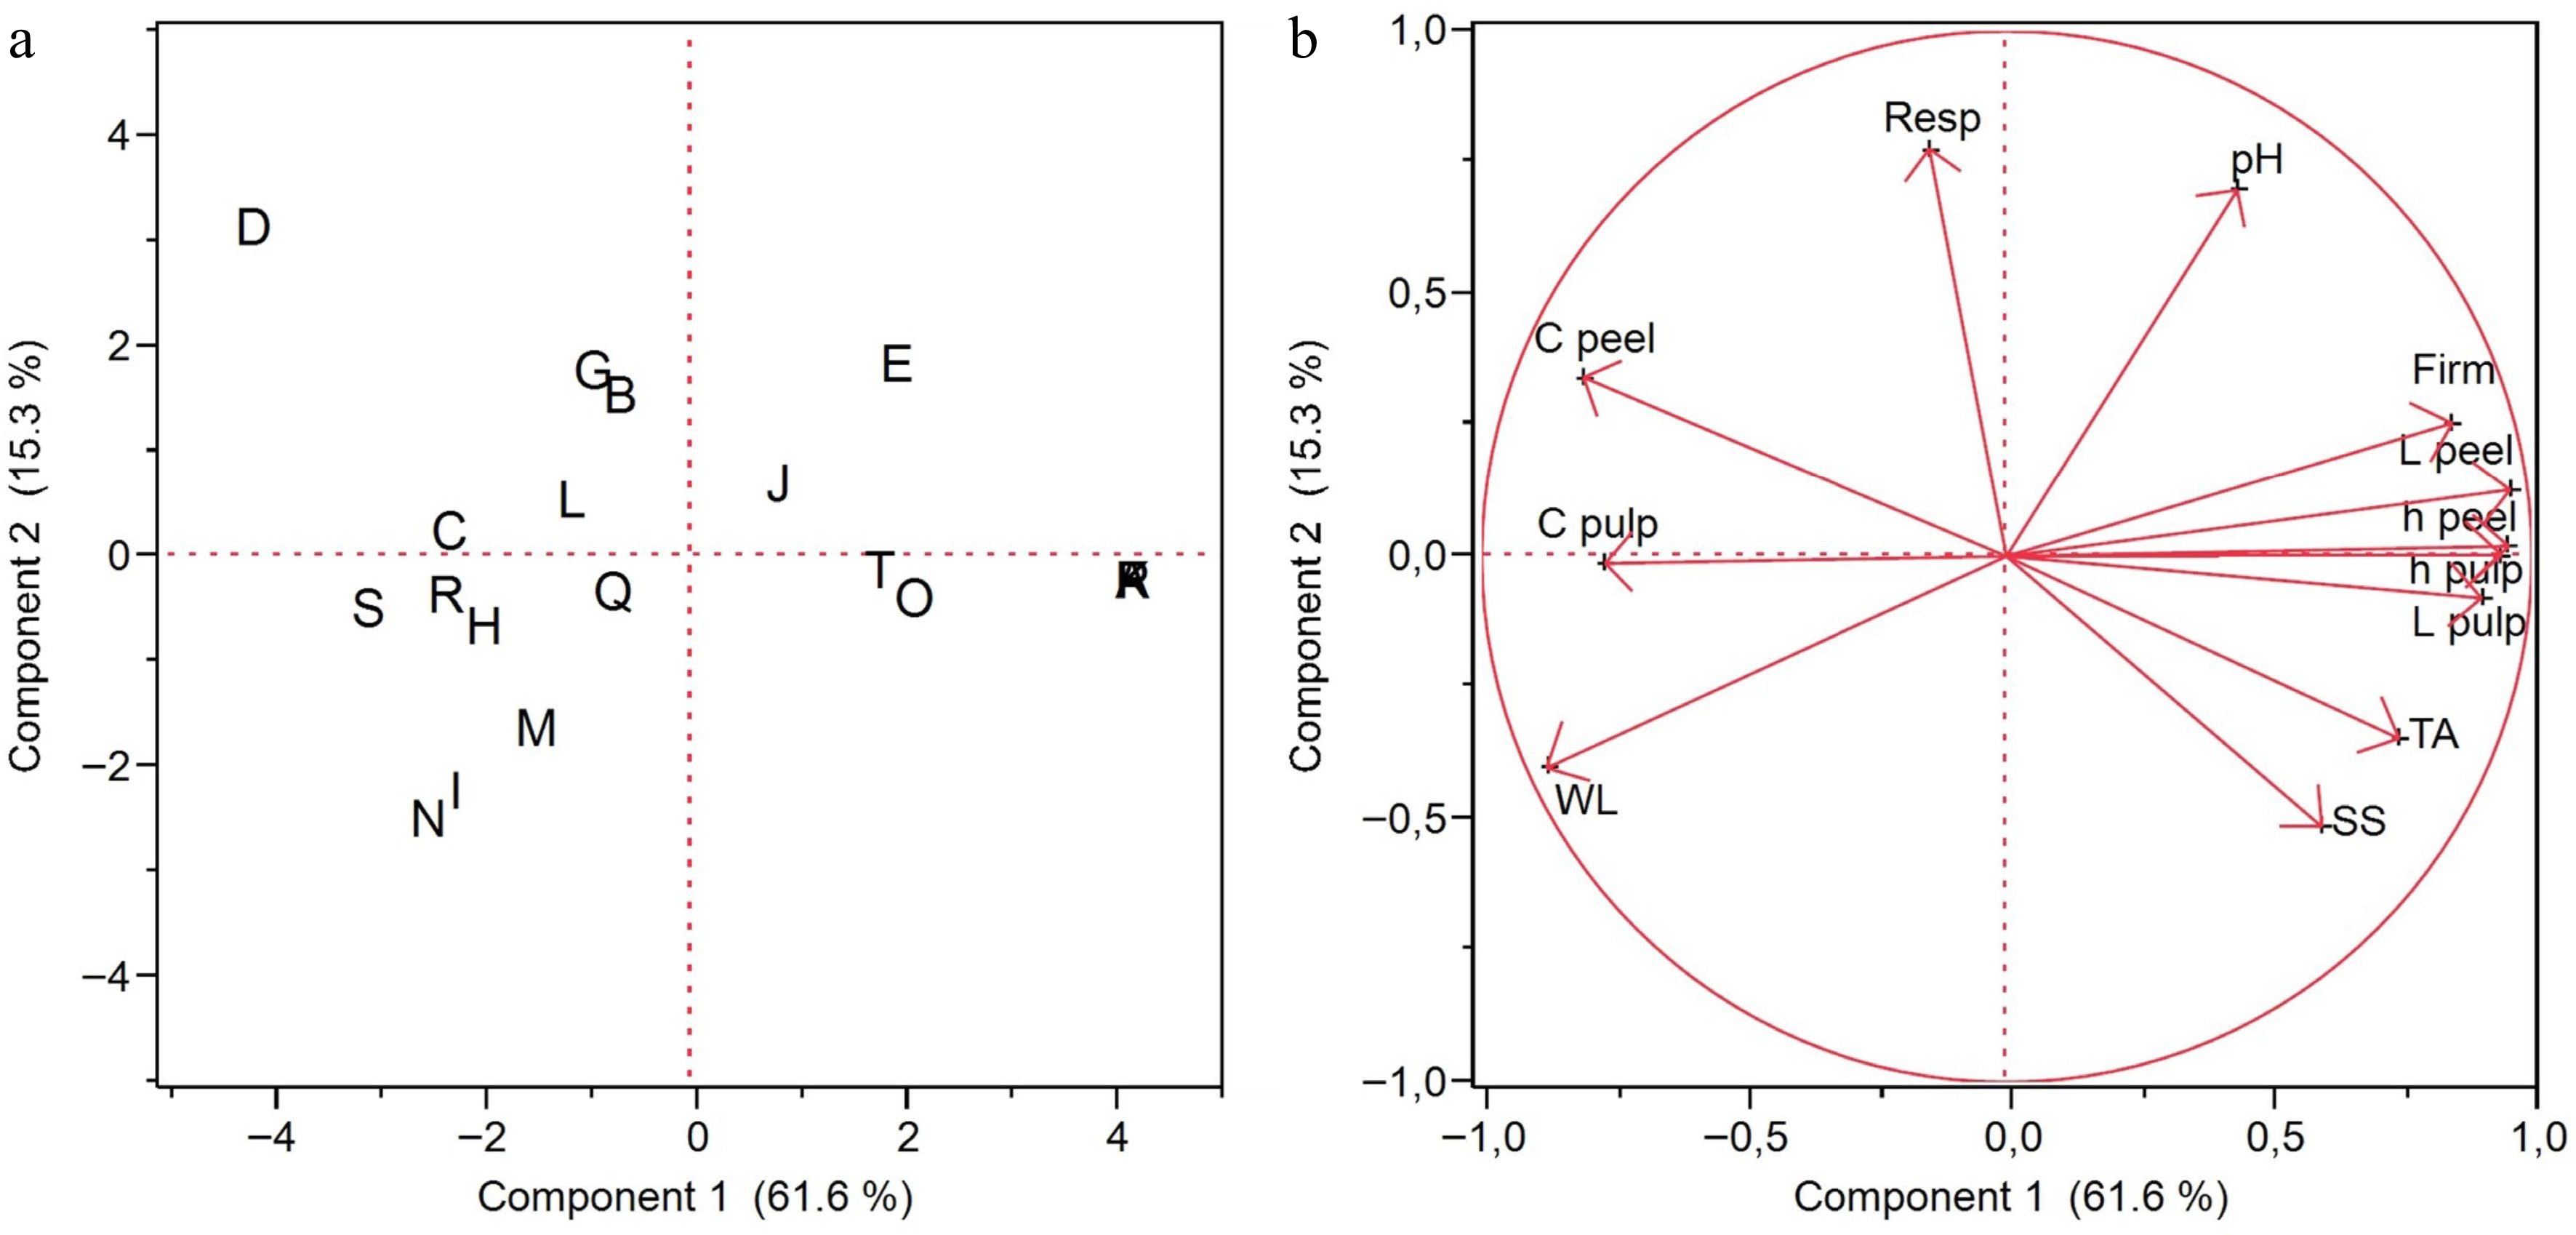
Figure 6.
(a) Score plot and (b) load plot of the principal component analysis of 12 parameters evaluated in tomato fruit treated with doses of AVG and stored (15 ± 1 °C and RH 90% ± 5%) for 28 d. Score graph (a): 0 mg·L−1 dose on days 0 (A), 7 (E), 14 (B), 21 (C) and 28 (D); 500 mg·L−1 dose on days 0 (P), 7 (T), 14 (Q), 21 (R) and 28 (S); 1,000 mg·L−1 dose on days 0 (F), 7 (J), 14 (G), 21 (H) and 28 (I); and 1,500 mg·L−1 dose on days 0 (K), 7 (O), 14 (L), 21 (M) and 28 (N). Load graph (b): weight loss (WL), respiratory rate (Resp), firmness (Firm), total soluble solids (SS), hydrogen potential (pH), titrable acidity (TA), lightness external (L peel), chroma external (C peel), hue angle external (°h peel), lightness internal (L pulp), chroma internal (C pulp) and hue angle internal (°h pulp).
-
Cause of variation D.F. Weight loss Respiratory rate Firmness Total soluble solids pH Tritrable acidity Dose 3 0.000** 0.000** 0.027* 0.042* 0.778ns 0.046* Time (d) 4 0.000** 0.000** 0.000** 0.049* 0.579ns 0.000** Dose × time 12 0.004** 0.000** 0.000** 0.219ns 0.988ns 0.002** Residue 40 0.150 3.264 0.033 0.122 0.069 0.000 ns represents not significant; * represents p ≤ 0.05 and ** represents p ≤ 0.01. Table 1.
Results of the analysis of variance (Two-Way ANOVA) of the effect of AVG doses, storage time and the interaction of these factors on the physicochemical parameters evaluated in tomato fruits.
-
Cause of variation D.F. L peel C peel h° peel L pulp C pulp h° pulp Dose 3 0.001** 0.000** 0.000** 0.866ns 0.030* 0.045 * Time (d) 4 0.000** 0.000** 0.000** 0.000** 0.000** 0.000** Dose × time 12 0.038* 0.010* 0.000** 0.695ns 0.014* 0.000** Residue 40 1.780 4.402 3.294 7.097 2.507 12.640 ns represents not significant; * represents p ≤ 0.05 and ** represents p ≤ 0.01. Table 2.
Results of the analysis of variance (Two-Way ANOVA) of the effect of AVG doses, storage time and the interaction of these factors on the external and internal color parameters evaluated in tomato fruits.
Figures
(6)
Tables
(2)