-
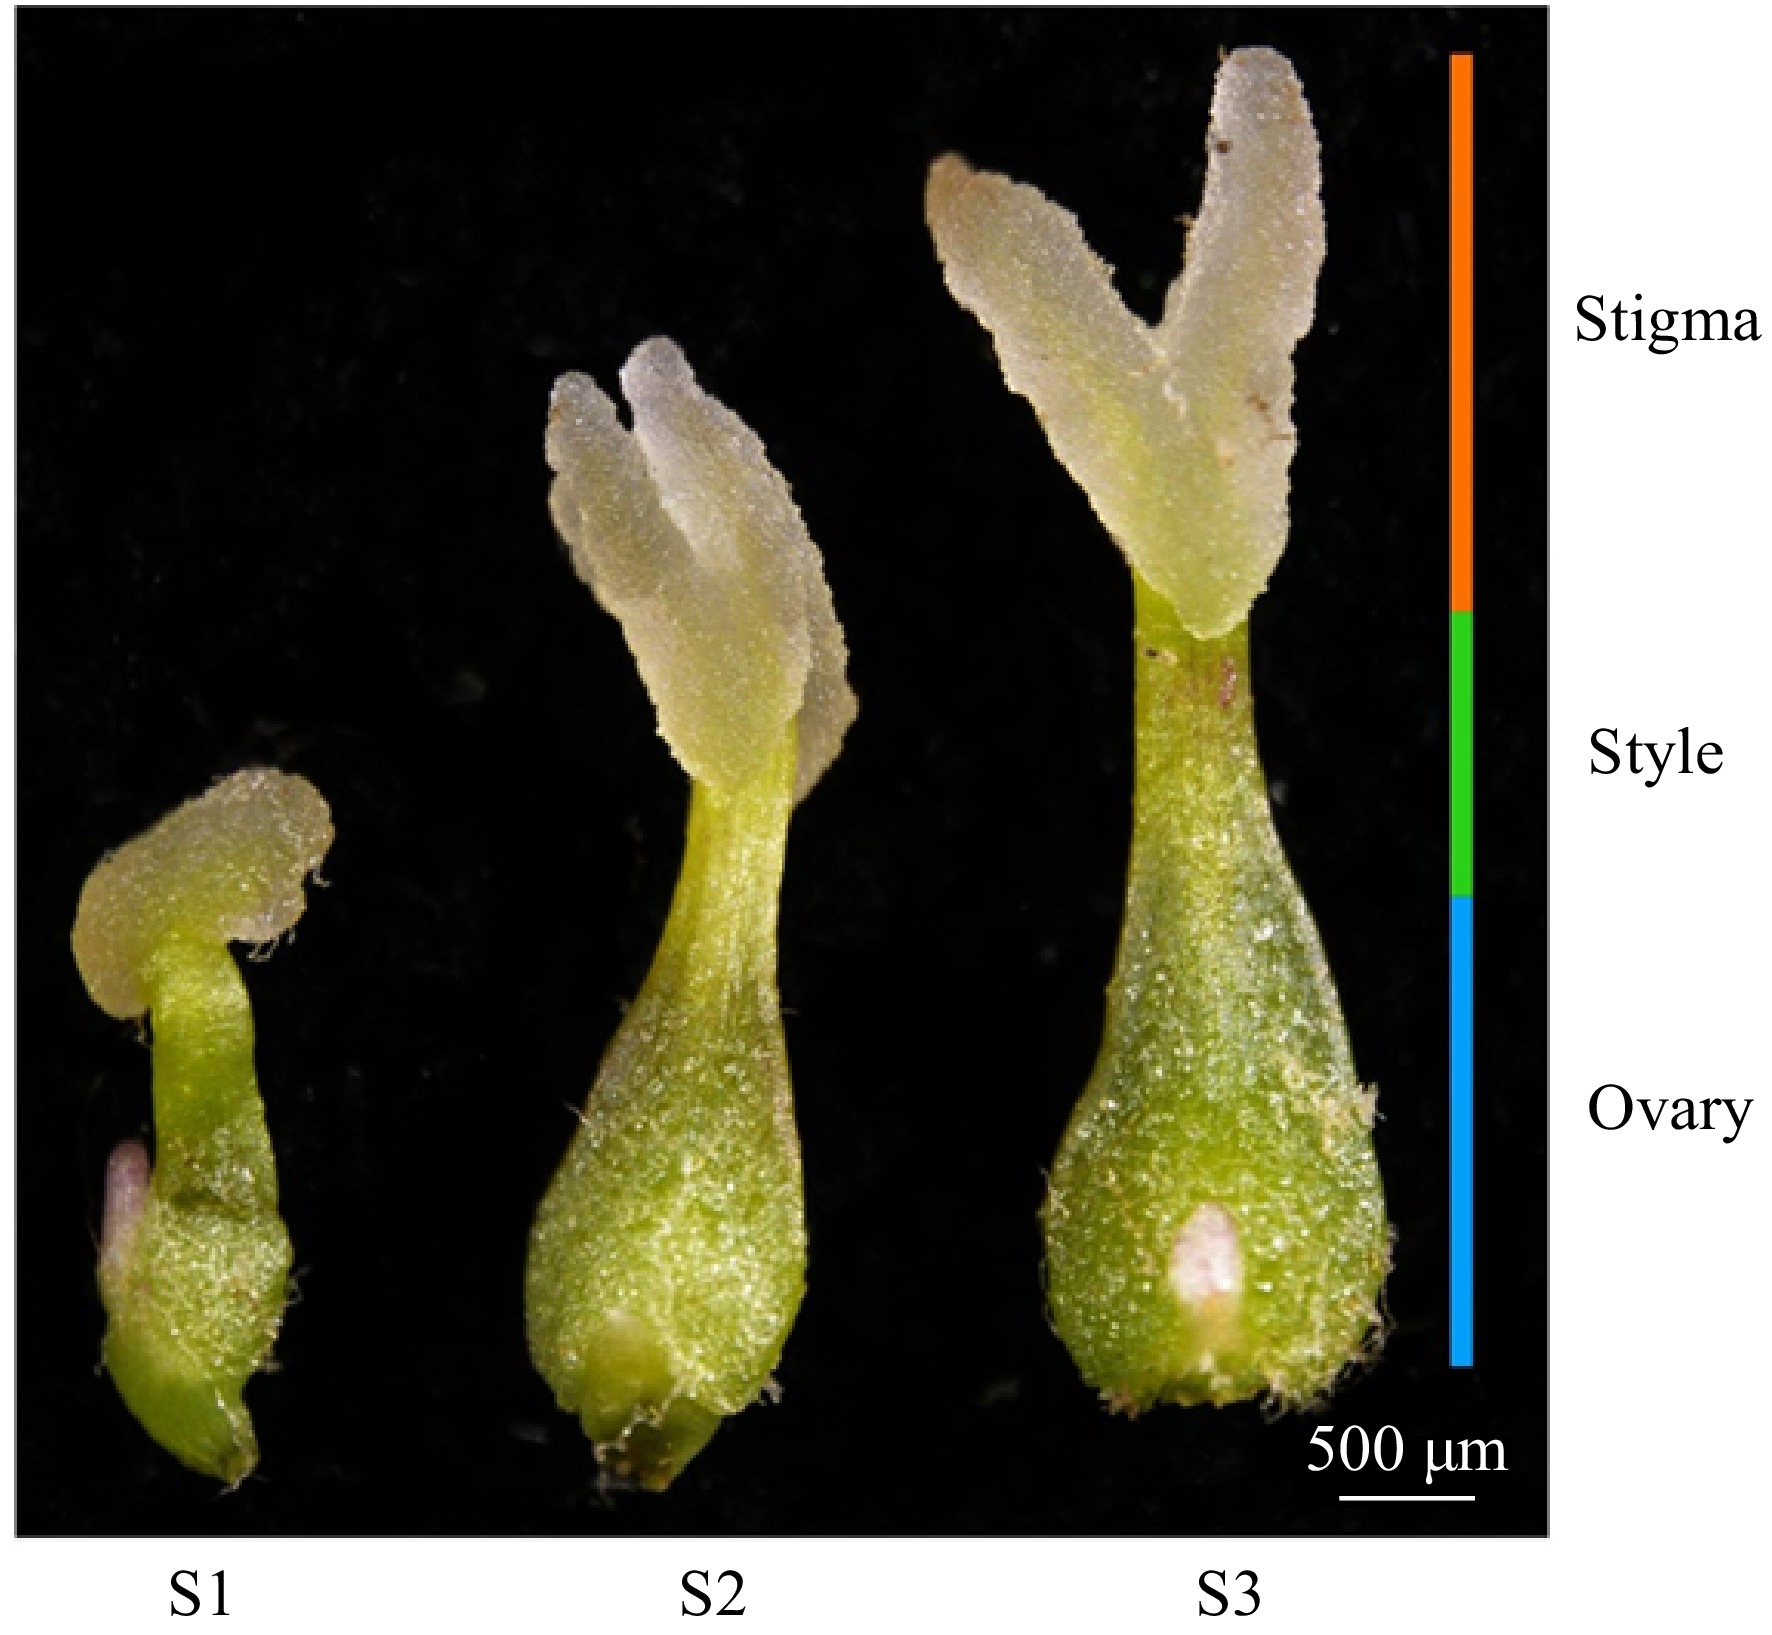
Figure 1.
Morphological stages of stigma development in F. mandshurica. From left to right: S1, S2, and S3 stages, as observed by stereomicroscopy. The orange bar corresponds to the stigma, the green bar to the style, and the blue bar to the ovary. Scale bar = 500 µm.
-
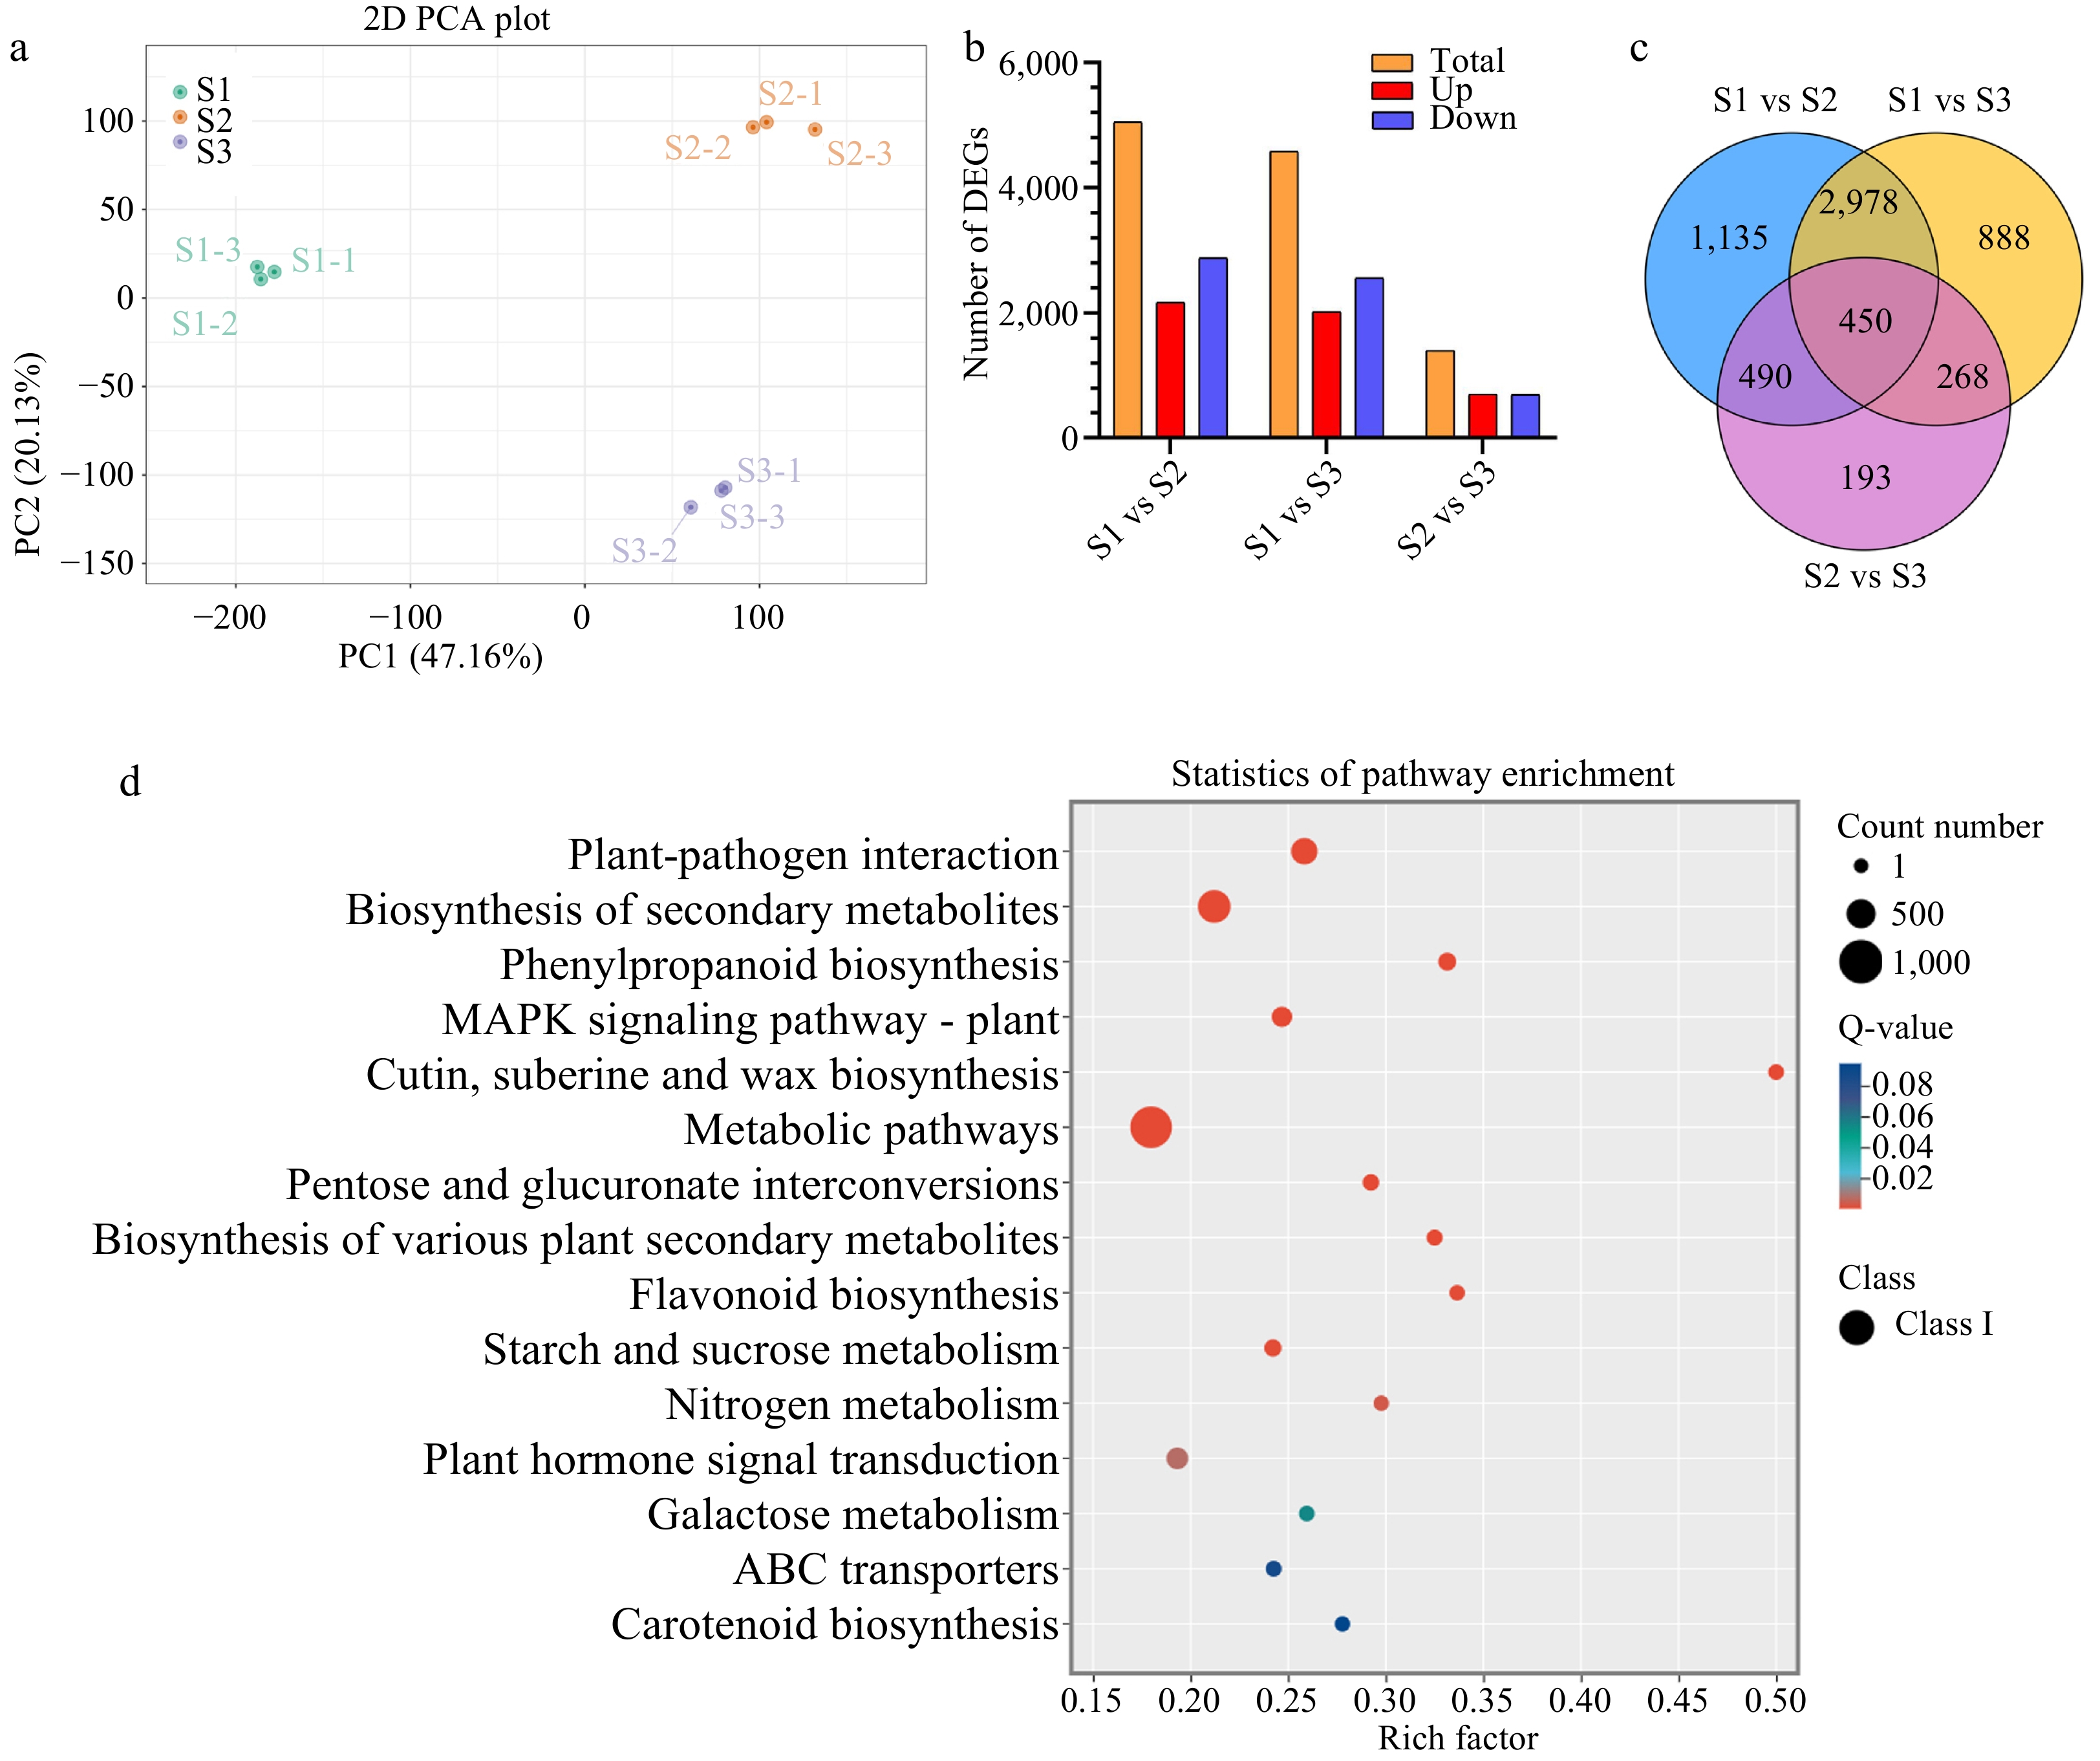
Figure 2.
Statistical analysis of differentially expressed genes (DEGs) related to stigma development in F. mandshurica. (a) Principal component analysis (PCA) of transcriptome data during stigma development. (b) Summary of DEG results. Red and blue indicate upregulated and downregulated genes, respectively. In each comparison, orange indicates the total. (c) Venn diagram of DEGs in three comparison groups. (d) KEGG enrichment analysis of all DEGs.
-
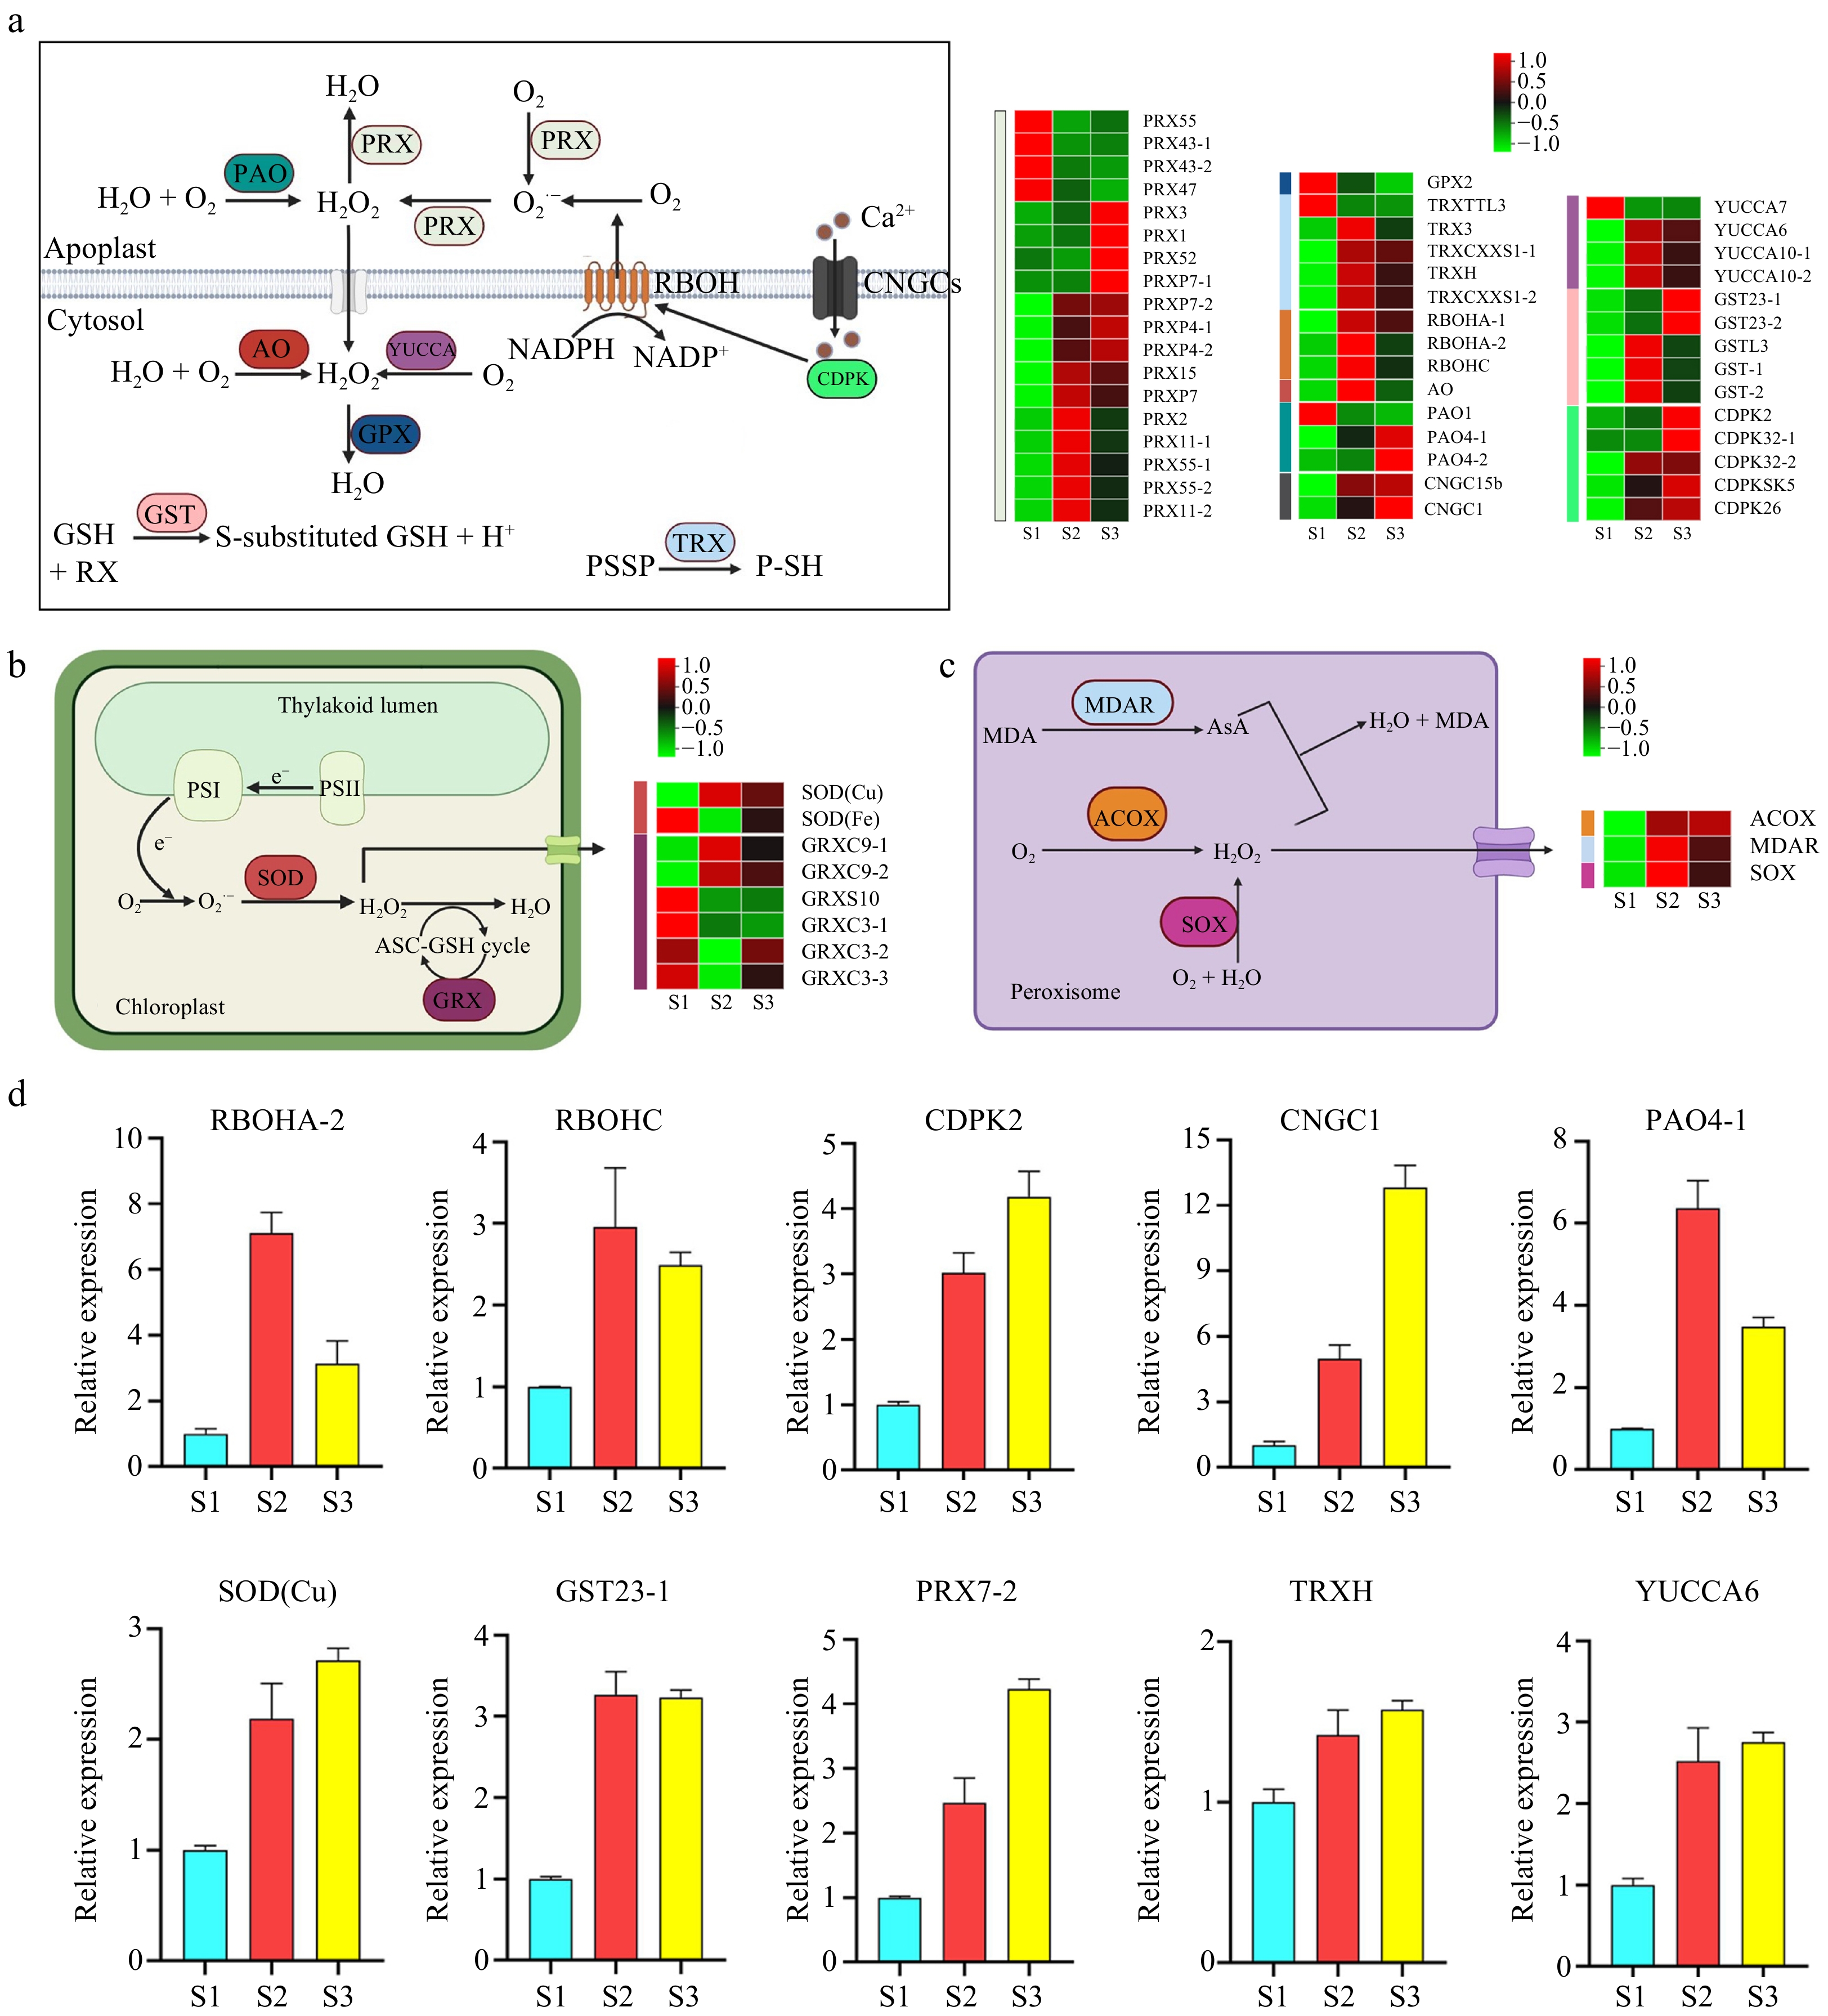
Figure 3.
Pathway cluster analysis and quantitative polymerase chain reaction (qPCR) validation of selected genes related to ROS production and sequestration. (a) ROS production and sequestration in the apoplast and cytosol. (b) ROS production and sequestration in the chloroplast. (c) ROS production and sequestration in the peroxisome. (d) qRCR analysis of selected genes. ACOX, Acyl-CoA oxidase; AO, Aldehyde oxidase; AsA, Ascorbic acid; CDPK, Calcium-dependent protein kinase; CNGC, Cyclic nucleotide-gated channel; GPX, Glutathione peroxidase; GRX, Glutaredoxin; GST, Glutathione S-transferase; MDAR, Monodehydroascorbate reductase; MDA, Malondialdehyde; PAO, Polyamine oxidase; PRX, Peroxidase; RBOH, Respiratory burst oxidase homolog; SOD, Superoxide dismutase; SOX, Sarcosine oxidase; TRX, Thioredoxin.
-
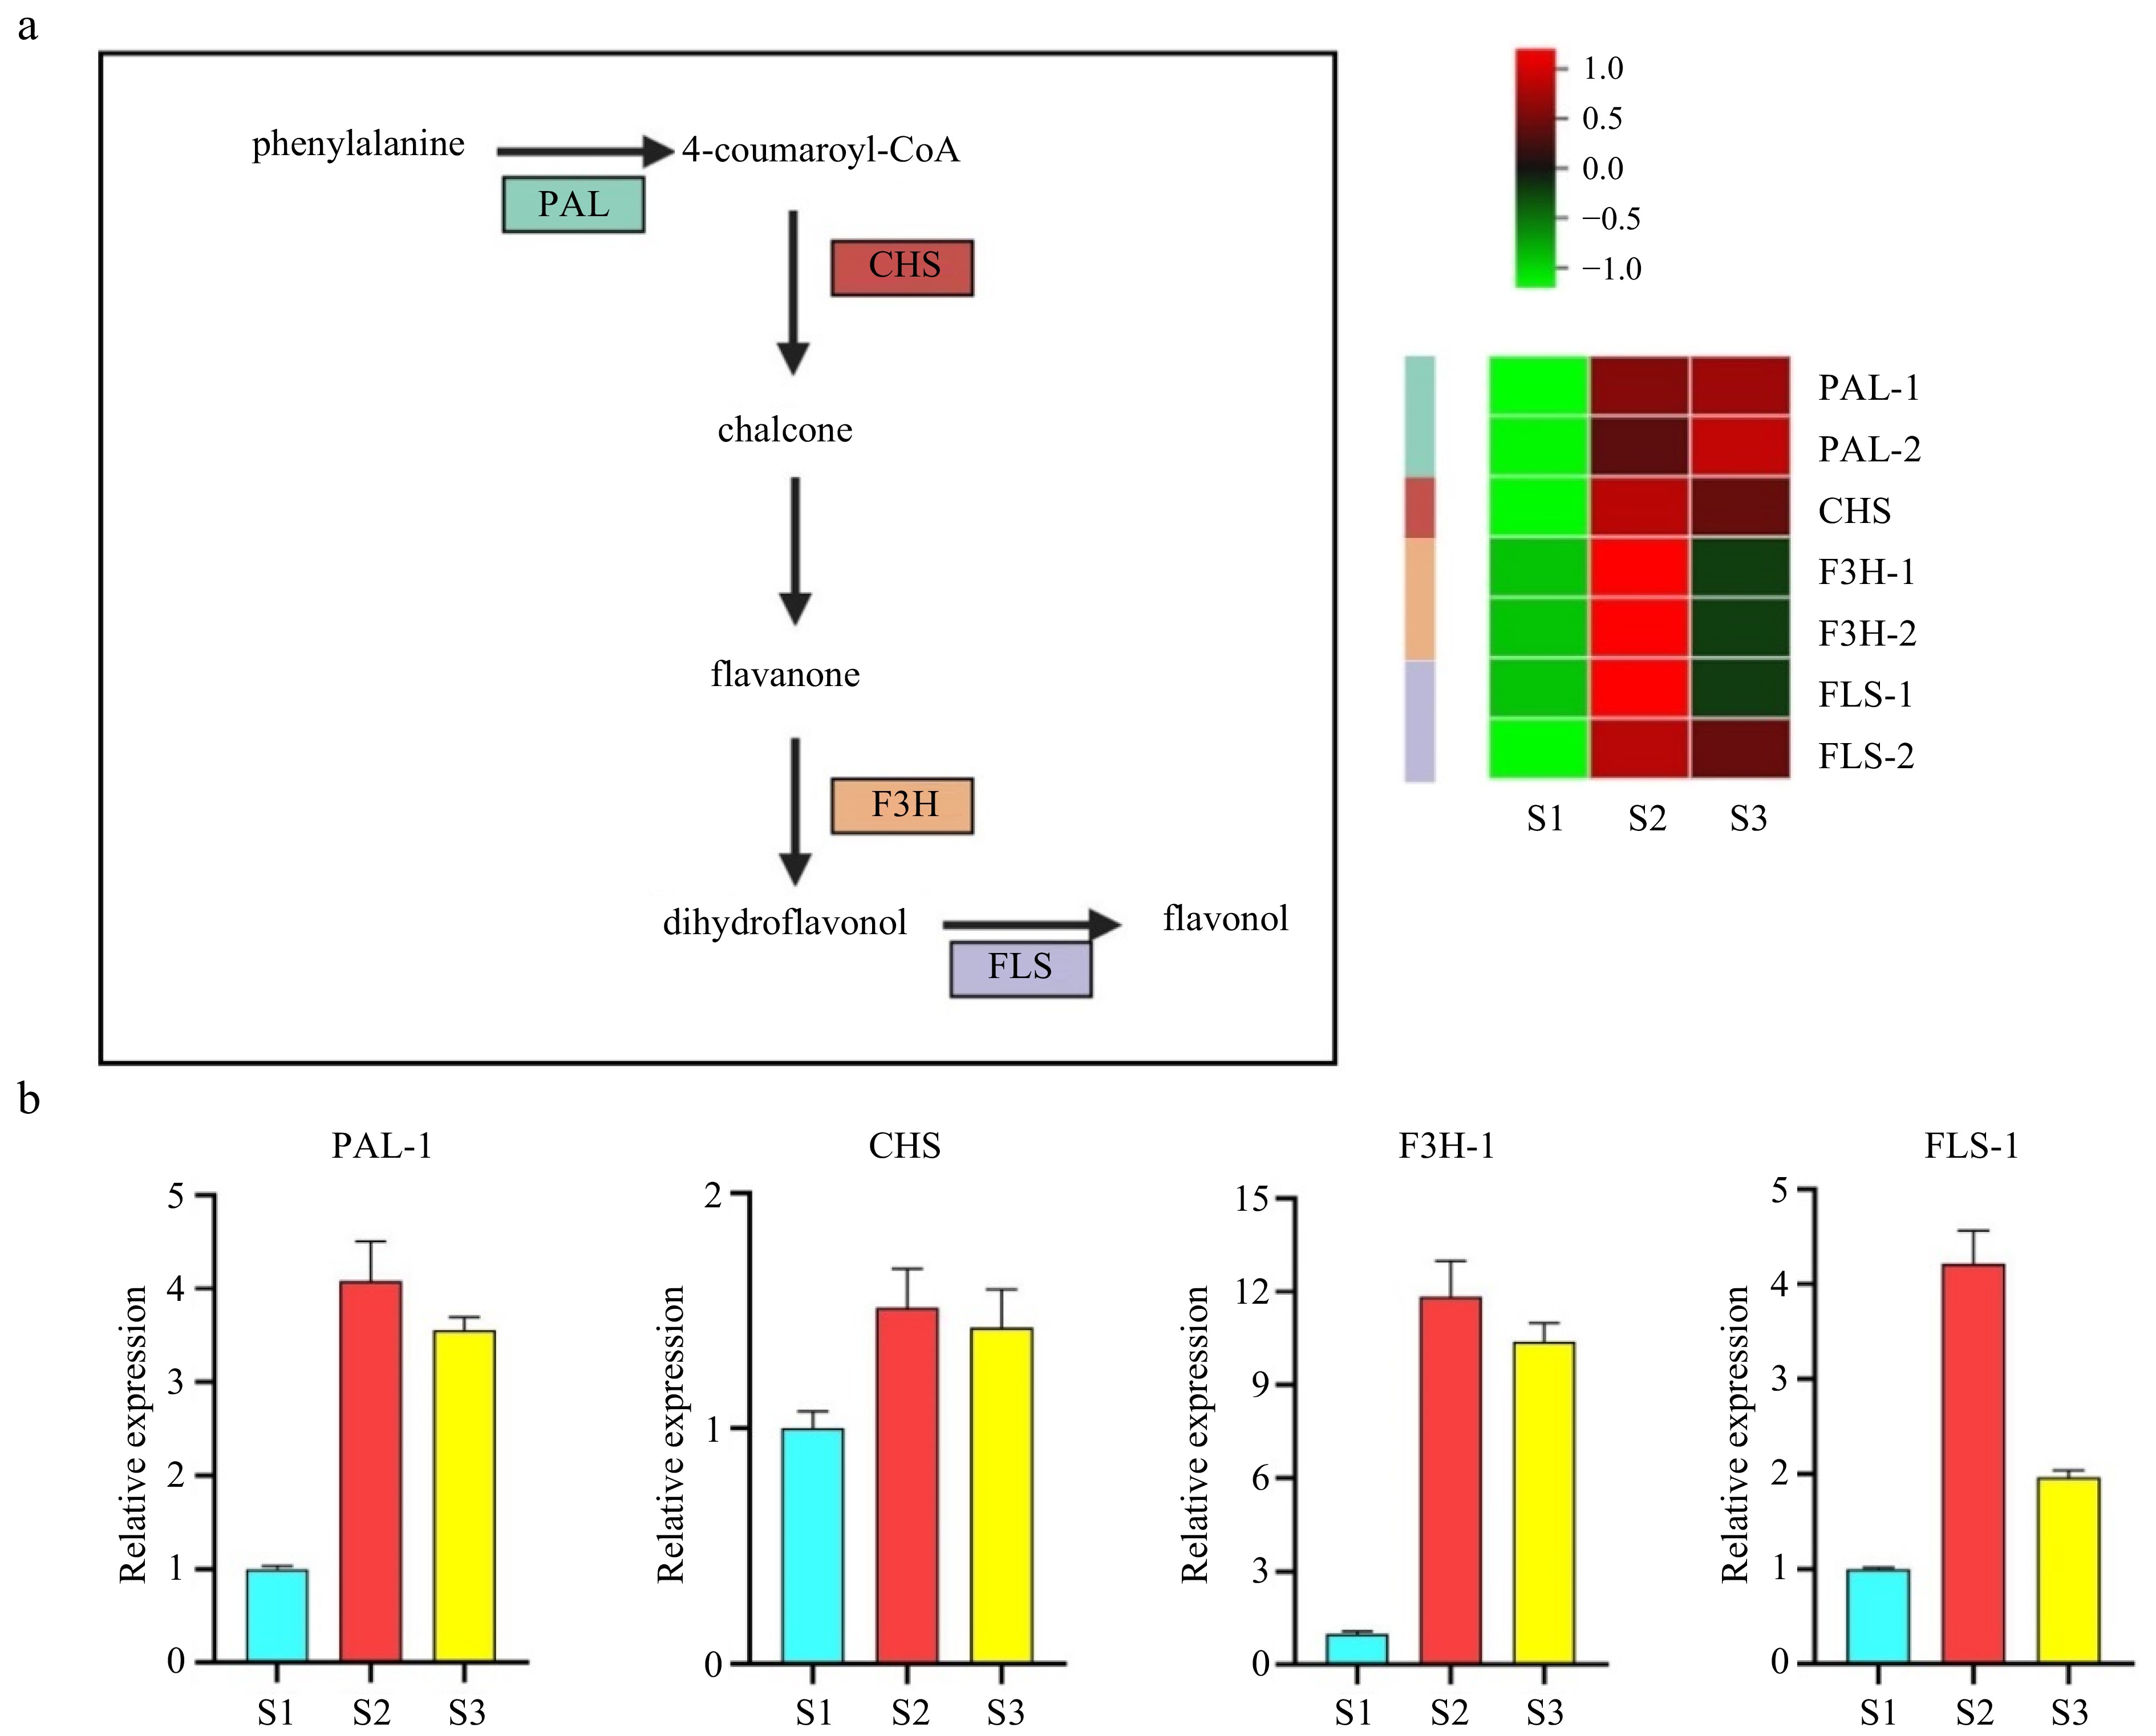
Figure 4.
Validation of potential genes associated with flavonoid synthesis by cluster analysis and quantitative polymerase chain reaction (qPCR). (a) Pathway and heatmap of candidate genes showing fold changes. (b) qPCR validation of flavonoid synthesis-related genes. PAL, Phenylalanine ammonia-lyase; CHS, Chalcone synthase; F3H, Flavanone 3P-hydroxylase; FLS, Flavonol synthase.
-
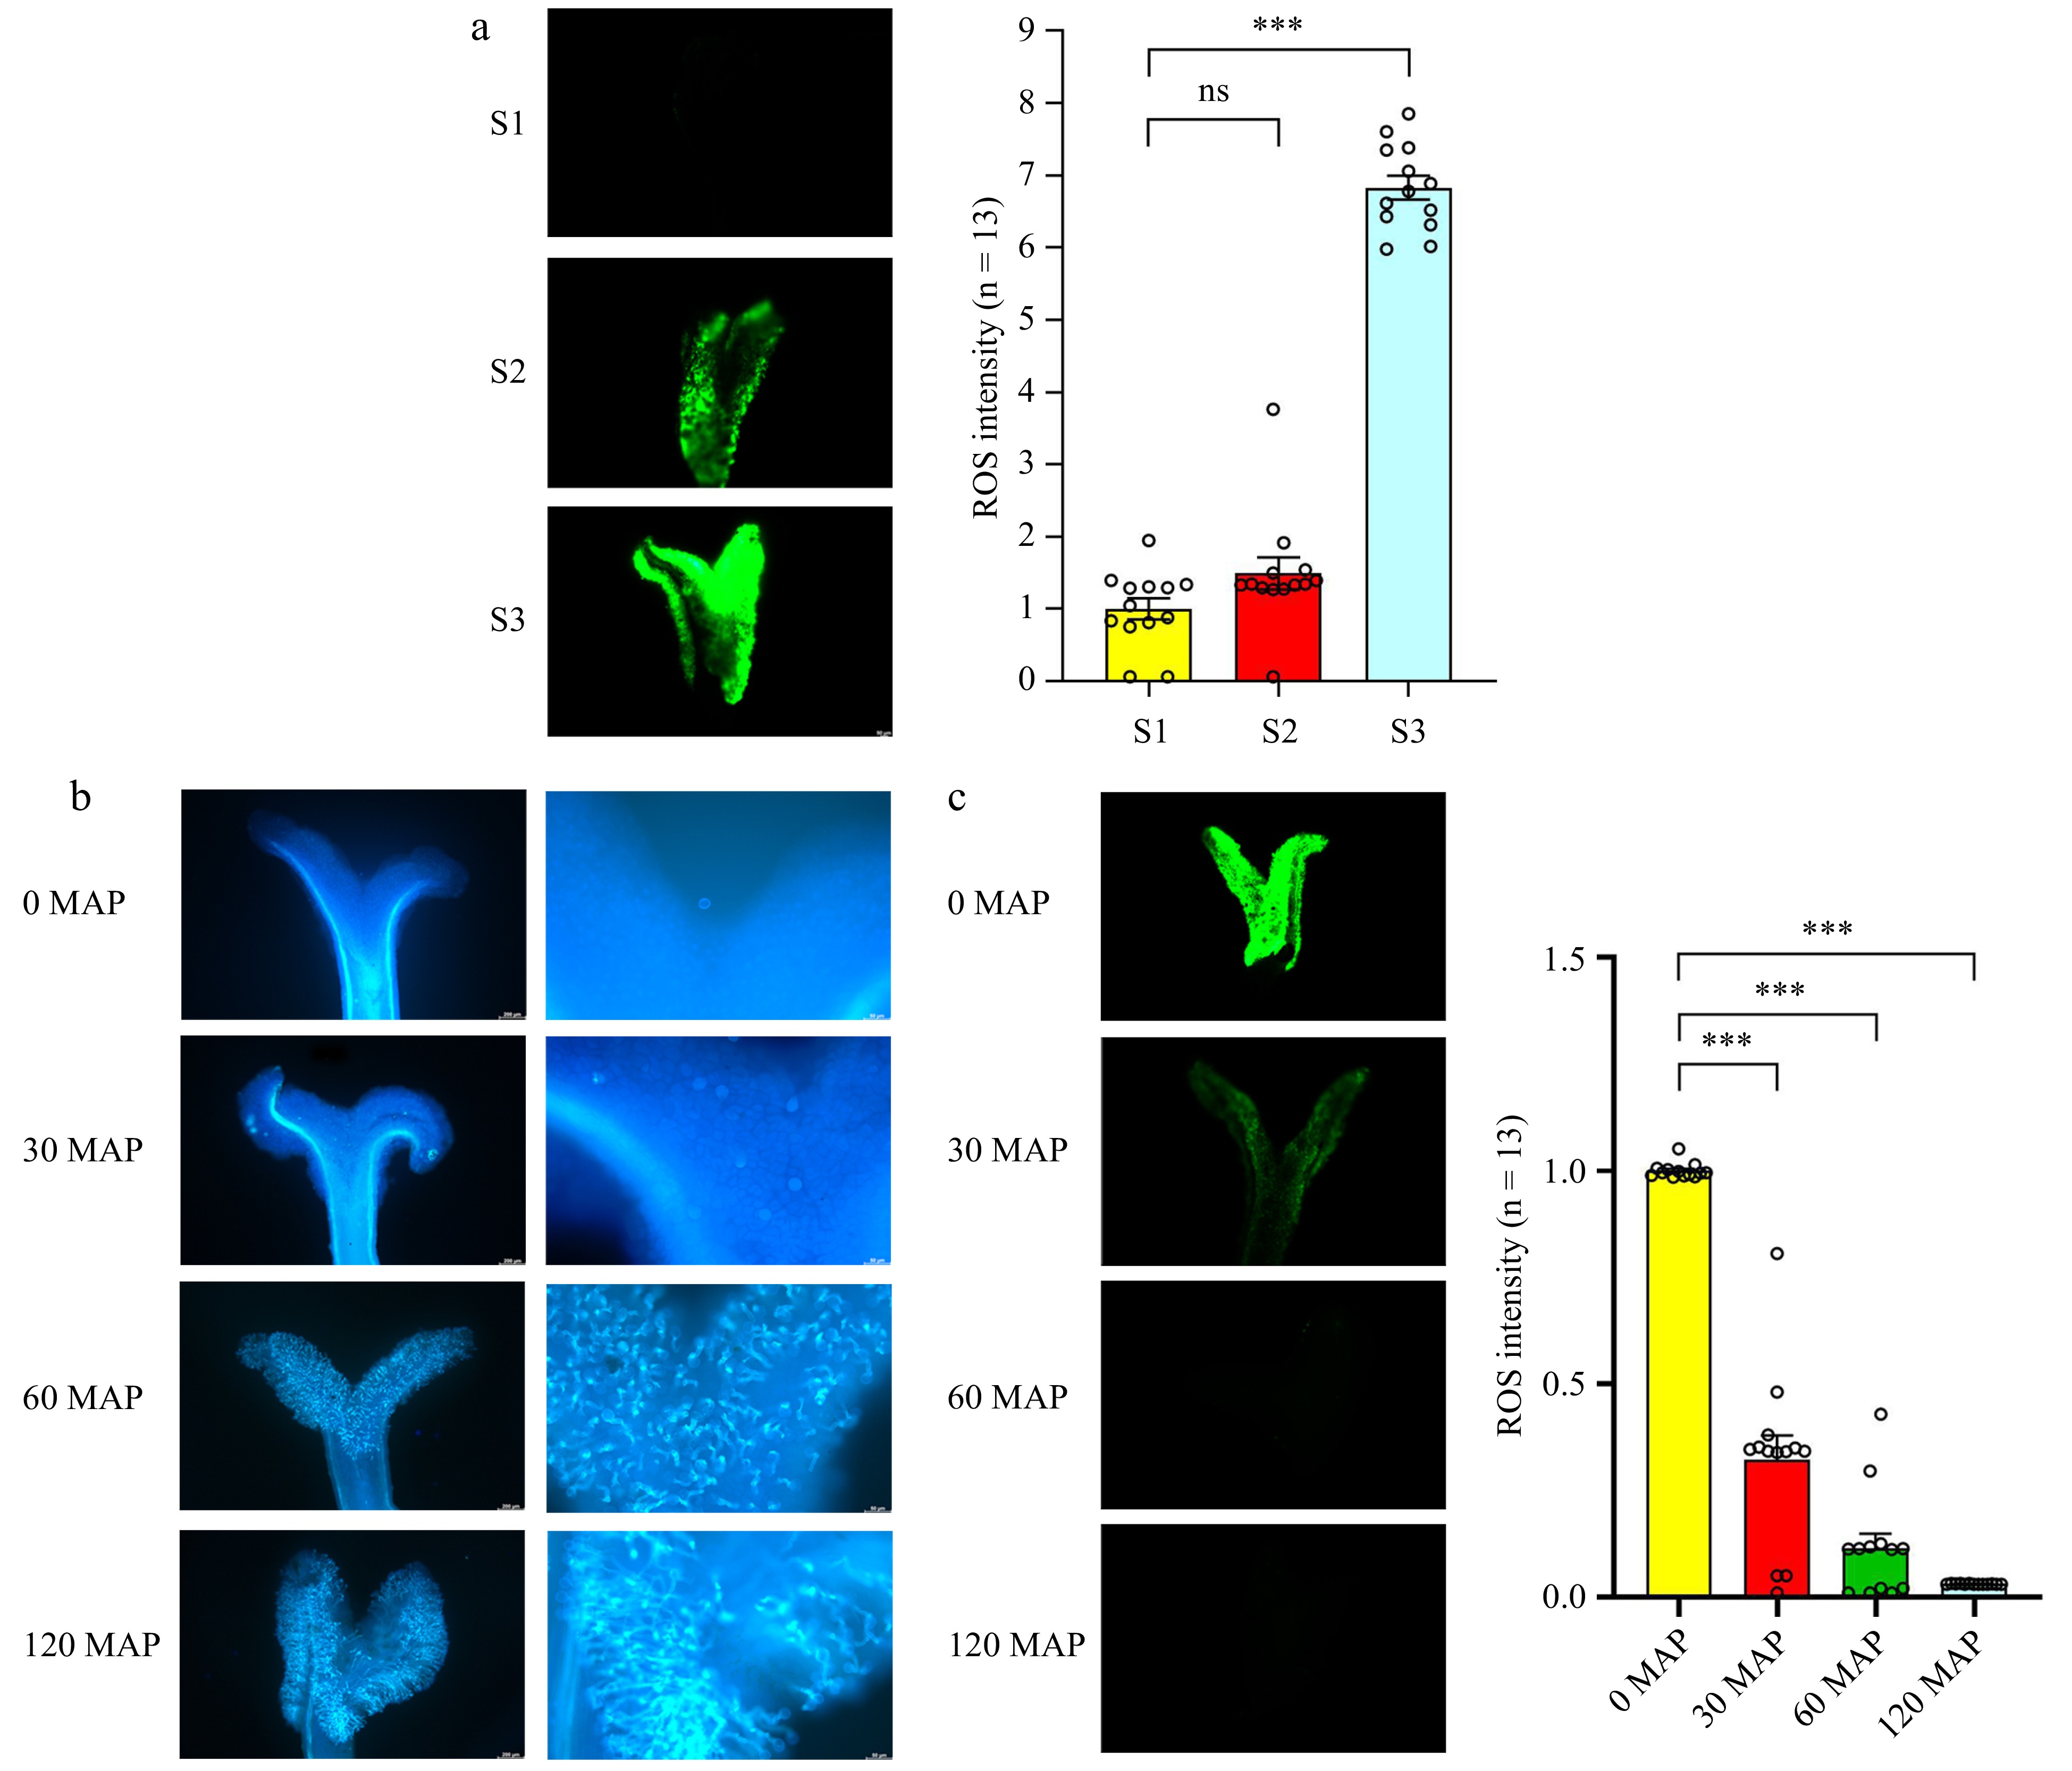
Figure 5.
Accumulation of ROS in the stigma, followed by a reduction in ROS levels after pollination. (a) Detection of ROS during stigma development. (b) Observation of pollen grains under blue light after staining with aniline blue. From left to right: pollen grain number and pollen tube germination. (c) H2DCFDA staining of ROS levels at different time points after pollination. ROS signals were measured using ImageJ (the average signal in S1 stigmas is set at 1 for comparison). Data are expressed as ± SEM. Each data point is indicated by a dot, and (n) denotes stigma number. Asterisks or not significant (ns) above the error bars indicate significance level compared with the data bar on the left (Student's t-test; ***p < 0.001).
-
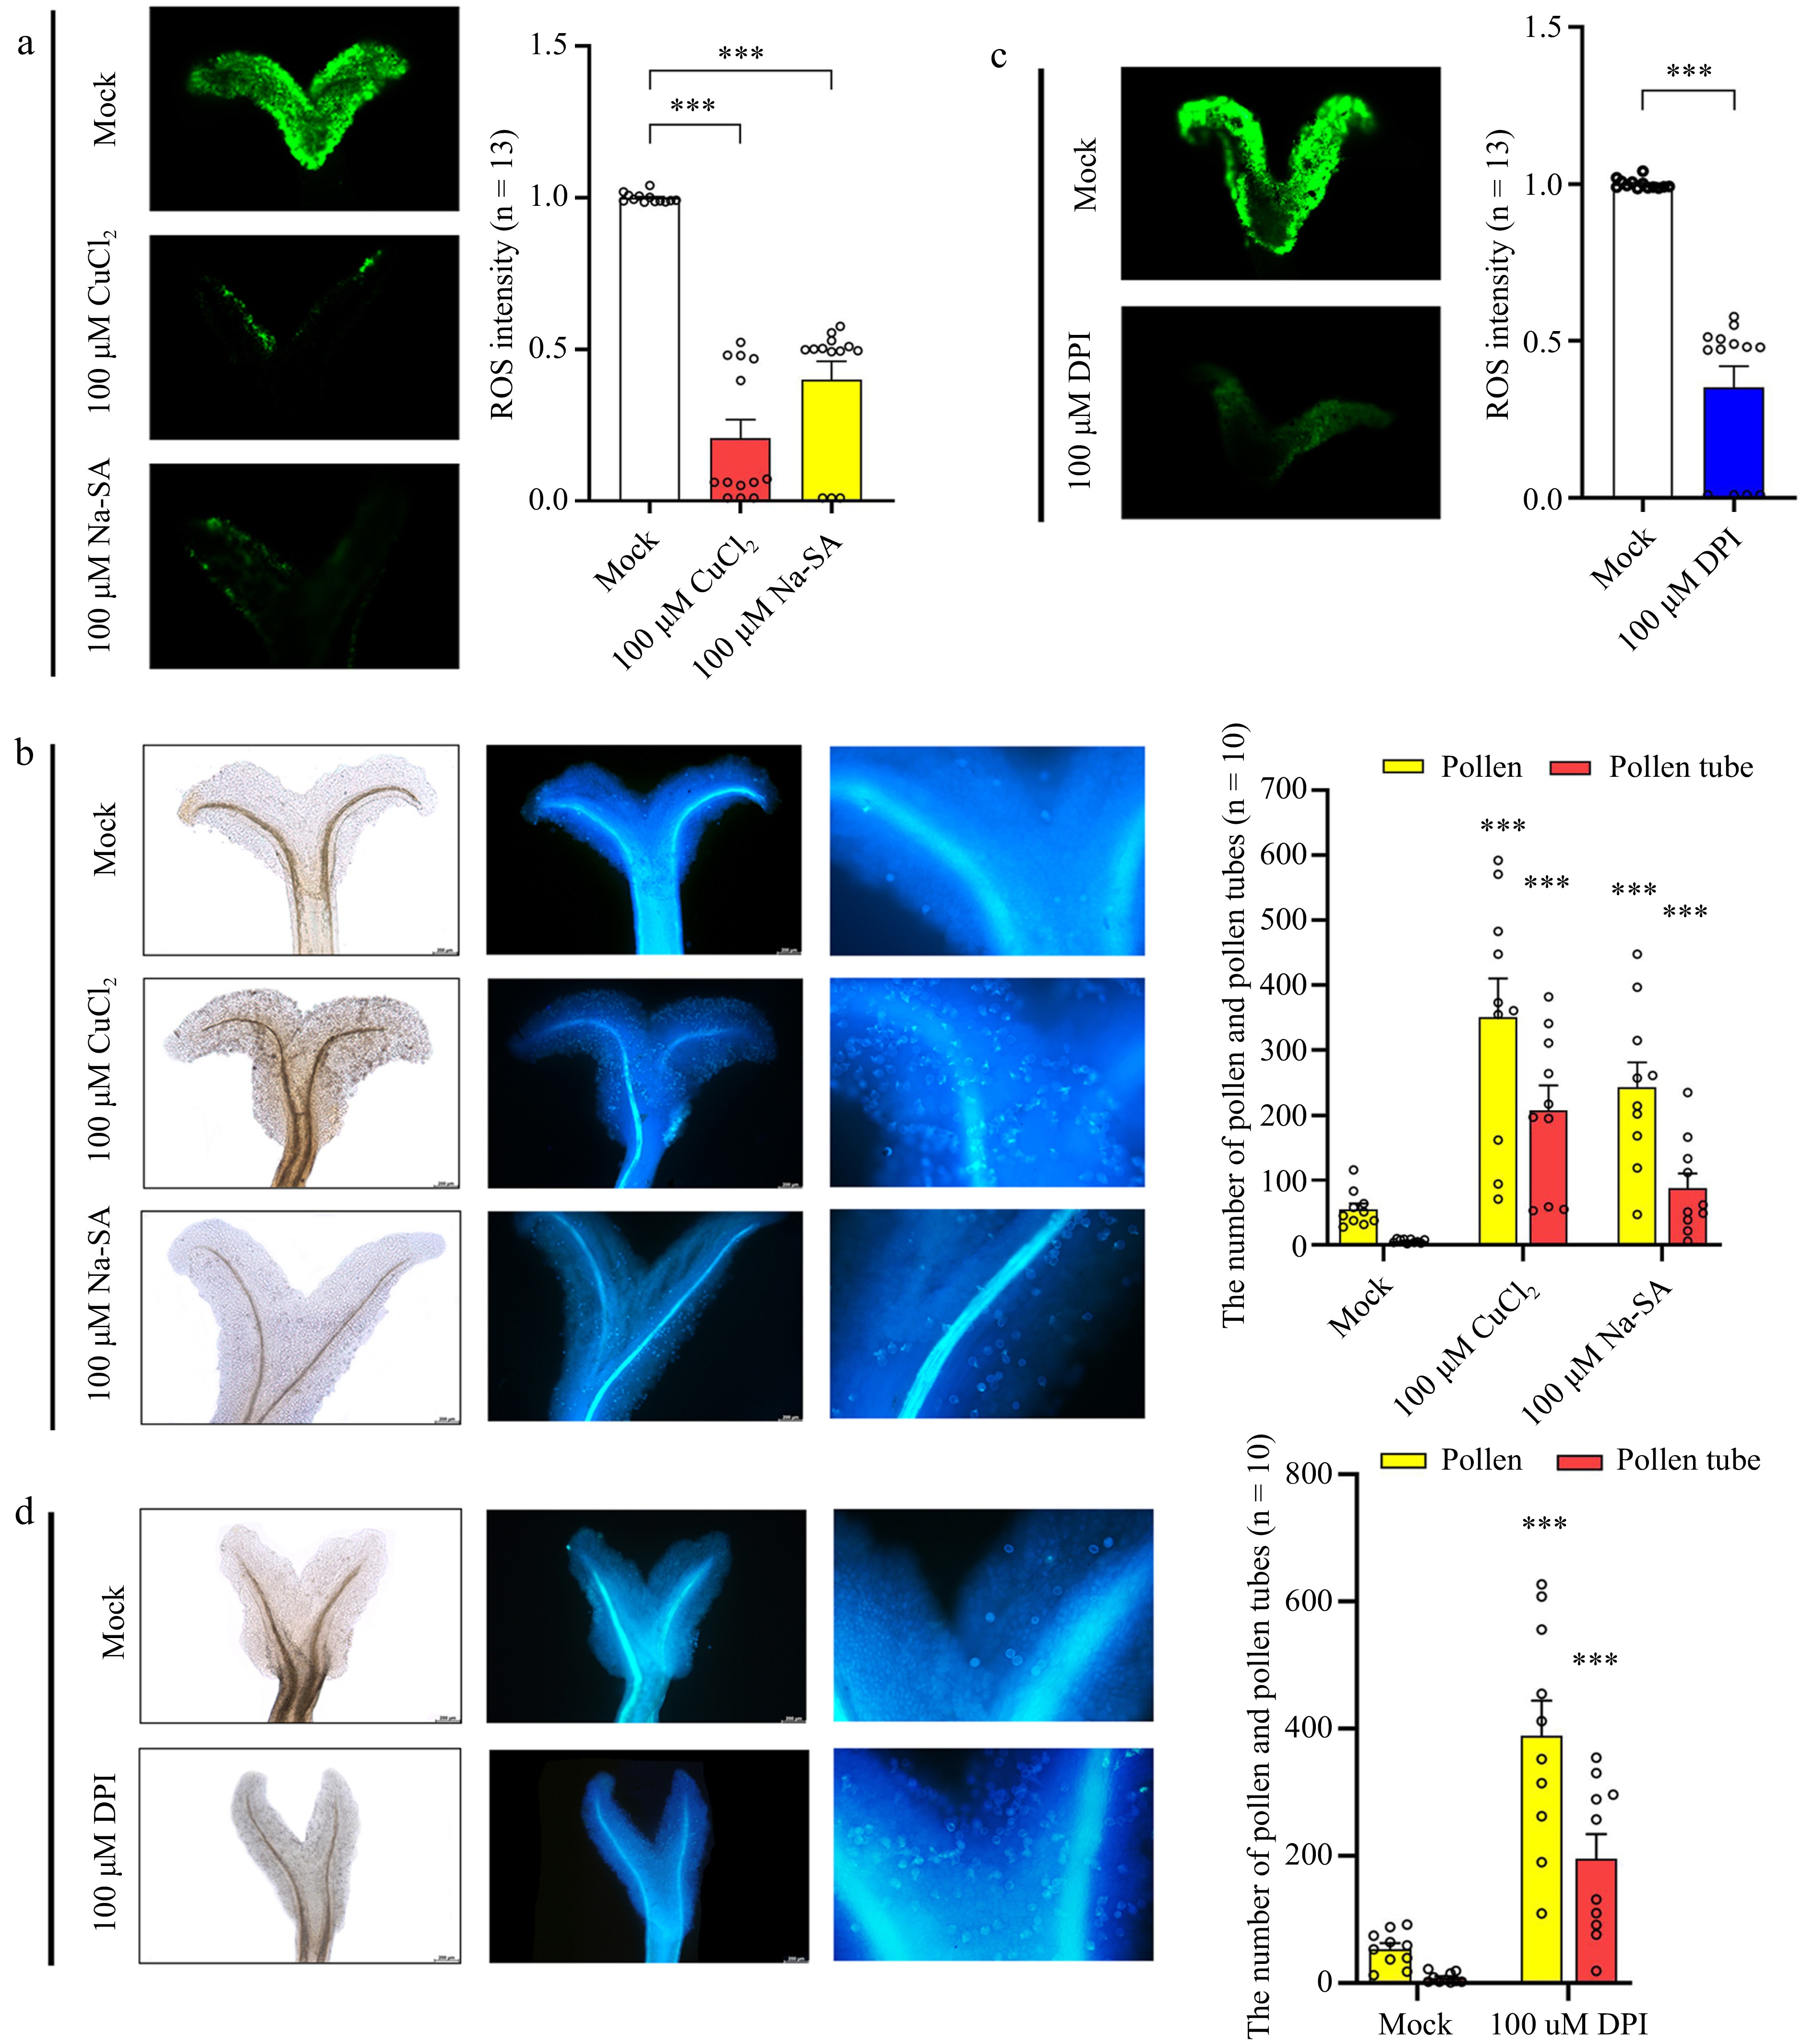
Figure 6.
Effect of ROS sequestration on pollination. (a) Detection of ROS after treatment of mature stigmas with copper (II) chloride (CuCl2) and sodium salicylate (Na-SA). (b) Detection of pollen number and pollen tube number after stigmas were treated with CuCl2 and Na-SA. From left to right: bright field and ultraviolet light views. (c) Detection of ROS after treatment of mature stigmas with diphenyleneiodonium chloride (DPI). (d) Detection of pollen tube number after mature stigmas were treated with DPI. From left to right: bright field and ultraviolet light views. Data are expressed ± SEM. Each data point is indicated by a dot, and (n) denotes the number of stigmas. Asterisks or not significant (ns) directly above the data bars indicate significance level compared with the data bar on the far left (Student's t-test; ***p < 0.001).
Figures
(6)
Tables
(0)