-
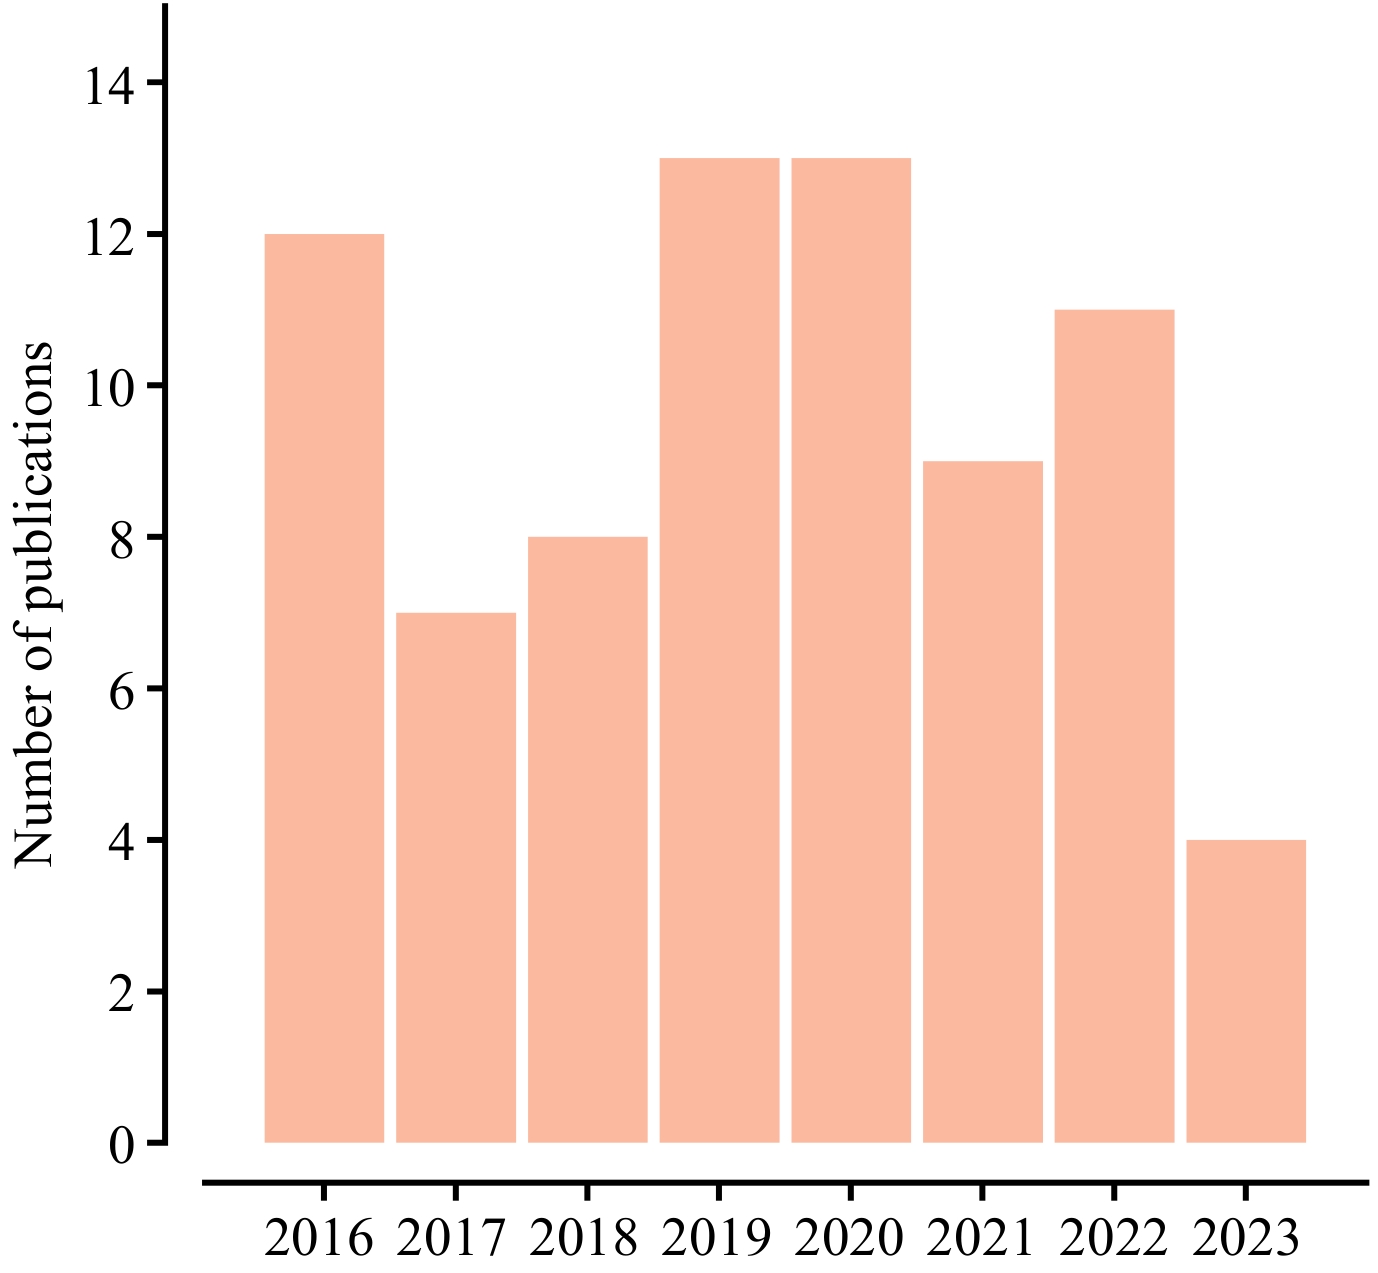
Figure 1.
Annual number of publications related to the use of vegetation spectral data in phylogeography, from 2016 to 2023. These publications were searched using keywords 'vegetation spectral' and 'phylogeography', from the Web of Science.
-
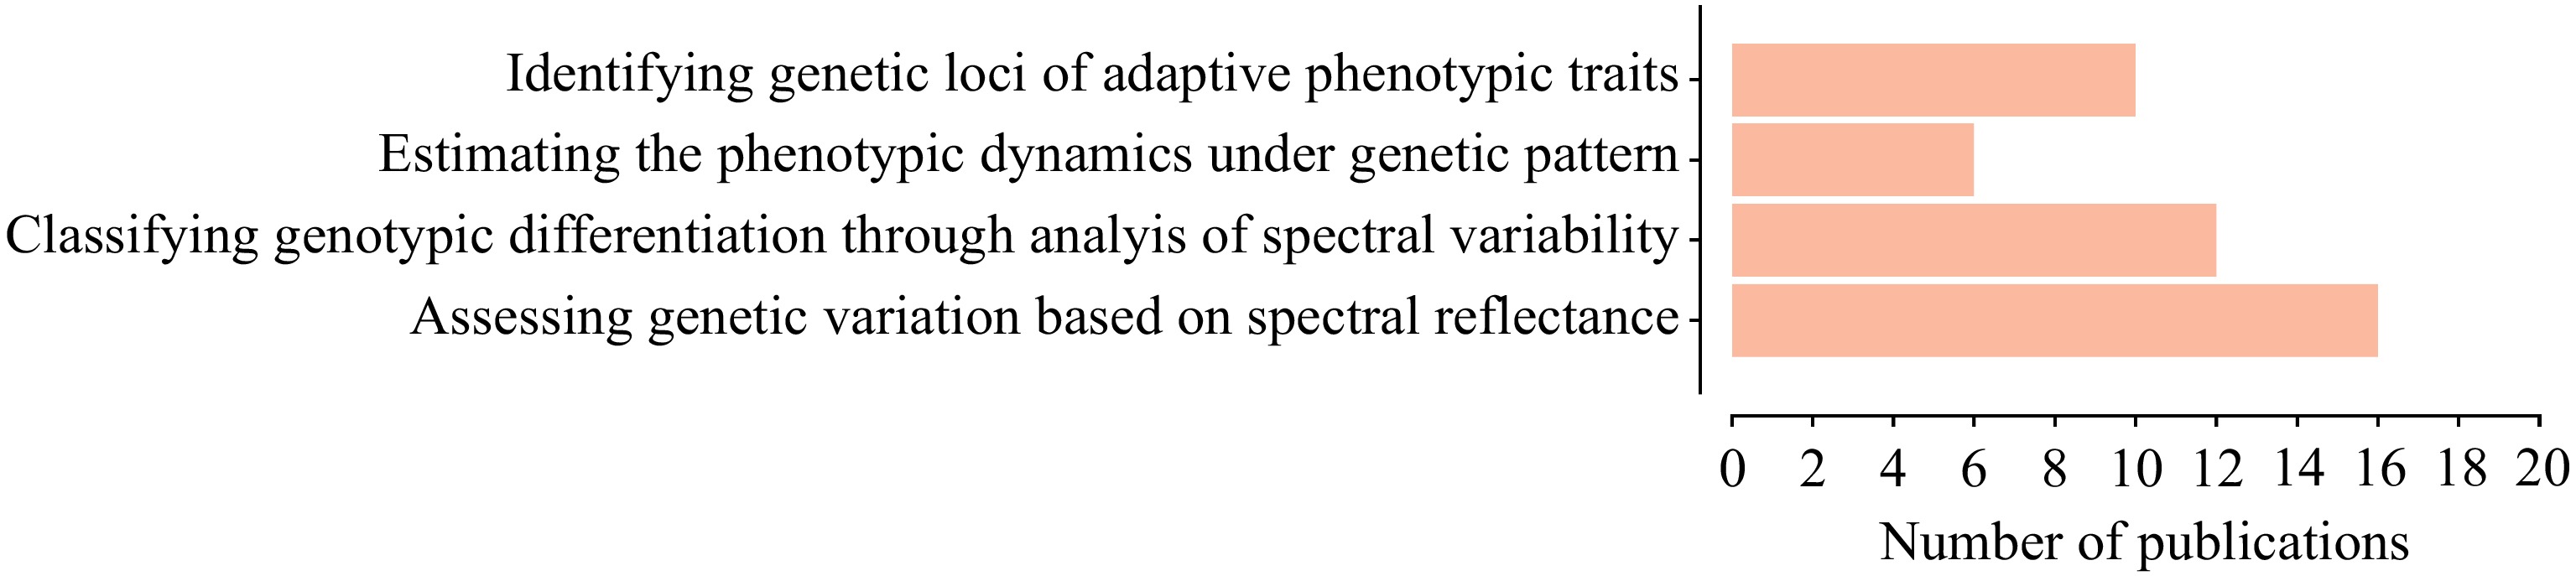
Figure 2.
The number of publications on different types of research relevant to integration of vegetation spectral data and phylogeography, from 2016 to 2023.
-
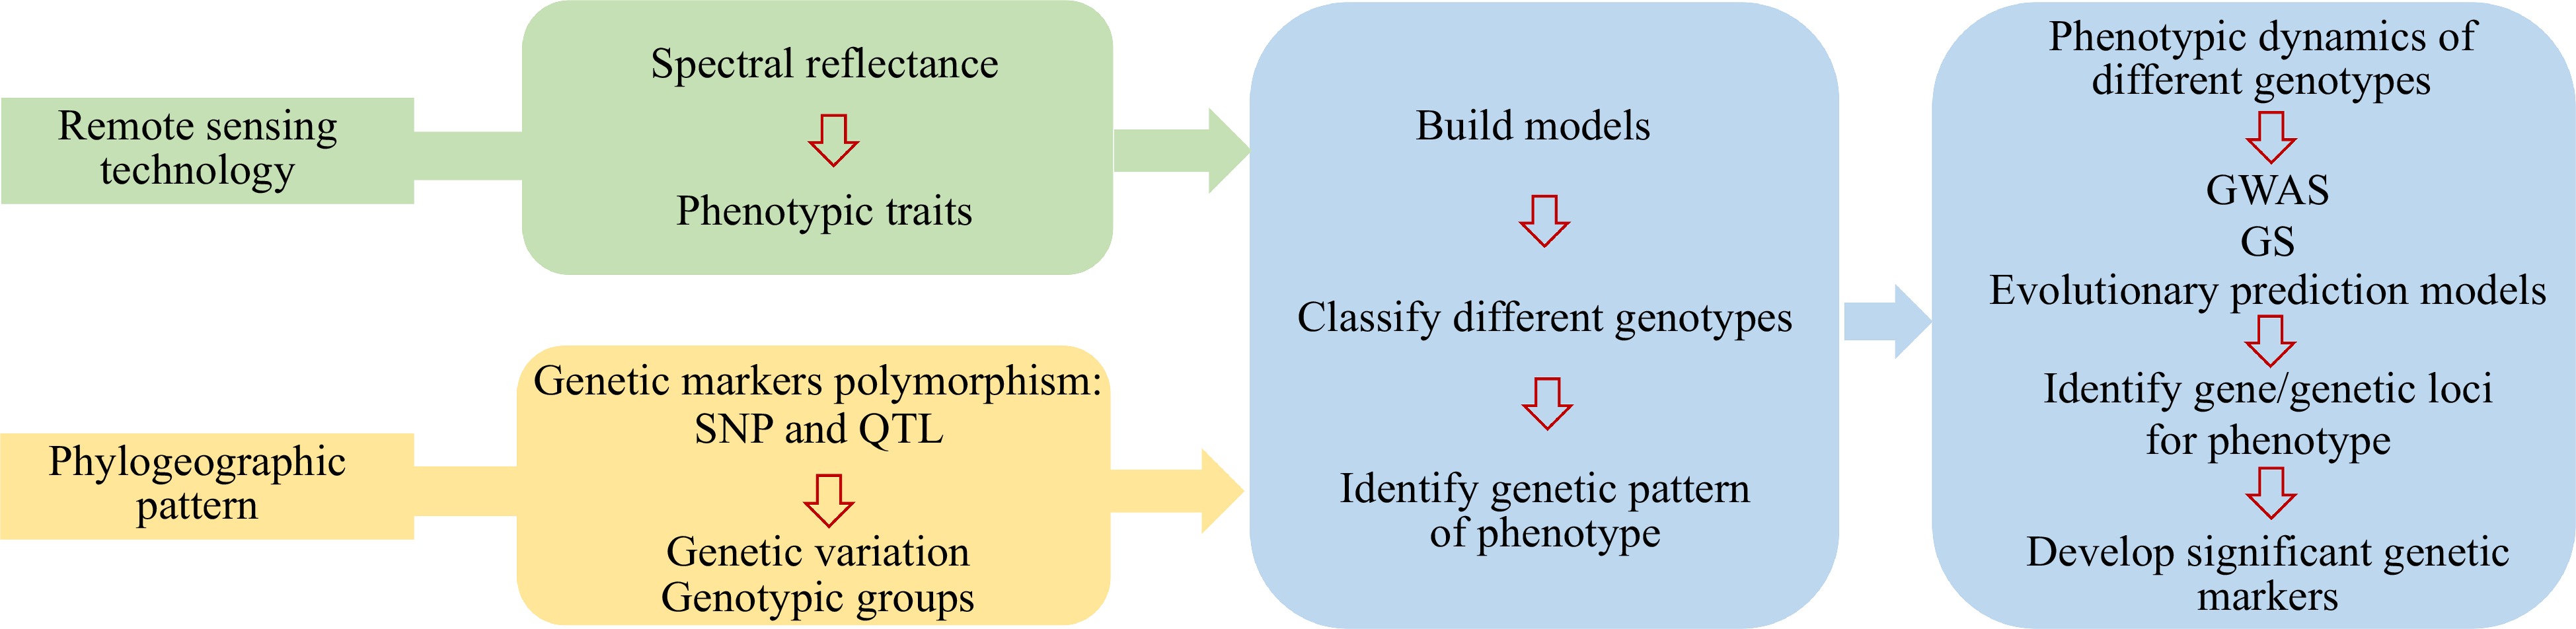
Figure 3.
Flowchart illustrating the combination of remote sensing and phylogeography to study the genetic patterns.
-
Spectral data Applications related to phylogeographic relationship Platforms Sensors Spatial resolution Bands Extracted features Methods Accuracy and references Spectral variation related to genetic variation Assessing genetic variation using variation in spectral patterns Satellite Landsat 5 TM USGS/ESPA 30 m Blue
(0.45−0.52 mm);
Green
(0.52−0.60 mm);
Red
(0.63−0.69 mm);
Near Infrared
(NIR)
(0.76−0.90 mm); Shortwave Infrared
(SWIR1)
(1.55−1.75 mm); Thermal (10.40−12.50 mm); Shortwave Infrared (SWIR2)
(2.08−2.3 mm)Normalized difference vegetation index
(NDVI); Normalized difference moisture index (NDMI)Linear mixed effects model with the maximum-likelihood population effects (MLPE) parameterization [21] ER-2 platform NASA airborne visible/infrared imaging spectrometer (AVIRIS) 8 m 414−2,447 nm NDVI; Water band
index (WBI)Partial least-squares discriminant analysis (PLSDA); Canonical correlation analyses (CCAs); Discriminant analyses; Linear-mixed models (GLMMs) Kappa = 0.85−0.89[22] Automated tram Portable field spectrometer (SVC HR-1024i; Spectra Vista); Imaging spectrometer
(E Series; Headwall Photonics)30 cm 340−2,500 nm Leaf spectral
reflectancePartial least squares regression (PLSR); Mantel tests; D(TM) calculates; Linear regression models [11] Airborne Airborne imaging spectrometer (AIS); Field spectroradiometer (ASD FieldSpec 4, Boulder, CO, USA) 2 m 372−2,540 nm Spectral reflectance Partial least squares (PLS) regression; PRESS statistic RMSE = 0.2897[23] Ground USB4000 portable equipment; Bruker FT-NIR MPA II (12,489−3,996 cm−1); Portable thermo fisher MicroPHAZIR 0.2 nm;
16 cm−1;
16 cm−1400−1,037 nm; 12,489−3,996 cm−1;
1,595−2,396 nmSpectral reflectance Principal component analysis and soft independent modeling of class analogy (SIMCA) Classification accuracy of 88%−91%[24] hyperspectral imaging
system (HIS)30 cm 400−1,000 nm Leaf spectral
reflectanceParSketch-PLSDA method Ranging from 81% to 96% for precision[25] ASD 350−2,500 nm Leaf spectral
reflectancePartial least squares-discriminant analysis
(PLS-DA); PCAKappa = 0.34 and 0.61[10] Classifying genotypic differentiation using spectrally derived traits UAV RGB or near-infrared, green and blue (NIR-GB) camera 40 m Near-infrared, green and blue PHUAV for each plot
from the DSM dataGenomic prediction modeling r = 0.448 − 0.634[26] Ground ASD 350−2,500 nm Foliar traits PLSR RMSE = 9.1%
− 19.4%[27]LiDAR Canopy height/
structureFine-scale digital
elevation models (DEMs)Predicted phenotypes
related to genetic
patternEstimating the phenotypic
dynamics under
genetic patternUAV 12-megapixel DJI FC300X camera;24-megapixel Sony a6000 RGB camera Altitude of 25 and 120 m Red-green-blue (RGB) bands Canopy height metrics from the DSM data Mixed linear models utilizing residual maximum likelihood (REML); Three-parameter Weibull sigmoid growth model R2 > 99%; RMSE < 4 cm[28] The compact LIFT instrument Blue light-emitting diode (LED); STS-VIS spectrometer (Ocean Optics, Florida, USA); RGB cameras 0.46 nm 445 nm;
400−800 nmFluorescence Data; NDVI; Alternative NDVI (NDVI_II); Green normalized difference vegetation index (GNDVI); MERIS terrestrial chlorophyll index (MTCI); Photochemical reflectance index (PRI) Least absolute shrinkage and selection operator (Lasso) regression; Linear modeling r = 0.7 − 0.92[29] Identifying the
genetic base of
adaptive phenotypic
traitsUAV high-throughput phenotypic platforms (UAV-HTPPs) RGB or near-infrared, green, and blue (NIR-GB) camera 40−60 m Plant height; Canopy reflectance; Biomass Crop surface model; Ortho mosaics model Accuracy for DSM was 2.31 cm/pixel[30] UAV and tractor Multi-spectral camera; GreenSeeker spectral sensors 40−42 m for UAV; 1.32 m for tractor Green; Red; Red Edge; NIR; Blue NDVI GWAS; QTL R2 = 0.02 − 0.11[31] UAV RGB 18 m RGB bands Canopy cover; Canopy volume; and Excess greenness index. Plant Growth Models; Variance inflation factor (VIF); GWAS R2 = 0.87 − 0.94[32] Table 1.
Approaches adopted to integrating remote sensing and phylogeography.
-
Remote sensing platforms Advantages Disadvantages Sensors Measured traits Ground-based platforms High resolution; Not influenced by background for leaf measurement Require long measurement time; Restricted by field conditions and challenging environment Multispectral, hyperspectral sensors Pigment concentrations; Quality traits (eg., oil, amylose, protein content, moisture); Total plant/canopy biomass; Yield Thermal infrared cameras Leaf and canopy temperature UAVs Large spatial scales for canopy measurement Low data resolution VIS imaging systems Morphological traits (eg., shape, structure, color properties); Geometric traits (eg., length, area, canopy cover, canopy volume); Photosynthetic behaviors; Pigment concentrations Near infrared (NIR), short-wave
infrared (SWIR) cameraLeaf water content; Plant/canopy structure; Biomass Hyperspectral sensors Pigment concentrations; Quality traits (eg., oil, amylose, protein content, moisture); Total plant/canopy biomass; Yield LiDAR Plant structure (eg., crown density, structural complexity) Thermal infrared cameras Leaf and canopy temperature Satellites Large spatial scales across
landscapes and regionsCoarser spectral resolution; Lower spatial resolution; Susceptible to
cloud interferenceMultispectral, hyperspectral sensors Vegetation structural properties (eg., species richness) Table 2.
Advantages and disadvantages of remote sensing technologies in measuring plant traits.
Figures
(3)
Tables
(2)