-
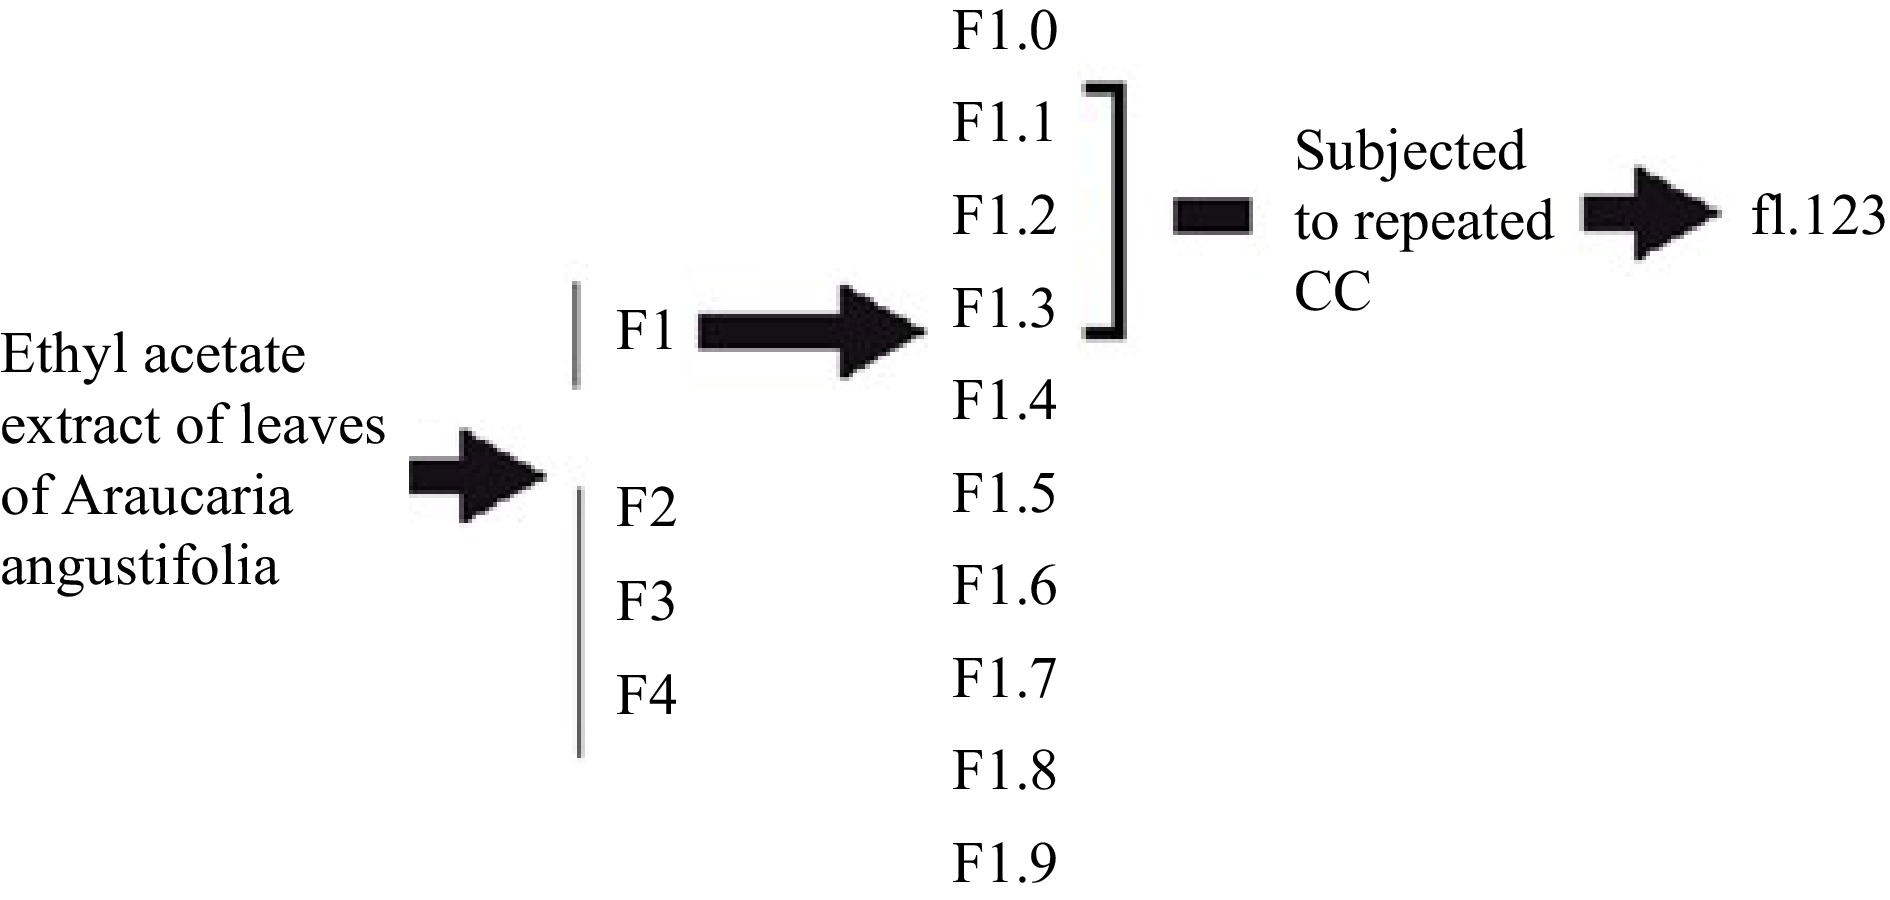
Figure 1.
Scheme of fraction production (f1.123) by chromatography on a silica gel column.
-
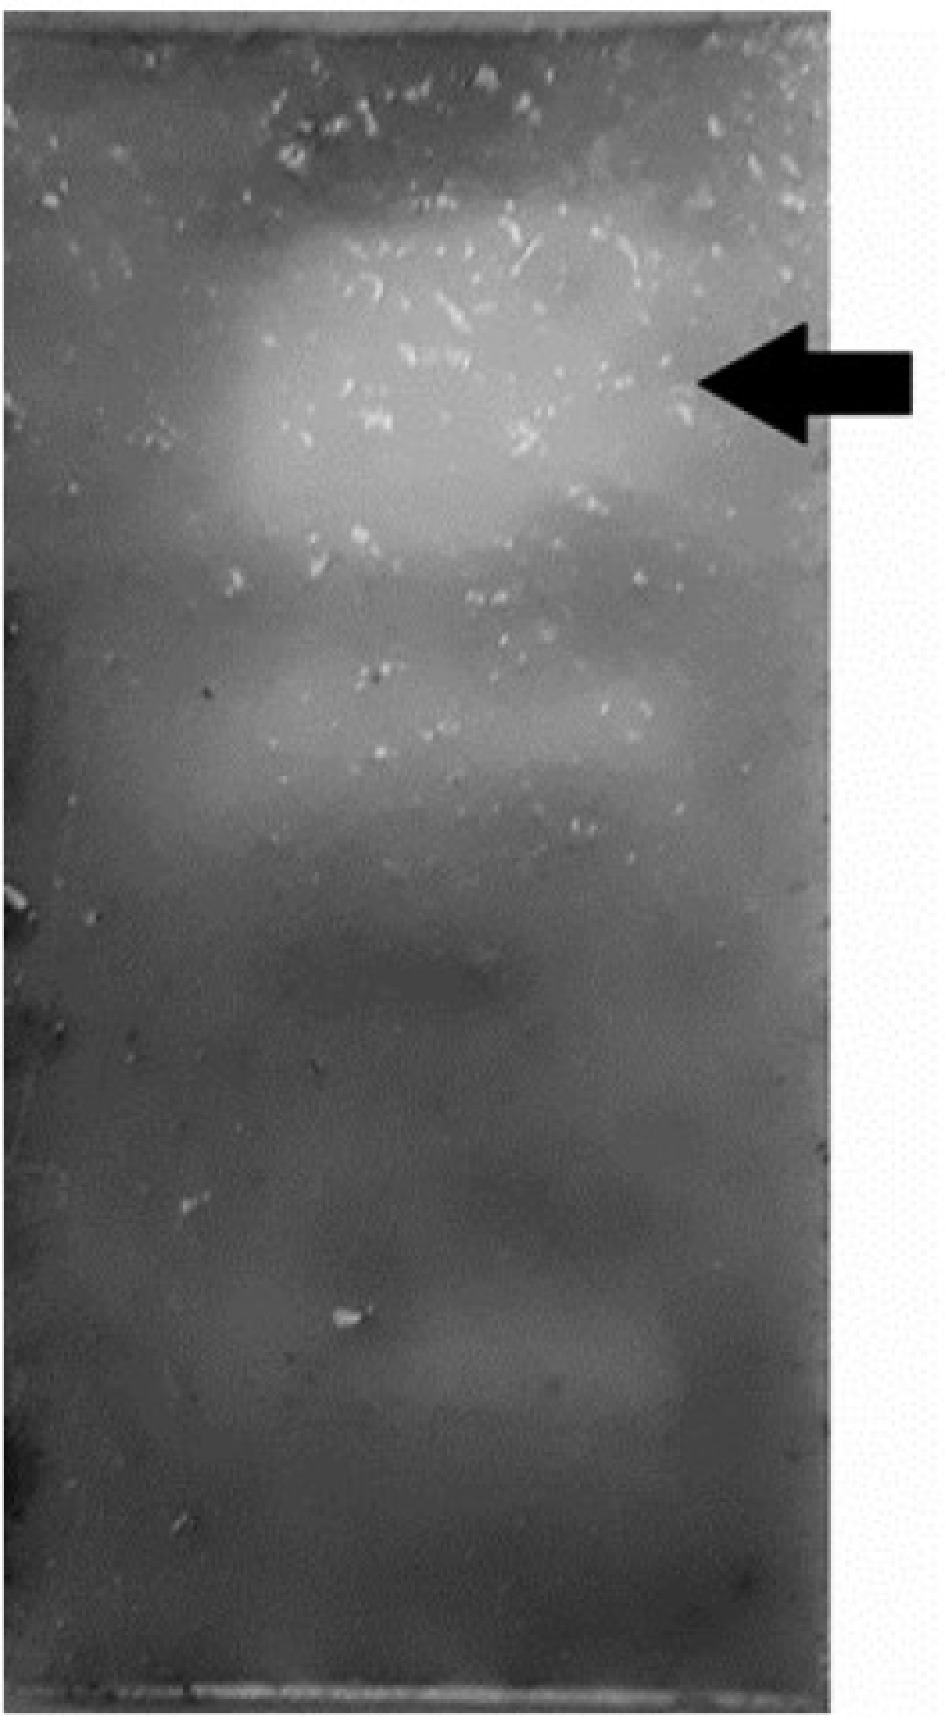
Figure 1.
Antifungal activity of ethyl acetate leaves extract of A. angustifolia against S. glycines. Arrow indicates the inhibition zone.
-
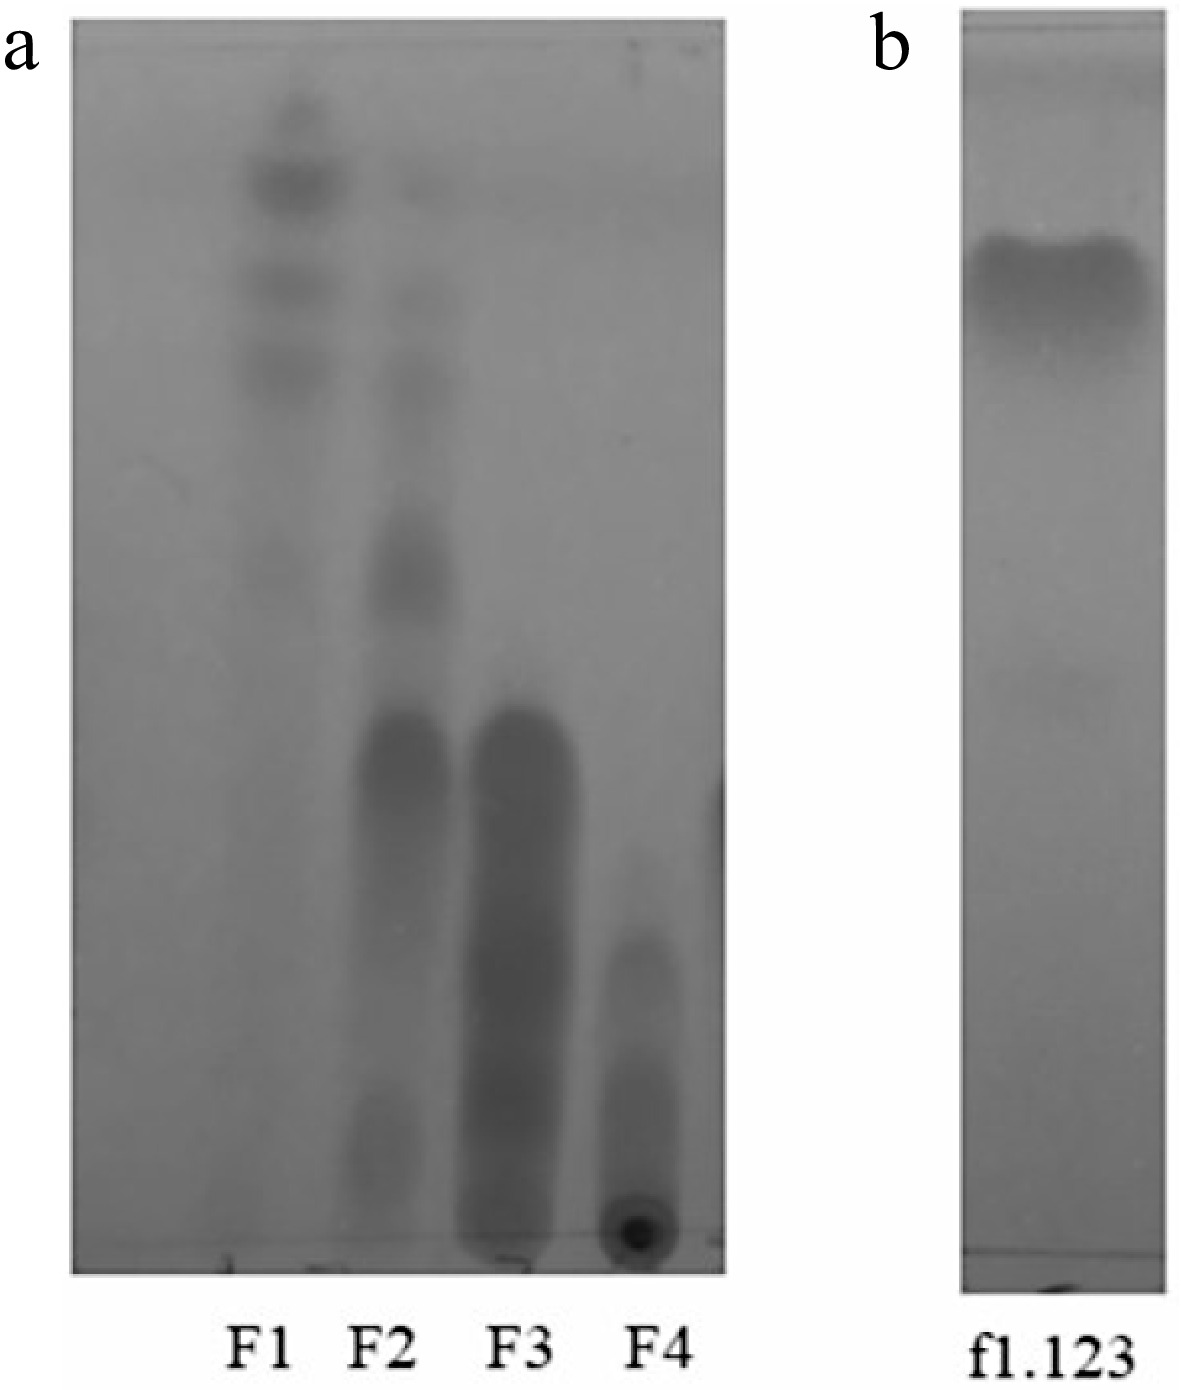
Figure 2.
TLC of fractions viewed under UV light of 254 nm. (a) F1, F2, F3, and F4. (b) f1.123.
-

Figure 3.
Chromatogram of f1.123, obtained by HPLC–PDA.
-

Figure 4.
Gas chromatogram of f1.123 fraction.
-

Figure 5.
Mass spectra analysis of (a) compound 1 and (b) 2.
Figures
(6)
Tables
(0)