-
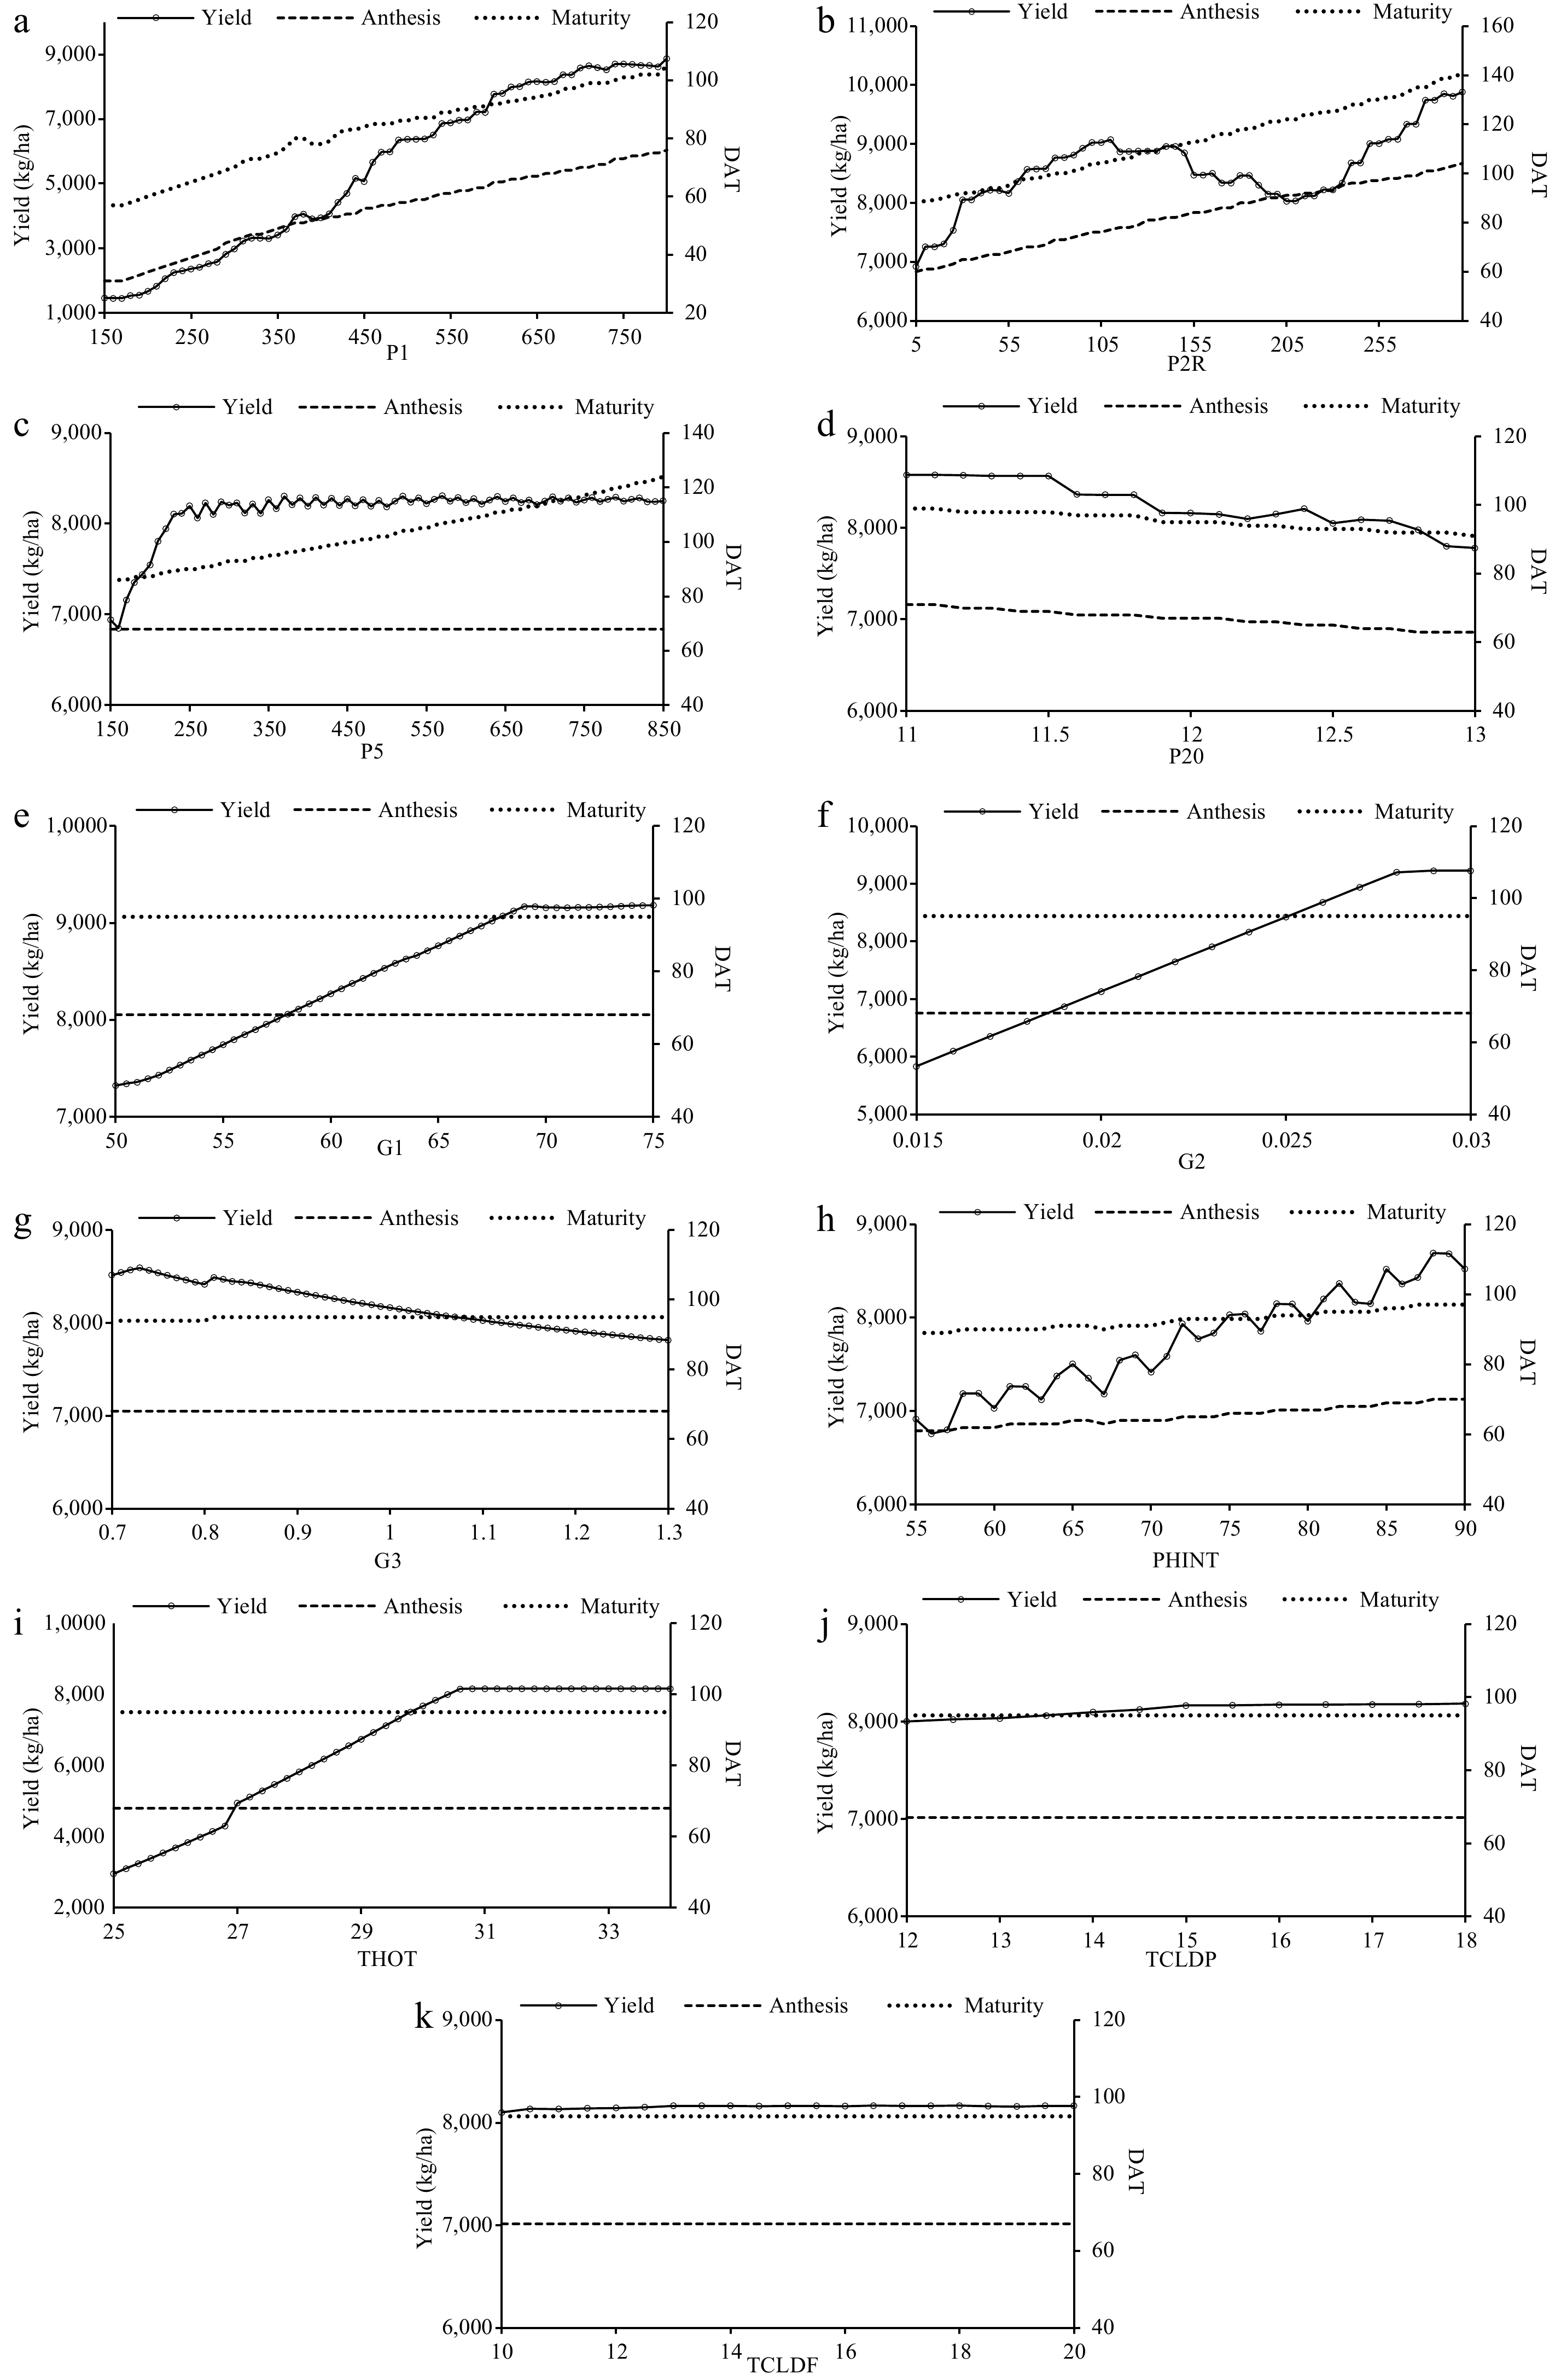
Figure 1.
Variations in grain yield (kg·ha−1), anthesis and maturity (DAT) of PR 126 to changes in cultivar specific parameters. (a) P1, (b) P2R, (c) P5, (d) P20, (e) G1, (f) G2, (g) G3, (h) PHINT, (i) THOT, (j) TCLDP, and (k) TCLDF.
-
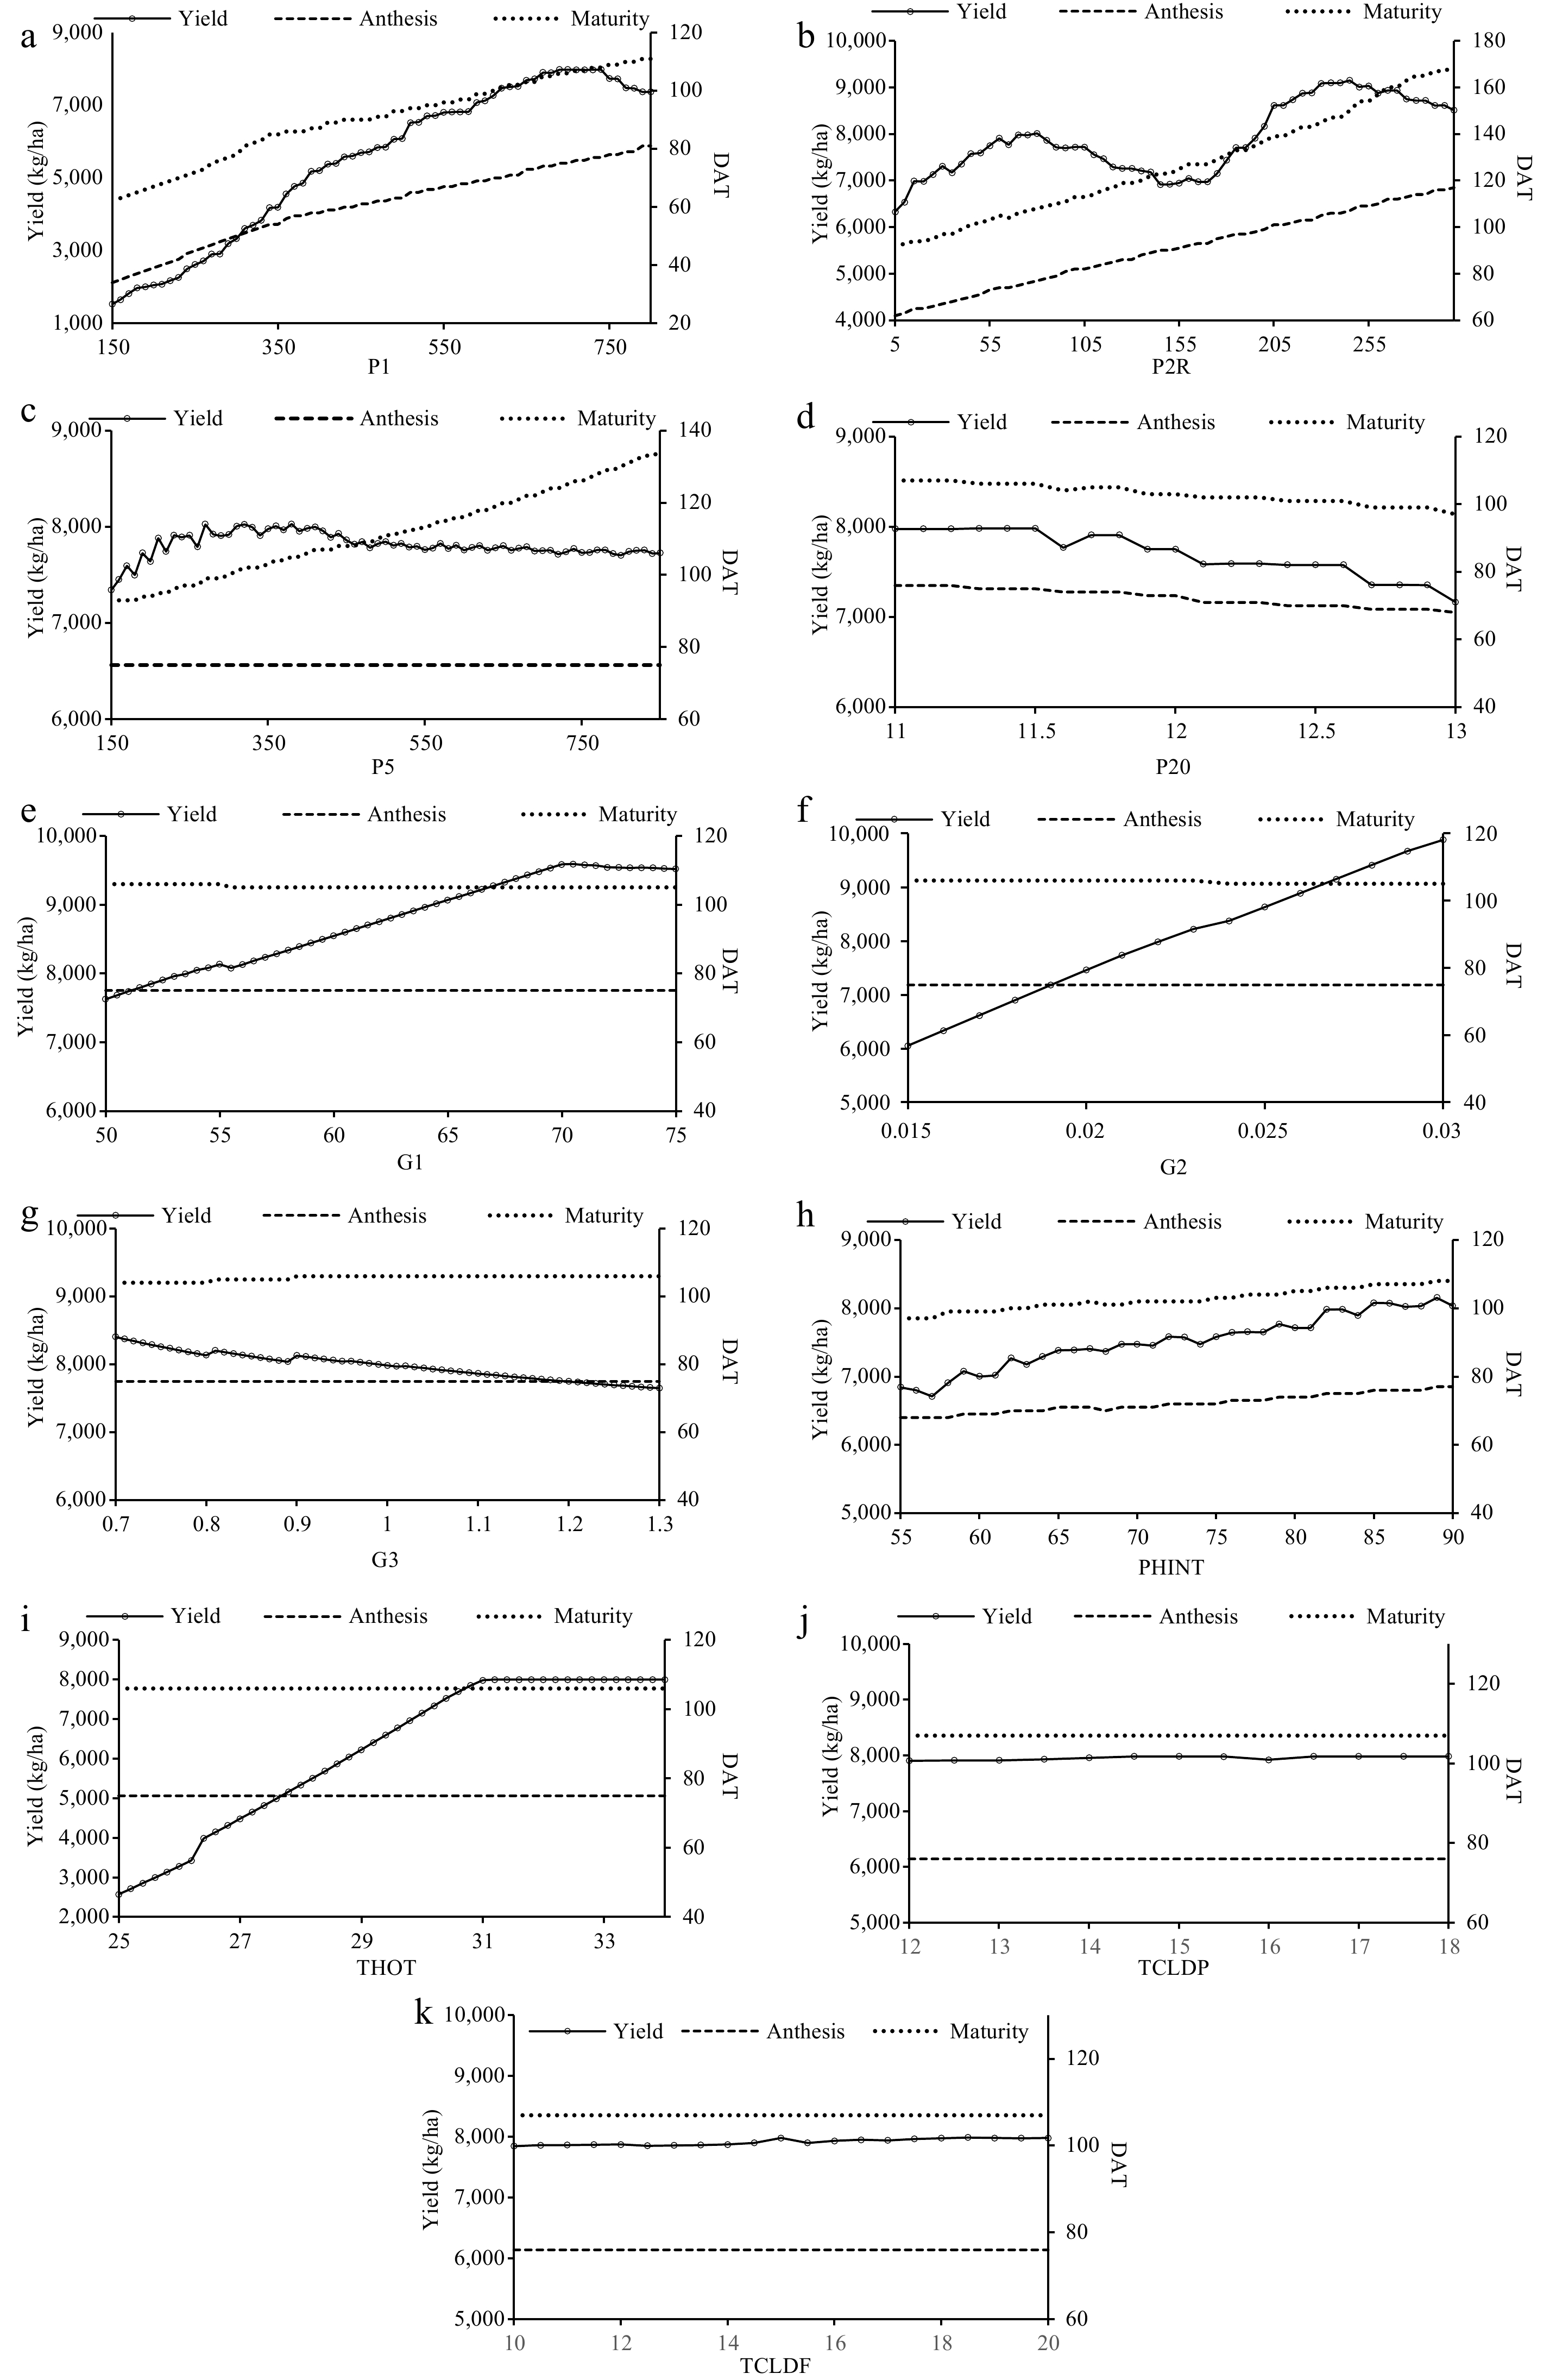
Figure 2.
Variations in grain yield (kg·ha−1), anthesis and maturity (DAT) of PR 127 to changes in cultivar specific parameters. (a) P1, (b) P2R, (c) P5, (d) P20, (e) G1, (f) G2, (g) G3, (h) PHINT, (i) THOT, (j) TCLDP, and (k) TCLDF.
-
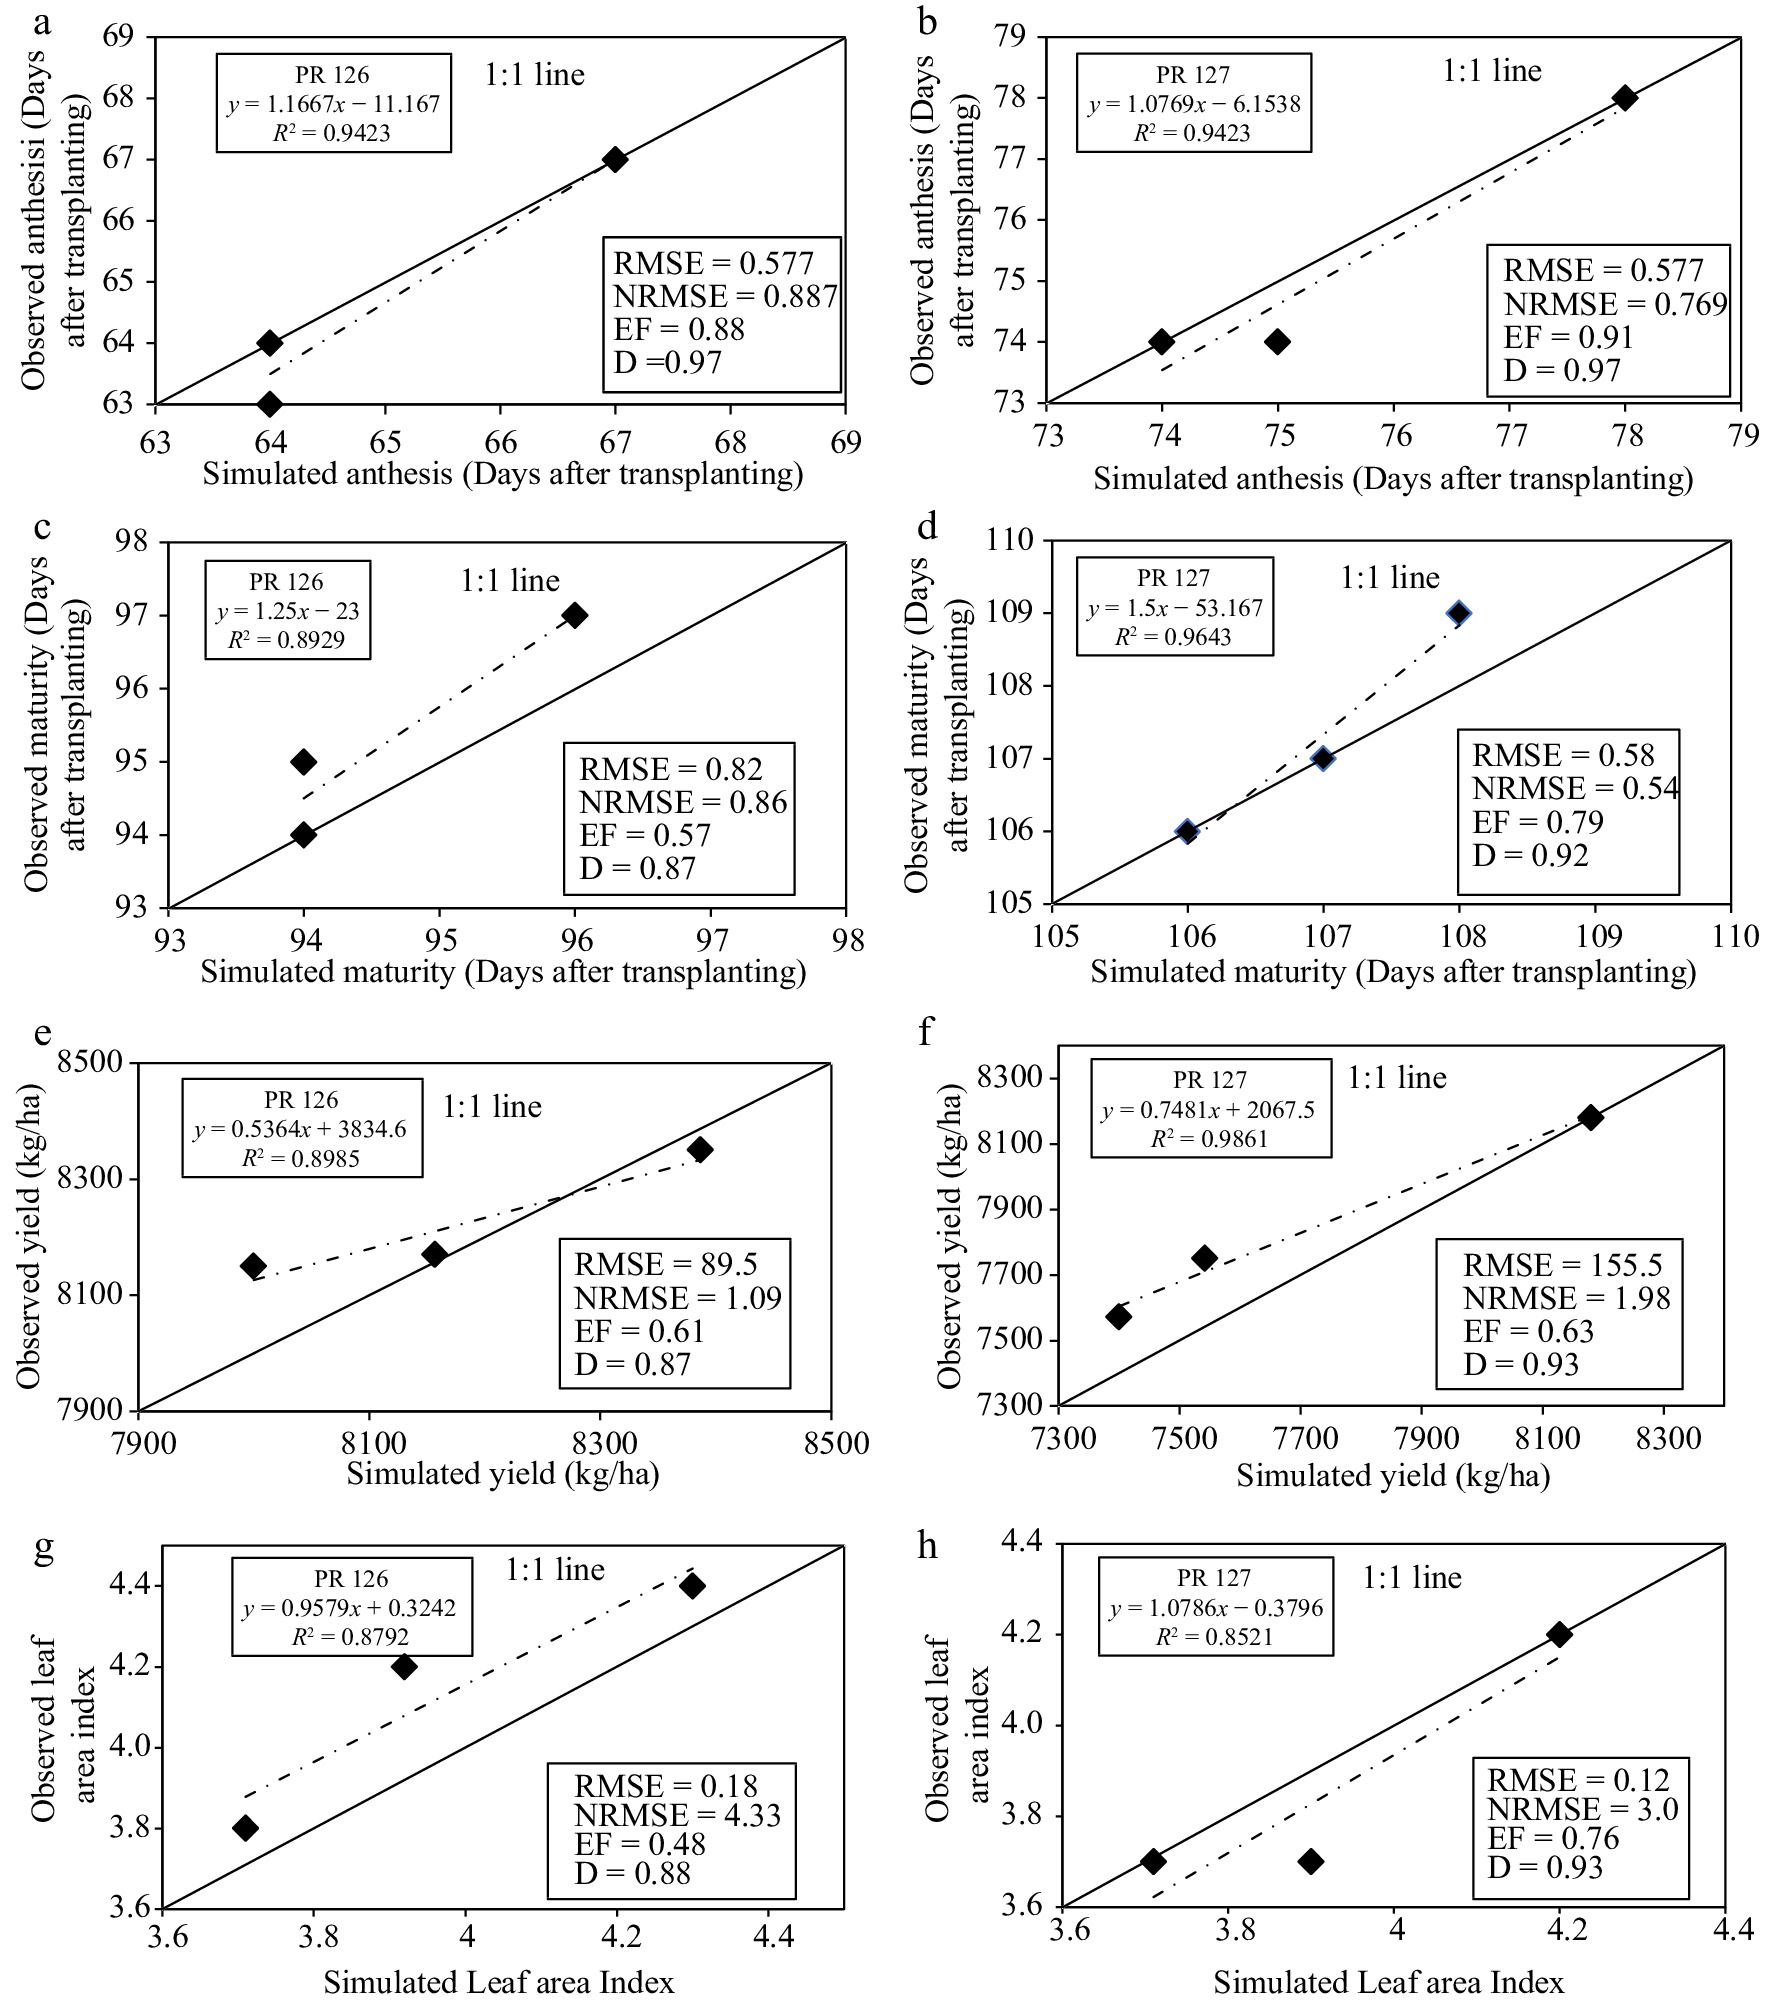
Figure 3.
Evaluation results for (a), (b) anthesis, (c), (d) maturity, (e), (f) grain yield and (g), (h) LAI of rice cultivars
-
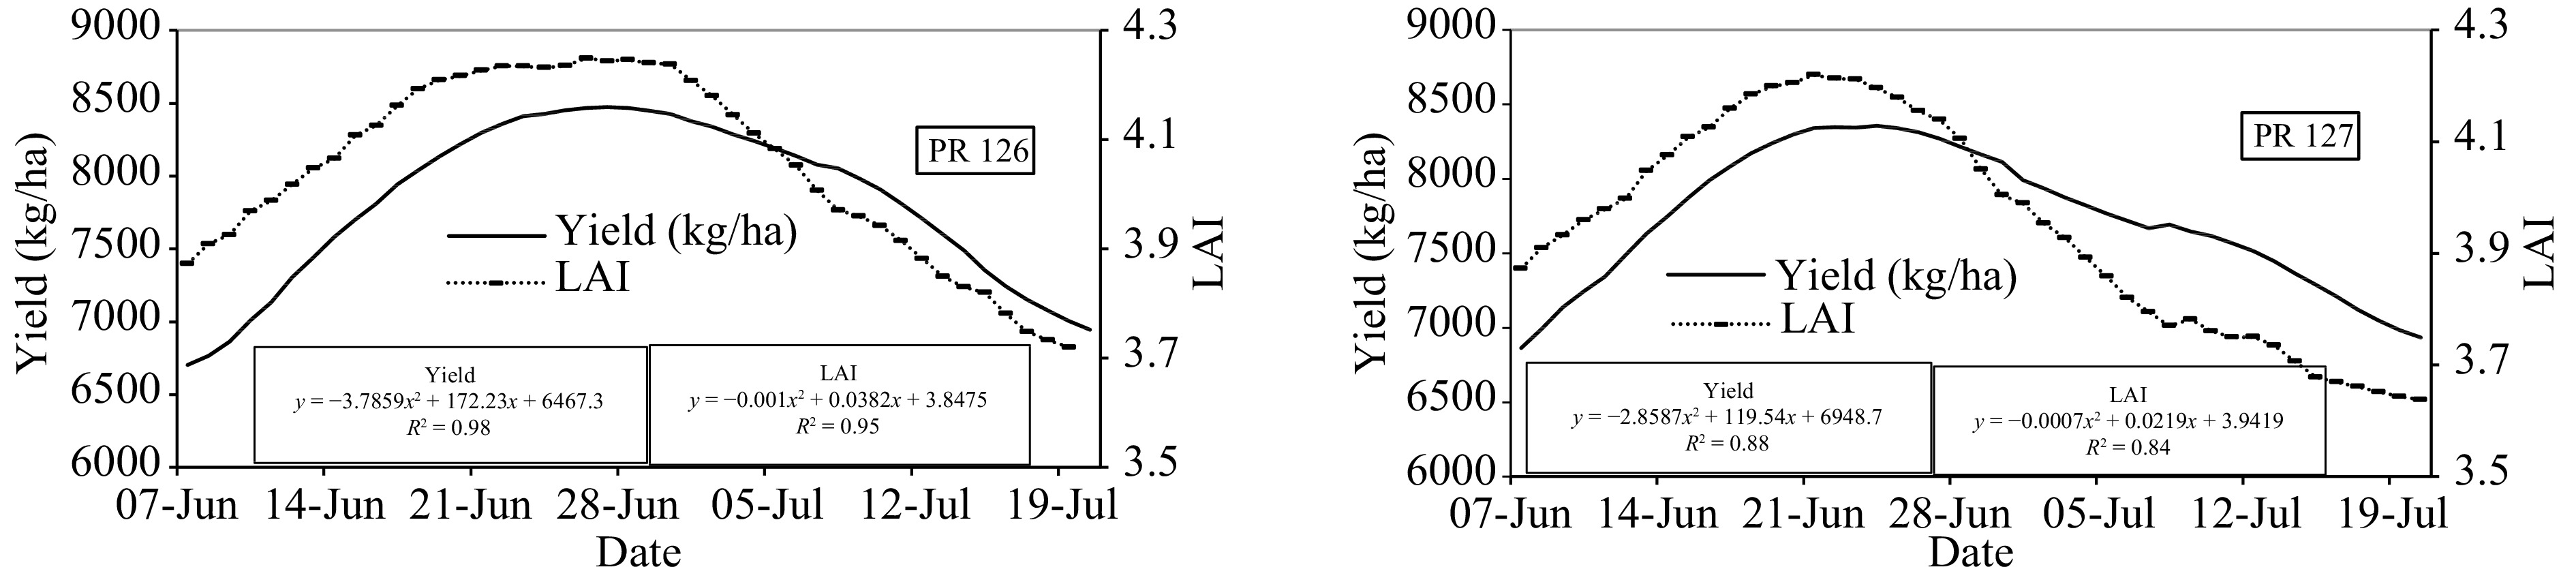
Figure 4.
Grain yield and Leaf Area Index (LAI) (7-d moving average) relation with the transplanting window for rice cultivars PR 126 and PR 127.
-
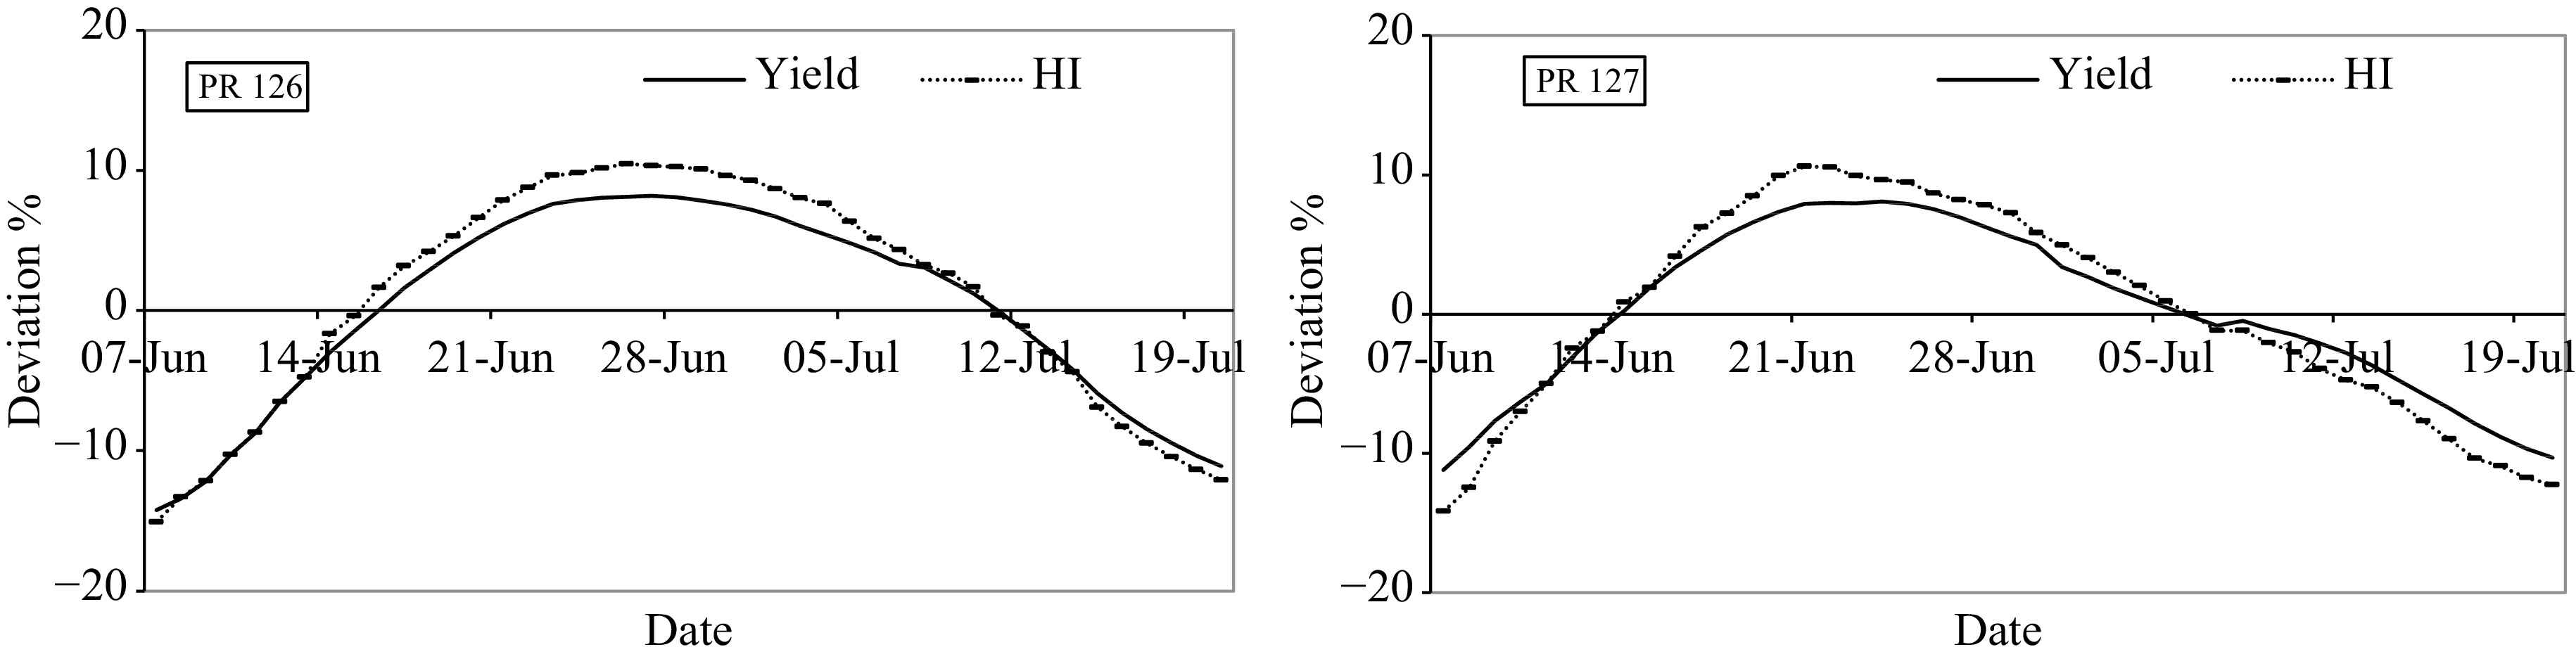
Figure 5.
Grain yield and harvest index (HI) relation with the sowing window for PR 126 and PR 127.
-
Genetic coefficients Definition Range P1 Thermal time during basic vegetative phase of the plant (expressed as growing degree days [GDD] above a base temperature of 9 °C). 150−800 °C -d P20 Photoperiod (longest day length, hours) at which the rate of development is maximum. At higher values than P2O, the developmental rate is slowed. 11−13 h P2R Extent of delay in panicle initiation for each hour increase in photoperiod above P2O. 5−300 °C -d P5 Thermal time (in GDD) with a base temperature of 9oC from beginning of grain filling to physiological maturity. 150−850 °C -d G1 Potential spikelet number coefficient at anthesis. 50−75 #/g G2 Single grain weight (g) under ideal growing conditions. 0.015−0.030 g G3 Tillering coefficient (scalar value) relative to IR64 cultivar. 0.7−1.3 PHINT Phyllochron Interval (°C -d), thermal tme interval (in GDD) between each leaf-tip appearance under no stress conditions. 55−90 °C -d THOT Temperature (°C), at temperature higher than this the spikelet sterility is affected. 25−34 °C TCLDP Temperature (°C), at temperature lower than this the panicle initiation is further delayed (other than P1, P2O and P2R). 12−18 °C TCLDF Temperature (°C) at temperature lower than this the spikelet sterility is affected. 10−20 °C Table 1.
Cultivar Specific Parameters (CSPs) for CERES-Rice model.
-
CSPs PR 126 PR 127 Range Anthesis Maturity Grain yield Anthesis Maturity Grain yield P1 0.61 0.43 1 0.6 0.42 0.95 150−800 P2R 0.33 0.28 0.18 0.32 0.31 0.15 5−300 P20 0.71 0.5 0.58 0.69 0.61 0.66 11−13 P5 0 0.25 0.12 0 0.26 0.036 150−850 G1 0 0 0.56 0 0 0.55 50−75 G2 0 0 0.68 0 0 0.73 0.015−0.030 G3 0 0.015 0.14 0 0.03 0.18 0.7−1.3 PHINT 0.28 0.17 0.43 0.25 0.22 0.33 50−90 THOT 0 0 3.4 0 0 3.3 28−34 TCLDP 0 0 0.025 0 0 0.024 12−18 TCLDF 0 0 0.016 0 0 0.028 10−20 Table 2.
Range and sensitivity index (SI) for phenology and yield and the range considered for the cultivar specific parameters (CSPs) for rice cultivars (PR 126 and PR 127).
-
Cultivars Cultivar specific coefficients P1 P2R P5 P20 G1 G2 G3 PHINT THOT TCLDP TCLDF PR 126 670.0 55.0 360.0 12.0 59.0 0.024 1.00 83.0 31.0 15.0 15.0 PR 127 700.0 70.0 400.0 11.3 53.4 0.022 1.00 83.0 31.0 15.0 15.0 Table 3.
Cultivar specific parameters used in calibration for rice cultivars.
-
Parameters PR 126 PR 127 Observed Simulated Observed Simulated Days taken for anthesis Mean days after transplanting (DAT) 65 65 75 76 Ratio 1.01 1.00 SD 1.70 1.41 1.9 1.7 R2 0.94 0.94 RMSE 0.58 0.58 d-stat 0.97 0.97 NRMSE (%) 0.89 0.77 Model efficiency 0.88 0.91 Days taken for maturity Mean days after transplanting (DAT) 95 95 107 107 Ratio 0.99 1.00 SD 1.25 0.94 1.247 0.816 R2 0.89 0.96 RMSE 0.82 0.58 d-stat 0.87 0.92 NRMSE (%) 0.86 0.54 Model efficiency 0.57 0.79 Grain yield Mean yield (kg·ha−1) 8,223 8,181 7,834 7,707 Ratio 1.0 0.98 SD 89.9 158.9 255.57 339.22 R2 0.89 0.98 RMSE 89.5 155.5 d-stat 0.87 0.93 NRMSE (%) 1.09 1.98 Model efficiency 0.61 0.63 Leaf area index (LAI) Mean LAI 4.13 3.98 3.87 3.94 Ratio 0.96 1.02 SD 0.25 0.24 0.24 0.20 R2 0.87 0.89 RMSE 0.18 0.12 d-stat 0.88 0.93 NRMSE (%) 4.33 3.00 Model efficiency 0.48 0.76 Table 4.
Statistical measures for evaluation of CERES-Rice v4.7.5 simulation performance
Figures
(5)
Tables
(4)