


-
Rice (Oryza sativa) is the most important staple food and one of the oldest edible cereal crops in the world. Asia alone contributes 90% of total global production of rice[1]. According to the USDA[2], rice occupied 162.48 million hectares of area on a global basis during 2018−2019 and total production was approximately 500 million metric tonnes where India contributed nearly 24% of worldwide production. Rice is an important kharif crop of India which is grown over an area of approximately 45.0 million hectares[3]. Punjab is recognized as food crop granary of India for large scale intensive agricultural system[4] and it is the second largest state in the country in terms of rice production[5] and its cultivation has increased by 167.5% or at 3.5% per year during the period 1970 to 2017[6]. During 2020−2021, rice occupied approximately 32 lakh hectares area in Punjab[7]. Rice is grown extensively in the agro-climatic zones of undulating plains, the central plains and the eastern parts of the western zones in Punjab. A temperature range of 20 to 37.5 °C is favorable for its optimum growth and development. Loamy soils with low permeability having a pH range 5 to 9 are found to be the best for rice cultivation. Rice is a semi-aquatic crop whose growth is best facilitated under submerged conditions. Under transplanted conditions, it is recommended to sow rice seed in a nursery bed between 20th May and 5th June and transplantation is done after 25−30 d in case of short-duration varieties and 30−35 d for long-duration varieties[7]. Rice production is greatly affected by agronomic practices like selection of cultivar, planting density, transplanting date, fertilizer management, irrigation application, etc.[8]. Rice is the only crop to survive waterlogging in anaerobic conditions and one of the major cereal crops of the entire world. But global warming and climate change have put its production potential at major risk.
Climate change, being the most important issue in the modern world, has placed biological and environmental subsistence at peril[9] by threatening food security. On the basis of CMIP5 models two major rice production hubs of India (Punjab and Uttar Pradesh) would witness a rise in mean temperature by 2 and 3 °C by 2050 and 2080, respectively[10]. Such an increase in mean temperature can have an adverse impact on rice production. In the case of rice, if temperatures rise above 35 °C at the flowering stage then spikelet sterility is induced and productivity is affected[11]. According to Gupta & Mishra[12] due to climate change, the yield of rice in India could vary in the 2020s, 2050s, and 2080s by 1.2%−8.8%, 0.7%−12.6%, and 2.9%−17.8%, respectively. Therefore, there is an increasing need to gauge the effect of climate change on future agricultural production systems to take necessary adaptation measures. Reducing the yield gap might be an option to address the issue of productivity improvement under changing climatic scenarios[13]. Although, scientists around the world have become successful in assessing the impact of changing weather parameters such as temperature and levels of CO2 on crop growth and development under a controlled environment[14], but the expensive setup and procedures prevent its adoption in developing countries. Projected climatic data coupled with crop simulation models are nowadays widely advocated for studying the impacts of climate change on crop productivity and for crop-level adaptations. They facilitate decision-making by quantifying and analyzing production risk using historical series of climate data and soil properties[15]. There are several Decision Support Systems (DSSs) in the form of computer software programs that make use of models and other information to make site-specific recommendations for betterment in agriculture production[16]. The DSSAT (Decision Support System for Agro Technology Transfer) is one such DSS which consists of widely used models that have been used in ~100 countries for more than 20 years[17]. In the DSSAT package, the Cropping System Model named the Crop Environment Resource Synthesis-Rice (CSM-CERES-Rice), is a decision-supporting tool that helps to understand and foresee the effect of discrete factors and complex interactions that have a major influence upon the growth and development of rice[18].
The truthfulness of a model and its simulation result depends upon how precisely calibration and validation are carried out. The calibration of a model is an important step wherein the model parameters are adjusted to bring closeness between model output and real-world observations[19]. Daggupati et al.[20] also highlighted the importance of model calibration to increase model accuracy to decrease the uncertainty in the output of the model. The validation of a model is another important step to assess the performance of the model and it involves a comparison between observed and simulated data i.e. output generated by the model[21].
In India the CERES-Rice model has been widely calibrated and validated to be used as a a research and agronomic tool[22]. Vijaylaxmi et al.[23] used the CERES-Rice model with an accuracy for NRMSE of 3% for heading and physiological maturity; 14% for biomass yield and 12% for grain yield for use in diverse agro-environments in Telangana state, India. The model was further used to evaluate various agronomic management practices for transplanted rice. Similarly, Chandravanshi et al.[24] reported good agreement between simulated and observed grain yield, anthesis, maturity and LAI of rice cultivar (Khadagiri) with RMSE value of 0.35 kg·ha−1, 0.96, 0.65, and 0.38, respectively in Madhya Pradesh state of India. Rajwade et al.[25] used the CERES-Rice model to determine the effects of methods of irrigation on the adaptation capacity of rice to climate change in the West Bengal state of India. They reported a good agreement between the predicted and observed data on the above-ground biomass with the d-index and NRMSE values of 0.99 and 0.13, respectively during the calibration of the model and 0.96 and 0.24, respectively during the validation of the model. As per Debnath et al.[13] the model showed good accuracy when calibrated and validated using the field experimental data for IR36 and Shankar cultivars in West Bengal, India. The NRMSE, R2, and D-index values of model performance were found to be 17.9%, 0.87%, and 0.97%, respectively, for the IR36, whereas it was 14.3%, 0.90%, and 0.98%, respectively, for the Shankar cultivar. These results revealed that the model could be further used for different purposes ranging from climate change impact assessment studies to the evaluation of agronomic management strategies.
The present study was conducted with two main objectives. The first was to determine the genetic coefficients of commonly cultivated cultivars PR 126 and PR 127 of rice in Punjab state. The second objective was to use the validated model for optimizing the transplanting window of these commonly cultivated cultivars in Indian Punjab so that these windows could be used as an adaptive tool for rice cultivation under the ensuing climate change prediction scenarios.
-
The study was conducted at Punjab Agricultural University (PAU), Ludhiana, Punjab for two commonly sown cultivars of rice i.e., PR 126 (short duration) and PR 127 (long duration). Ludhiana is located at latitude and longitude of 30°54' N and 75°48' E, respectively, with an altitude of 247 m above mean sea level, it is located in the central plain region of Indian Punjab under the Trans-Gangetic agroclimatic zone of India. Rice seedlings of both cultivars were transplanted after 30 d of nursery planting in the main field on four different dates (17th June, 24th June, 1st July, and 8th July) in 2020 based on the recommended package of practices of Punjab Agricultural University (PAU) Ludhiana. The actual data needed for creating different files in DSSAT v4.7.5 viz.: crop management file, weather file, experimental data file, and soil file was extracted according to the necessity of the model. The CERES-Rice model was used for simulation which uses 11 different cultivar-specific parameters (CSPs) to determine the growth and development of particular crop varieties (Table 1).
Table 1. Cultivar Specific Parameters (CSPs) for CERES-Rice model.
Genetic coefficients Definition Range P1 Thermal time during basic vegetative phase of the plant (expressed as growing degree days [GDD] above a base temperature of 9 °C). 150−800 °C -d P20 Photoperiod (longest day length, hours) at which the rate of development is maximum. At higher values than P2O, the developmental rate is slowed. 11−13 h P2R Extent of delay in panicle initiation for each hour increase in photoperiod above P2O. 5−300 °C -d P5 Thermal time (in GDD) with a base temperature of 9oC from beginning of grain filling to physiological maturity. 150−850 °C -d G1 Potential spikelet number coefficient at anthesis. 50−75 #/g G2 Single grain weight (g) under ideal growing conditions. 0.015−0.030 g G3 Tillering coefficient (scalar value) relative to IR64 cultivar. 0.7−1.3 PHINT Phyllochron Interval (°C -d), thermal tme interval (in GDD) between each leaf-tip appearance under no stress conditions. 55−90 °C -d THOT Temperature (°C), at temperature higher than this the spikelet sterility is affected. 25−34 °C TCLDP Temperature (°C), at temperature lower than this the panicle initiation is further delayed (other than P1, P2O and P2R). 12−18 °C TCLDF Temperature (°C) at temperature lower than this the spikelet sterility is affected. 10−20 °C Sensitizing the genetic coefficients ofthe model
-
Sensitivity analysis is a process that helps us to understand how much the output of a particular crop model is sensitive concerning the different parameters of the model which are subject to uncertainty[26]. It helps to identify parameters that have a greater effect on phenology and yield of crop variety. For this study, the sensitivity analysis was done by calculating the sensitivity index (Eqn 1) based on the equation given by Lamsal et al.[27]. So in the present study firstly the CERES-Rice model was sensitized for 11 genetic coefficients before calibrating and validating it.
$\rm SI = ((O_{2} - O_{1})/O_{avg})/((I_{2} - I_{1})/I_{avg}) $ (1) Where I1, I2, and Iavg are the minimum, maximum, and average input values of Cultivar Specific Parameters (CSPs) while O2, O1, and Oavg are model simulated values of crop parameters under study. The sensitivity index (SI) is a scientific approach to determine the importance of a parameter impacting the model output (yield, growth, duration, etc.). The range considered for calculating the sensitivity index (SI) of cultivar-specific parameters for both rice cultivars was taken the same as those mentioned in the 'RICER047.CUL' file. The DSSAT sensitivity analysis version 4.7.5.0 was used to generate the output data on anthesis, maturity, and yield for each unit increase in the coefficient of respective CSPs. On the other hand, a graphical approach was also used for quick visual interpretation of the most sensitive parameters, based on linearity in the graph drawn between input data and their respective outputs.
Calibration and validation of the model
-
The GENCALC software which is inbuilt in the DSSAT package was used to calibrate the model for both of the rice cultivars PR 126 and PR 127. The calibration was done using the 24th June transplantation for both cultivars. Further, the genetic coefficients were adjusted by repeated iteration for more precision that could give lower RMSE values indicating accurate simulation. Multiple iterations were carried out to generate genetic coefficients which provided a good match between simulated and observed results.
The calibration process was followed by the validation to check the accuracy of model simulations. The observed data from the transplantings done on 17th June, 1st, and 8th July on anthesis, physiological maturity, grain yield, and leaf area index (LAI) were compared with simulated values. Different statistical indices were used to evaluate the performance of the model. The coefficient of determination, i.e. R2 (Eqn 2) represents a good fit if the value is near to 1. The Root Mean Square Error, i.e. RMSE (Eqn 3) depicts the spread of residuals and its lower value represents the accuracy of the model. The d-stat is an index of agreement (Eqn 5) that covers both the biasness and the variability in the model simultaneously and it has better 1:1 prediction than R2[28]. Hence, if its value is near to 1, then it is considered to be excellent. The Normalized Root Mean Square Error (NRMSE) (Eqn 4) is another important statistical measure and its values < 10%, 10%−20%, 20%−30%, and > 30% indicate excellent, good, fair and poor fit between observed and simulated data[29]. The Nash-Sutcliffe model efficiency (EF) represents model efficiency (Eqn 6) and if its value is nearer to 1, then it means that the model is efficient[30]. The following are the formulas of various indices used in the current study:
${\rm R}^{2}= 1-\dfrac{\sum _{i=1}^{n}{({m}_{i}-{s}_{i})}^{2}}{\sum _{i=1}^{n}{({m}_{i}-\overline{m})}^{2}} $ (2) ${\rm RMSE}= \sqrt{\dfrac{\sum _{i=1}^{n}{({m}_{i}-{s}_{i})}^{2}}{n}} $ (3) $ {\rm NRMSE}= \dfrac{RMSE \times 100}{\overline{m}} $ (4) ${\rm d}{\text -}{\rm stat} = 1-\dfrac{\sum _{i=1}^{n}{({m}_{i}-{s}_{i})}^{2}}{\sum _{i=1}^{n}{(\left|{s}_{i}\right|+\left|{m}_{i}\right|)}^{2}} $ (5) ${\rm EF}= \dfrac{\sum _{i=1}^{n}{({m}_{i}-\overline{m})}^{2}-\sum _{i=1}^{n}{({s}_{i}-{m}_{i})}^{2}}{\sum _{i=1}^{n}{({m}_{i}-\overline{m})}^{2}} $ (6) $\rm Deviation\; in\; yield / HI =\dfrac{\rm Simulated\; yield / HI - Average\; yield / HI}{\rm Average\;yidle/HI} $ (7) Where, mi = measured value of the parameter; si = simulated value of the parameter; n = number of observations;
$ \overline{m} $ The EasyGrapher v4.7.5 software was used for representing evaluation results through 1:1-line graphs.
Optimizing the transplanting window for rice
-
The validated CERES-Rice model available in DSSAT v4.7.5 was used for simulating the transplanting window applicable for rice in Punjab i.e., 1st June to 20th July. The transplant age was kept as 30 days under the transplant tab in a crop management file, for simulating the yield of both the cultivars in all the transplanting dates assumed in the simulation. The temperature at the time of transplantation was changed for each date of planting according to the prevalent weather during the year 2020. The seven-day moving average was worked out to determine the best period of 7 days for transplanting these cultivars. The highest value of the grain yield in the seven days moving average was considered as the best time for transplanting.
-
The scientific approach was used to determine the sensitivity of days taken for anthesis and maturity as well as grain yield to the genetic coefficients (CSPs) of both the rice cultivars namely, PR 126 and PR 127 (Table 2). In the case of days taken for anthesis, P20 followed by P1, P2R, and PHINT were more sensitive for both the cultivars while P5, G1, G2, G3, THOT, TCLDP, and TCLDF were found insensitive. Similarly, for the days taken for physiological maturity, P20 followed by P1, P2R, P5, PHINT, and G3 were sensitive for both varieties of rice while other parameters were found insensitive for the same. Conversely, THOT was found to be highly sensitive for grain yield of both cultivars followed by P1, G2, P20, and G1 PHINT, while P2R, G3, and P5 remained less sensitive and TCLDP and TCLDF were almost insensitive. The genetic coefficients differ due to the genetic makeup of the variety and the location of the crop grown. Overall, in this study, yield was sensitized by THOT, P1, G2, P20, and G1 for both PR 126 and PR 127 while G1 and G2 were insensitive to anthesis and maturity. The sensitivity results for PR 126 and PR 127 are presented in Figs 1 & 2, respectively. It was found that there existed a linear relationship of days taken for anthesis and maturity with P20 and P1, respectively, while grain yield was found to be linearly related to THOT, P1, P20, and G2 for both PR 126 and PR 127 cultivars. This sensitization study of the model to CSPs (genetic coefficients) helped in the calibration and further validation of the model.
Table 2. Range and sensitivity index (SI) for phenology and yield and the range considered for the cultivar specific parameters (CSPs) for rice cultivars (PR 126 and PR 127).
CSPs PR 126 PR 127 Range Anthesis Maturity Grain yield Anthesis Maturity Grain yield P1 0.61 0.43 1 0.6 0.42 0.95 150−800 P2R 0.33 0.28 0.18 0.32 0.31 0.15 5−300 P20 0.71 0.5 0.58 0.69 0.61 0.66 11−13 P5 0 0.25 0.12 0 0.26 0.036 150−850 G1 0 0 0.56 0 0 0.55 50−75 G2 0 0 0.68 0 0 0.73 0.015−0.030 G3 0 0.015 0.14 0 0.03 0.18 0.7−1.3 PHINT 0.28 0.17 0.43 0.25 0.22 0.33 50−90 THOT 0 0 3.4 0 0 3.3 28−34 TCLDP 0 0 0.025 0 0 0.024 12−18 TCLDF 0 0 0.016 0 0 0.028 10−20 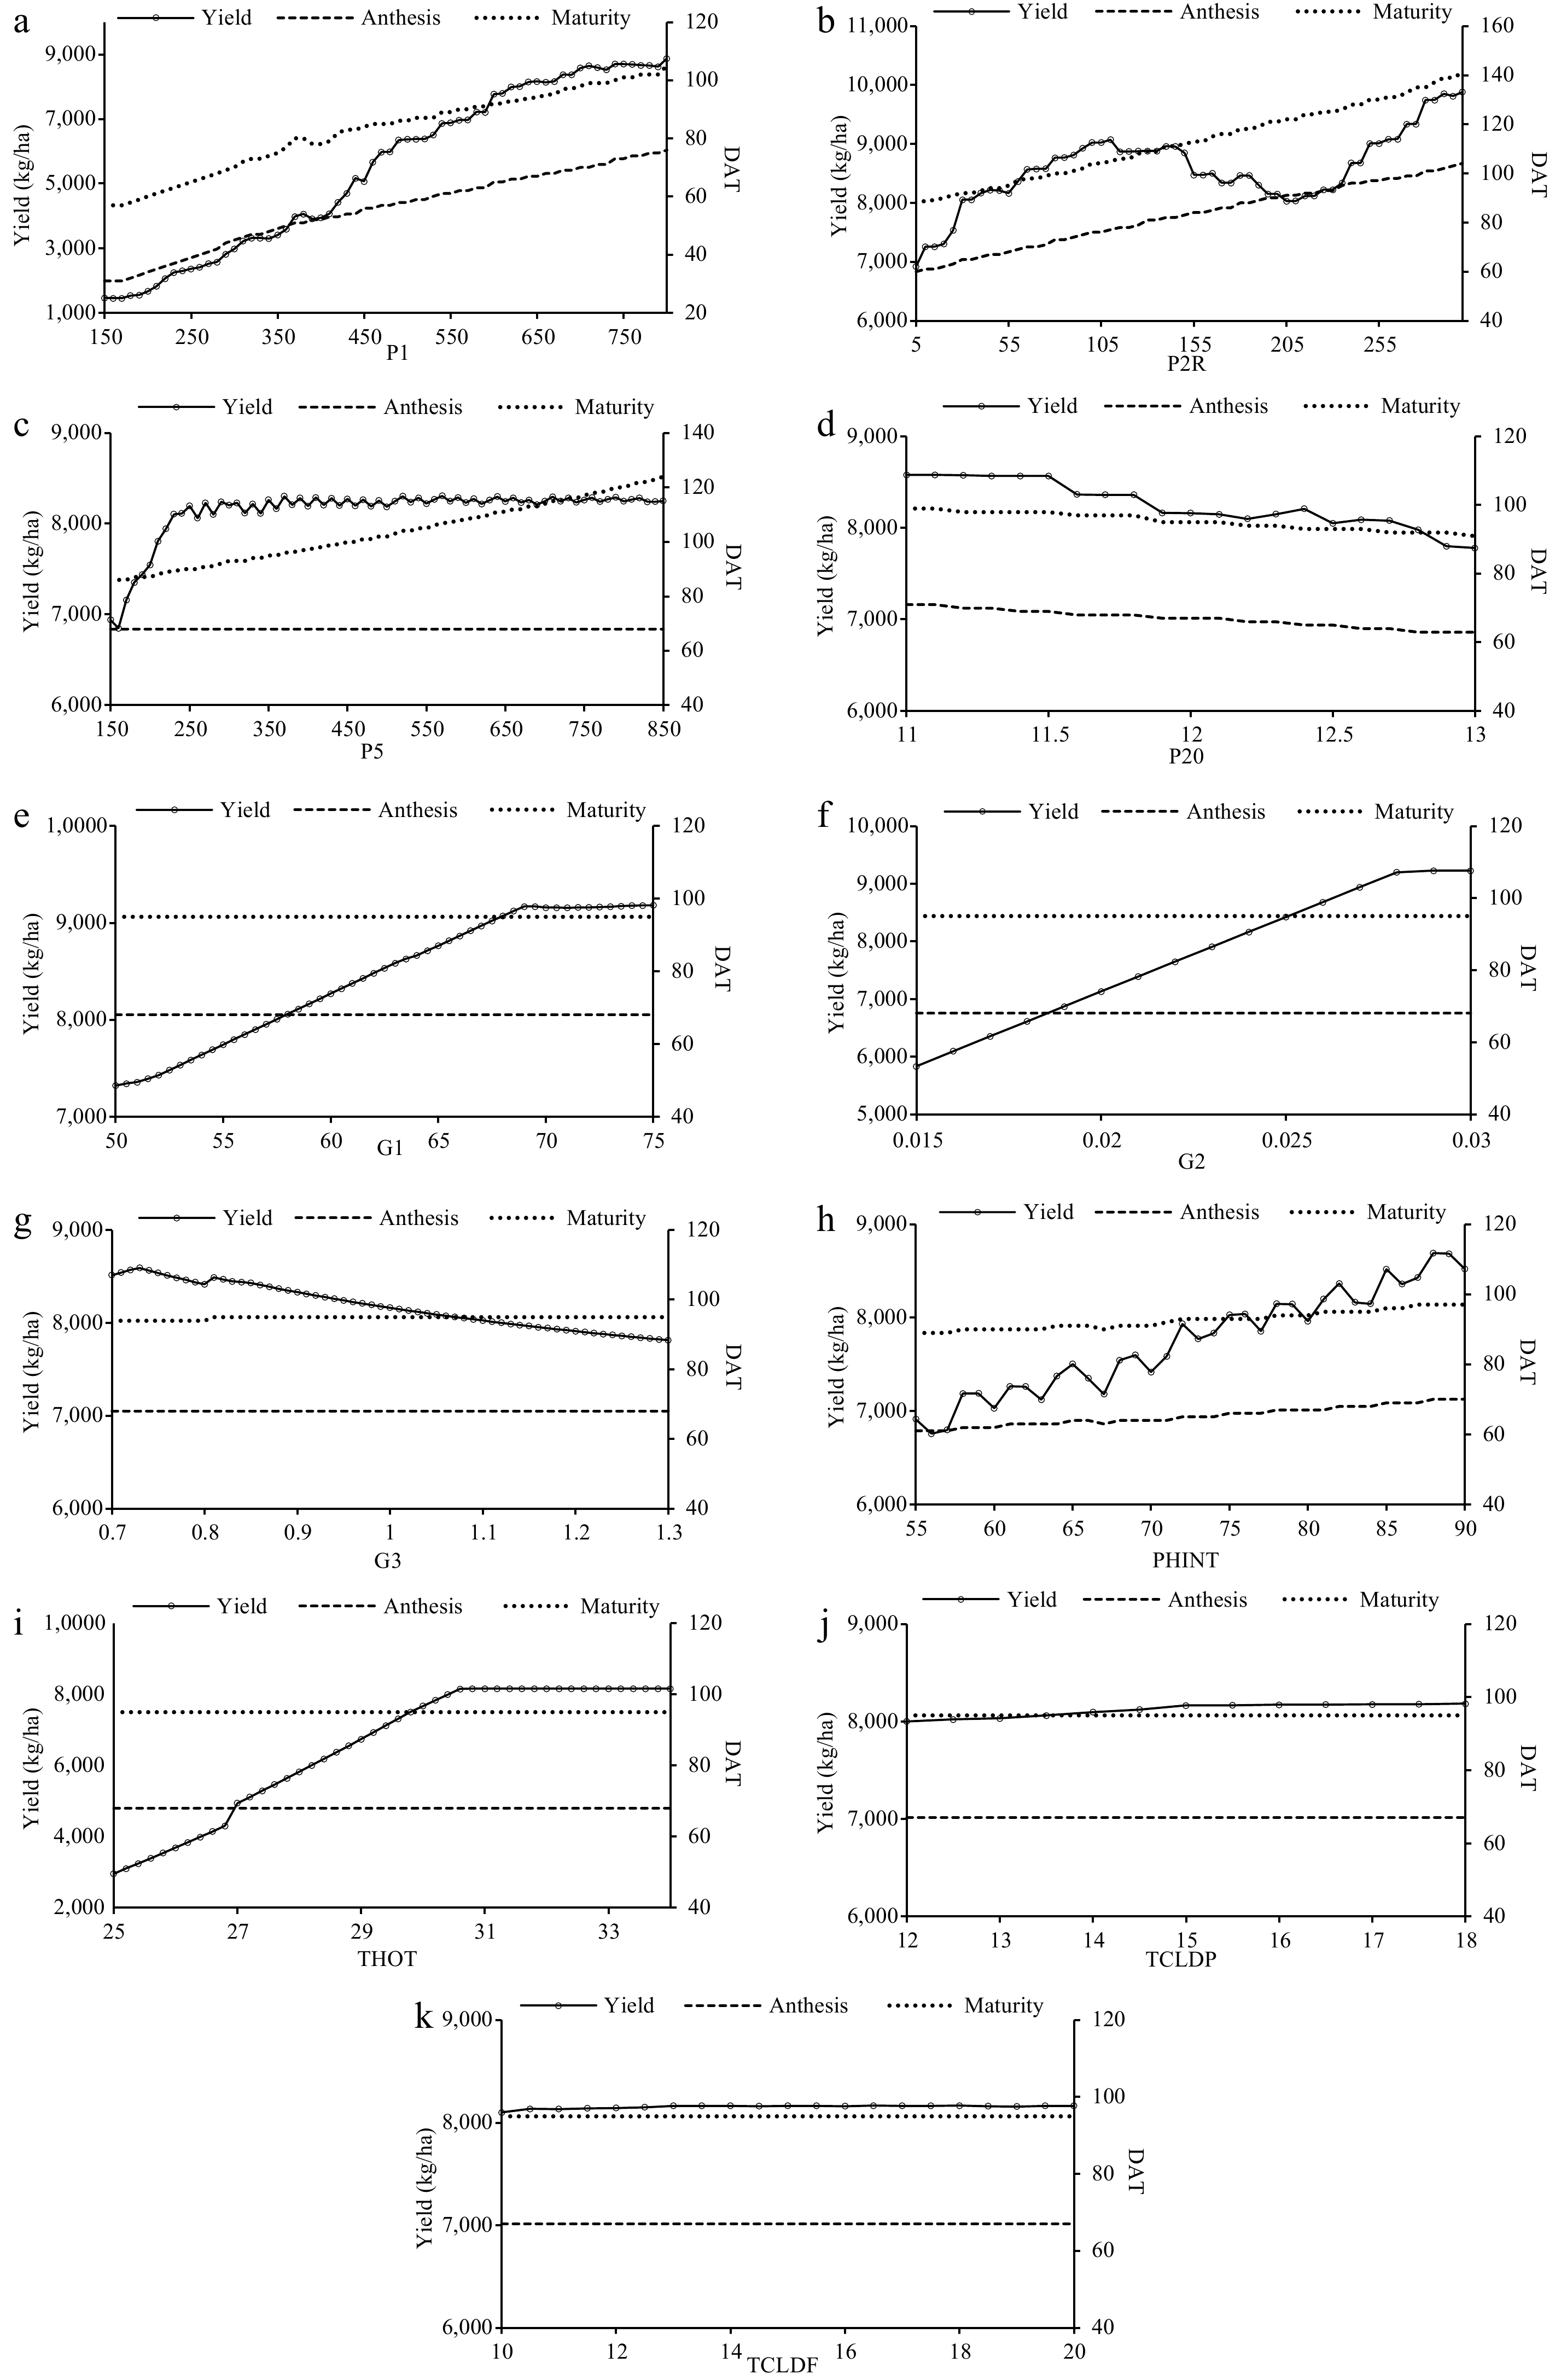
Figure 1.
Variations in grain yield (kg·ha−1), anthesis and maturity (DAT) of PR 126 to changes in cultivar specific parameters. (a) P1, (b) P2R, (c) P5, (d) P20, (e) G1, (f) G2, (g) G3, (h) PHINT, (i) THOT, (j) TCLDP, and (k) TCLDF.
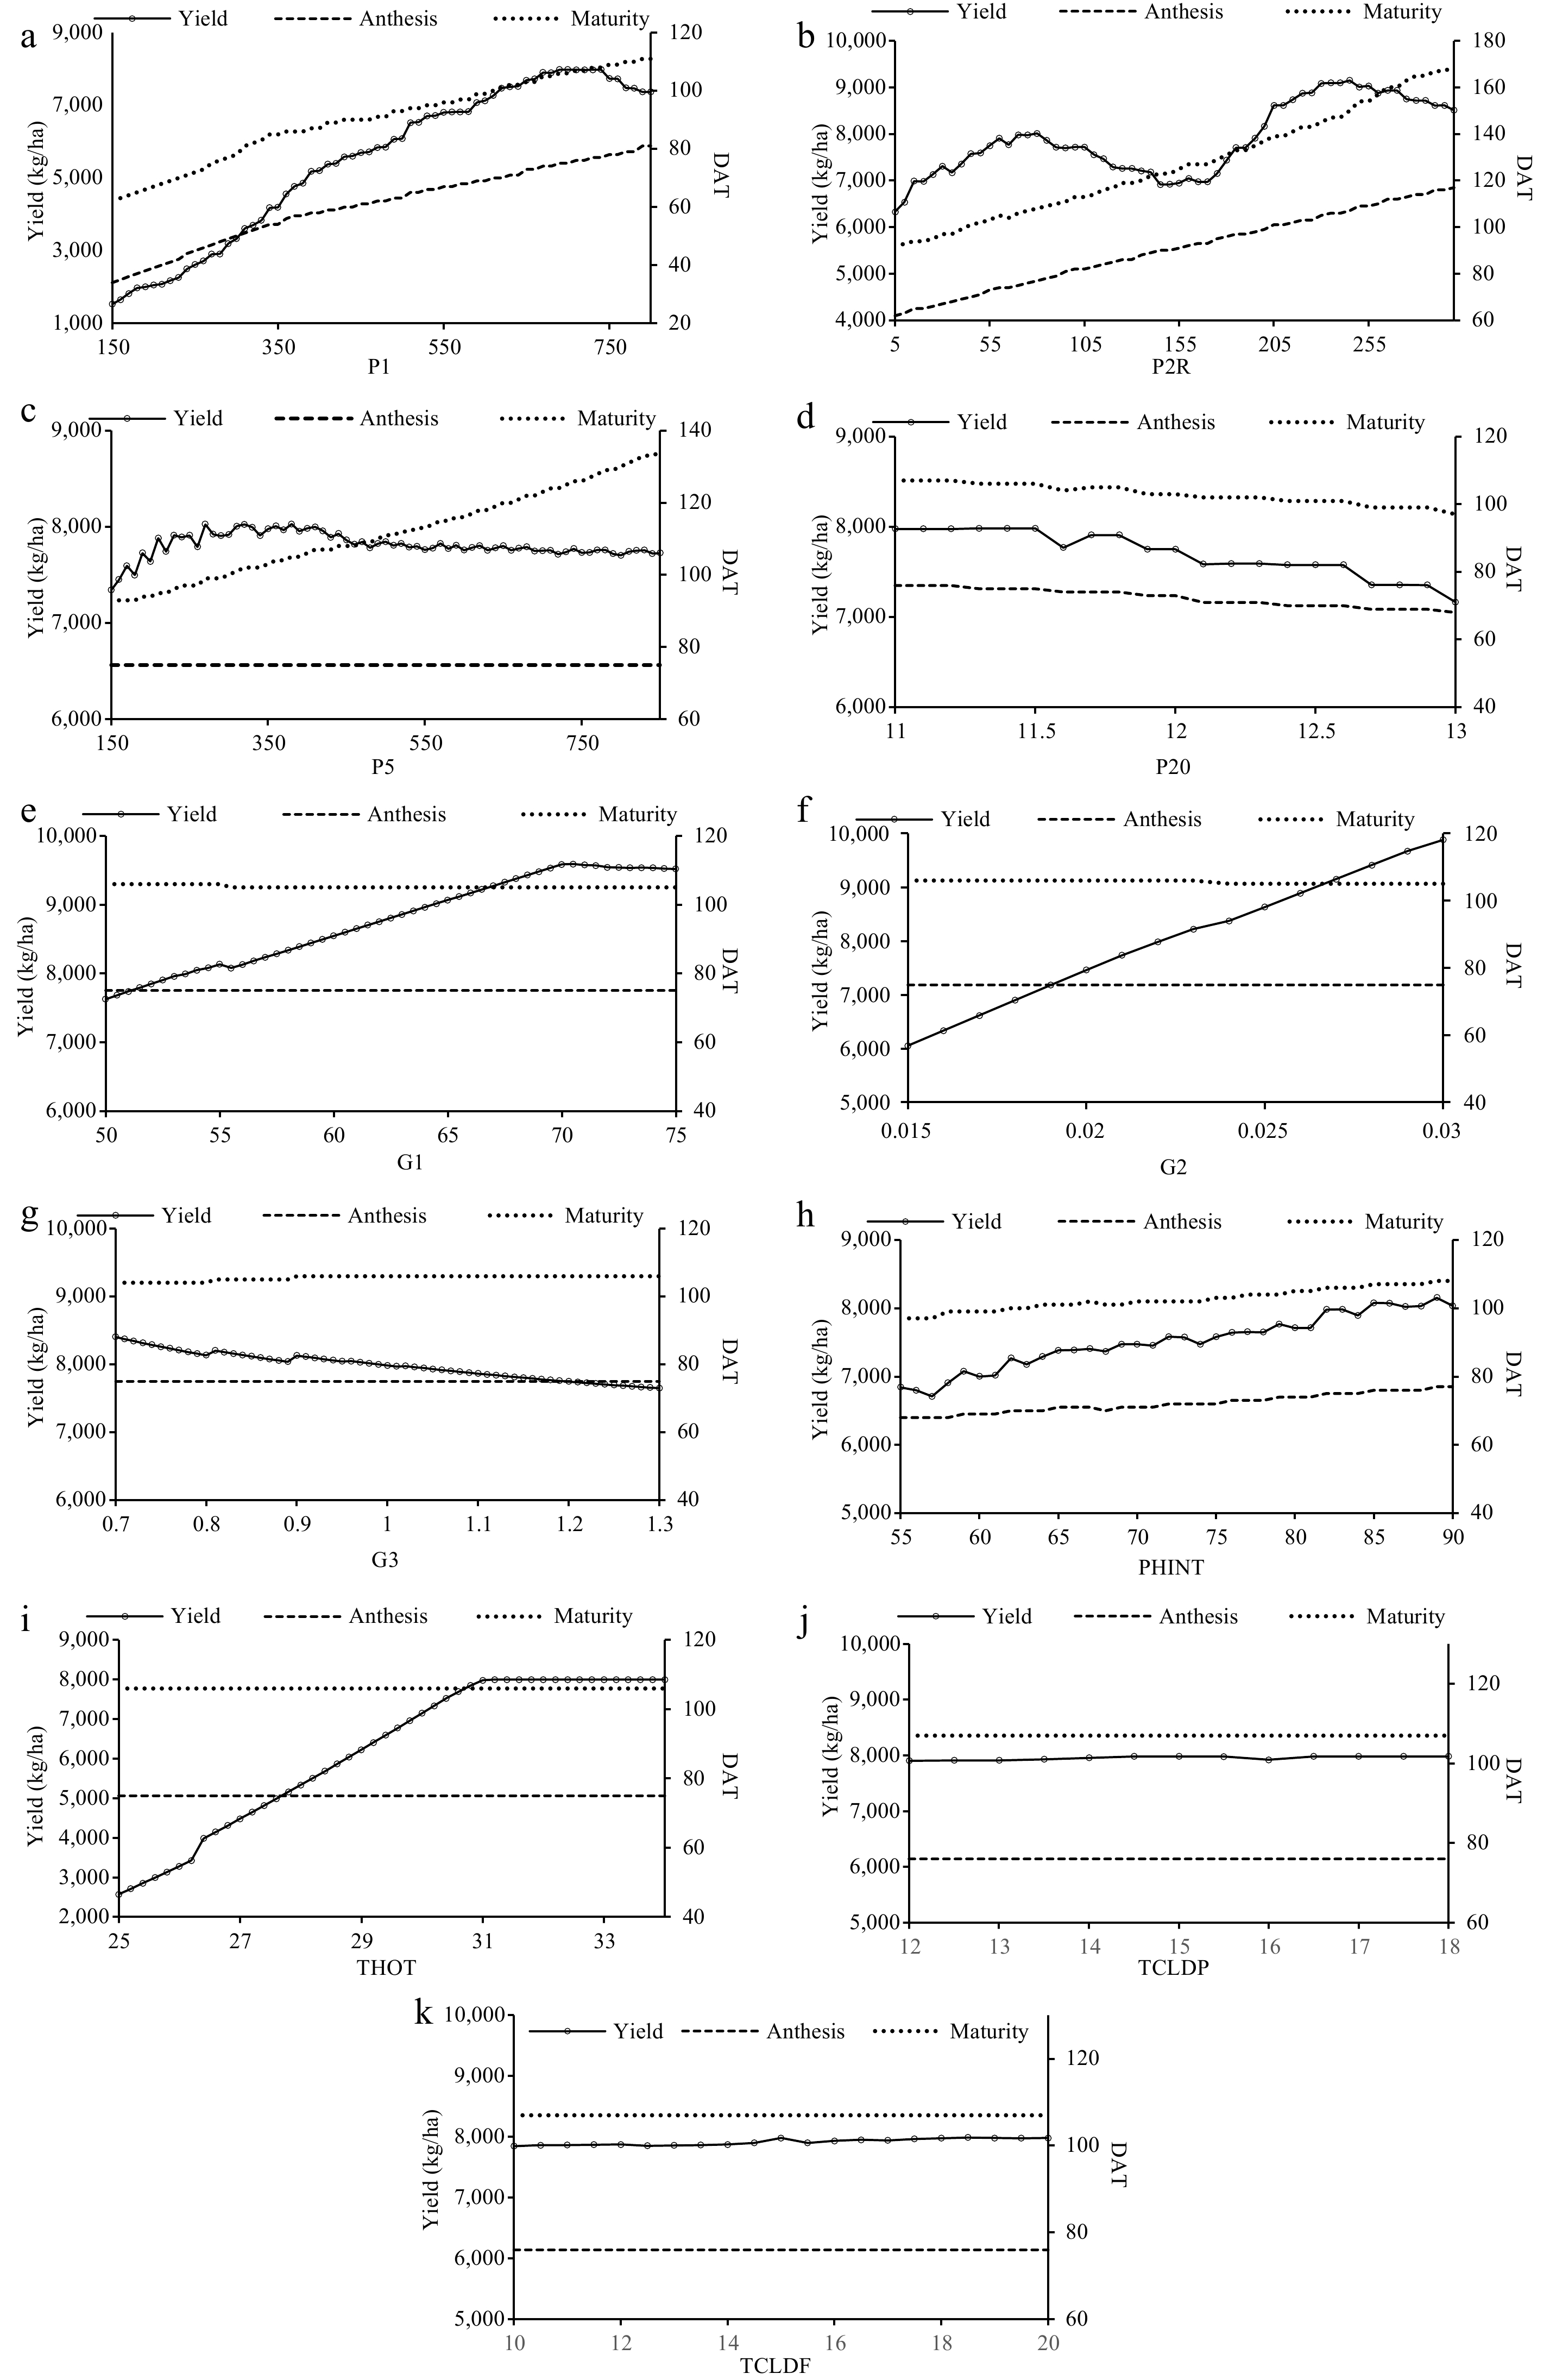
Figure 2.
Variations in grain yield (kg·ha−1), anthesis and maturity (DAT) of PR 127 to changes in cultivar specific parameters. (a) P1, (b) P2R, (c) P5, (d) P20, (e) G1, (f) G2, (g) G3, (h) PHINT, (i) THOT, (j) TCLDP, and (k) TCLDF.
Calibration of the model
-
After the sensitization of the CERES-Rice model to all the 11 CSPs, the calibration of the model was attempted for 24th June as the date of transplantation to determine the cultivar-specific parameters until there was close agreement between simulated and observed crop growth parameters. The genetic coefficients finalized after the iterations are given in Table 3. The values for CSPs namely P1, P2R, and P5 were found to be comparatively more for PR 127 than for PR 126. This represents the requirement of PR 127 for the longer period for its basic vegetative phase, more time required for panicle initiation and a longer time duration between grain filling to physiological maturity respectively. Conversely, coefficients defining critical photoperiod (P20), potential spikelet number (G1), and single grain weight (G2) were higher in the case of PR 126. Further evaluation of the performance of the model was done by using the above-stated statistical parameters for days taken for anthesis and maturity (DAT), LAI, and grain yield (kg·ha−1) of both the rice cultivars.
Table 3. Cultivar specific parameters used in calibration for rice cultivars.
Cultivars Cultivar specific coefficients P1 P2R P5 P20 G1 G2 G3 PHINT THOT TCLDP TCLDF PR 126 670.0 55.0 360.0 12.0 59.0 0.024 1.00 83.0 31.0 15.0 15.0 PR 127 700.0 70.0 400.0 11.3 53.4 0.022 1.00 83.0 31.0 15.0 15.0 Validation of the model
-
After the calibration of the CERES-Rice model, it was further validated for the other three dates of transplanting using the statistical indices described in the previous sections. The observed and model-simulated averages for both rice cultivars (PR 126 and PR 127) were found to be close to each other for days taken for anthesis and maturity, LAI, and grain yield with their ratio near 1 (Table 4 and Fig. 3). The model satisfactorily simulated the days taken for anthesis and had an excellent value of R2 (0.94) for both cultivars of rice. Similarly, the model output for days taken to maturity was also in close agreement having R2 values of 0.89 and 0.96 for PR 126 and PR 127, respectively. The model satisfactorily simulated the days taken for the anthesis and maturity stages and the RMSE value was as low as 0.58 and 0.82 for PR 126, respectively, while it was 0.58 for both stages of PR 127. The validation results further depicted the calibration of the model with a high degree of certainity due to its high d-stat value for days taken anthesis and maturity for PR 126 to be 0.97 and 0.87, respectively, and for PR 127 to be 0.97 and 0.92, respectively. The value of NRMSE for days taken to reach the anthesis stage was found to be excellent for PR 126 (0.89%) and PR 127 (0.77%) cultivars. Similarly, for days taken to reach maturity, the NRMSE was found to be excellent for PR 126 (0.86%) and PR 127 (0.54%). The modeling efficiency (ME) was excellent for days taken to anthesis i.e., 0.88 (PR126) and 0.91(PR127) whereas it was good for days taken to maturity i.e., 0.57 (PR126) and 0.79 (PR 127).
Table 4. Statistical measures for evaluation of CERES-Rice v4.7.5 simulation performance
Parameters PR 126 PR 127 Observed Simulated Observed Simulated Days taken for anthesis Mean days after transplanting (DAT) 65 65 75 76 Ratio 1.01 1.00 SD 1.70 1.41 1.9 1.7 R2 0.94 0.94 RMSE 0.58 0.58 d-stat 0.97 0.97 NRMSE (%) 0.89 0.77 Model efficiency 0.88 0.91 Days taken for maturity Mean days after transplanting (DAT) 95 95 107 107 Ratio 0.99 1.00 SD 1.25 0.94 1.247 0.816 R2 0.89 0.96 RMSE 0.82 0.58 d-stat 0.87 0.92 NRMSE (%) 0.86 0.54 Model efficiency 0.57 0.79 Grain yield Mean yield (kg·ha−1) 8,223 8,181 7,834 7,707 Ratio 1.0 0.98 SD 89.9 158.9 255.57 339.22 R2 0.89 0.98 RMSE 89.5 155.5 d-stat 0.87 0.93 NRMSE (%) 1.09 1.98 Model efficiency 0.61 0.63 Leaf area index (LAI) Mean LAI 4.13 3.98 3.87 3.94 Ratio 0.96 1.02 SD 0.25 0.24 0.24 0.20 R2 0.87 0.89 RMSE 0.18 0.12 d-stat 0.88 0.93 NRMSE (%) 4.33 3.00 Model efficiency 0.48 0.76 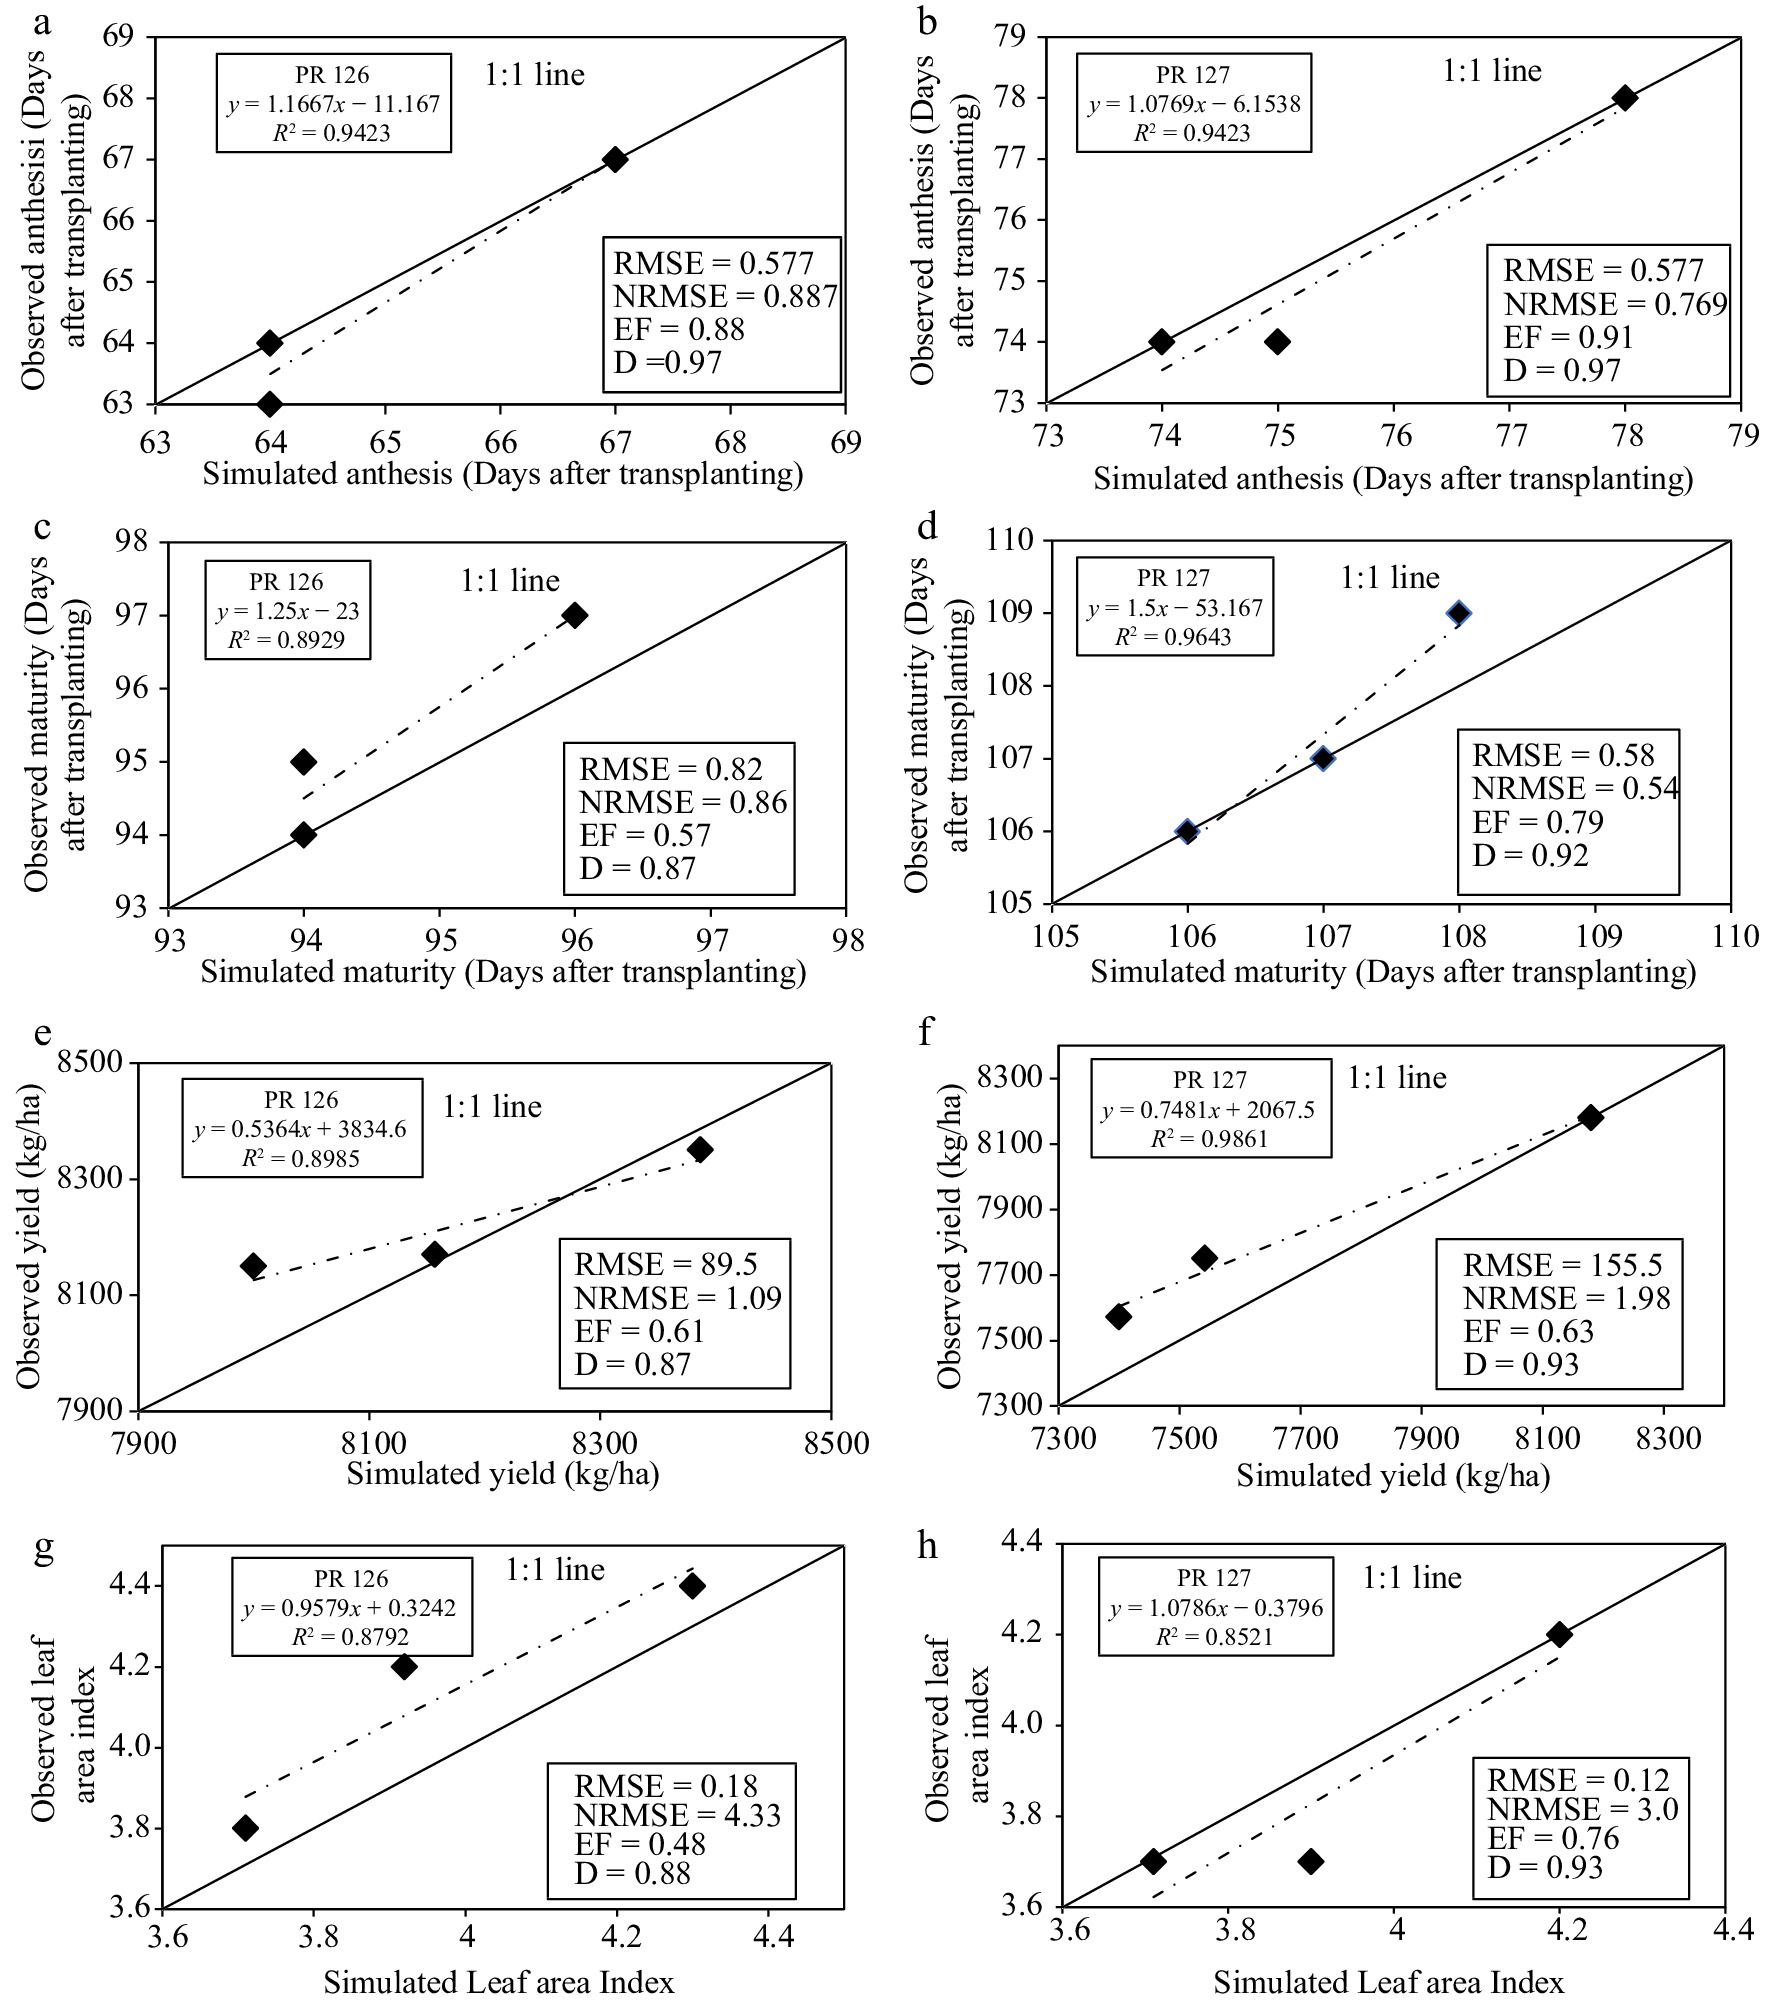
Figure 3.
Evaluation results for (a), (b) anthesis, (c), (d) maturity, (e), (f) grain yield and (g), (h) LAI of rice cultivars
The simulated average grain yield of the rice cultivars was closely related to observed values giving the mean ratio 1 and high R2 value of 0.89 for PR 126 and 0.98 for PR127. The RMSE was low with a value of 89.5 kg·ha−1 for PR 126 and 155.5 kg·ha−1 for PR 127 but the d-stat values were high for PR 126 (0.87) and PR 127 (0.93). The < 10% value of NRMSE, i.e., 1.09 and 1.98% for PR 126 and PR 127, respectively proved that the model gave an excellent fit with the selected values of CSPs. The values of modelling efficiency were in good range for both the rice cultivars i.e., 0.61 for PR 126 and 0.63 for PR 127.
In the case of Leaf Area Index (LAI), the R2 value was excellent for PR 126 (0.87) and PR 127(0.89). The RMSE values were low and the d-stat values were high for PR 126, i.e. 0.18 and 0.88, respectively, and for PR 127, i.e. 0.12 and 0.93, respectively. The NRMSE was in a good range, i.e. 4.33% for PR 126 and 3.00% for PR 127. The modeling efficiency was also found to be fair for PR 126 (0.48) and good for PR 127 (0.76).
Optimization of the transplanting window for rice
-
The sensitivity analysis, calibration, and finally validation of the CERES-rice model confirmed a good agreement between observed and simulated values of days taken for anthesis and maturity, LAI, and grain yield of both the rice cultivars. The calibrated and validated model was used to optimize the date of transplanting window for the rice cultivars. Generally, farmers of the Punjab region transplant 30−35 d seedlings of Parmal varieties in between mid-June to mid-July. So, the transplanting window was considered from 1st June up to 20th July for evaluation by taking the weekly average. The variability in grain yield and LAI for PR 126 and PR 127 within the transplanting window are presented in Fig. 4.
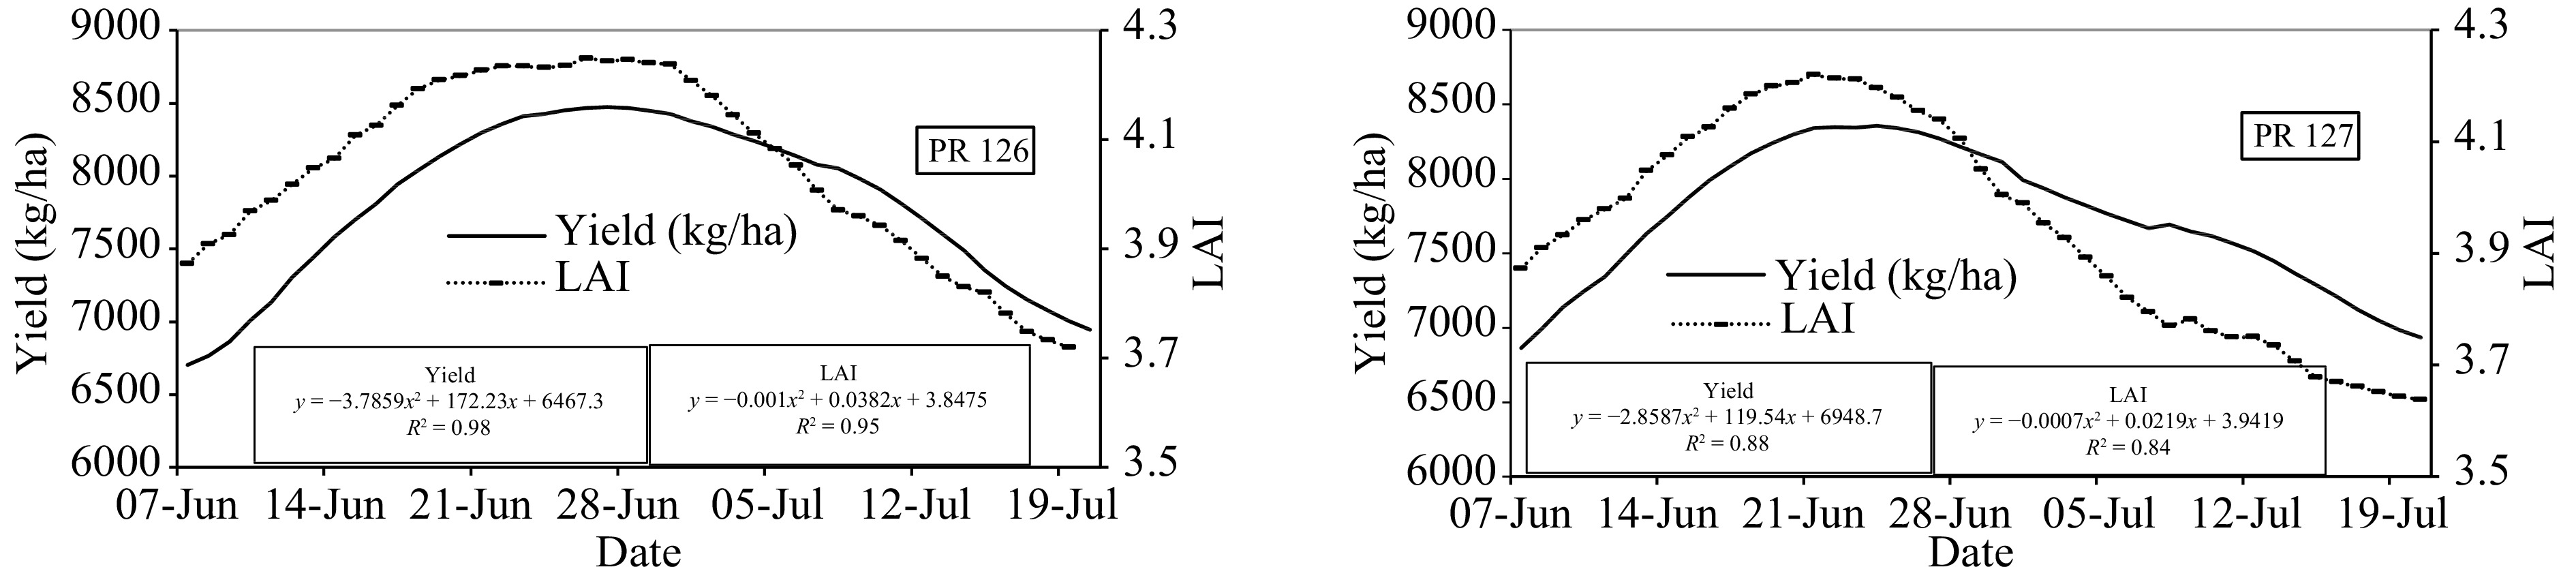
Figure 4.
Grain yield and Leaf Area Index (LAI) (7-d moving average) relation with the transplanting window for rice cultivars PR 126 and PR 127.
The results of the present study showed that the grain yield and LAI had a polynomial relationship with the transplantation date. The simulation results on a weekly average basis indicated 24th to 30th June for PR 126 and 20th to 26th June for PR 127 as the optimum transplanting window with grain yield and LAI for PR 126 ranging between 8,425−8,473 kg·ha−1 and 4.23−4.24, respectively and for PR 127 between 8,298−8,356 kg·ha−1 and 4.20−4.21, respectively. The minimum yield of both cultivars was observed on 7th June i.e. early transplanted rice with grain yield and LAI being 6,703 kg·ha−1 and 3.8, respectively for PR 126 and 6,865 kg·ha−1 and 3.9, respectively for PR 127. The coefficient of determination (R2) of grain yield and LAI was 0.98 and 0.94, respectively for PR 126 and 0.89 and 0.84, respectively for PR 127, thereby indicating a very good agreement between observed and simulated values. The polynomial regression model was able to explain more than 80% variation in grain yield and LAI with the date of transplantation for both cultivars.
The deviation of grain yield and HI (Harvest index) from the mean, clearly depicted the reduction in HI as a result of a reduction in the grain yield of rice (Fig. 5). The deviation of the grain yield and HI of PR 126 varied between −14.2 to +8.2% and −15.1 to +10.5% respectively, while for PR 127 deviations varied between −11.2 to +8.1% and −14.2 to +10.6%, respectively. The negative deviation in the yield/ HI from the average in the case of late transplantation for PR 126 and PR 127 was observed after 11th July and 6th July, respectively. On the other hand, in the case of earlier transplantation, the model showed depreciation in yield and HI when transplanted before the 15th of June for PR 126 and the 13th of June for PR 127. The negative effect on yield and HI of both the cultivars which occurred in case of early and late transplantation could be due to unfavourable climatic conditions during the critical phenological stages of rice.
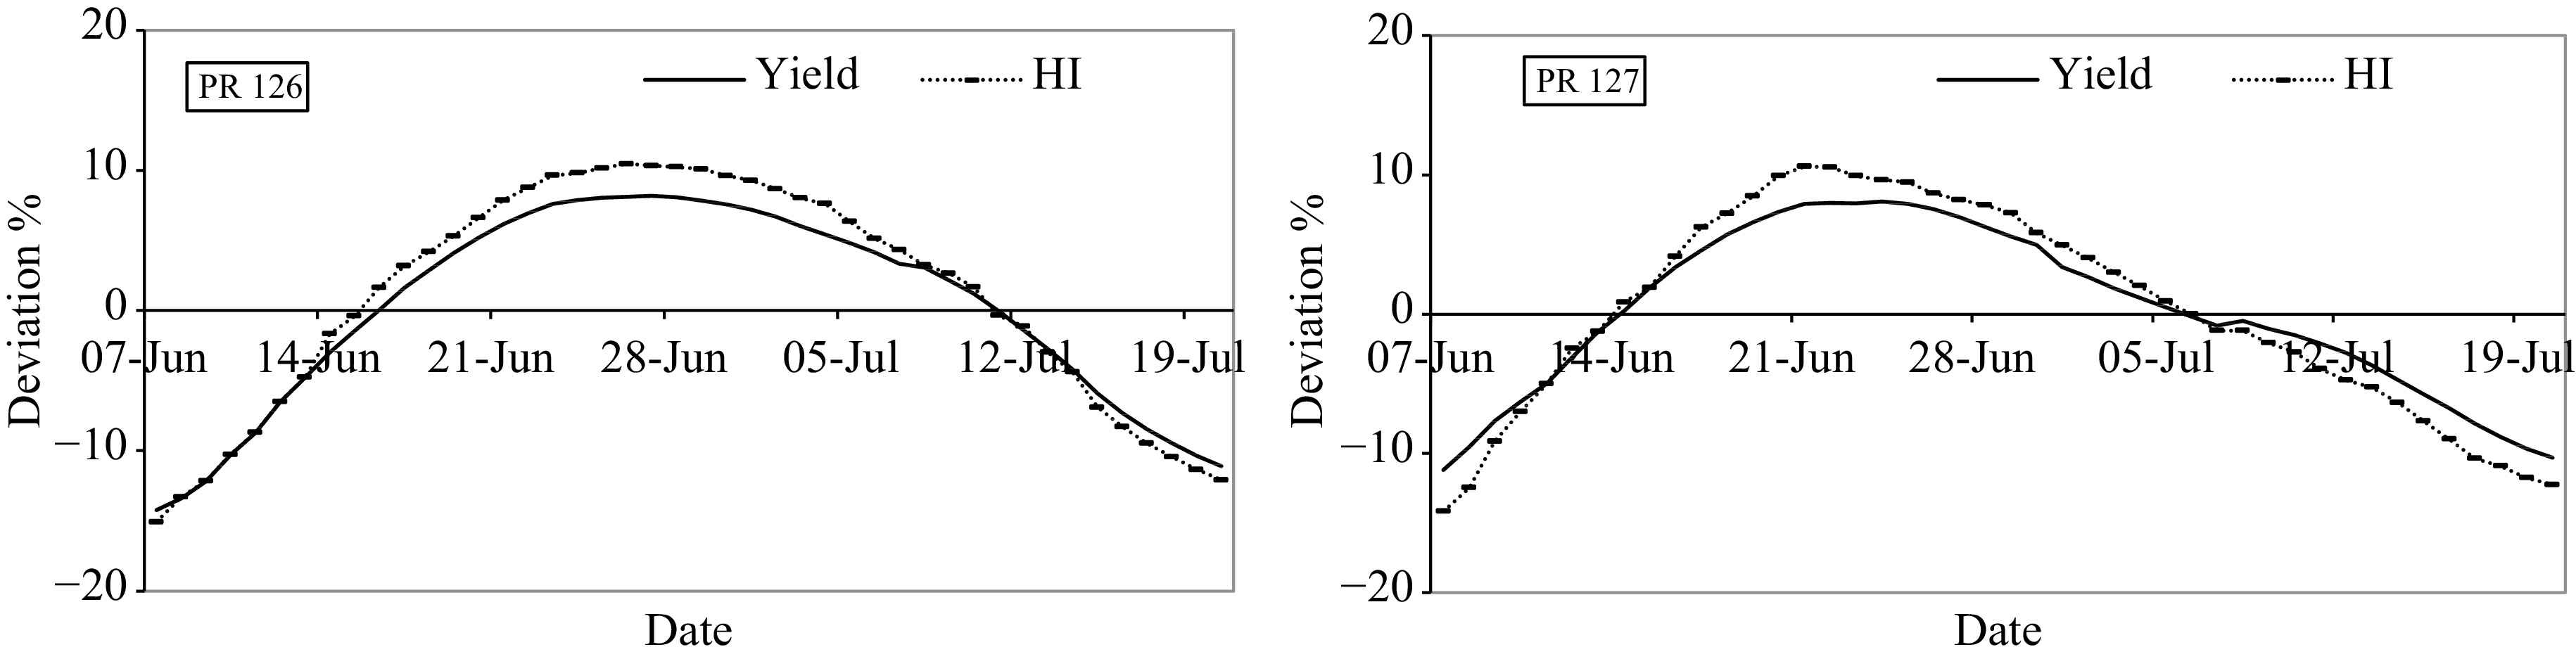
Figure 5.
Grain yield and harvest index (HI) relation with the sowing window for PR 126 and PR 127.
-
In a dynamic crop simulation model the genetic coefficients determine the growth and development characteristics of different cultivars of the crop. In the CERES-Rice model available in DSSAT V4.7.5 there are 11 genetic coefficients (CSPs) for rice cultivars. In the present study sensitivity analysis for 11 CSPs for rice cultivars namely PR 126 and PR 127 was done to determine their sensitivity index and performance of the crop. Amongst the two phenological stages, i.e. the days taken to anthesis of rice cultivars were observed to be sensitive to mainly four CSPs (P20, P1, P2R, and PHINT) and physiological maturity to 6 CSPs (P20, P1, P2R, P5, PHINT, and G3). The grain yield of rice cultivars was highly sensitive to THOT followed by P1, G2, P20, and G1 PHINT while it was less sensitive to P2R, G3, and P5. Ge et al.[31] have reported that genetic coefficients determine the simulation of the growth behavior of crops. They observed that the P20 coefficient influences all the outputs of the CERES-Rice model and so affects the growth and phenology of rice cultivars. The calibration of a model is done to determine the optimum values of its CSPs[22]. Calibration of the CERES-Rice model revealed that the values for coefficients P1, P2R, and P5 were found to be comparatively more for cv PR 127 than cv PR 126 since its growth duration is more by nearly 10 d. So it takes a longer time to complete its vegetative growth and initiate the panicle development. The values of the yield governing coefficients, i.e. P20, G1, and G2 for cv PR 126 were more thereby representing its higher yield potential. Similar results have been reported by Goswami & Dutta[32] for CERES-Rice model cultivar specific coefficients. They have discussed a variation in CSPs used by different workers in their studies at a global level.
Validation of the CERES-Rice model
-
The CERES-Rice model was validated for three dates of transplanting for two cultivars (PR 126 and PR 127) and the statistical indices, i.e. R2, Mean ratio, RMSE, ME, d-Stat and NRMSE indicated a good performance of the model. Similarly, Mote & Kumar[33] calibrated three rice cultivars using the CERES-Rice model under three sowing dates and N levels and they further validated it for biomass and grain yield of rice. The validation results showed RMSE, MBE, and PE for grain yield to be 5.3, −4.1, and PE, respectively while for biomass yield to be 7.4, −5.9, and 9.8, respectively. The model was further used to simulate the growth and development of rice as affected by varying levels of nitrogen in Navsari, Gujrat (India). Ray et al.[34] observed a good agreement between simulated and observed grain yield of Swarna variety of rice with a RMSE value of 0.82 t·ha−1 and a NRMSE value of 14.9%. The index of agreement (0.869) for grain yield also revealed that the model satisfactorily predicted the grain yield of rice. Jha et al.[35]evaluated the model for its application in Bihar, India. The values for statistical measures as obtained for yield, panicle initiation, anthesis, and maturity were 4.04%, 2.14%, 1.04%, and 1.00%, respectively for NRMSE; 0.87, 0.92, 0.91, and 0.81, respectively for d-index; and 0.75, 0.66, 0.81, and 0.58, respectively for ME. Goswami & Dutta[32] compiled evaluation results of the CERES-Rice model on crop phenology and grain yield and found that NRMSE values varied from 1%−5%, 1%−4%, and 0.05%−5% for anthesis, physiological maturity, and grain yield, respectively. In the present study the observed and simulated days taken for phenological stages, i.e. anthesis and physiological maturity, growth attribute (LAI), and grain yield for the rice cultivars were also compared using the 1:1-line graph. These line graphs prepared in Easy-Grapher[36] which is an in-built program of DSSAT depicted a good fit between the observed and simulated values. These graphs help in the quick visual interpretation of validation results and this graphical display is designed to expedite statistical validation which would otherwise take significant time and effort.
Optimization of transplanting window for rice
-
Dynamic simulation models have been widely used to determine the optimum sowing period for crops[37, 35, 38]. In Punjab state generally, 30−35 d old seedlings of Parmal varieties are transplanted between mid-June to mid-July. So the calibrated and validated CERES-Rice model was used to fine-tune the transplanting window for the two rice cultivars (PR 126 and PR 127). The study highlighted a polynomial relationship of transplantation date with the LAI and grain yield. So the simulation on a weekly average basis showed that the 24th to the 30th June for cv PR 126 and the 20th to the 26th June for PR 127 would be the optimum transplanting period. There could be various reasons for the highest yield simulated by the model for rice transplanted between the 20th to the 30th June. Firstly, in Punjab, transplanting of rice near the 25th June helps in aligning the growth and development of rice with the monsoon rainfall that hits Punjab from the 1st week of July[3]. Secondly, optimum climatic requirements for important stages viz.: flowering and tillering of crops might have been fulfilled when transplanted during this period. A study conducted by Brar et al.[39] in North-west India revealed that rice crops transplanted during the last week of June encountered more favorable weather (particularly temperature and sunshine) during the tillering stage as compared to early and late transplanted crops, thus, leading to a higher number of panicles/m2 and test weight. It also reduced the spikelet sterility in rice which ultimately resulted in higher grain yield. Contrarily, later transplantation showed declination in the yield and the reasons could be a reduction in panicle length, a decrease in number of kernels per panicle, and spikelet sterility. Kushuwaha[40] found that delayed transplantation of different genotypes of rice in Nepal decreased plant height, panicle length and number of kernels per panicle. Singh et al.[41] used the CERES-Rice model to determine the optimum dates of planting of different rice varieties in different locations of India, i.e. PR 118 (Ludhiana and Amritsar), HKR6 (Hisar and Ambala), Pant-4 (Kanpur) and Sugandha 1126 (Modipuram). The simulation results showed that the yield was maximum in case of Ludhiana/Amritsar when June 24 was considered as the transplanting date whereas 15th July was found to be the best transplanting date of rice in Hisar, Ambala, Kanpur, and Modipuram. Vishwakarma et al.[42] observed 27th June to be an appropriate time for transplanting of rice hybrids in Uttar Pradesh. Similarly, Deka et al.[43] conducted research at Assam, India during 2014−2015 and 2015−2016 in which they observed that rice transplanted on 20th June gave the highest yield than those transplanted during later dates.
-
Rice is the only crop to survive waterlogged anaerobic conditions and one of the major cereal crops of the entire world. The demand of rice may never decrease, however, its supply can definitely decline. For the unprecedented climate variability and unforeseen future climate changes, it is not an easy task to predict the yield of rice within a short time for present and future climatic scenarios under field conditions. The DSSAT suite of simulation models is one of those decision-making tools that not only predicts yield within a short period but also helps in optimizing management practices that include transplanting date, fertilizer and irrigation application, seedlings per hill, and so on.
The results of the DSSAT package highly depends upon the accuracy of sensitivity analysis followed by proper calibration and validation. Thus the identification of the most sensitive crop-specific parameters helps in accurate calibration of the model. In the above study, a precisely calibrated CERES-Rice model available in DSSAT version 4.7.5 was used and it was further checked by validating it for its reliability with various statistical measures (R2, d-stat, RMSE, NRMSE, SD, and EF). All the statistical measures showed close agreement between values of simulated and observed parameters.
The calibrated CERES-Rice model was then used to optimize the transplanting window for rice. Overall, it simulated the 24th to the 30th of June for PR 126 and 20th to the 26th of June for PR 127 as the optimum transplanting window in Punjab. Both early and later transplantations showed a reduction in yield from the optimized transplanting window yield. Punjab has always been distinguished for its contribution in the 'Green revolution' but with an increasing variability in driving elements of climate change, farmers have been facing challenges in gaining the same amount of rice yield as in prior climatic conditions. Depletion in yield can be caused by improper management practices involved and it is always needed to evaluate and re-evaluate management practices that contribute towards the grain yield of the crop. Thus the CERES-Rice model available in the DSSAT package is a powerful tool that helps in determining optimum management practices without the involvement of tedious field experiments.
-
The authors confirm contribution to the paper as follows: experimental operation, data analysis and draft manuscript preparation: Aryal A; study conception and design, study supervision, manuscript revision/finalization: Kaur P; field experiments conduction: Sandhu SS; draft manuscript preparation: Kothiyal S. All authors reviewed the results and approved the final version of the manuscript.
-
The datasets generated or analyzed during this study are included in the manuscript.
The funding for the research was received from the Science and Engineering Research Board, New Delhi through Core Grant project funding No. CRG/2019/002856 : 'Optimizing cereal productivity under RCP projected climatic scenarios by mid and end of 21st century in Punjab' is duly acknowledged. The actual field datasets used for calibration and validation of CERES-Rice model collected under the Indian Council of Agricultural Research (ICAR)-Central Research Institute for Dryland Agriculture (CRIDA) research scheme 'All India Coordinated Research Project on Agrometeorology' is duly acknowledged.
-
The authors declare that they have no conflict of interest.
- Copyright: © 2024 by the author(s). Published by Maximum Academic Press, Fayetteville, GA. This article is an open access article distributed under Creative Commons Attribution License (CC BY 4.0), visit https://creativecommons.org/licenses/by/4.0/.
-
About this article
Cite this article
Aryal A, Prabhjyot-Kaur, Sandhu SS, Kothiyal S. 2024. Optimizing the transplanting window for higher productivity of short and medium duration rice cultivars in Punjab, India using CERES-Rice model. Circular Agricultural Systems 4: e011 doi: 10.48130/cas-0024-0010 

Optimizing the transplanting window for higher productivity of short and medium duration rice cultivars in Punjab, India using CERES-Rice model
- Received: 09 November 2023
- Revised: 04 March 2024
- Accepted: 19 March 2024
- Published online: 04 June 2024
Abstract: The CERES-Rice (V4.7.5) model was used to identify the optimum transplanting window for higher productivity of rice in Indian Punjab. The model was first sensitized for 11 genetic coefficients and then these values were used for calibrating and validating the model for rice cultivars. The Normalized Root Mean Square Error was in excellent range (< 10%) for all the parameters—the coefficient of determination (R2) for CVS. PR126 and PR127 for days taken to anthesis and maturity were 0.94 and 0.89−0.96, respectively while grain yield and LAI (leaf area index) were 0.89−0.98 and 0.87−0.89, respectively. The optimum transplanting window of 24−30 June for PR126 and 20−26 June for PR127 simulated the grain yield/LAI ranging from 8,425−8,473 kg·ha−1/4.23−4.24 for PR126 and 8,298−8,356 kg·ha−1/4.20−4.21 for PR127. The early transplantation of rice cultivars on 7th June resulted in the lowest yield/ LAI of 6,702 kg·ha−1/3.8 for PR126 and 6,865 kg·ha−1/3.9 for PR127. The deviation for the grain yield and HI (harvest index) of PR126 was between −14.2% to +8.2% and −15.1% to +10.5%, respectively, and of PR127 varied between −11.2% to +8.1% and −14.2% to +10.6%, respectively. The decline in the yield/HI from the average was observed during early transplantation in 2nd week of June (before the 15th of June for PR126 and the 13th of June for PR127) as well as late transplantation in the 1st week of July (after 11th July for PR126 and 6th July for PR127) for rice cultivars. The negative effect on yield and HI of both varieties during early and late transplantation could be due to unfavorable climatic conditions.
-
Key words:
- Calibration /
- DSSAT /
- Sensitivity index /
- Simulation modelling /
- Validation /
- Rice