


-
Copper is an important micronutrient required for the growth of both animals and plants[1,2]. In plants, Cu is required for photosynthesis, respiration, chlorophyll formation, cell wall metabolism, iron metabolism and lignin synthesis[3−6]. In addition, Cu is considered as a cofactor of many enzymes such as polyphenol oxidase, cytochrome-c-oxidase, laccase, amino oxidase, nitrate reductase and plastocyanin due to its electron donation and acceptance ability[2,4,6]. Electron exchange between Cu+1 and Cu+2 may also form reactive oxygen species (ROS) and hydroxyl radicals which may cause damages to DNA, RNA and proteins[6].
In soil, Cu exists in two forms as monovalent (Cu1+) and divalent (Cu2+), and among them Cu2+ is the most abundant. Furthermore, Cu forms oxides, sulfates, sulfides, carbonates and sulfosalts in soil[2,6]. Generally, soil total Cu concentration ranges between 3–100 mg·kg−1[4]. In rice soil 100 mg·kg−1 of Cu concentration may reduce grain yield of rice by 10%, and thus the soil total Cu concentration of 100 mg·kg−1 is set as the threshold for rice[3,7−9].
Copper concentration in rice grains may increase even until soil total Cu concentration reaches 150–200 mg·kg−1, however, further increase in soil total Cu concentration may cause Cu toxicity to rice plants[3,6]. As a result, plants may show necrosis, chlorosis, leaf distortion and stunting. In comparison to soil total Cu, soil exchangeable Cu concentration is more responsible for plant Cu uptake[10]. Therefore, it has been reported that exchangeable Cu concentration of 200–300 µg·kg−1 in rice soils is the critical exchangeable Cu level causing Cu deficiency[11].
Soil pH, temperature, redox potential, clay content, cation exchange capacity (CEC), total Cu concentration and organic matter content determine the exchangeable Cu in soil[4,10,12−14]. From the soil total Cu concentration (i.e. 3–100 mg·kg−1), only 1%–20% is readily bioavailable while the rest is bound to organic matter[4]. Under flooded conditions, especially in lowland rice cultivated soils, Cu2+ is reduced to Cu1+ decreasing Cu solubility. Furthermore, submerged conditions may change redox potential, pH, dissolved organic carbon (DOC), Fe, Mn and S content in soil[13,15], reducing the concentration of bioavailable Cu in soil due to the precipitation of Cu in the form of oxides, carbonates or sulfides[13].
Adsorption of Cu into soil particles is more favorable at high pH, since there is less H+ in the soil solution. In contrast, at low pH, Cu competes with H+ for the available permanent charge sites of soil particles and adsorption is limited. Therefore, run-off or leaching out of Cu with surface or groundwater is considerably high in low-pH soils[2,16]. It has also been reported that pH value less than 6 is favorable for Cu bioavailability[17,18]. Anthropogenic activities such as the application of fertilizers especially phosphate fertilizers, application of herbicides, pesticides and fungicides may increase the accumulation of excess Cu in soil, and subsequently reduce the availability of P, Fe and Zn to plants[6,19]. Moreover, application of organic fertilizer especially organic manure has become a concern in Cu contamination in soil, since animal feeds contain large proportions of Cu[20].
Rice is cultivated in lowlands, mostly under alternate wetting and drying soil conditions and a broad range of agro-climatic conditions in Sri Lanka. Most of these paddy soils are Cu-deficient[21]. It is also reported that the total Cu concentration varies among different regions of Sri Lanka[9]. Despite the importance of Cu on the growth and nutrition of rice and except for the few reports available, adequate research has not been conducted to assess the current status of Cu concentration in lowland paddy fields in Sri Lanka[22].
Based on the rainfall, Sri Lanka is divided into three climatic zones (CZs). Areas receiving mean annual rainfall less than 1,750 mm with a relatively dry season from March to August (i.e. Yala season) are identified as Dry zone. The Wet zone receives a mean annual rainfall greater than 2,500 mm and is distributed throughout the year without a distinct dry season while the Intermediate zone has in-between characteristics concerning the amount and distribution of annual rainfall. When considering elevation, areas located less than 300 m, 300−900 m, and more than 900 m above sea level are called Low, Mid, and Up Country regions, respectively. Based on the rainfall and elevation, Sri Lanka is divided into seven agro-climatic zones (ACZs). Those seven ACZs are; Dry zone Low country (DL), Intermediate zone Low country (IL), Intermediate zone Mid country (IM), Intermediate zone Upcountry (IU), Wet zone Low country (WL), Wet zone Mid country (WM) and Wet zone Upcountry (WU). Out of those, rice is widely cultivated in all the ACZs except WU due to topographical limitations.
Rice cultivation in DL and IL of Sri Lanka largely depends on the well-distributed cascade irrigation network developed due to the uneven annual rainfall distribution. However, rice cultivation in other regions largely depends on rainfall. Depending on the size of the command area, irrigation schemes are categorized as major (more than 80 ha command area) or minor (less than 80 ha command area)[23]. Moreover, DL and IL in Sri Lanka are warmer and receive higher solar radiation indicating higher yield potential than other ACZs[24,25]. Soils used to cultivate rice in Sri Lanka have different geological origins such as Alfisols, Entisols, Histosols, Inceptisols, Ultisols and Vertisols[26]. It has also been found that the rice crop productivity in Sri Lanka varies among ACZs, soils and water sources[24,25]. The existing variability of climate, soil, and water sources in different regions of Sri Lanka may have interactively influenced the exchangeable Cu concentration in lowland rice fields in Sri Lanka and this had not been explored. Therefore, the objectives of the current study were to (i) determine the distribution of exchangeable Cu concentration, and (ii) examine the interactive effects of ACZ, soil order, and water source on determining the exchangeable concentration of Cu in lowland paddy fields in Sri Lanka.
-
A total of 7,544 soil samples were collected using a stratified random sampling approach (Supplemental Tables S1 & S2). Selection of sampling locations and collection of soil samples were completed as reported previously[27]. Samples were collected during October-November in 2019. For each sample, grid ID, ACZ, district, divisional secretariat division (DSD), and village name were recorded. From each village, one rice track (i.e., a geographically confined lowland area usually owned and managed by a group of farmers) was selected randomly for sample collection. One sample was a mixture of six subsamples collected at 0−15 cm depth. Soil samples were air-dried on clean plastic trays, debris was removed, homogenized, and sieved using a 2 mm sieve. The CZ, ACZ, soil order, and water sources used for rice cultivation relevant to each sampling location were extracted by overlaying relevant GIS map layers in QGIS software. Rice yield obtained during the immediate previous cropping season (t ha−1) was also recorded.
Laboratory analysis
-
Exchangeable Cu in soil samples was extracted into 0.01 M CaCl2 solution[28−30]. For this 5 g soil was dissolved in 50 mL 0.01 M CaCl2 solution, shaken for 2 h on an orbital shaker at 200 rpm, and centrifuged at 3,600 rpm for 4 min. The supernatant was filtered through a 0.45 μm cellulose acetate syringe filter. The Cu concentration in the solution was determined using an Inductively Coupled Plasma Mass Spectrophotometry (ICP-MS) (Thermo Fisher Scientific, iCAP Q). Forty samples were tested at once in each round, i.e. 36 soil samples, two laboratory standard soil samples, and two blanks with 0.01 M CaCl2 solution without soil samples.
For soil pH measurement, 10 g of soil was mixed with 50 mL of distilled water. Samples were shaken for 2 h in an orbital shaker at room temperature. After resting for 15 min, soil pH was determined using a pH meter (Eutech, WC PC 650, Gul Circle, Singapore). Two laboratory standard soil samples and two blanks were used in each batch (i.e. 36 samples) for quality control. Moreover, the pH electrode was calibrated daily using the manufacturer standards (Eutech, WC PC 650, Gul Circle, Singapore).
Preparation of spatial maps
-
Since each sampling point was tagged with a unique Grid-ID, which was coded with distance (km) coordinate X-Y, the same ID was maintained from field data collection to laboratory analysis and data analysis. This procedure allowed easy spatial reference for data set development and facilitated user-friendly GIS map production.
Statistical analysis
-
Copper concentration was tested for normality. As the data set was not normal, all statistical analyses were performed after log-transformation to reach normality (Fig. 1). Analysis of Variance (ANOVA) was performed as a two-step process. First, the difference in Cu concentration of soil samples among CZs, ACZs, soil orders, water sources, and their interactions were determined using the General Linear Model procedure. As most of the higher order interactions of ACZ, soil order, and water source were significant, in the second step, differences in Cu concentration of soil samples among soil orders and water sources were tested within each ACZ. Statistical significances were expressed at α = 0.05. Statistical analyses were performed using SAS 9.1 software.
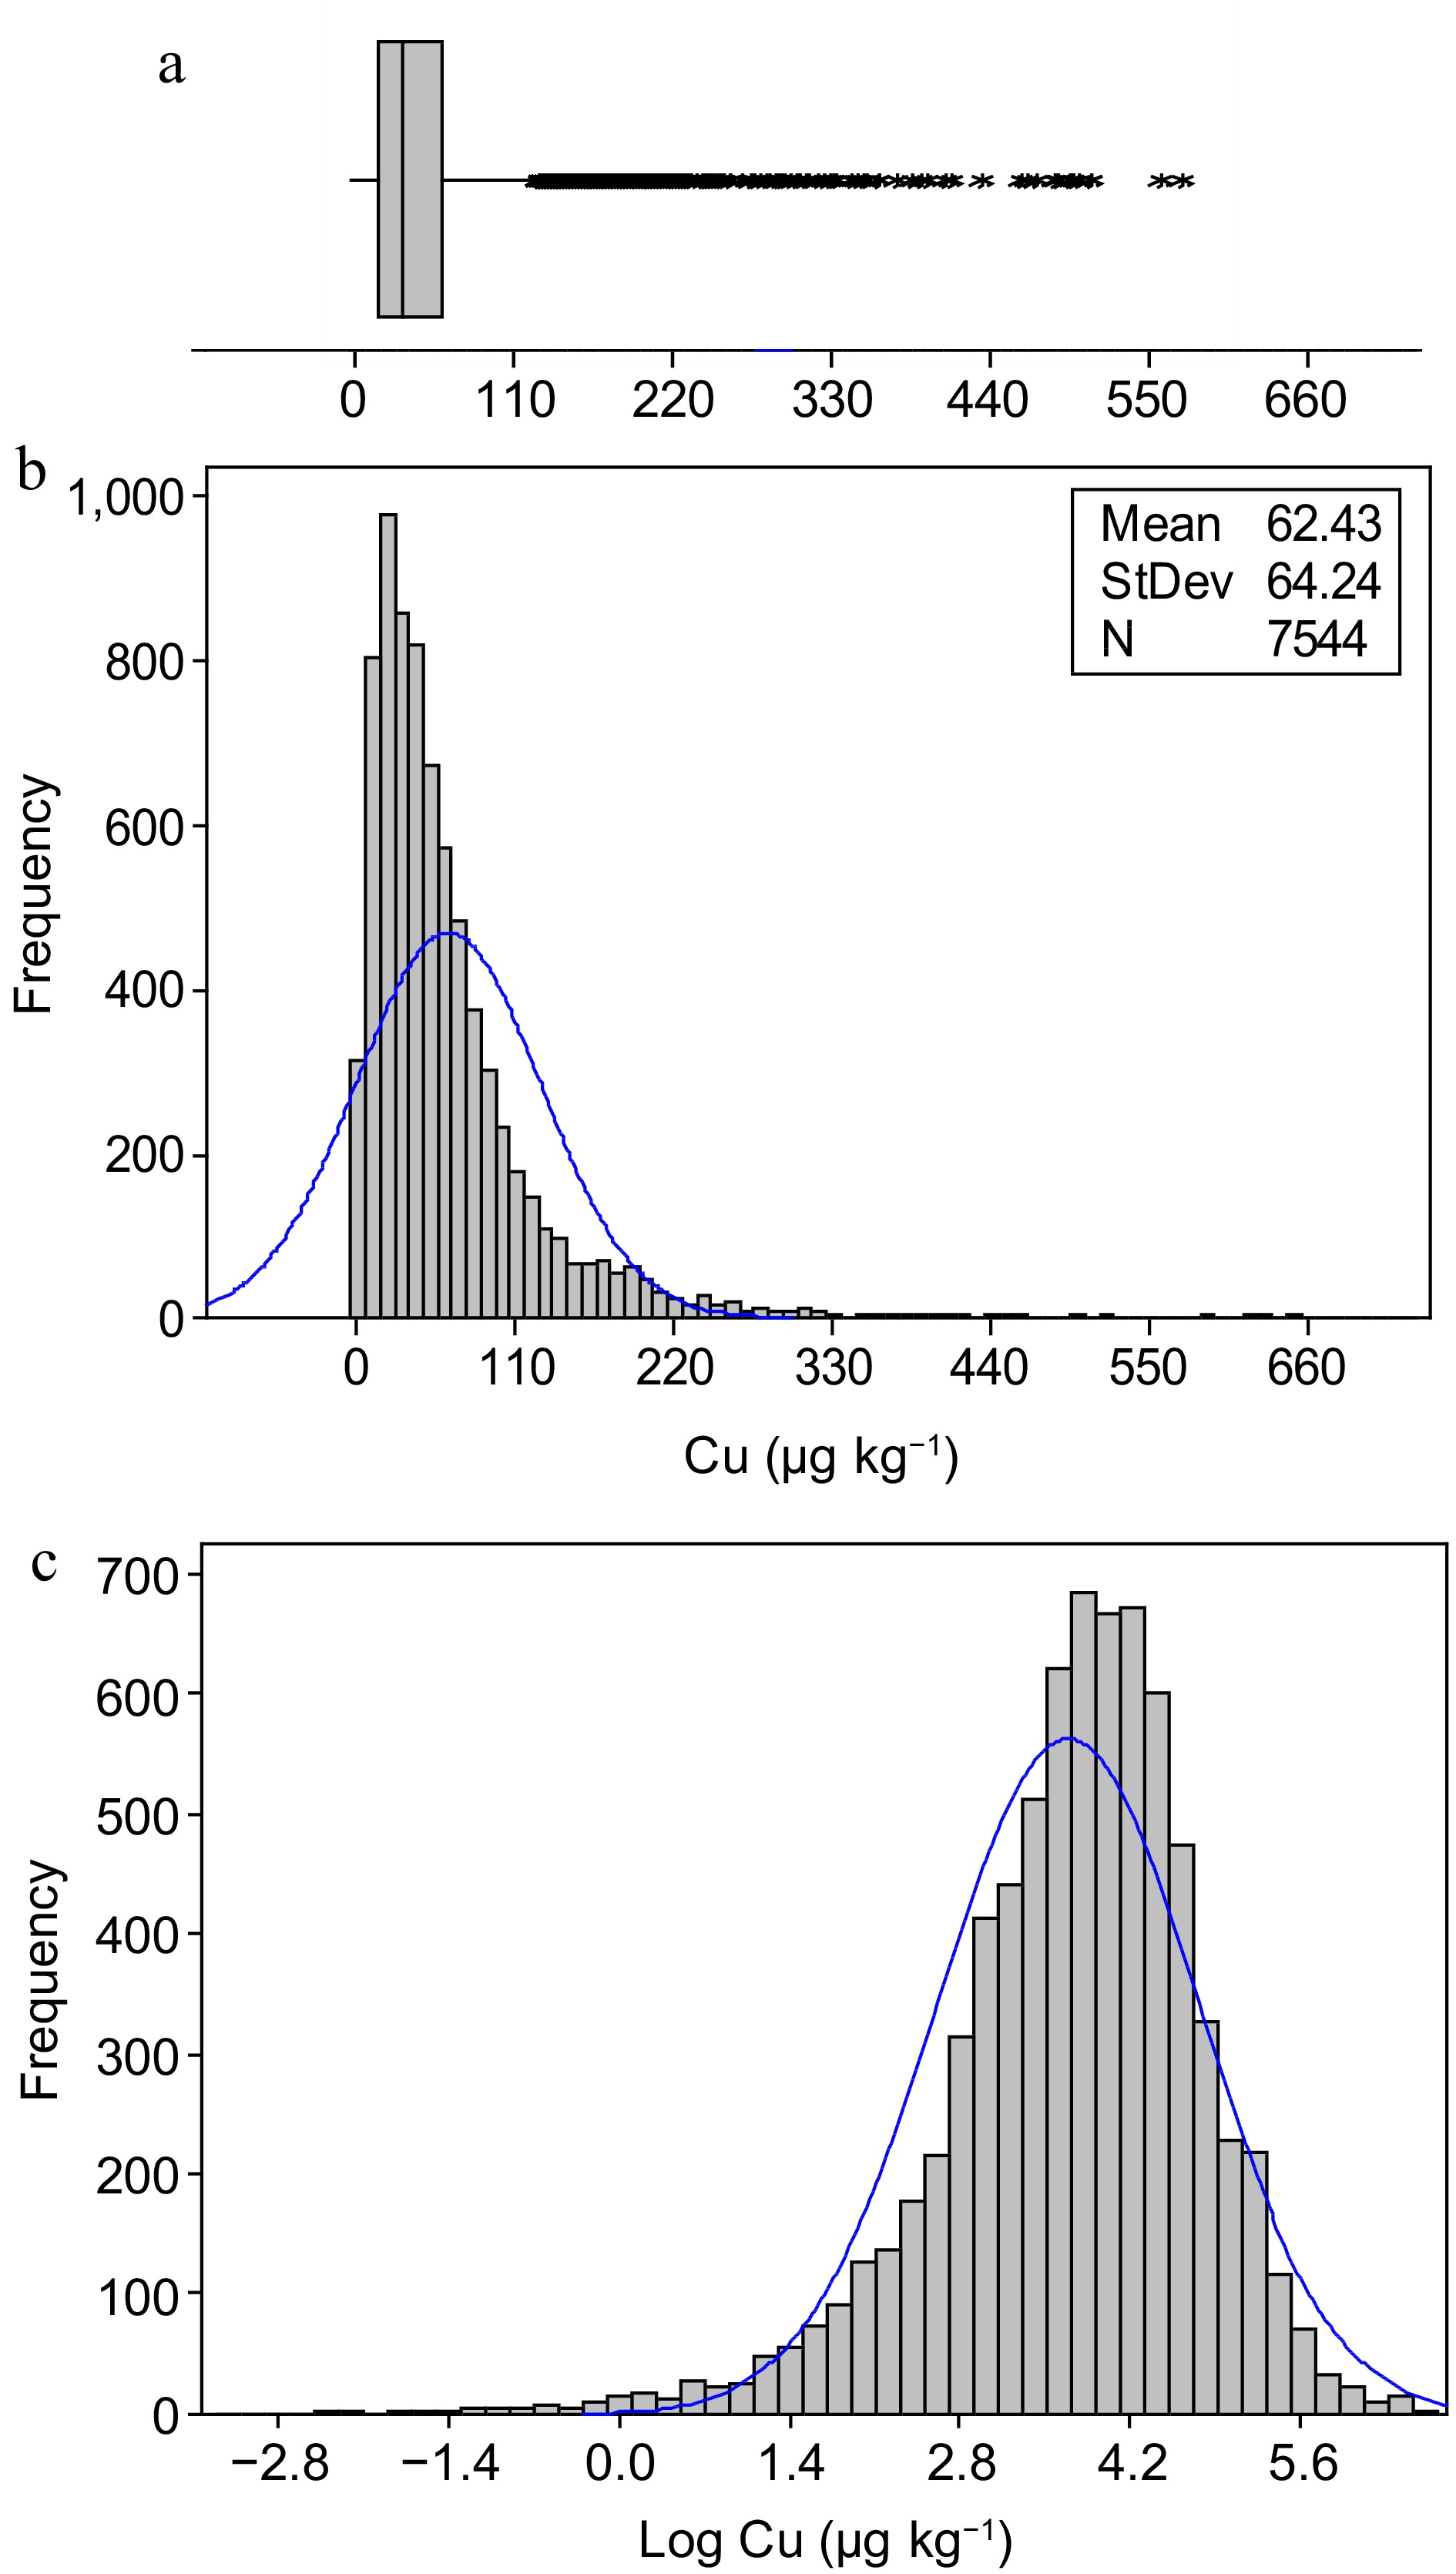
Figure 1.
(a) Box plot, (b) histogram, and (c) log transformed values of Cu concentration of paddy soil samples collected from Sri Lanka.
-
Exchangeable Cu concentration was in the range of 0.04−728 µg·kg−1 with mean and median values of 62.4 and 45.1 µg·kg−1, respectively (Fig. 1). Almost 49% and 75% of the soil samples had exchangeable Cu concentrations less than 50 and 100 µg·kg−1, respectively. Moreover, only 5% of the soil samples had Cu concentration greater than 200 µg·kg−1. The distribution was right skewed due to the presence of a large majority of soil samples with low Cu concentrations while only a small fraction of soil samples with extremely high Cu concentrations. As a result, natural log-transformed Cu concentrations were the best approximation to reach normality.
Copper concentration varied among climatic zones, i.e. WZ had the highest Cu concentration while DZ had the lowest (p < 0.05) (Fig. 2a). When comparing ACZs, Cu concentration between IL, IU, IM, WL and WM was similar (p > 0.05) (Fig. 2b). Moreover, Cu concentration in IM was higher than that in DL (p < 0.05).
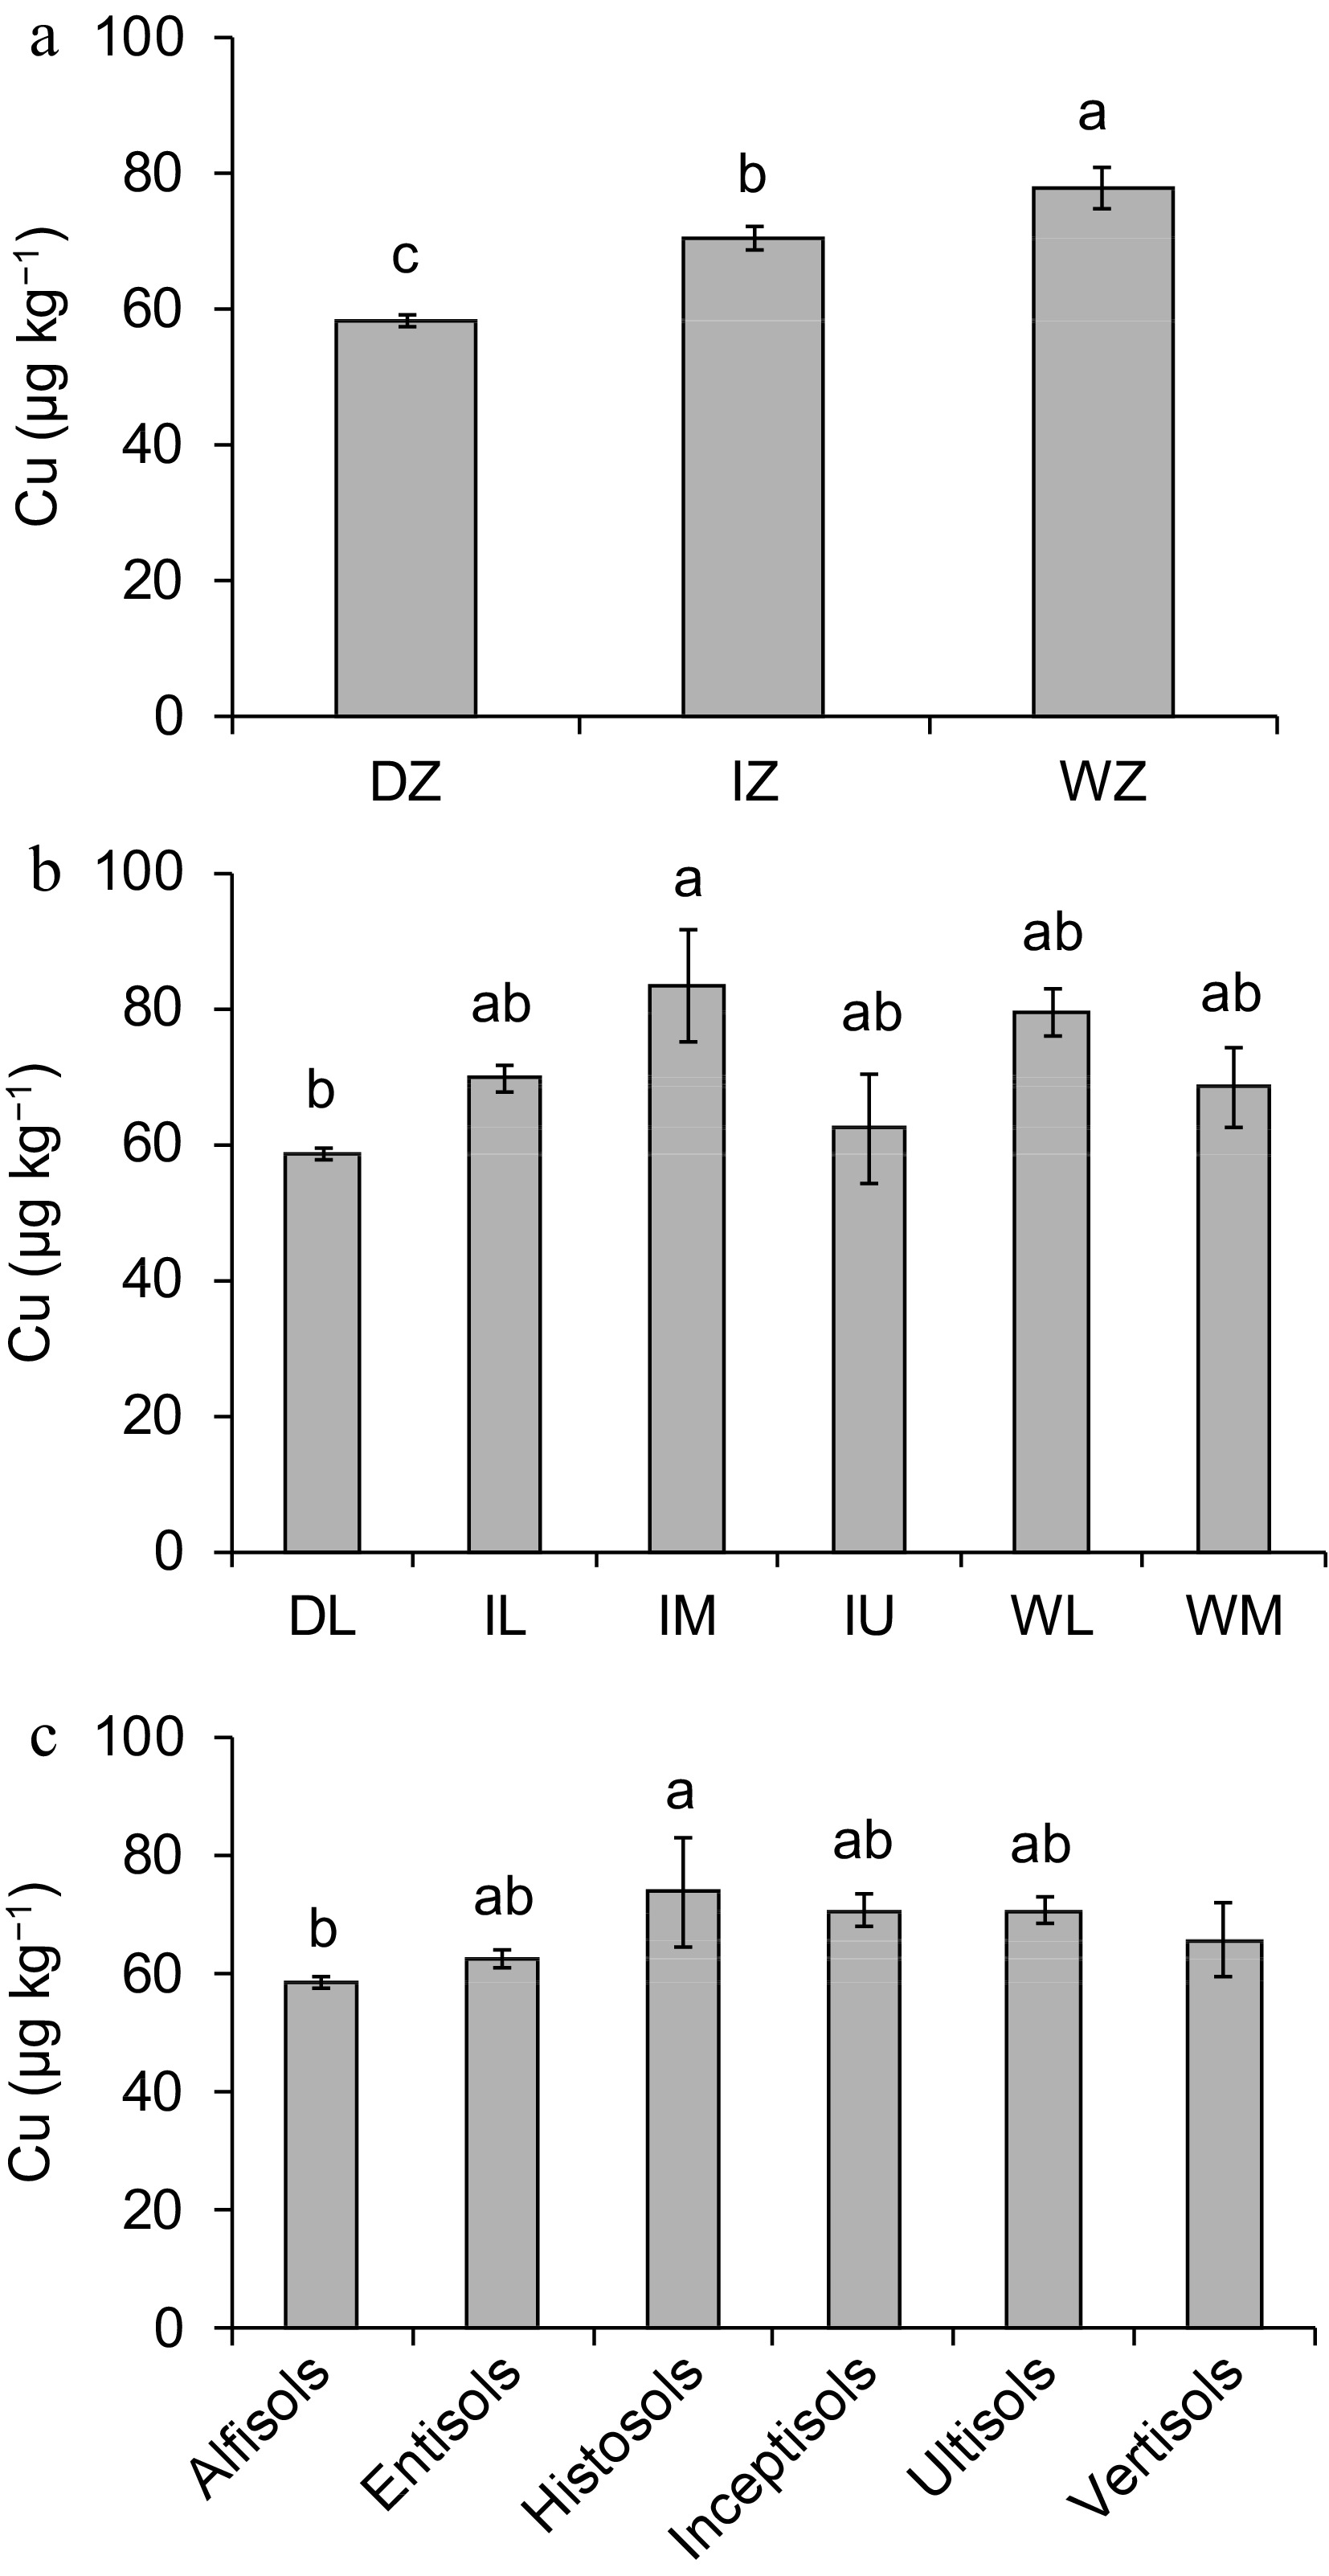
Figure 2.
(a) Concentration of copper (Cu) in the paddy fields used to cultivate rice in different climatic zones of Sri Lanka (Note: DZ, Dry Zone; IZ, Intermediate Zone; WZ, Wet Zone), (b) agro-climatic zones of Sri Lanka (Note: DL, Dry zone Low country; IL, Intermediate zone Low country; IM, Intermediate zone Mid country; IU, Intermediate zone Up country; WL, Wet zone Low country; WM, Wet zone Mid country), and (c) different soil orders of Sri Lanka (mean ± SE).
Despite Sri Lanka being divided into seven ACZs, DL consisted of approximately 2/3 of the land area. Within DL there was a large spatial heterogeneity in the distribution of Cu, e.g., northern and southern regions of DL had higher Cu concentration while the eastern part of DL had lower Cu concentration (Fig. 3).
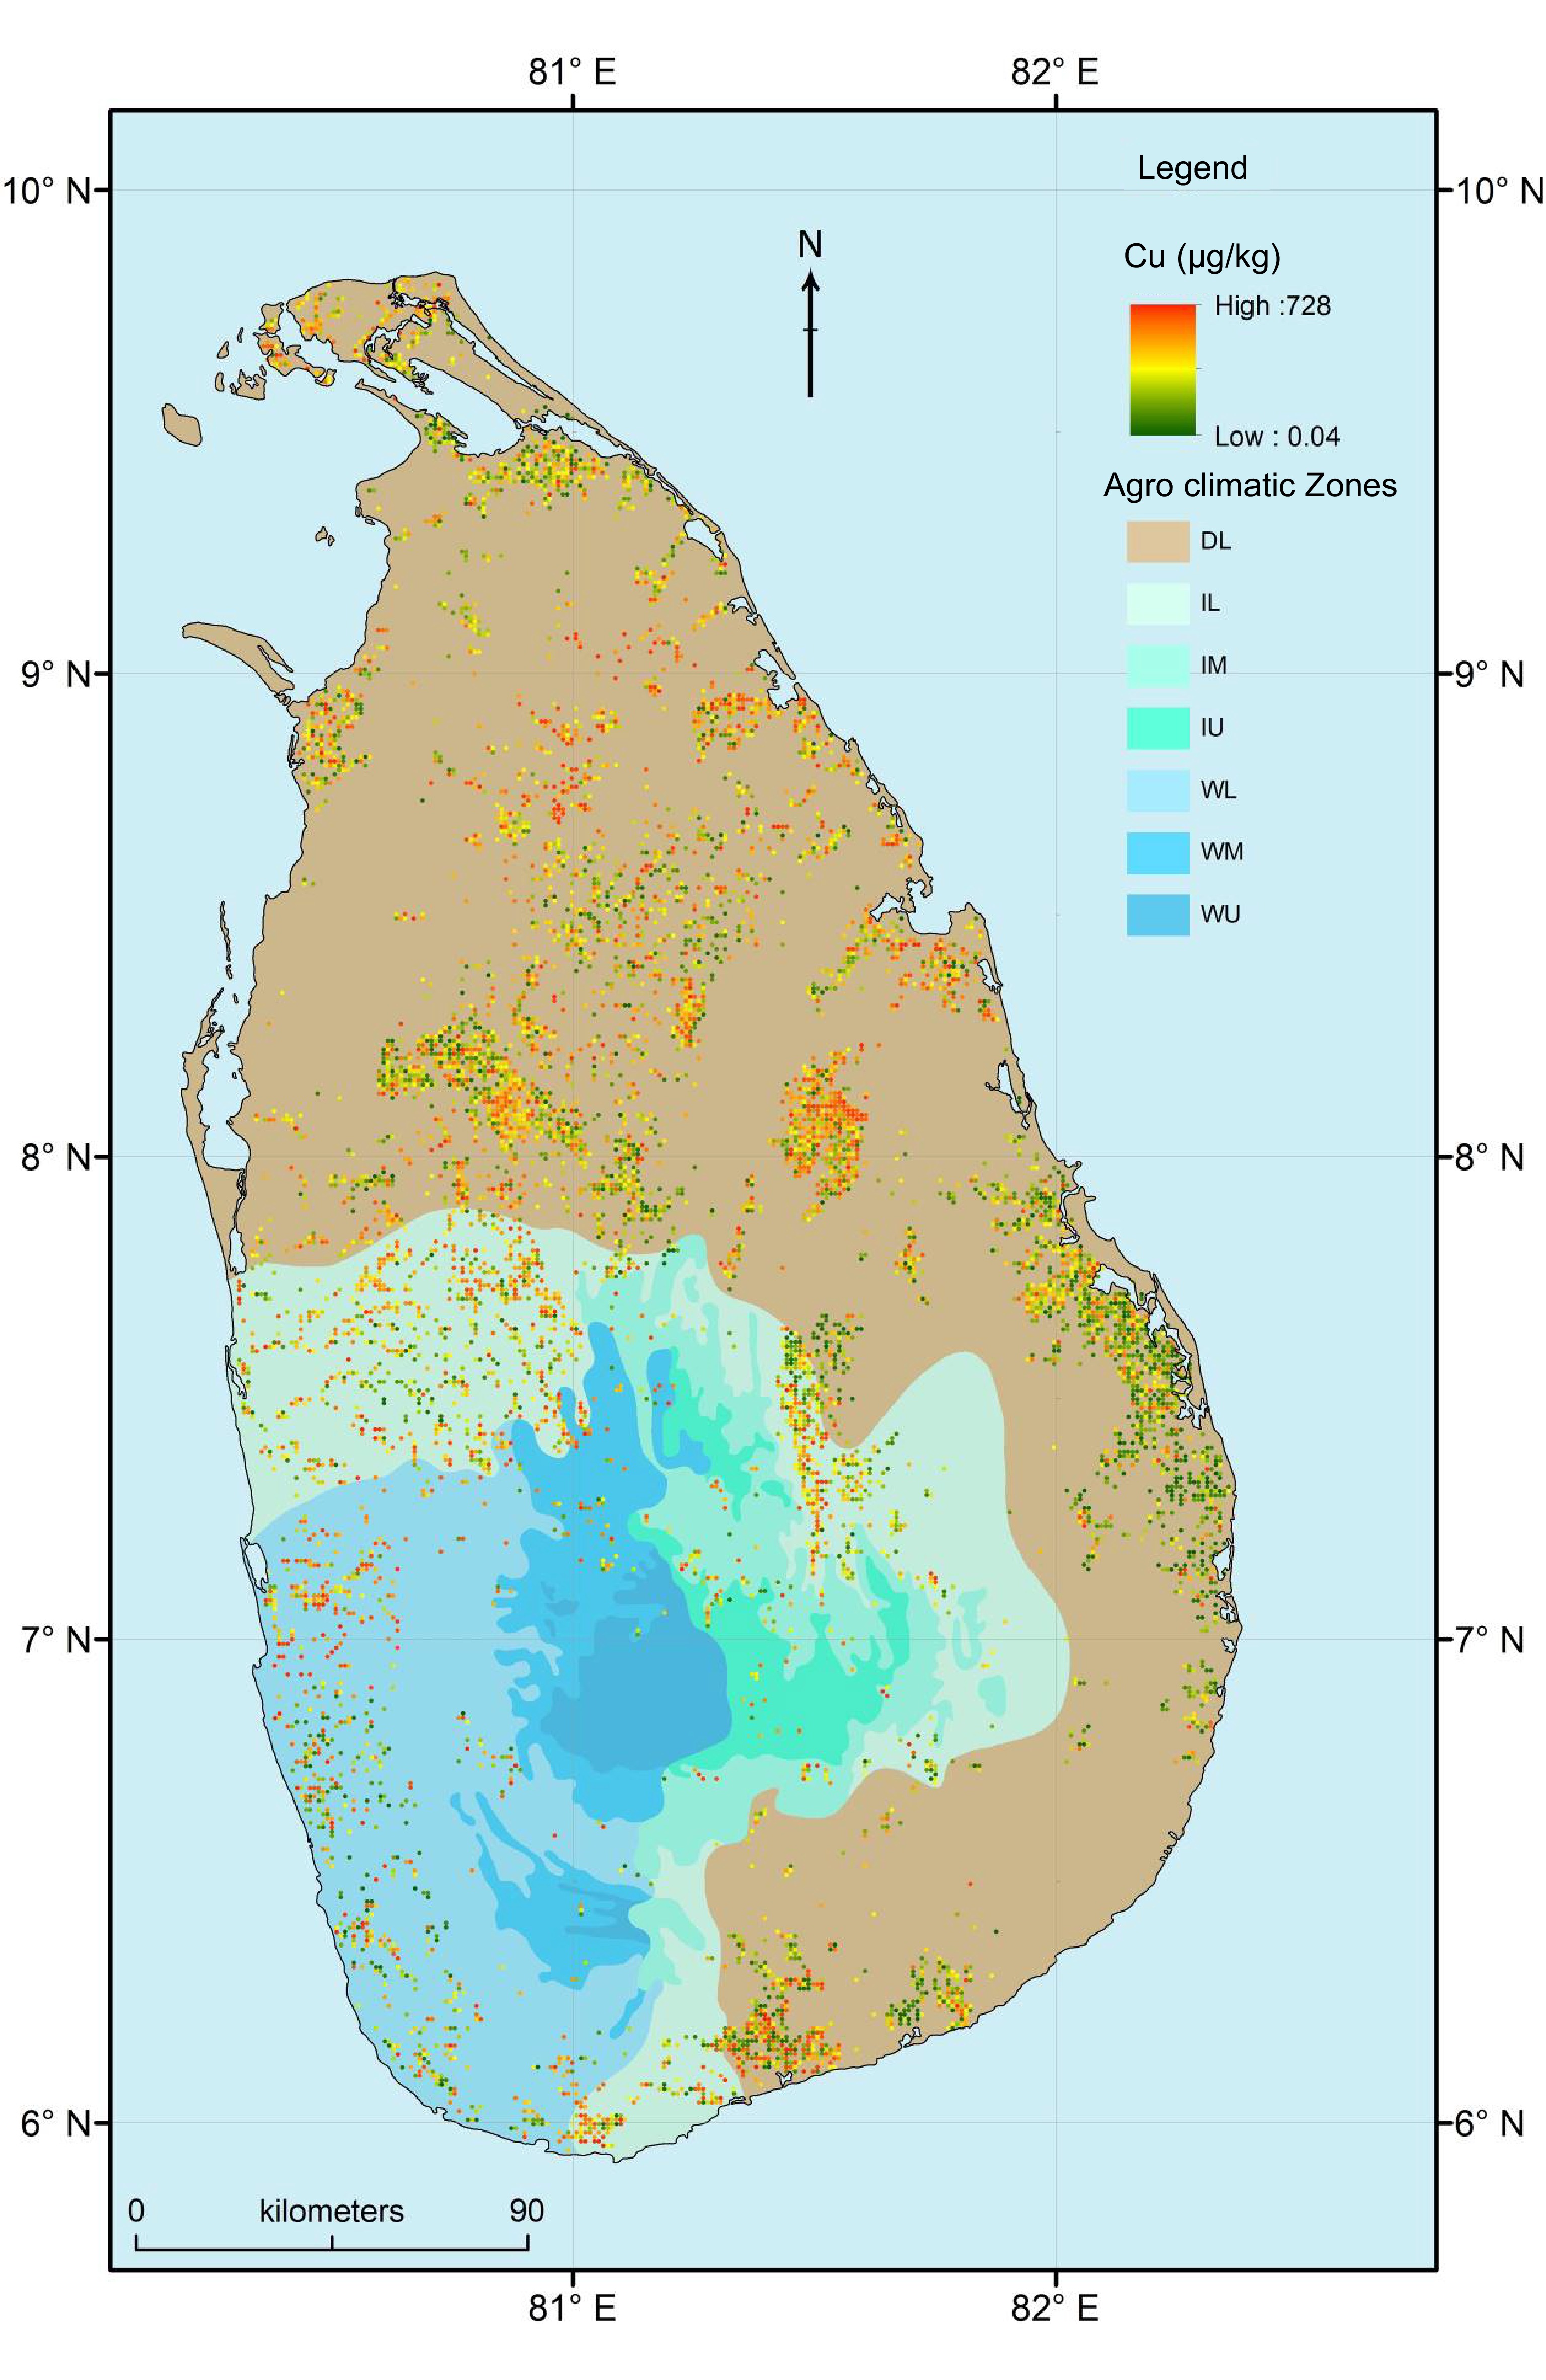
Figure 3.
Spatial distribution of copper (Cu) concentration in the paddy fields used to cultivate rice in different agro-climatic zones of Sri Lanka. Note: DL, Dry zone Low country; IL, Intermediate zone Low country; IM, Intermediate zone Mid country; IU, Intermediate zone Up country; WL, Wet zone Low country; WM, Wet zone Mid country.
When compare soil orders, exchangeable Cu concentration between Entisols, Histosols, Inceptisols, Untisols and Vertisols was similar (p > 0.05). Moreover, Cu concentration in Histosols was higher than that in Alfisols (p < 0.05) (Fig. 2c). There was a significant interaction between ACZ and soil orders when determining Cu concentration in soil (p < 0.05). Both DL and IL had five soil orders, IM and WL had four soil orders, and IU and WM had three and two soil orders, respectively (Figs 4 & 5). Entisoils and Ultisols were observed in all the ACZs while Vertisols was found only in a localized region in the DL (Figs 4 & 5). Moreover, Alfisols was found in four out of five ACZs. In DL, Inceptisols and Vertisols had higher Cu concentration while that in Entisols was lower (p < 0.05) (Fig. 5). Entisols was largely found in the low-lying flat terrain as localized patches close to the coastal regions of the DL while Alfisols was the major soil type found in the DL (Figs 3 & 4). In IL, IM, IU and WM Cu concentration between the soil orders was similar (p > 0.05) (Fig. 5). In WL, Cu concentration in Alfisols and Entisols was higher than that in Histosols (p < 0.05) (Fig. 5). Moreover, Ultisols and Entisols were the dominant soil orders found in WL (Figs 3 & 4).
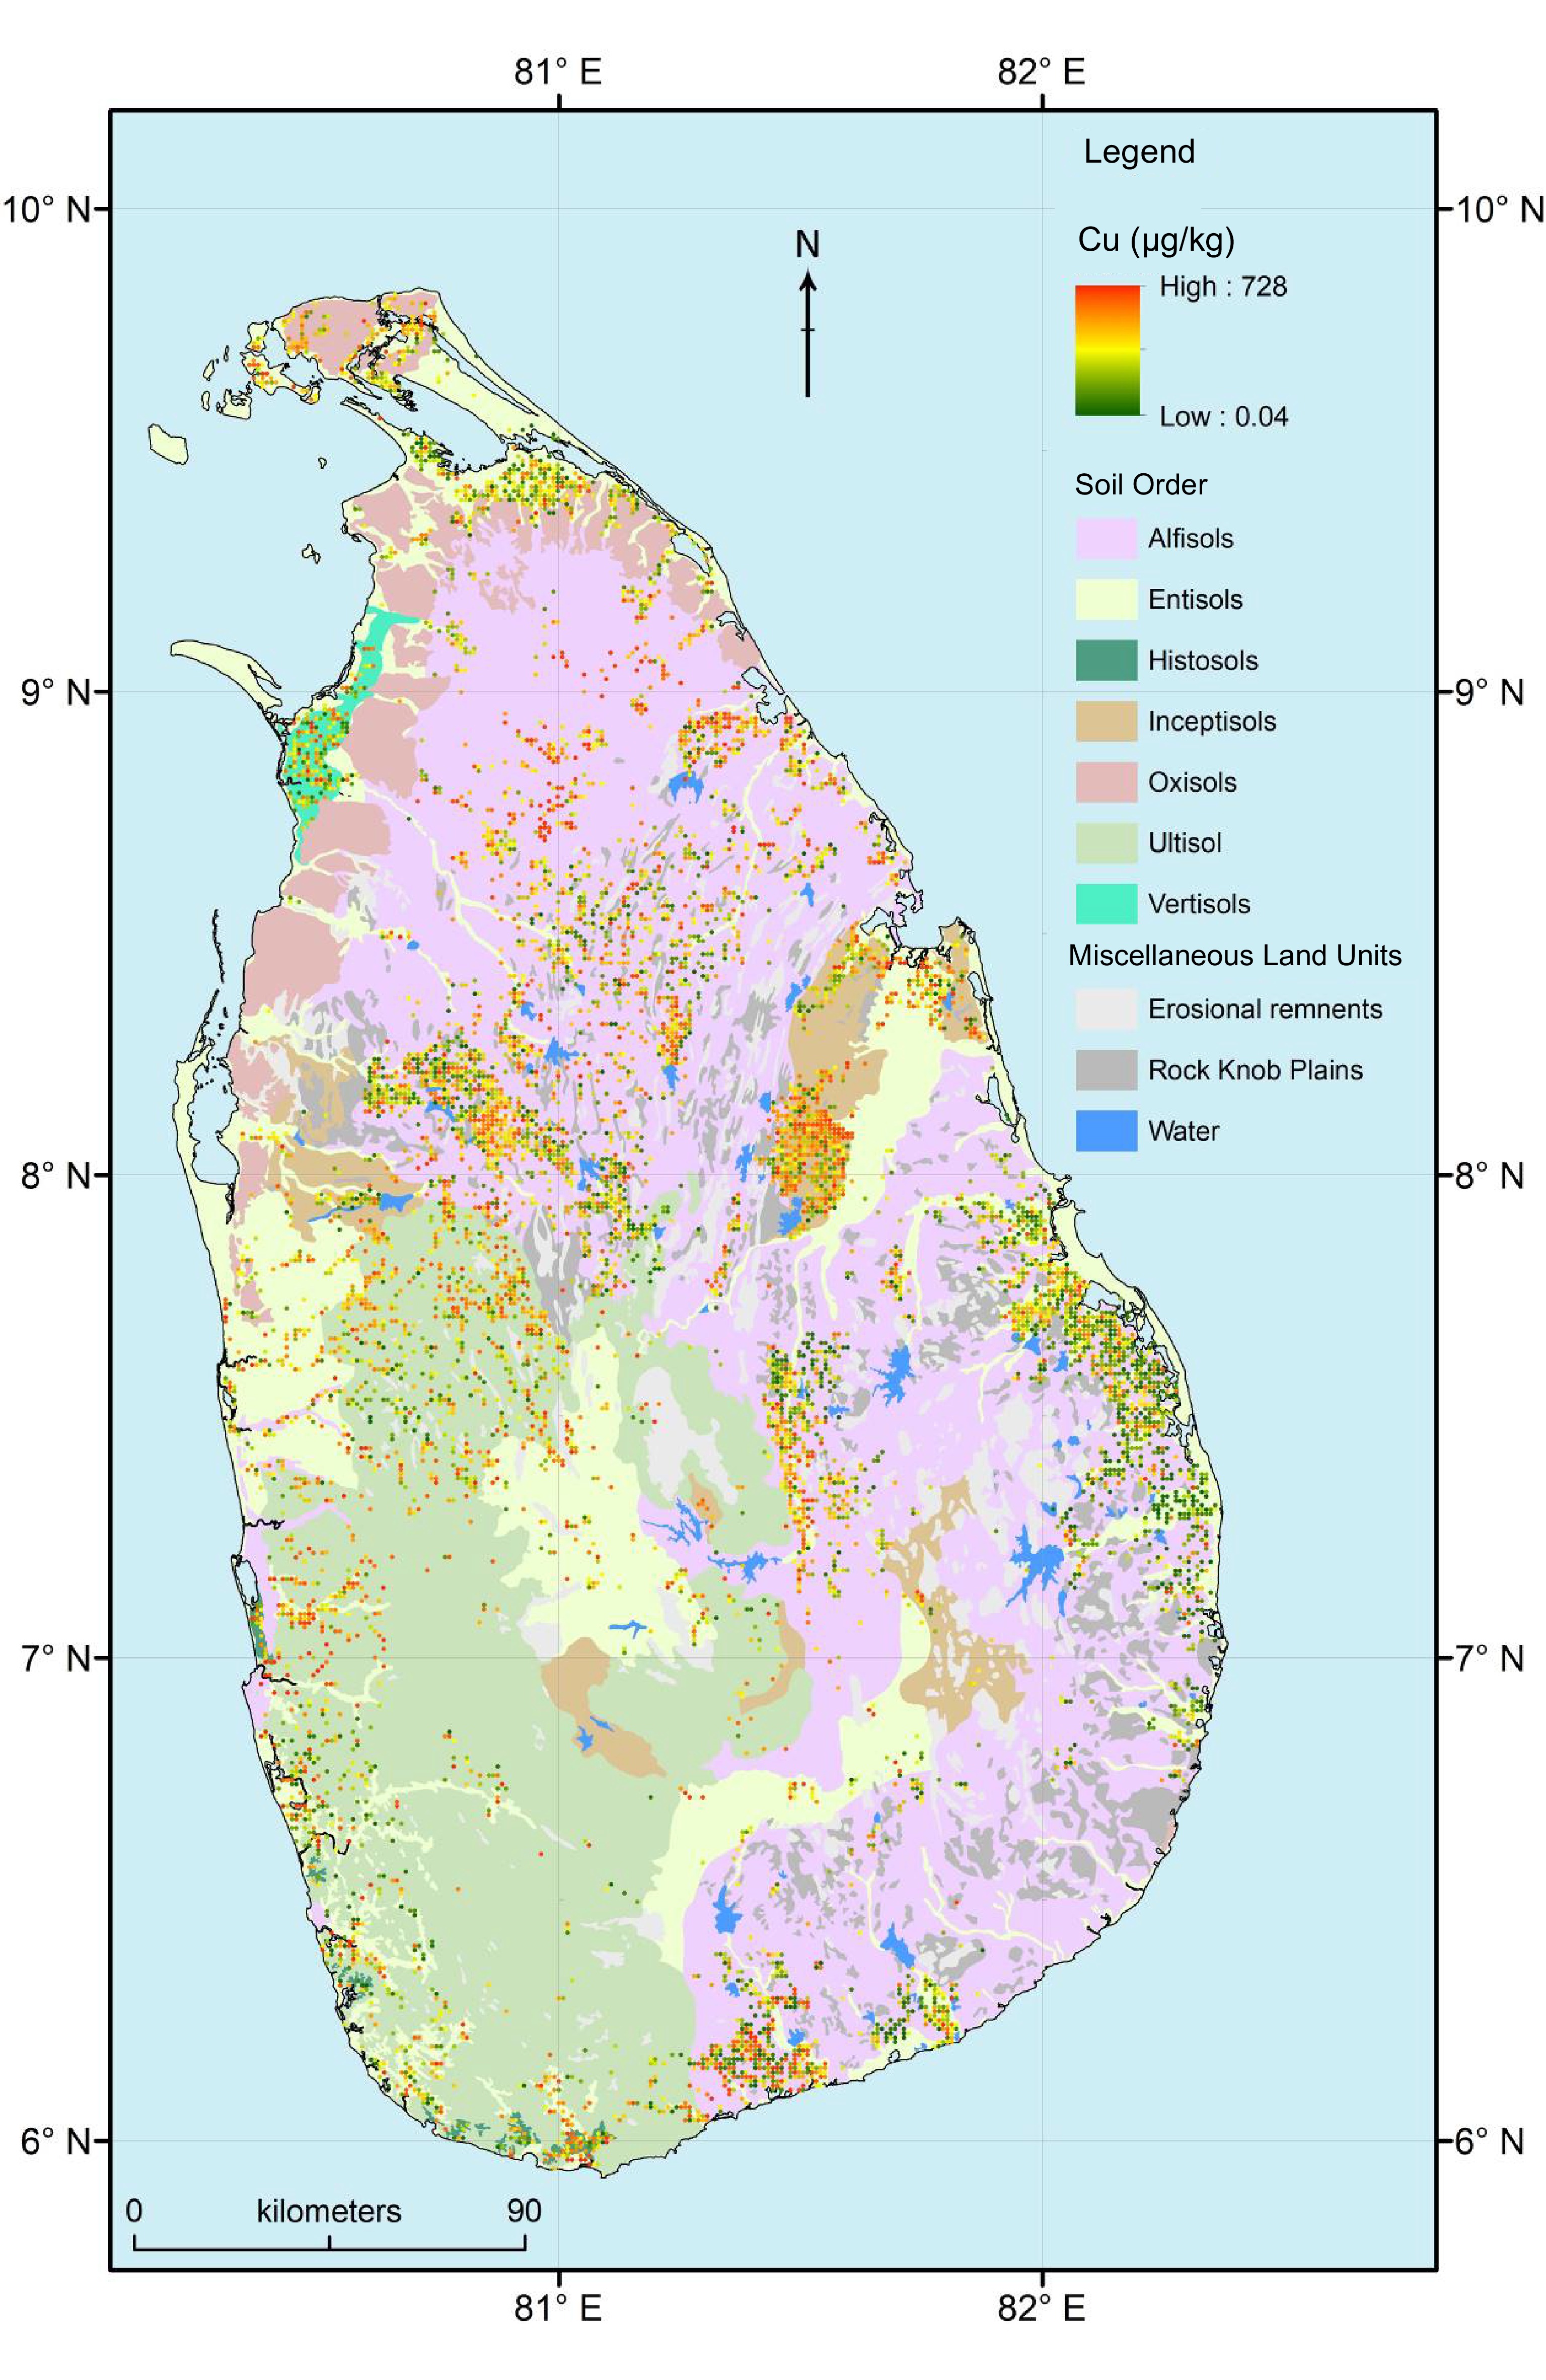
Figure 4.
Spatial distribution of copper (Cu) concentration in the paddy fields used to cultivate rice under different soil orders of Sri Lanka.
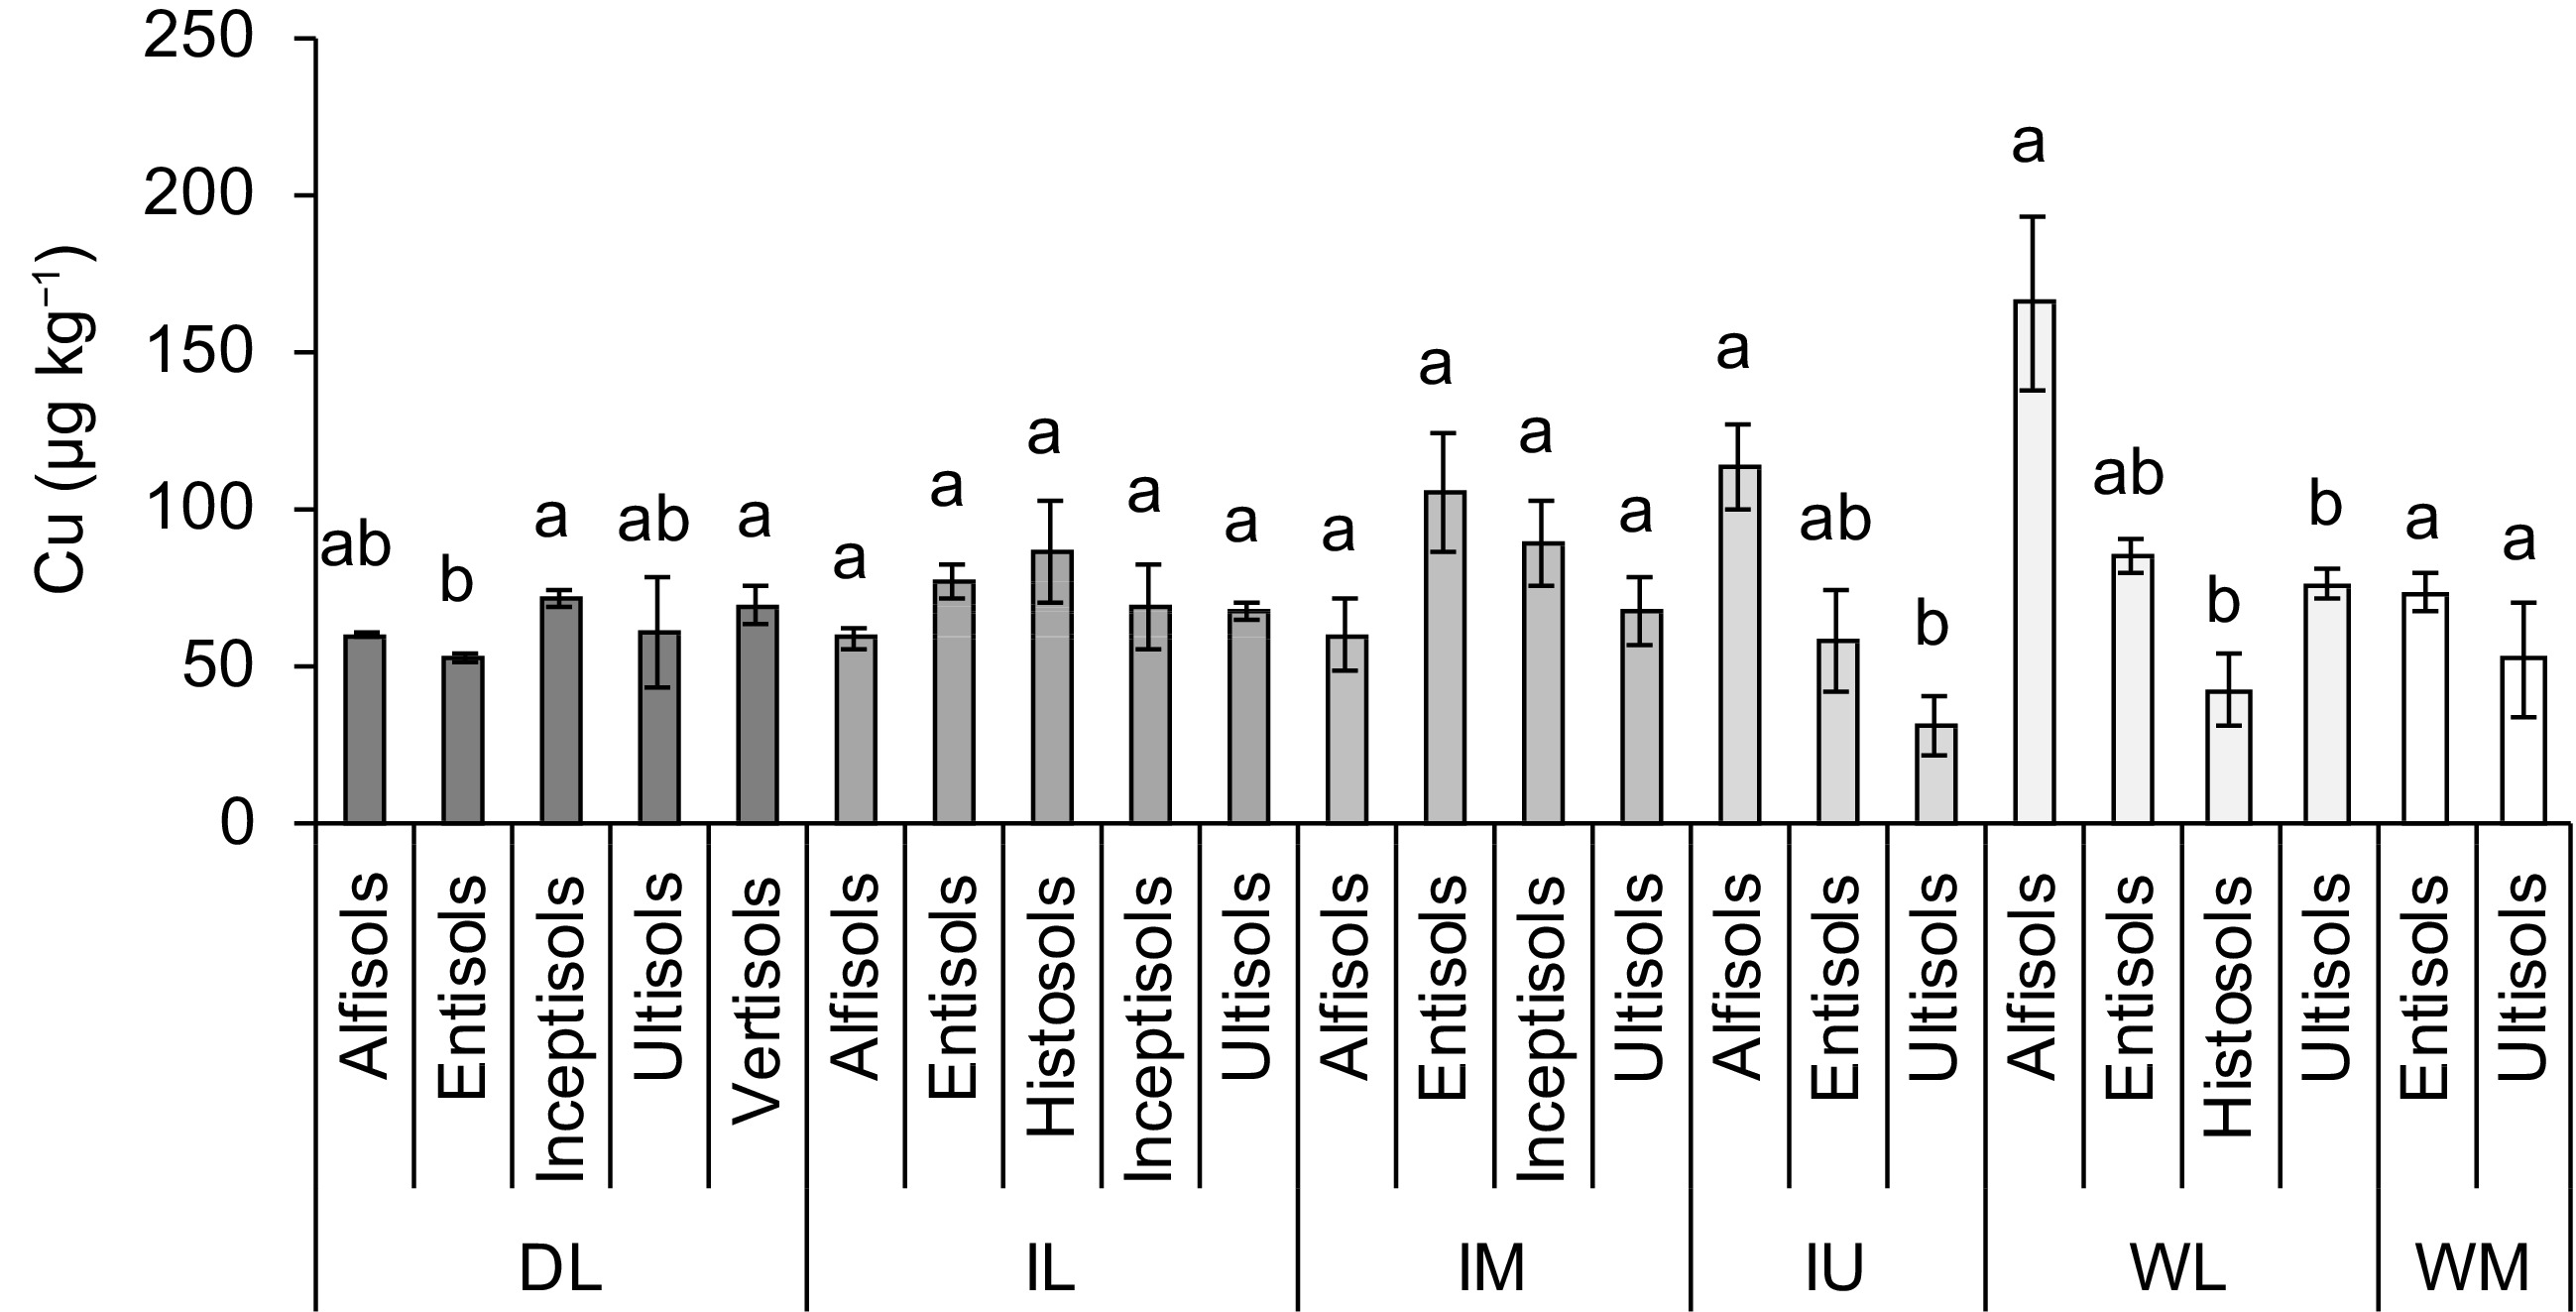
Figure 5.
Concentration of copper (Cu) in the paddy fields used to cultivate rice in different soil orders and agro-climatic zones (ACZ) of Sri Lanka (mean ± SE). Note: DL, Dry zone Low country; IL, Intermediate zone Low country; IM, Intermediate zone Mid country; IU,Intermediate zone Up country; WL,Wet zone Low country; WM, Wet zone Mid country. Different letters over the bars, within each ACZ, indicate statistically significant difference at p < 0.05.
There was a significant interaction between ACZ and water source when determining exchangeable Cu concentration in soil (p < 0.05). When major and minor irrigation schemes provided water for rice cultivation in four ACZs, rainfed paddy fields were observed in all six ACZs (Fig. 6). When compare paddy fields receiving water from different sources within each ACZ, Cu concentration among the soils collected from those three water sources was similar (p > 0.05).
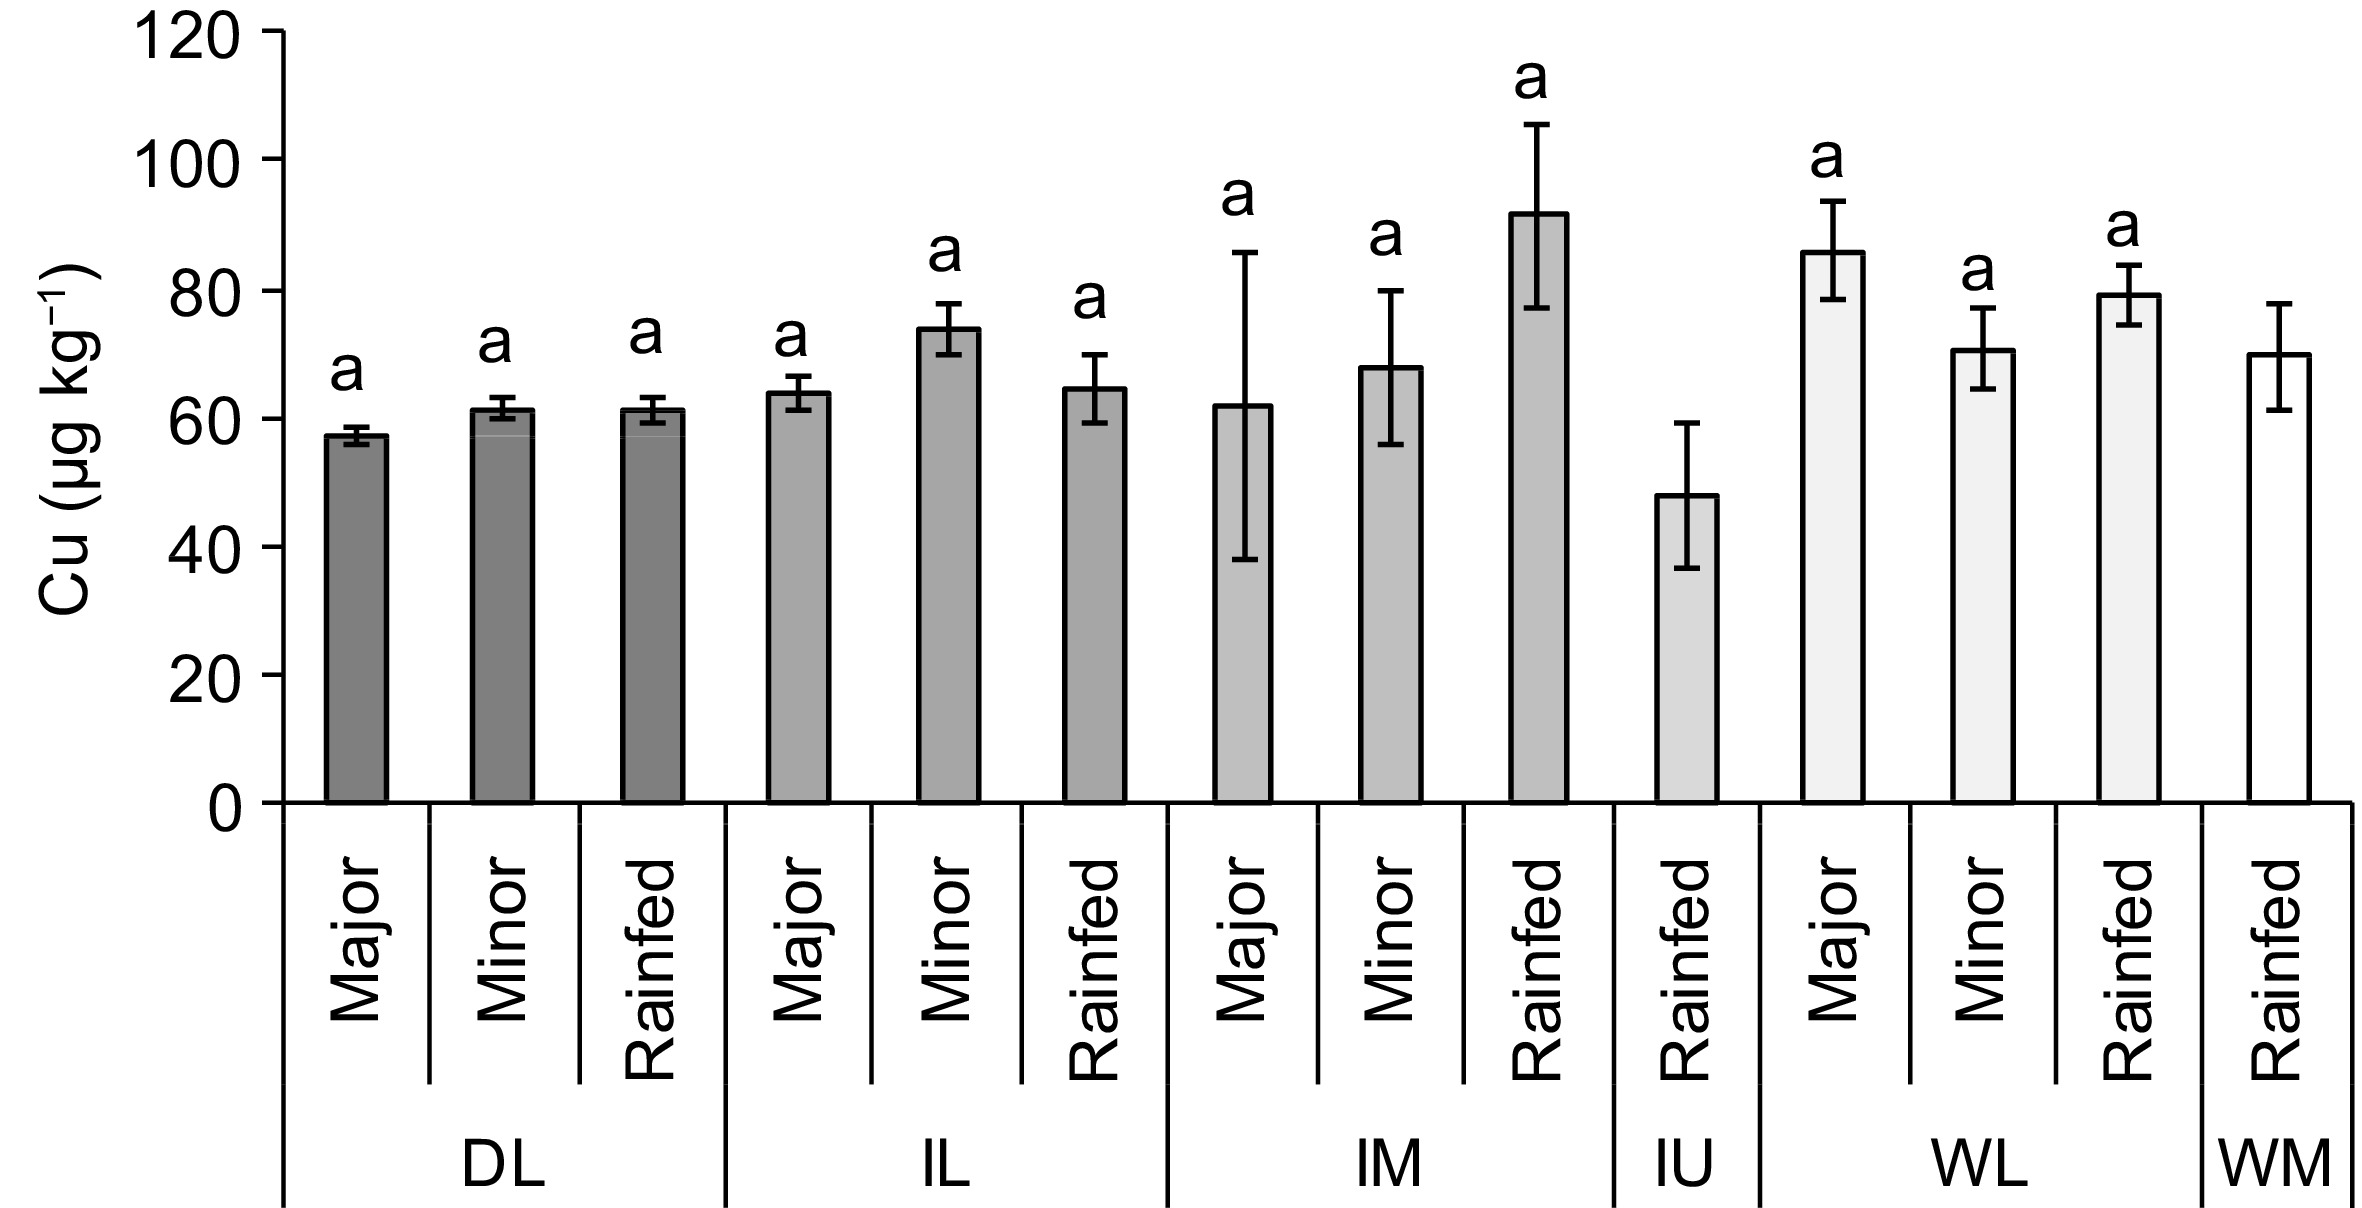
Figure 6.
Concentration of copper (Cu) in the paddy fields used to cultivate rice using different water sources and agro-climatic zones (ACZ) of Sri Lanka (mean ± SE). Note: DL, Dry zone Low country; IL, Intermediate zone Low country; IM, Intermediate zone Mid country; IU, Intermediate zone Up country; WL, Wet zone Low country; WM, Wet zone Mid country. Different letters over the bars, within each ACZ, indicate statistically significant difference at p < 0.05.
There was a significant positive correlation between soil Cu concentration and pH (Fig. 7). Moreover, the relationship between the soil Cu concentration and grain yield was not significant (p > 0.05).
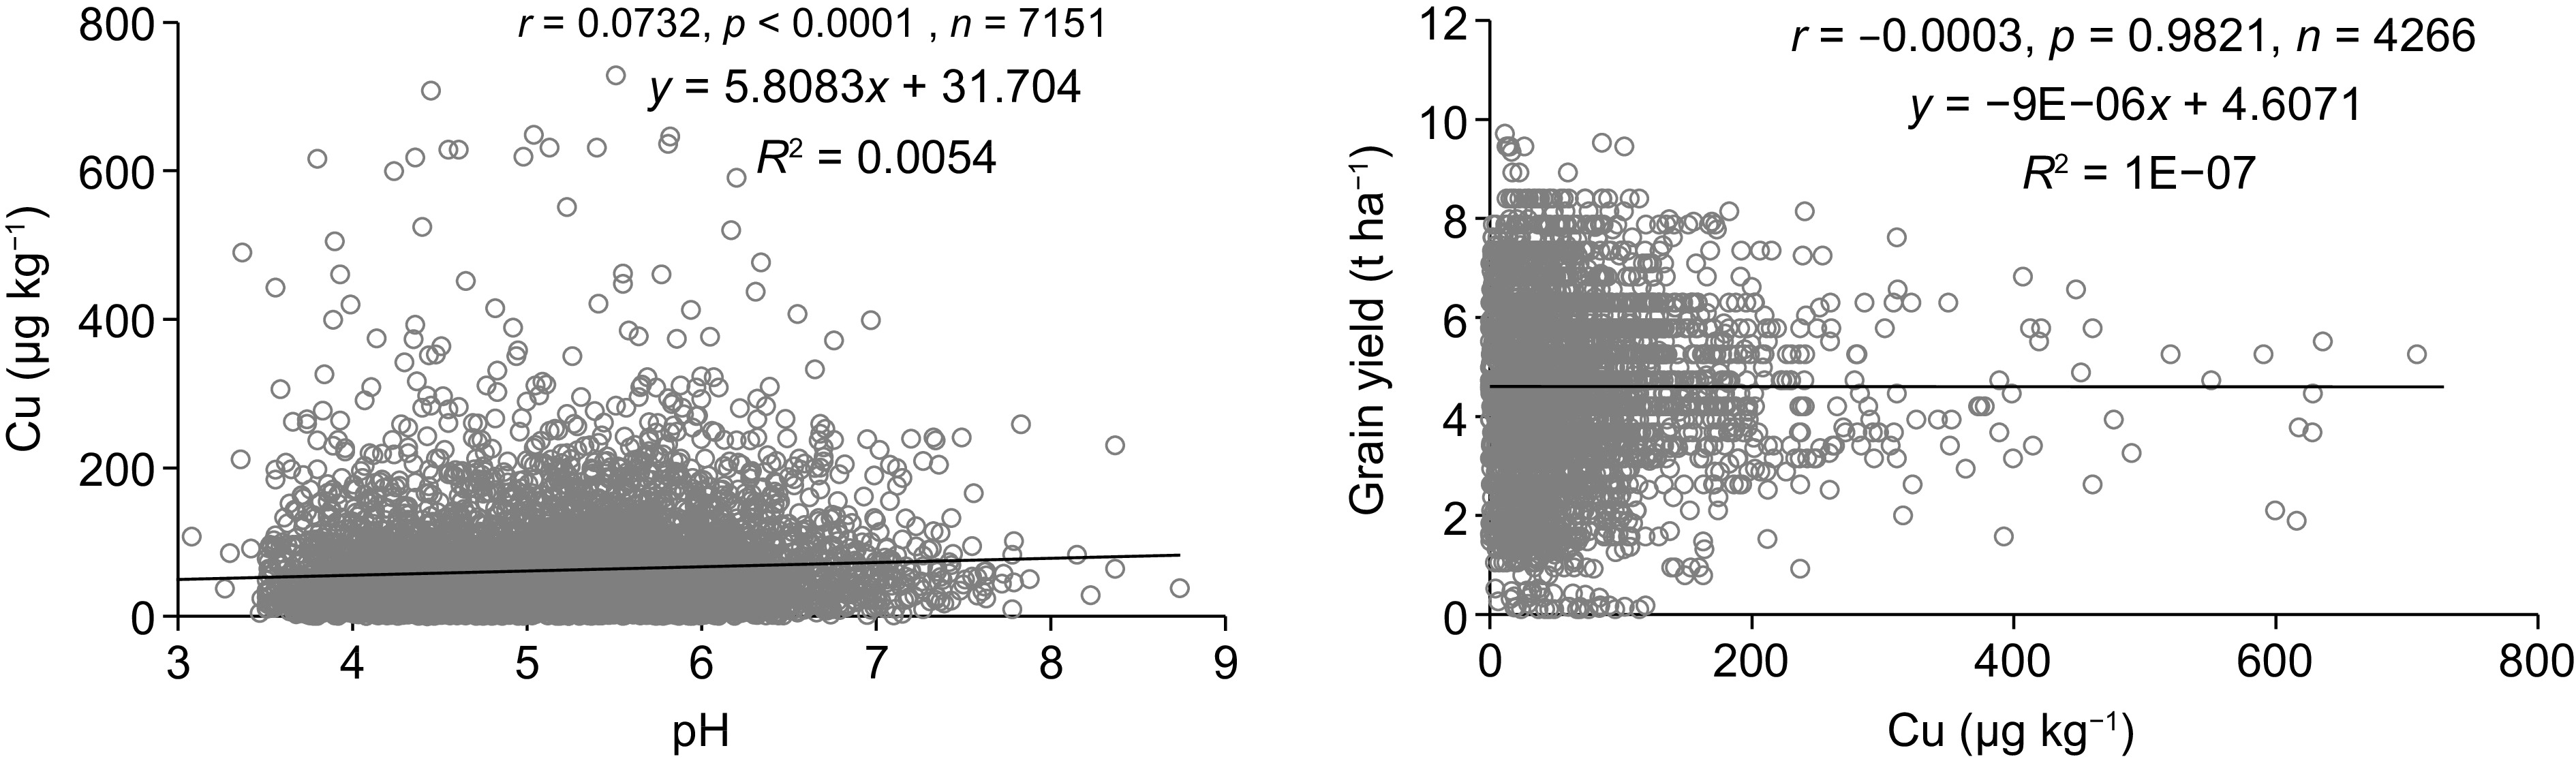
Figure 7.
Relationships of copper (Cu) concentration with pH of lowland paddy cultivated soils and grain yield.
-
Most of the Sri Lankan paddy soil samples tested in the current study were deficient in exchangeable Cu concentration, i.e. according to previous reports, exchangeable Cu concentration of 200–300 µg kg−1 in paddy soil is considered the critical level for Cu deficiency[11]. Almost 95% of the soil samples tested had Cu concentration of less than 200 µg·kg−1 indicating widespread Cu deficiency. Moreover, tissue Cu concentration of 5–20 mg·kg−1 is considered as required to ensure optimal growth of rice[31]. If tissue Cu concentration is at a deficient level, high spikelet sterility, growth reduction, and yield loss, even up to 20%, have been reported[11,31]. Deficiency of Cu may also develop due to the effects of climate, crop genotype, and management practices[22,31−33]. Therefore, the impact of some of these factors in determining exchangeable Cu concentration in Sri Lankan paddy soils was assessed.
The main factors affecting the difference among climatic zones are rainfall and temperature[34]. It has also been reported that the exchangeable Cu concentration in Sri Lankan rice soils differ between Dry and Wet zones[35]. Supporting their observations, the present study reported that the soil exchangeable Cu concentration decreased in the order of WZ > IZ > DZ. When considering the exact concentrations, values reported in the current study were lower than previous findings[35]. This may be due to the differences in the extraction and detection methods used in the two studies i.e. the current study used 0.01 M CaCl2 as the extractant and ICP-MS as the detection method, while others used 1 M HCl as the extractant and Atomic Absorption Spectrophotometer (AAS) as the detection method[35]. However, when acidic extractants are used organically bound Cu is also extracted and the exchangeable Cu concentration can be overestimated[36]. Even so, both studies recorded the highest and lowest Cu concentrations in Wet and Dry zone soils, respectively. This spatial heterogeneity of exchangeable Cu concentration based on climatic differences needs to be considered when managing and improving Cu nutrition in Sri Lankan rice soils.
Rotation of rice and vegetables in the lowlands, depending on the availability of water for rice cultivation, is predominant in Wet and Intermediate zones of Sri Lanka while vegetables are not widely grown in rotation with rice in the Dry zone. Copper concentration in rice soil is highly dependent on the application of fertilizers and other agrochemicals[9,37]. Farmers usually apply high amounts of organic matter including poultry manure to vegetable crops which contains a considerable amount of bioavailable trace elements including Cu. As a result, soils in rice-vegetable cropping systems may contain higher amounts of Cu than other cropping systems[14,38]. Moreover, the application of fungicidal sprays that contain Cu may also increase the accumulation of Cu in rice soil. It has also been reported that the decomposition of organic matter produces humic substances including humic acid and fulvic acid which compose functional groups to bind with Cu and thereby, form insoluble complexes[20,32]. Therefore, the rates of organic matter application and decomposition along with other soil and crop management practices adopted determine the exchangeable Cu concentration in soil.
Apart from climatic factors, spatial variability of soil Cu concentration can be due to the inherited soil parent material and topography[9,34]. Even though several soil orders were observed in each ACZ in the present study, exchangeable Cu concentration was less variable among soil orders with few exceptions e.g., Alfisols and Entisols in WL contain high Cu concentration compared to other soil orders and ACZ. Contamination of rice soil is high in WL since it is located in urban areas where high amounts of municipal and industrial wastewater are released[39]. Therefore, surface run-off of urban affluent may attributed to high Cu concentration in WL[40]. Compared to Alfisols and Entisols, Histosls has low soil Cu concentration. Histosols has been identified as a soil which is generally deficient in Cu due to the high organic matter content[11]. Ultisols, the dominant soil order in WL, has a high Cu adsorption capacity due to the presence of high organic carbon, clay content, CEC and Fe/Al oxides[41]. Therefore, exchangeable Cu fraction is low in Ultisols as a large faction of Cu is bound to Fe/Mn oxides through adsorption, co-precipitation, ion exchange and penetration into crystals[36,41]. North-east and eastern parts of Sri Lanka consist of an extensively developed mineralized belt with immense Cu minerals[42]. However, soils of these areas contain low exchangeable Cu concentration due to the presence of sandy textured soil and limestone with high pH[34].
The relationship between soil Cu and grain yield indicated that low soil exchangeable Cu concentration had not limited the grain yield of rice under tested soil conditions. This may also be due to the limitation of other soil factors, including soil pH, EC, and the availability of other nutrients such as potassium[33]. Soil moisture content is a key determinant of the distribution of Cu in soil, as it changes redox potential, pH and Fe/Al oxides of paddy soil[41,43]. For instance, high water content increases bacterial mediated reducible Cu fraction in soil[41,43]. In addition, water logged conditions increases soil pH and thereby, reduces Cu solubility due to the binding of Cu with organic matter and metal oxides forming insoluble complexes[11,41,43]. In contrast, at low soil pH, release of Cu into the soil is more prominent due to the lack of H+ for adsorption[16]. However, in the present study soil exchangeable Cu concentration had a weak positive correlation with soil pH. This may be due to the confounding effects of soil pH with ACZ, soil orders, water, and crop management strategies adopted by the farmers. However, further researches are warranted to explore these interactive effects.
Copper deficiency can be prevented through crop, soil, and fertilizer management practices. As a short-term strategy, the negative impacts of Cu deficiency could be overcome by adding Cu as a foliar application[44]. In addition, lime and organic matter application need to be minimized since they inhibit Cu uptake[11]. Moreover, application of rice straw ash should also be minimized as it retards Cu bioavailability[13]. As a fertilizer supplementation, CuO or CuSO4 can be applied. It has been proven that suspension of roots of rice seedlings in 1% CuSO4 solution prior to transplantation shows promising results avoiding Cu deficiency[11]. Application of municipal waste water or sewage sludge may also provide micro nutrients such as Cu[32,44]. It has also been reported that sewage sludge does not improve bioavailable Cu concentrations in soil[20]. Therefore, testing the composition of municipal wastewater or sewage sludge is required before the application to ensure the provision of nutrients deficient in the soil as well as to avoid the application of toxic trace elements such as As, Cd, and Pb[45].
Plants have evolved various mechanisms to cope with the deficient and toxic effects of mineral elements in their environment[22]. These mechanisms are aimed at maintaining the balance of essential mineral elements in the plant's tissues and organs. Exploration of these mechanisms in crop improvement programs is a sustainable and long-term strategy to cultivate rice in Cu-deficient soils. Therefore, a combination of new breeding strategies with proper management practices will be the best approach for Cu nutrient management in rice.
-
As observed in the current study, almost 95% of soil samples recorded exchangeable Cu concentrations less than the optimal range for rice cultivation indicating the paddy fields of Sri Lanka are deficient in plant-available Cu. It was affected by ACZs, soil orders, water sources, and their interactions. There was a spatial heterogeneity of soil Cu distribution, the highest Cu concentration was observed in WZ and the lowest in DZ. Among the soil orders Entisols, Histosols, Inceptisols, Ultisols, and Vertisols had similar Cu concentrations. Water sources used for rice cultivation did not affect the exchangeable Cu concentration within each ACZ. Spatial maps were generated using a large number of samples in the current work. Therefore, these maps could be used to identify the areas with low and high Cu levels in the country and make area-specific agronomic and administrative decisions. As the concentration of exchangeable Cu was low, it is important to implement strategies to avoid further decline or improve the concentrations of Cu to ensure higher rice crop productivity. Key strategies include the addition of Cu as a foliar or soil application, the application of municipal wastewater or sewage sludge, and minimizing the application of lime, organic matter, and rice straw ash.
-
The authors confirm contribution to the paper as follows: study conception and design: Suriyagoda L, Kadupitiya H, Rathnayake U, Ariyaratne M; data collection: Suriyagoda L, Madushan R, Beneragama C, Chandrasekara C, Chandrajith R, Thilakasiri R, Ariyaratne M; statistical analysis: Suriyagoda L. All authors contributed to the writing the article, reviewed the results and approved the final version of the manuscript.
-
The datasets generated during and/or analyzed during the current study are available from the corresponding author on reasonable request.
This work was supported by the World Bank under the Accelerating Higher Education Expansion and Development Grant (AHEAD) (Grant No. AHEAD/RA3/DOR/AGRI/PERA-No16).
-
The authors declare that they have no conflict of interest.
- Supplemental Tables S1 The number of soil samples collected from each climatic zone (CZ), agro climatic zone (ACZ) and soil order to test exchangeable copper (Cu) concentrations in paddy soils.
- Supplemental Tables S2 The number of soil samples collected from each climatic zone (CZ), agro climatic zone (ACZ) and water source to test exchangeable copper (Cu) concentrations in paddy soils.
- Copyright: © 2024 by the author(s). Published by Maximum Academic Press, Fayetteville, GA. This article is an open access article distributed under Creative Commons Attribution License (CC BY 4.0), visit https://creativecommons.org/licenses/by/4.0/.
-
About this article
Cite this article
Chandrasekara C, Ariyaratne M, Madushan R, Rathnayake U, Thilakasiri R, et al. 2024. Effects of climate, soil and water source on determining exchangeable copper concentration in lowland paddy fields in Sri Lanka. Circular Agricultural Systems 4: e010 doi: 10.48130/cas-0024-0009 

Effects of climate, soil and water source on determining exchangeable copper concentration in lowland paddy fields in Sri Lanka
- Received: 16 October 2023
- Revised: 22 February 2024
- Accepted: 19 March 2024
- Published online: 07 May 2024
Abstract: Copper (Cu) is an essential micronutrient for rice. However, the current status of Cu in Sri Lankan paddy soils is not known. Therefore, the current study was conducted to determine the distribution of exchangeable Cu concentration and examine the interactive effects of the agro-climatic zone (ACZ), soil order, and water source in determining the exchangeable Cu concentration in lowland paddy fields in Sri Lanka. A total of 7,544 soil samples representing six ACZs, six soil orders, and three water sources were collected using a stratified random sampling approach. Soil exchangeable Cu fraction was extracted in 0.01 M CaCl2 and measured using Inductively Coupled Plasma Mass Spectrophotometry. Exchangeable Cu concentration was in the range of 0.04−728 µg·kg−1 with a mean value of 62.4 µg·kg−1. Only 5% of the soil samples tested had Cu concentration greater than 200 µg·kg−1 indicating a widespread Cu deficiency in Sri Lankan paddy fields (i.e. critical level causing Cu deficiency; 200–300 µg·kg−1). Among the climatic zones Wet zone had higher and the Dry zone had lower Cu concentrations. Among the soil orders, histosols had higher and alfisols had lower Cu concentrations. Water sources used for rice cultivation did not determine Cu concentration. Moreover, Cu concentration was positively correlated with soil pH. As most of the soil samples were deficient in soil exchangeable Cu, spatial maps generated in the current work could be used to develop ACZ and soil order-specific agronomic and management strategies to improve soil Cu fertility status.
-
Key words:
- Bioavailability /
- Deficiency /
- Irrigation /
- Mineral nutrition /
- Soil fertility