-
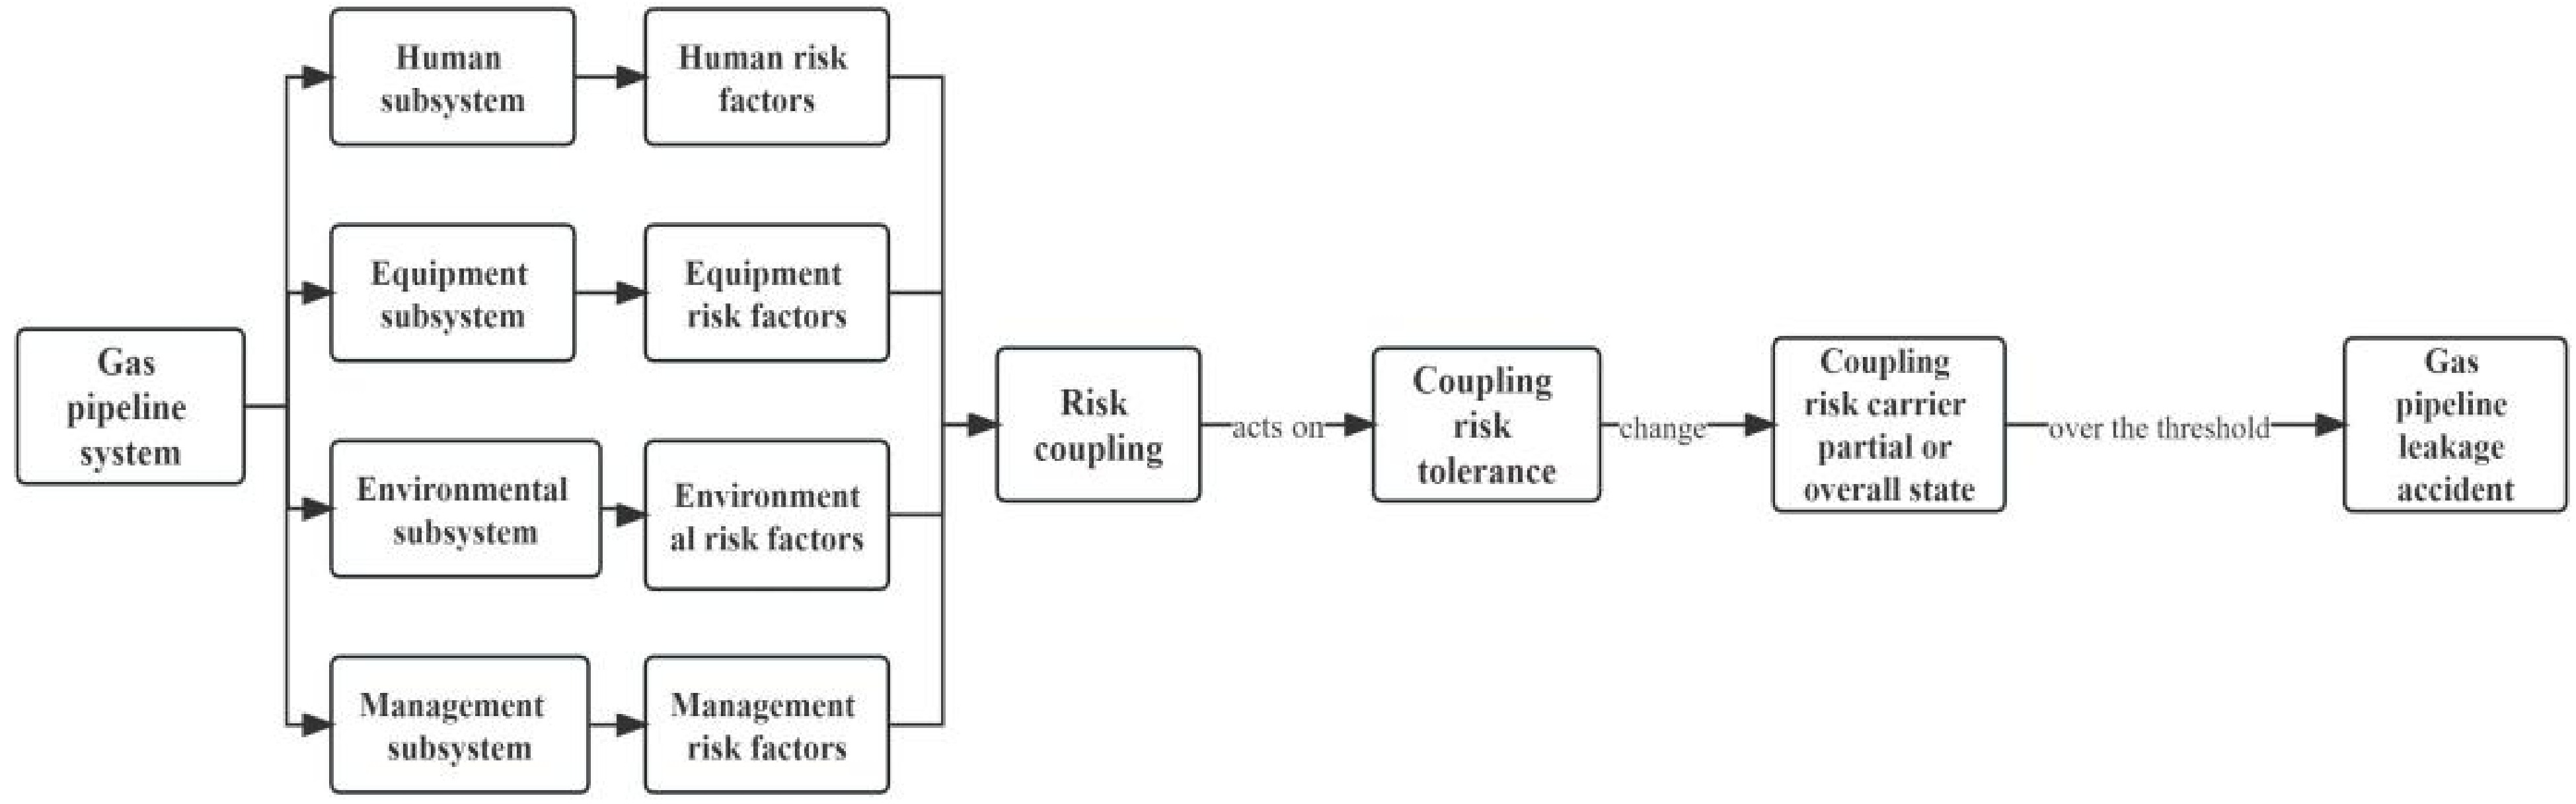
Figure 1.
Relation between the risk tolerance body of the gas pipeline system and each subsystem.
-
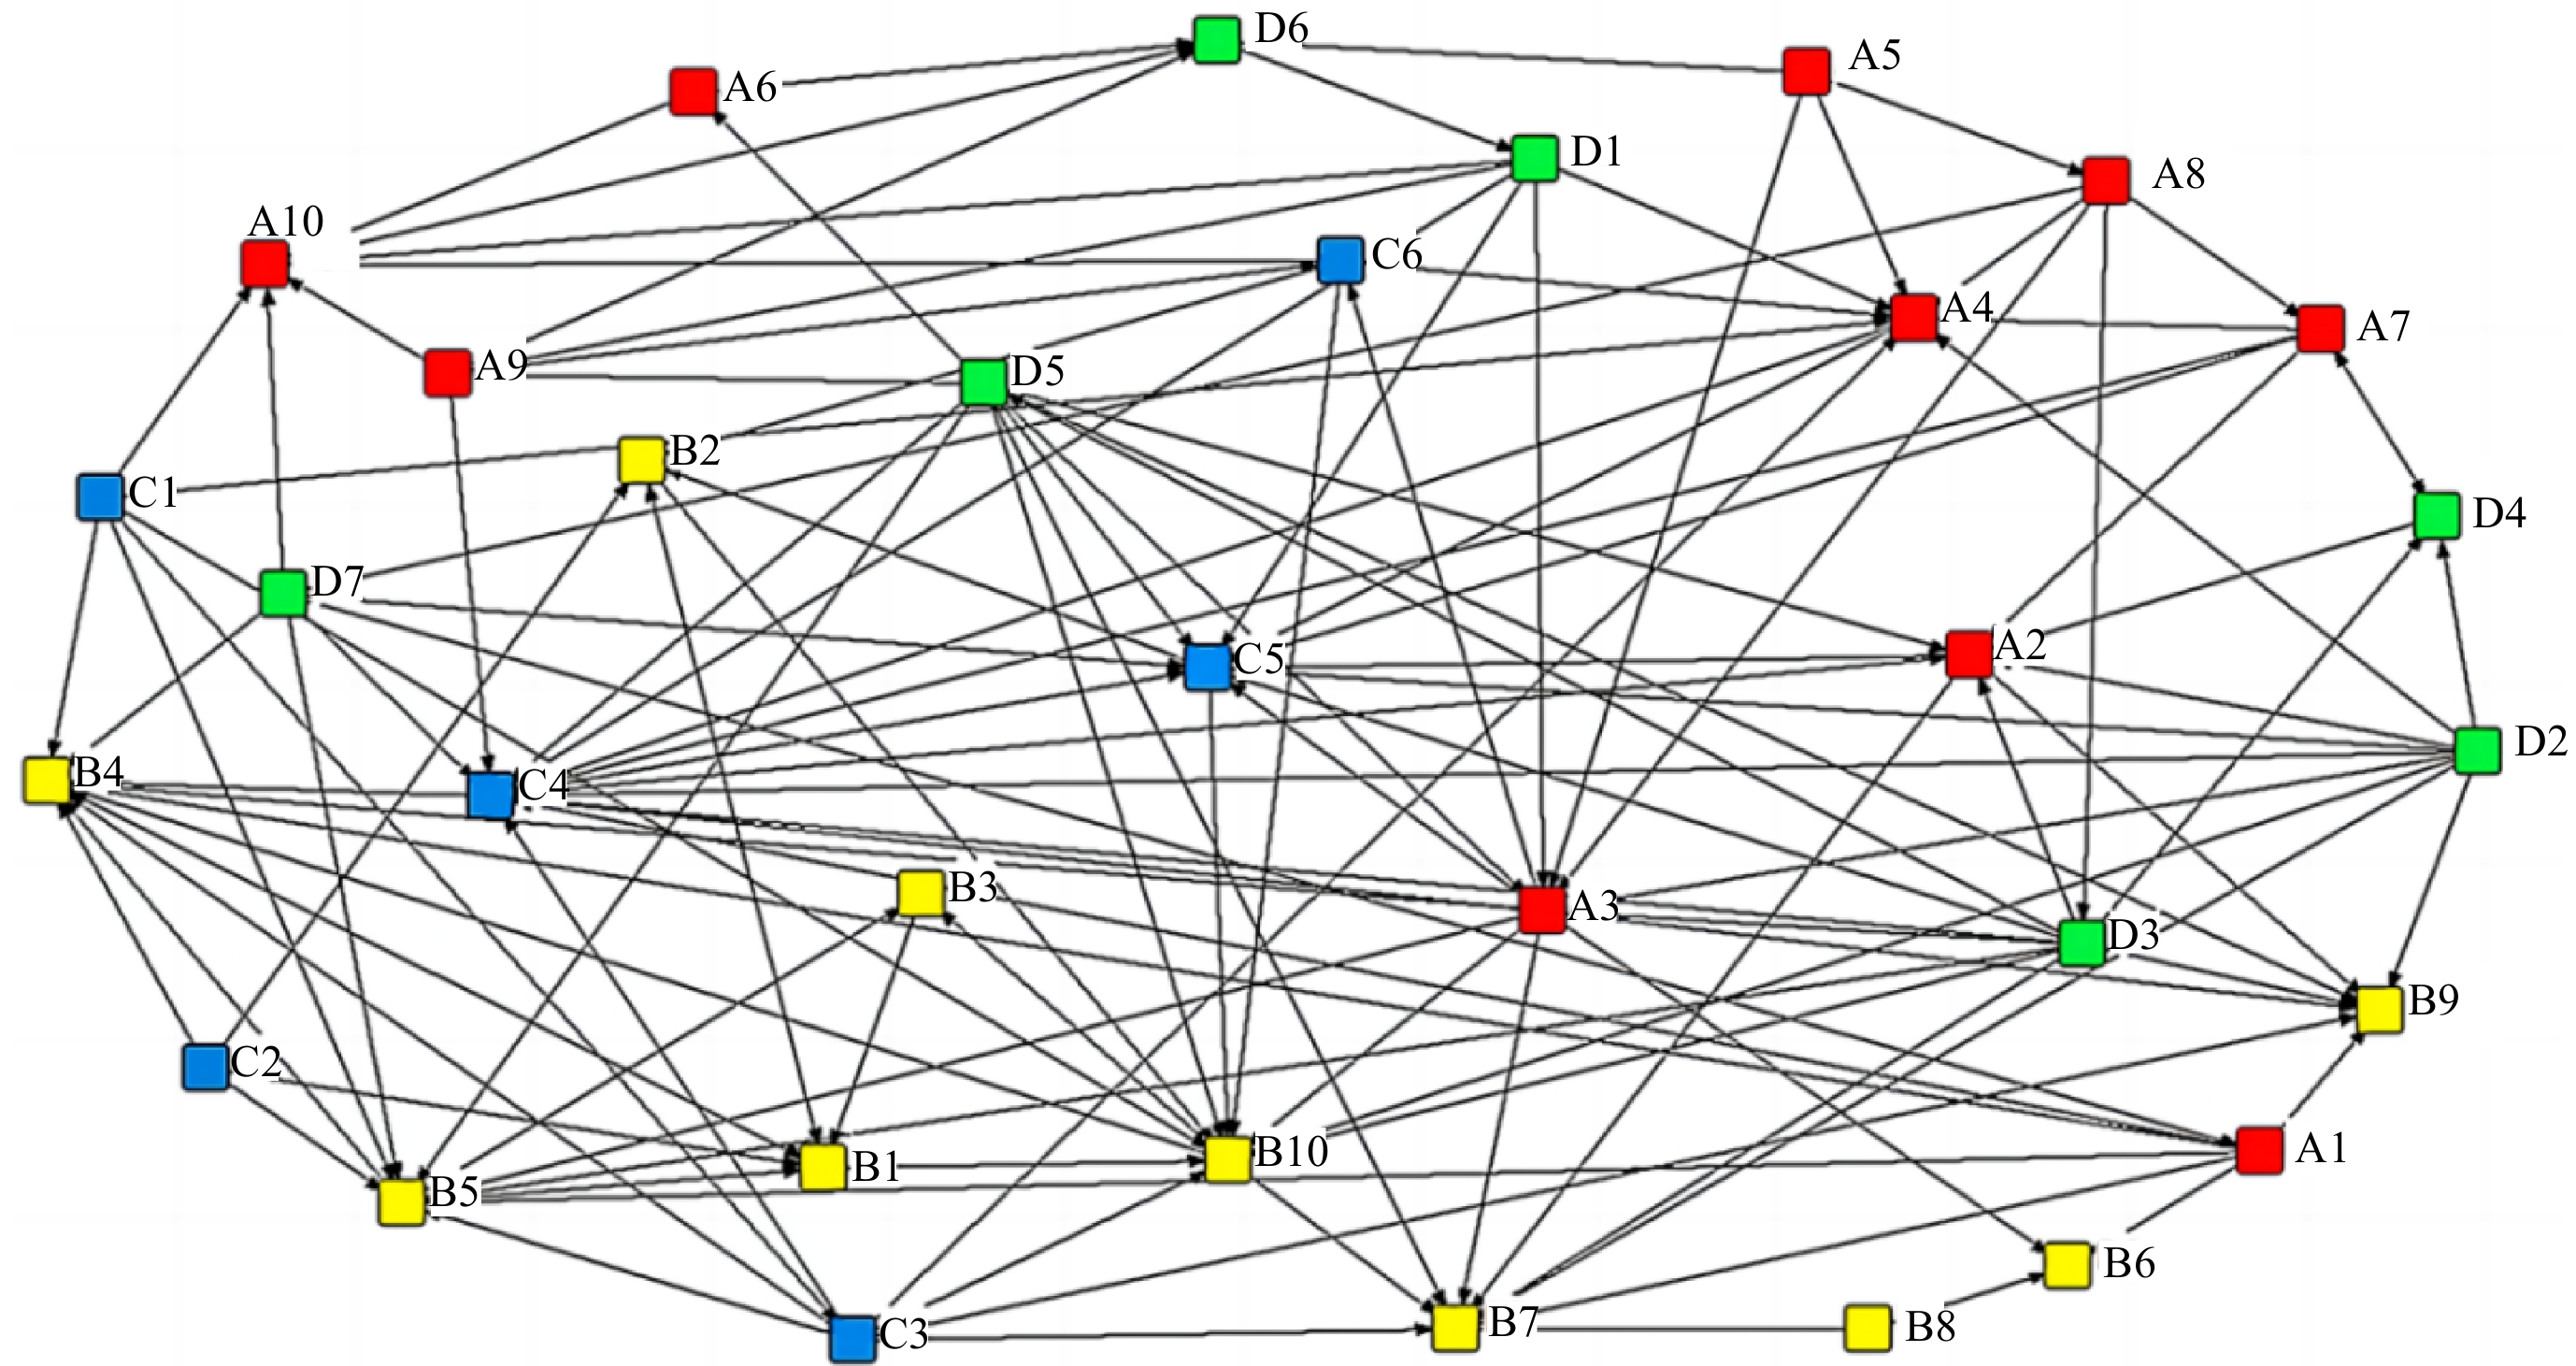
Figure 2.
Node connectivity data matrix.
-
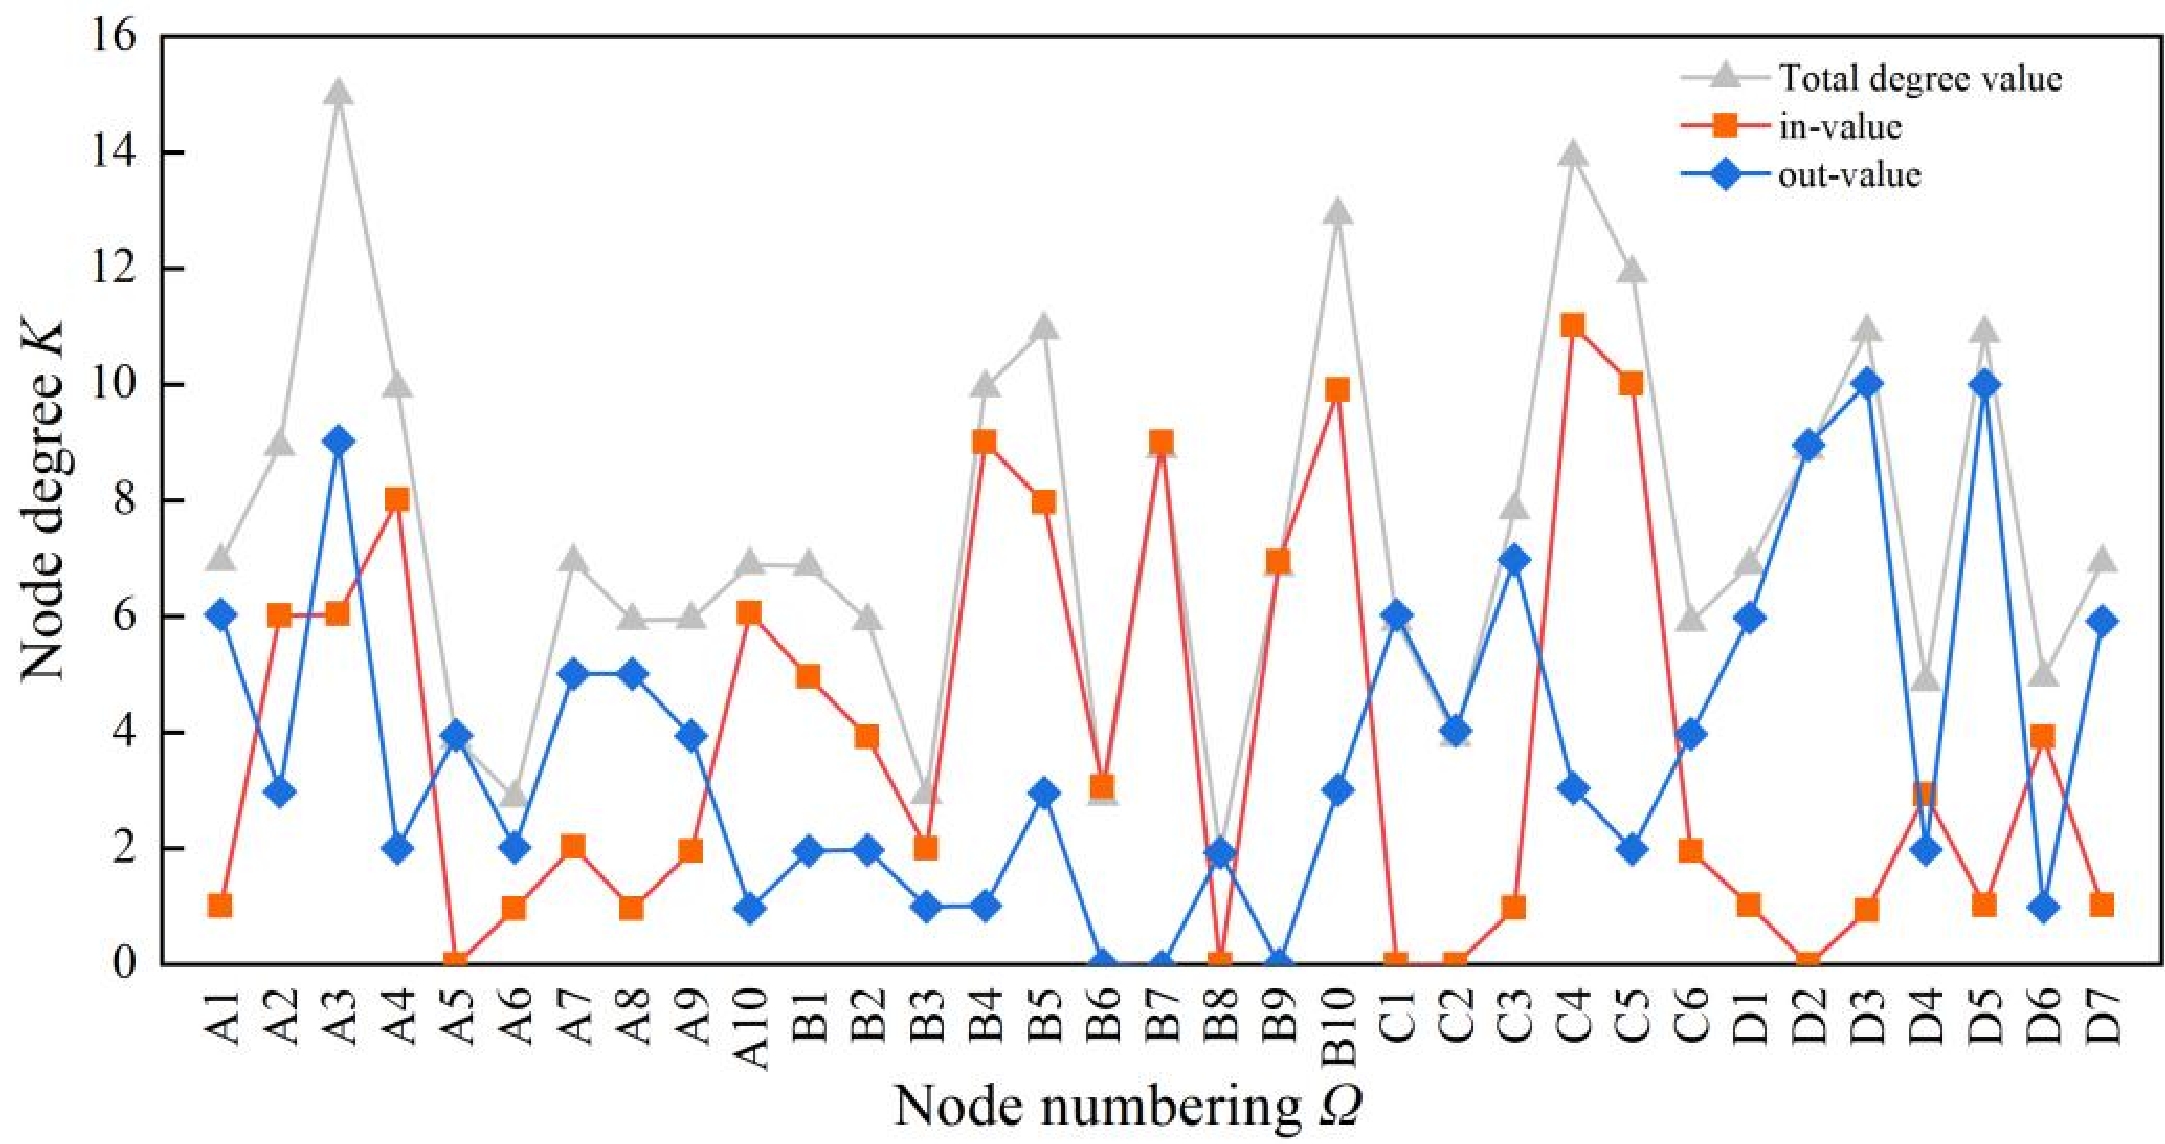
Figure 3.
Multi-factor coupled network model for gas pipeline leakage accidents.
-
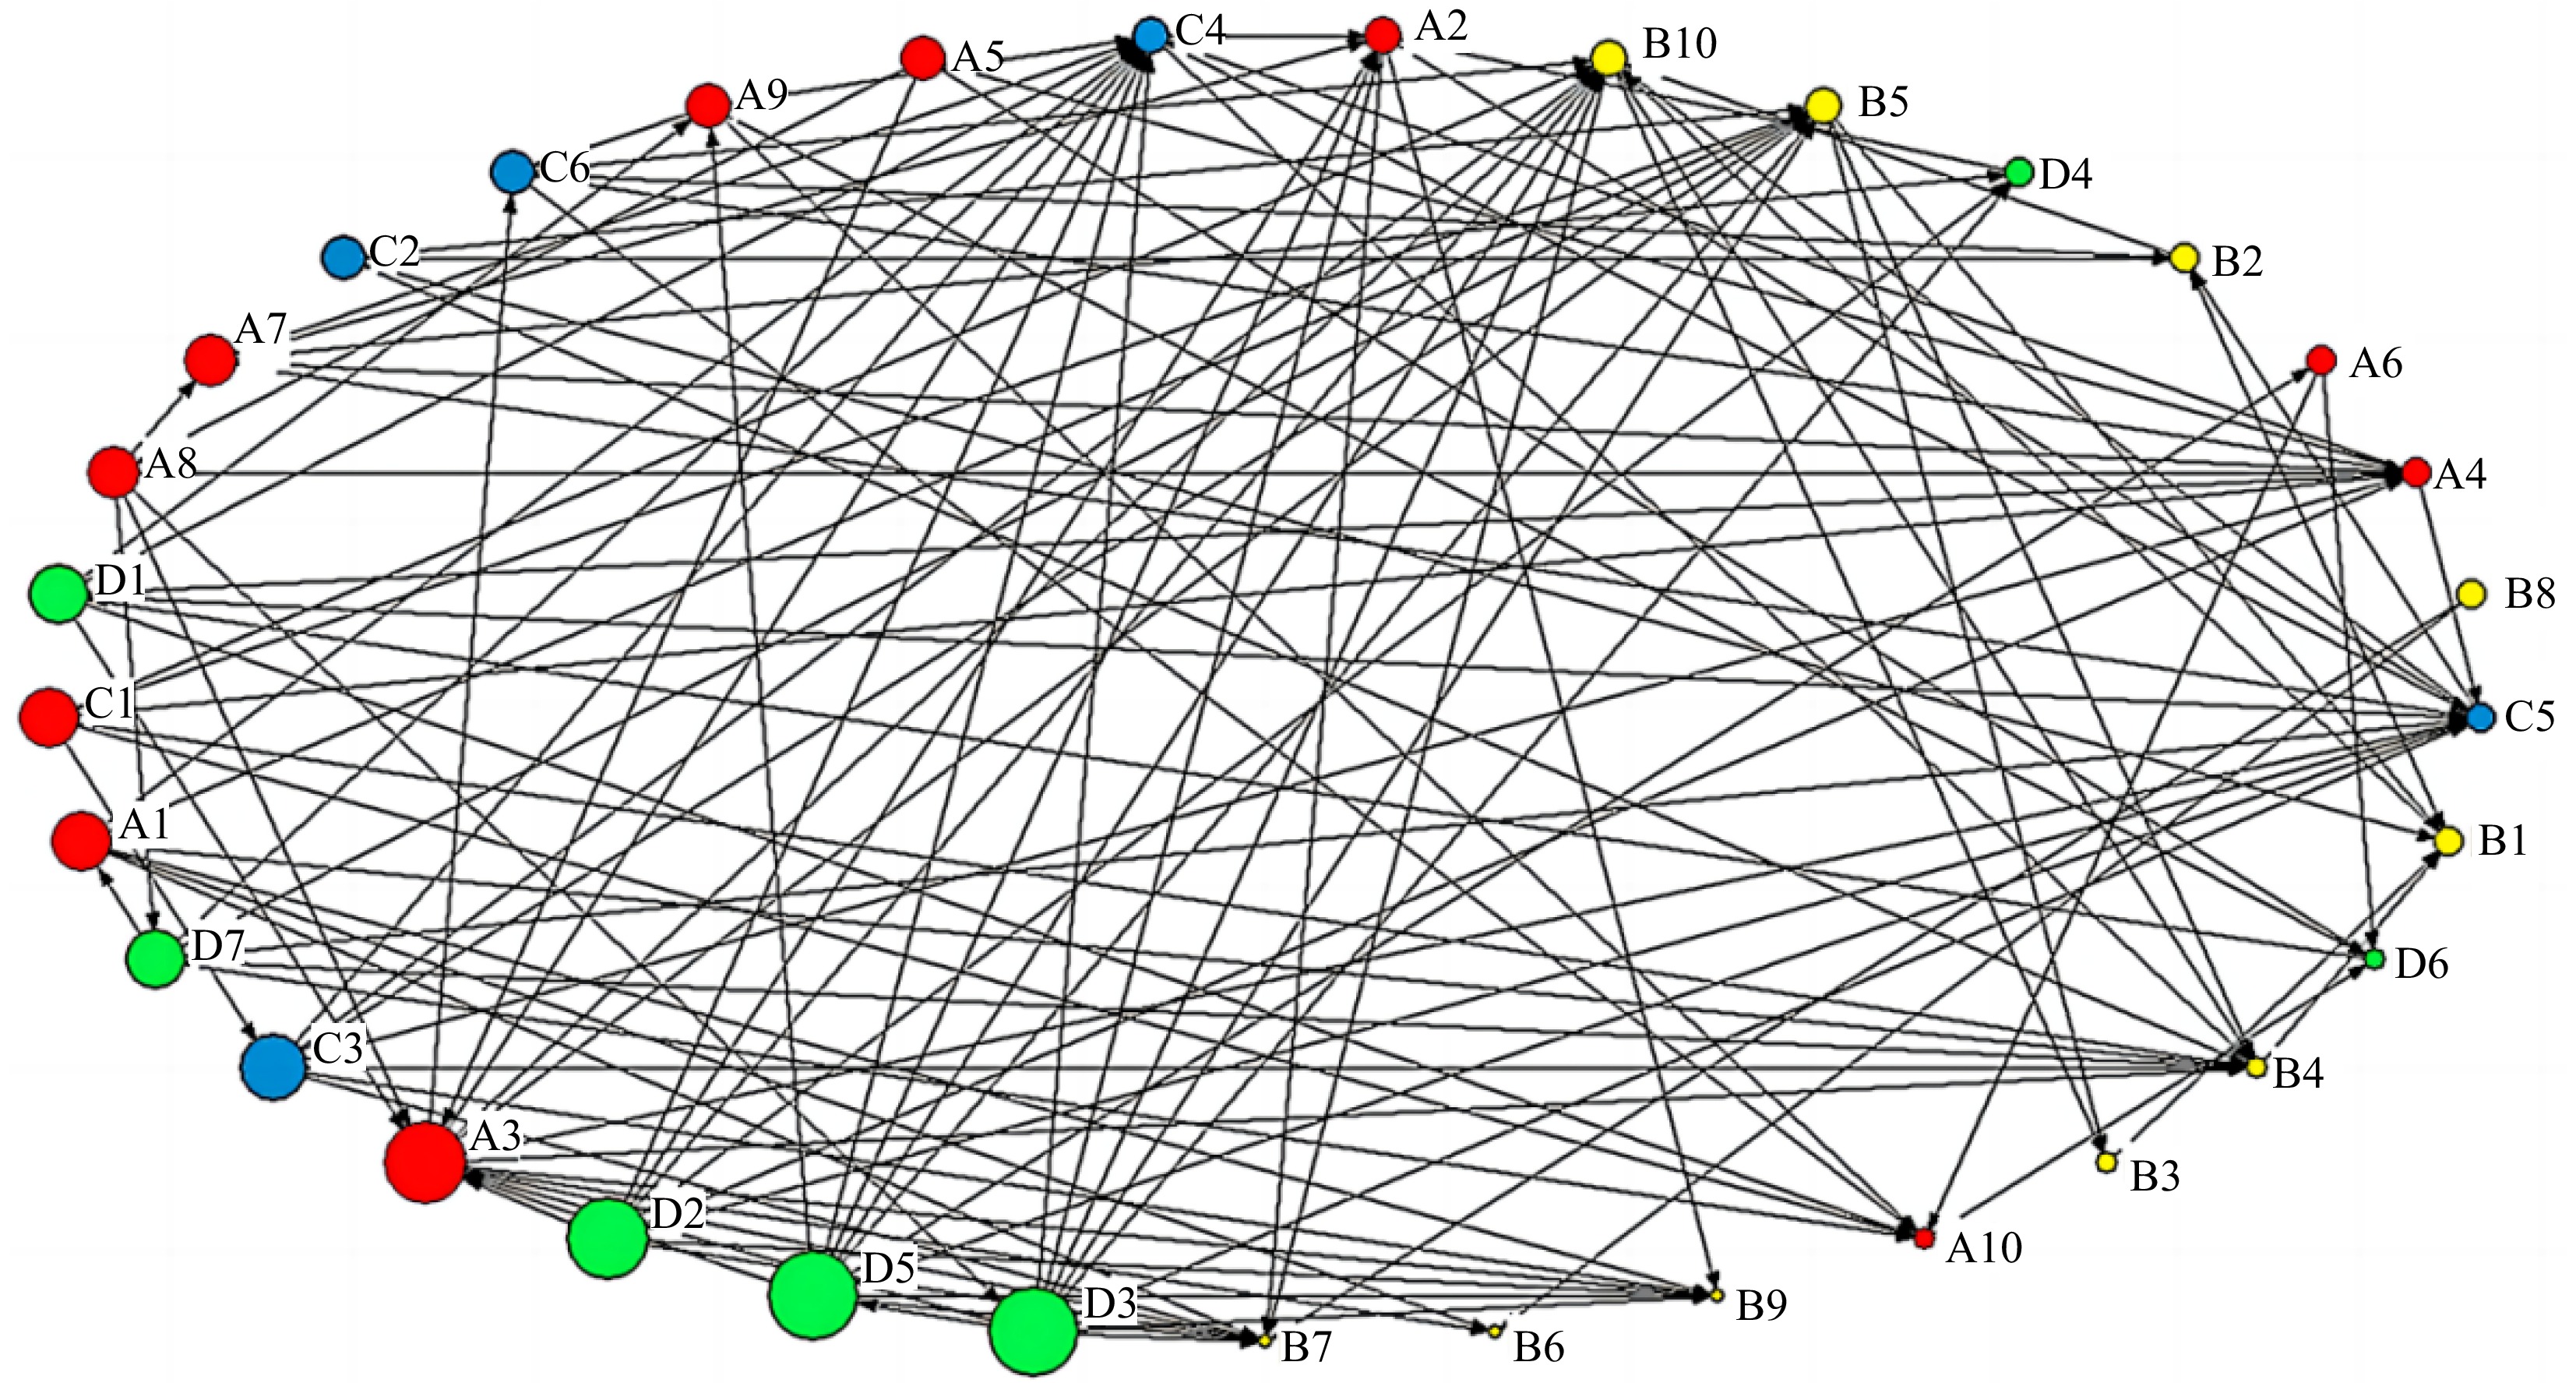
Figure 4.
Node degree in the network.
-
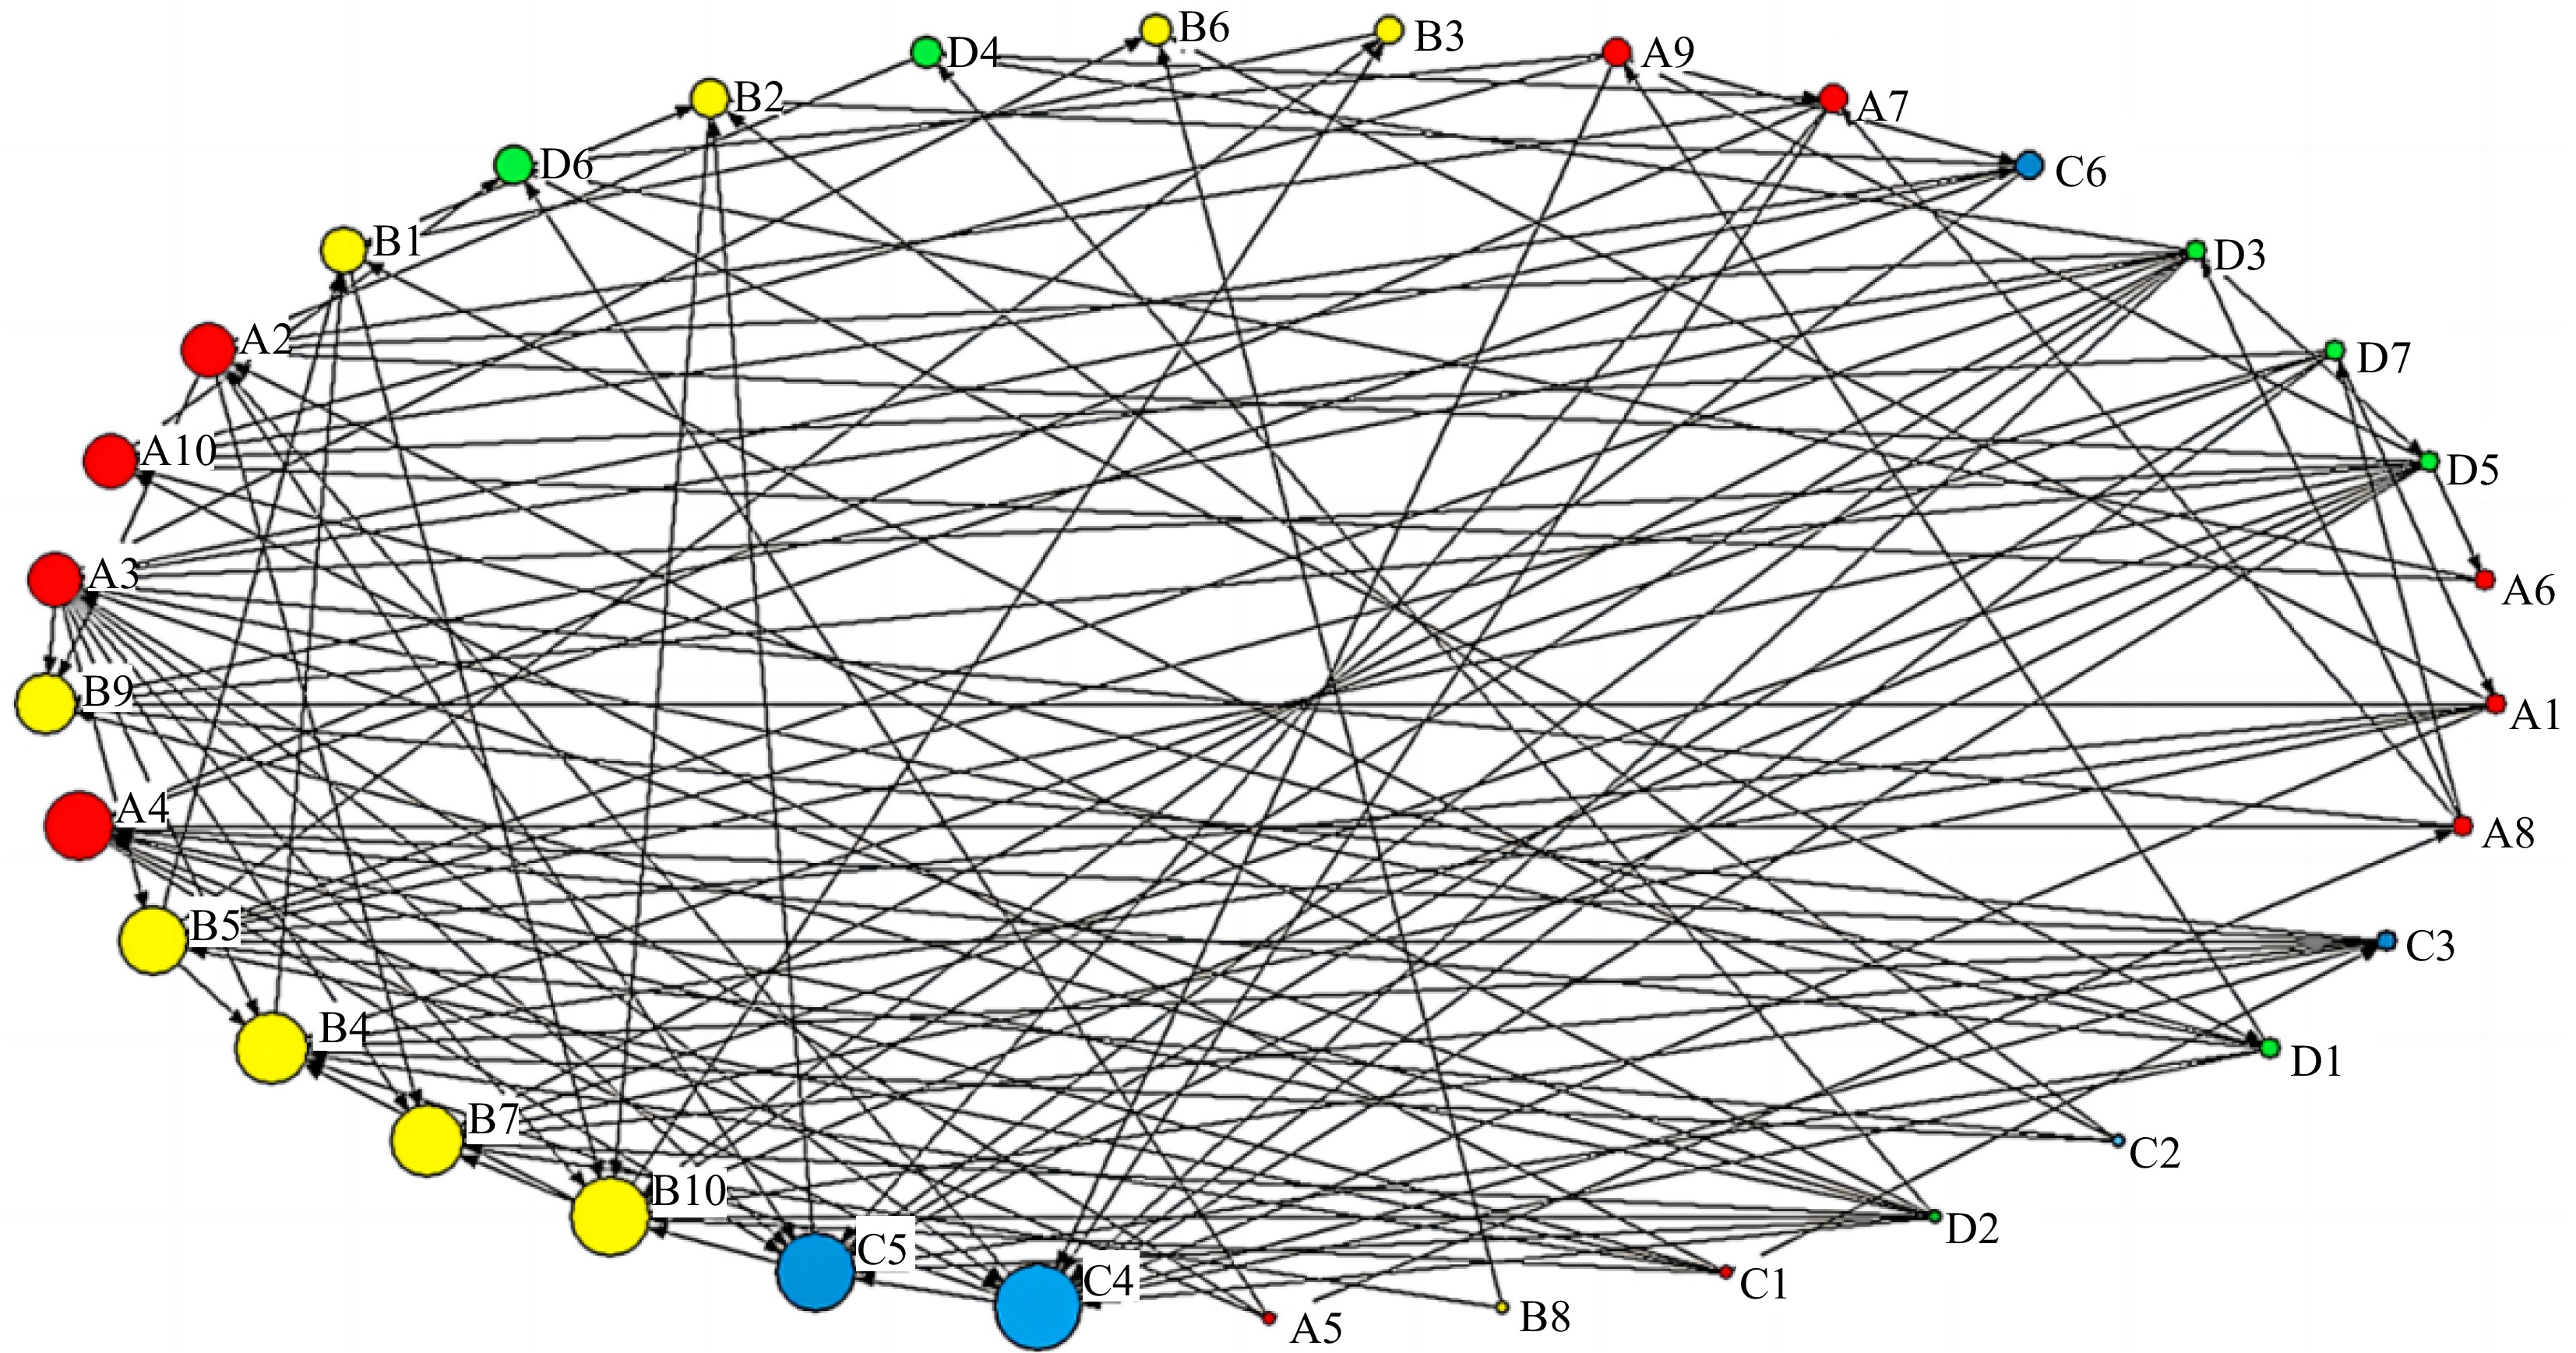
Figure 5.
Node out-degree visualization network.
-
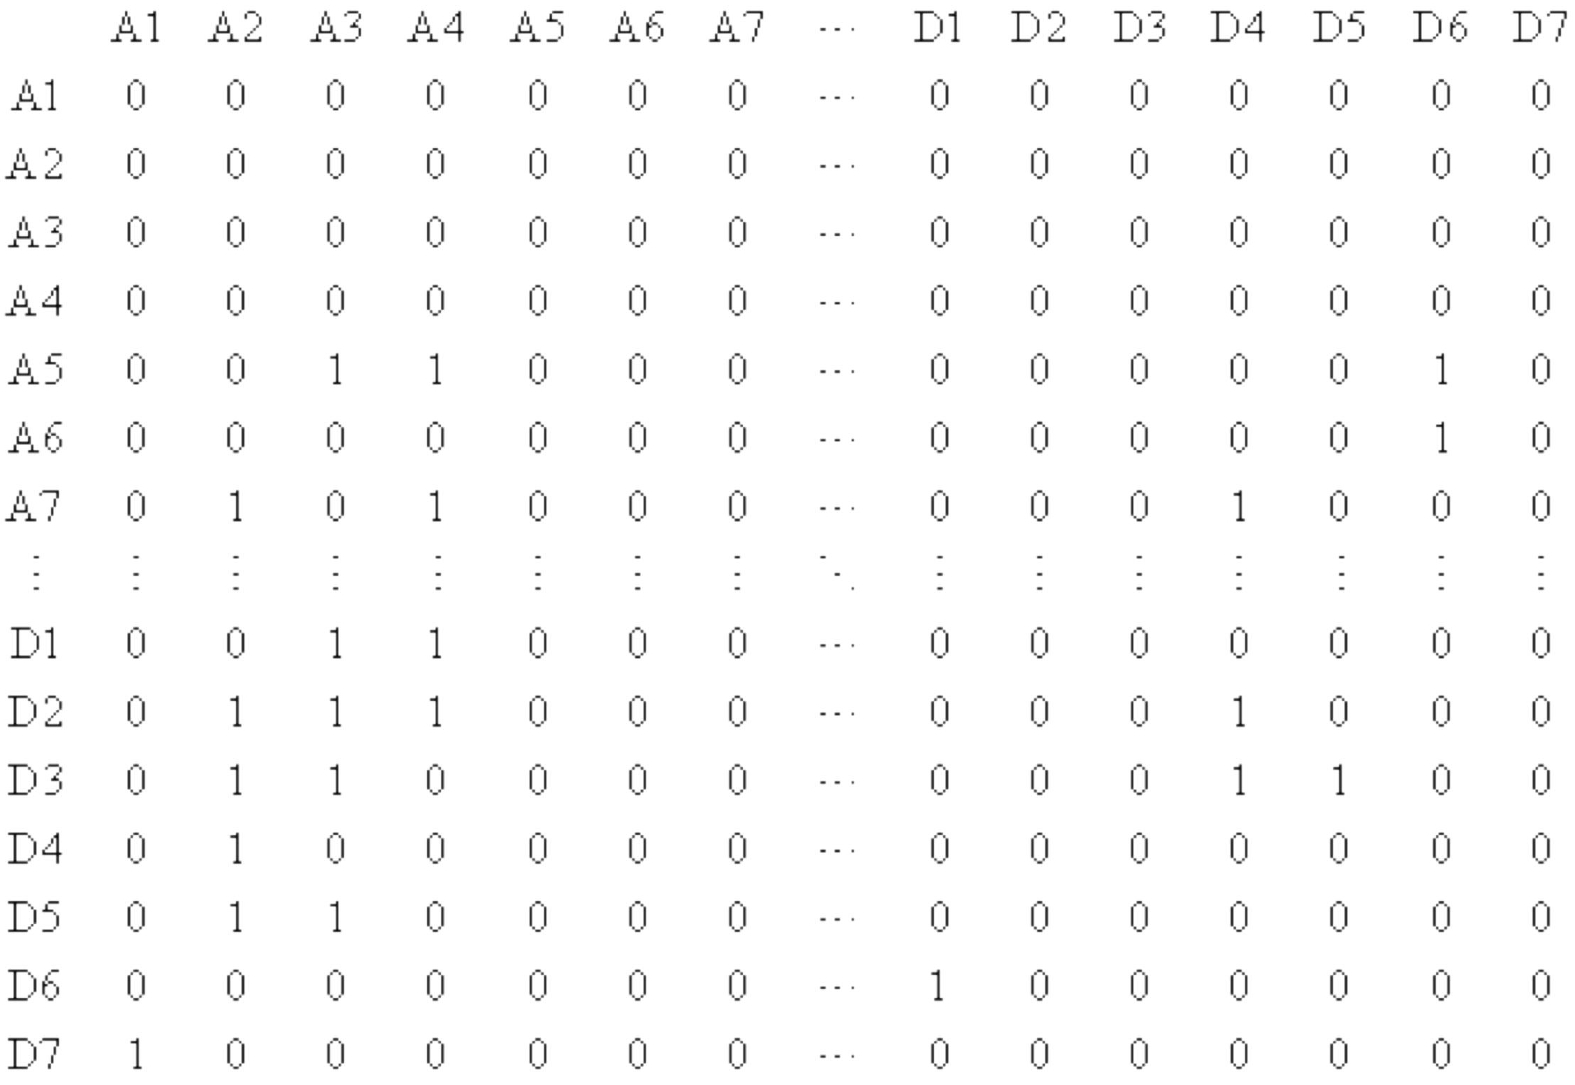
Figure 6.
Node in-degree visualization network.
-
Coupling type Coupling factors No. of couplings Frequency One-factor coupling Human 0 P1000 = 0 Equipment 0 P0100 = 0 Environment 1 P0010 = 0.021 Management 0 P0001 = 0 Two-factor coupling Human-Equipment 1 P1100 = 0.021 Human-Environment 5 P1010 = 0.106 Human-Management 22 P1001 = 0.468 Equipment-Environment 1 P0110 = 0.021 Equipment-Management 1 P0101 = 0.021 Environment-Management 0 P0011 = 0 Multi-factor coupling Human-Equipment-Environment 2 P1110 = 0.041 Human-Equipment-Management 9 P1101 = 0.191 Human-Environment-Management 2 P1011 = 0.041 Equipment-Environment-Management 0 P0111 = 0 Human-Equipment-Environment-Management 3 P1111 = 0.063 Table 1.
Couple times and frequency of each risk factor.
-
One-factor coupling Two-factor coupling Muti-factor coupling P0... = 0.063 P00.. = 0.021 P0.1. = 0.042 P1.0. = 0.680 P000. = 0.000 P010. = 0.021 P110. = 0.212 P011. = 0.021 P.0.. = 0.636 P.00. = 0.468 P0..1 = 0.021 P1..0 = 0.168 P00.0 = 0.021 P01.0 = 0.021 P11.0 = 0.062 P01.1 = 0.021 P..0. = 0.701 P..00 = 0.021 P.0.1 = 0.509 P11.. = 0.316 P0.00 = 0.000 P0.10 = 0.042 P1.10 = 0.147 P0.11 = 0.000 P...0 = 0.210 P0.0. = 0.021 P..01 = 0.680 P.11. = 0.125 P.000 = 0.000 P.010 = 0.127 P.110 = 0.062 P.011 = 0.041 P1... = 0.931 P0..0 = 0.042 P.10. = 0.233 P..11 = 0.104 P100. = 0.468 P.001 = 0.468 P.101 = 0.212 P.111 = 0.063 P.1.. = 0.358 P.0.0 = 0.127 P.1.0 = 0.083 P1.1. = 0.251 P10.0 = 0.106 P0.01 = 0.021 P1.01 = 0.659 P1.11 = 0.104 P..1. = 0.293 P10.. = 0.615 P..10 = 0.189 P.1.1 = 0.275 P1.00 = 0.021 P00.1 = 0.000 P10.1 = 0.509 P11.1 = 0.254 P...1 = 0.784 P01.. = 0.042 P.01. = 0.168 P1..1 = 0.763 P.100 = 0.021 P001. = 0.021 P101. = 0.147 P111. = 0.104 P1111 = 0.063 (four factors) Table 2.
Coupling probabilities for different coupling forms.
-
Coupling type Coupling factors Risk coupling value code Risk coupling value Two-factor coupling Human-Equipment T21 0.028 Human-Environment T22 0.038 Human-Management T23 0.056 Equipment-Environment T24 0.015 Equipment-Management T25 0.010 Environment-Management T26 0.034 Muti-factor
couplingHuman-Equipment-Environment T31 0.087 Human-Management-Environment T32 0.100 Human-Equipment-Management T33 0.405 Equipment-Management-Environment T34 0.401 Human-Equipment-Environmental-Management T4 0.426 Table 3.
Risk coupling values for different risk coupling forms.
-
Factors Category Description Human
factor risk AA1 Malicious sabotage A2 Unauthorized operations and operational errors A3 Improper maintenance A4 Laxity in patrolling A5 Poor physiological condition A6 Low psychological resilience A7 Weak safety awareness among staff A8 Lack of sense of responsibility A9 Inadequate professional skills A10 Insufficient emergency response capabilities Equipment
factor risk BB1 Piping corrosion B2 Stress corrosion B3 Failure of internal protective layers B4 Failure of external protective layers B5 Failure of electrical protection B6 Pipe material defects B7 Equipment failures B8 Equipment design flaws B9 Failure of safety protection devices B10 Equipment aging and wear Environmental factor risk C C1 Hydrogeological conditions C2 Soil environment C3 Natural disasters C4 Unclear or missing signage C5 Unauthorized occupation of ground space C6 Ground traffic environment Management factor risk D D1 Unreasonable personnel arrangements D2 Incomplete rules and regulations D3 Failure to implement rules and regulations D4 Inadequate safety culture development D5 Insufficient employee training and education D6 Decision-making errors D7 Inadequate awareness and education of surrounding residents Table 4.
Risk factors for city gas pipeline leakage U.
-
Coupling system Incidence relation Human factor risk coupling A5→A3; A5→A4; A5→A8; A6→A10; A7→A2; A7→A4; A8→A4; A8→A7; A8→A3 Equipment factor risk coupling B1→B10; B1→B2; B2→B1; B2→B10; B3→B1; B4→B1; B5→B1; B5→B3; B5→B4; B8→B7; B8→B6; B10→B4; B10→B3; B10→B7 Environmental factor risk coupling C1→C3; C3→C4; C4→C5 Management factor risk coupling D2→D4; D3→D4; D3→D5; D6→D1 Human factor-equipment factor coupling A3→B7; A3→B10; A3→B9; A3→B5; A3→B4; A3→B6; A2→B7; A2→B9; A1→B7; A1→B9; A1→B5; A1→B4; A1→B6 Human factor-environmental factor coupling A1→C4; A2→C5; A3→C4; A3→C5; A3→C6; A4→C5; A7→C5; A9→C4; A9→C6; C1→A4; C1→A10; C3→A4; C4→A2; C6→A4; C6→A10; A4→C4; A7→C4 Human factor-management factor coupling A5→D6; A6→D6; A7→D4; A8→D3; A8→D7; A9→D6; A10→D6; D1→A4; D1→A3; D1→A9; D1→A10; D2→A2; D2→A3; D2→A4; D3→A2; D3→A3; D3→A4; D4→A2; D4→A7; D5→A2; D5→A3; D5→A9; D5→A6; D7→A10; D7→A1 Equipment factor-environmental factor coupling C1→B4; C1→B5; C1→B10; C2→B1; C2→B2; C2→B4; C2→B5; C3→B10; C3→B9; C3→B7; C3→B5; C3→B4; C4→B4; C5→B2; C5→B10; C6→B2; C6→B10; C1→B4; C1→B5; C1→B10 Equipment factor-management factor coupling D5→B5; D5→B7; D5→B9; D5→B10; D3→B7; D3→B9; D3→B5; D3→B10; D7→B4; D2→B7; D2→B9; D2→B10; D7→B5 Environmental factor-management factor coupling D1→C5; D1→C4; D2→C5; D2→C4; D7→C4; D7→C5; D5→C4; D5→C5; D3→C4; D3→C5 Table 5.
Coupling relationship of secondary risk factors.
-
Panel point Out-degree In-degree Total degree value Panel point Out-degree In-degree Total degree value A1 6 1 7 B8 2 0 2 A2 3 6 9 B9 0 7 7 A3 9 6 15 B10 3 10 13 A4 2 8 10 C1 6 0 6 A5 4 0 4 C2 4 0 4 A6 2 1 3 C3 7 1 8 A7 5 2 7 C4 3 11 14 A8 5 1 6 C5 2 10 12 A9 4 2 6 C6 4 2 6 A10 1 6 7 D1 6 1 7 B1 2 5 7 D2 9 0 9 B2 2 4 6 D3 10 1 11 B3 1 2 3 D4 2 3 5 B4 1 9 10 D5 10 1 11 B5 3 8 11 D6 1 4 5 B6 0 3 3 D7 6 1 7 B7 0 9 9 Table 6.
Degree value of each node.
-
Ranking Number Risk factor Classification Out-degree 1 D3 Failure to implement rules and regulations Management factor risk 10 2 D5 Insufficient employee training and education Management factor risk 10 3 D2 Incomplete rules and regulations Management factor risk 9 4 A3 Improper maintenance Human factor risk 9 5 C3 Natural disasters Environmental factor risk 7 6 D7 Inadequate awareness and education of surrounding residents Management factor risk 6 Table 7.
The top six risk factors for out-degree.
-
Ranking Number Risk factor Classification In-degree 1 C4 Unclear or missing signage Environmental factor risk 11 2 C5 Unauthorized occupation of ground space Environmental factor risk 10 3 B10 Equipment aging and wear Equipment factor risk 9 4 B7 Equipment failures Equipment factor risk 9 5 B4 Failure of external protective layers Equipment factor risk 9 6 B5 Failure of electrical protection Equipment factor risk 8 Table 8.
The top six risk factors for in-degree.
Figures
(6)
Tables
(8)