-
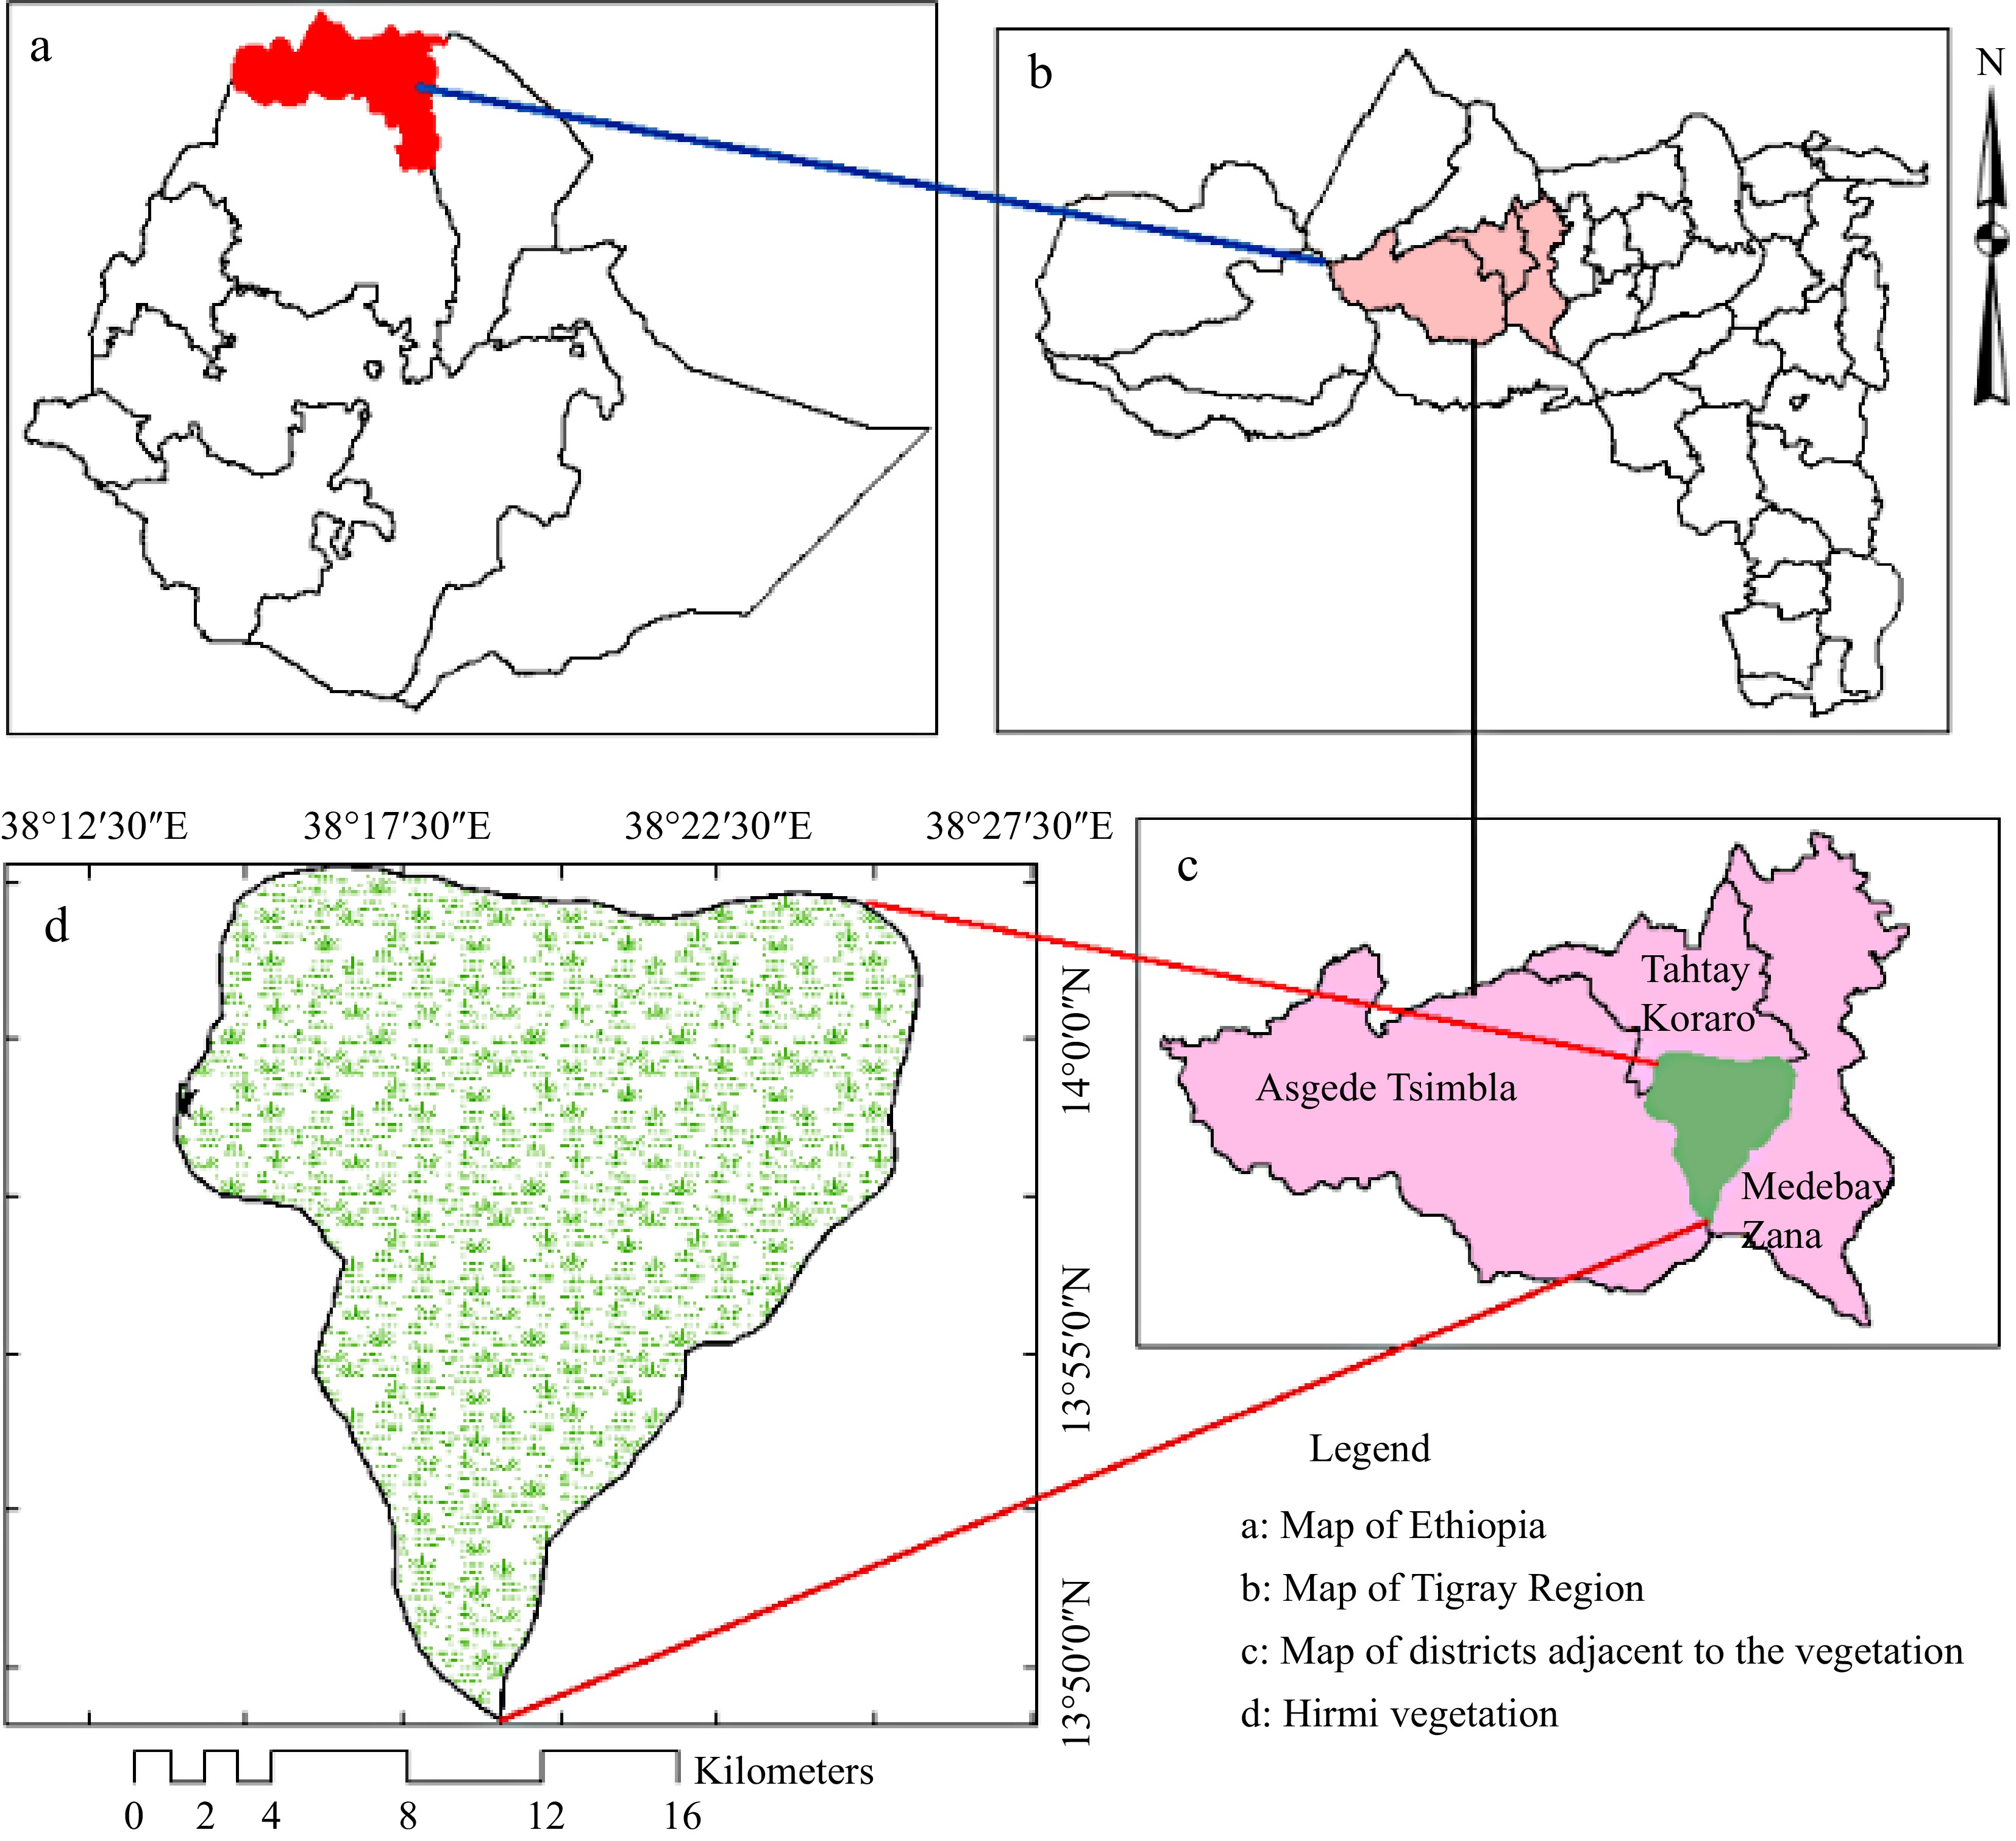
Figure 1.
Map of Hirmi woodland (study area).
-
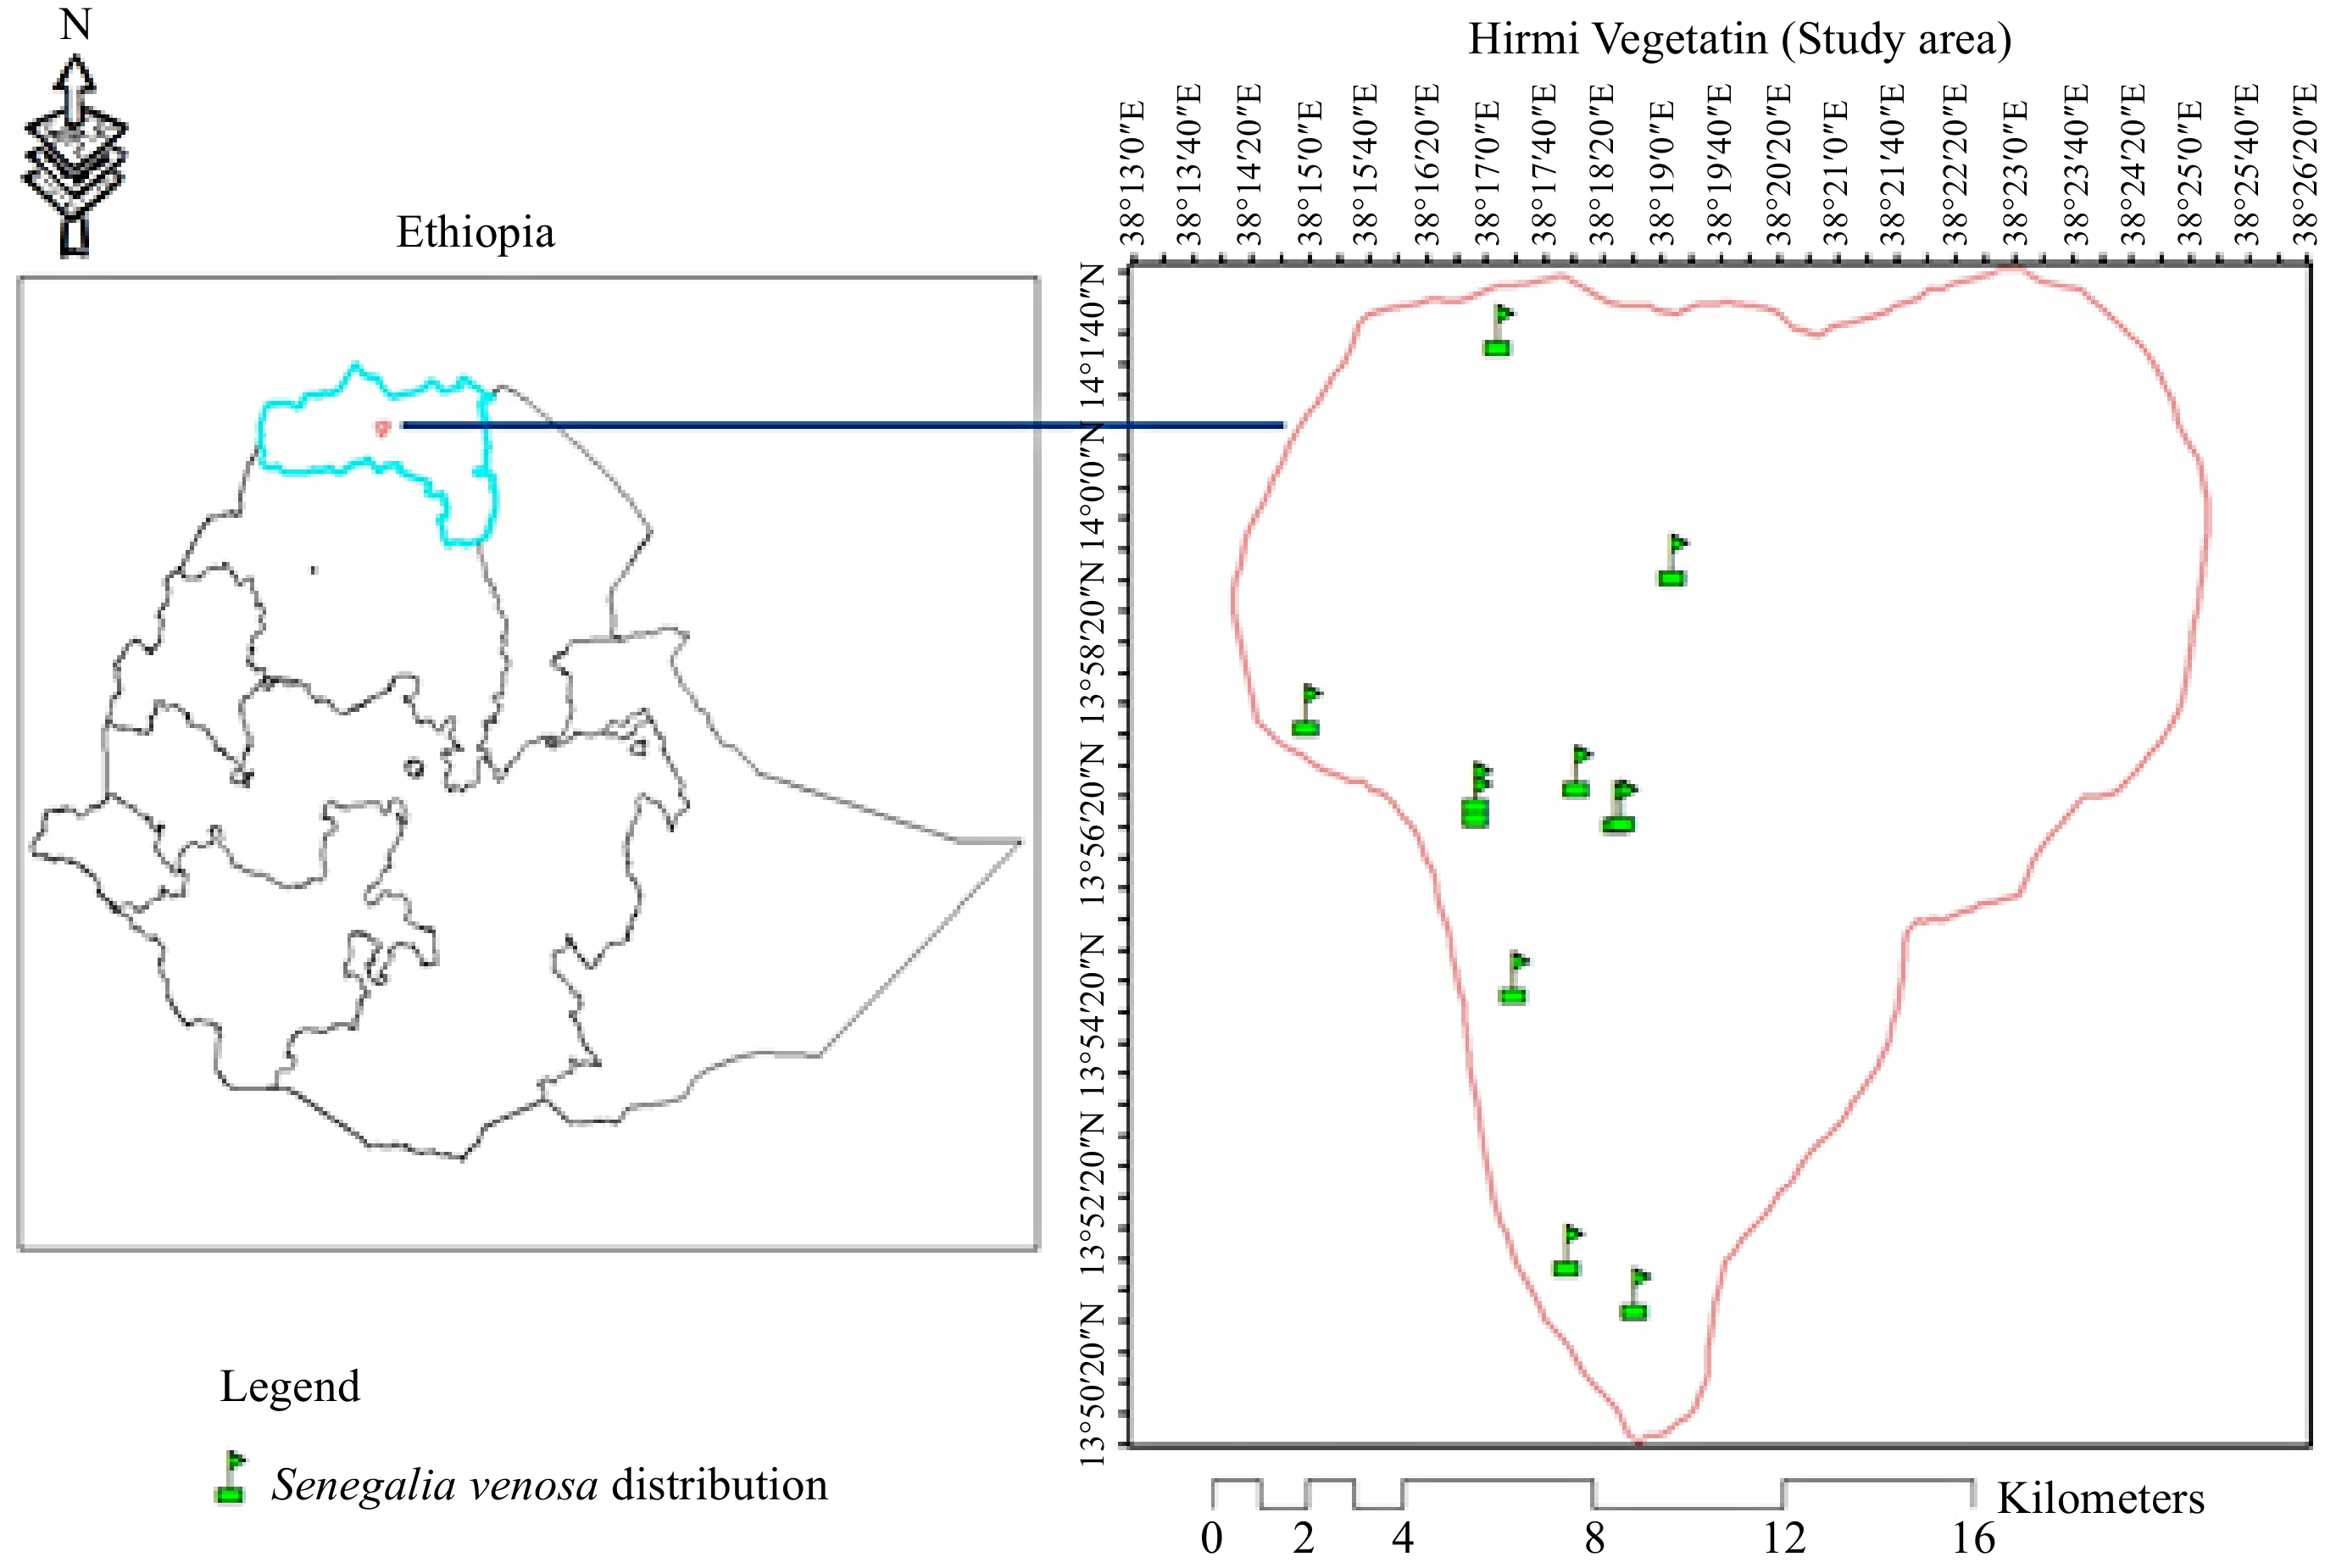
Figure 2.
The map reveals the distribution of Senegalia venosa in Hirmi woodland vegetation.
-
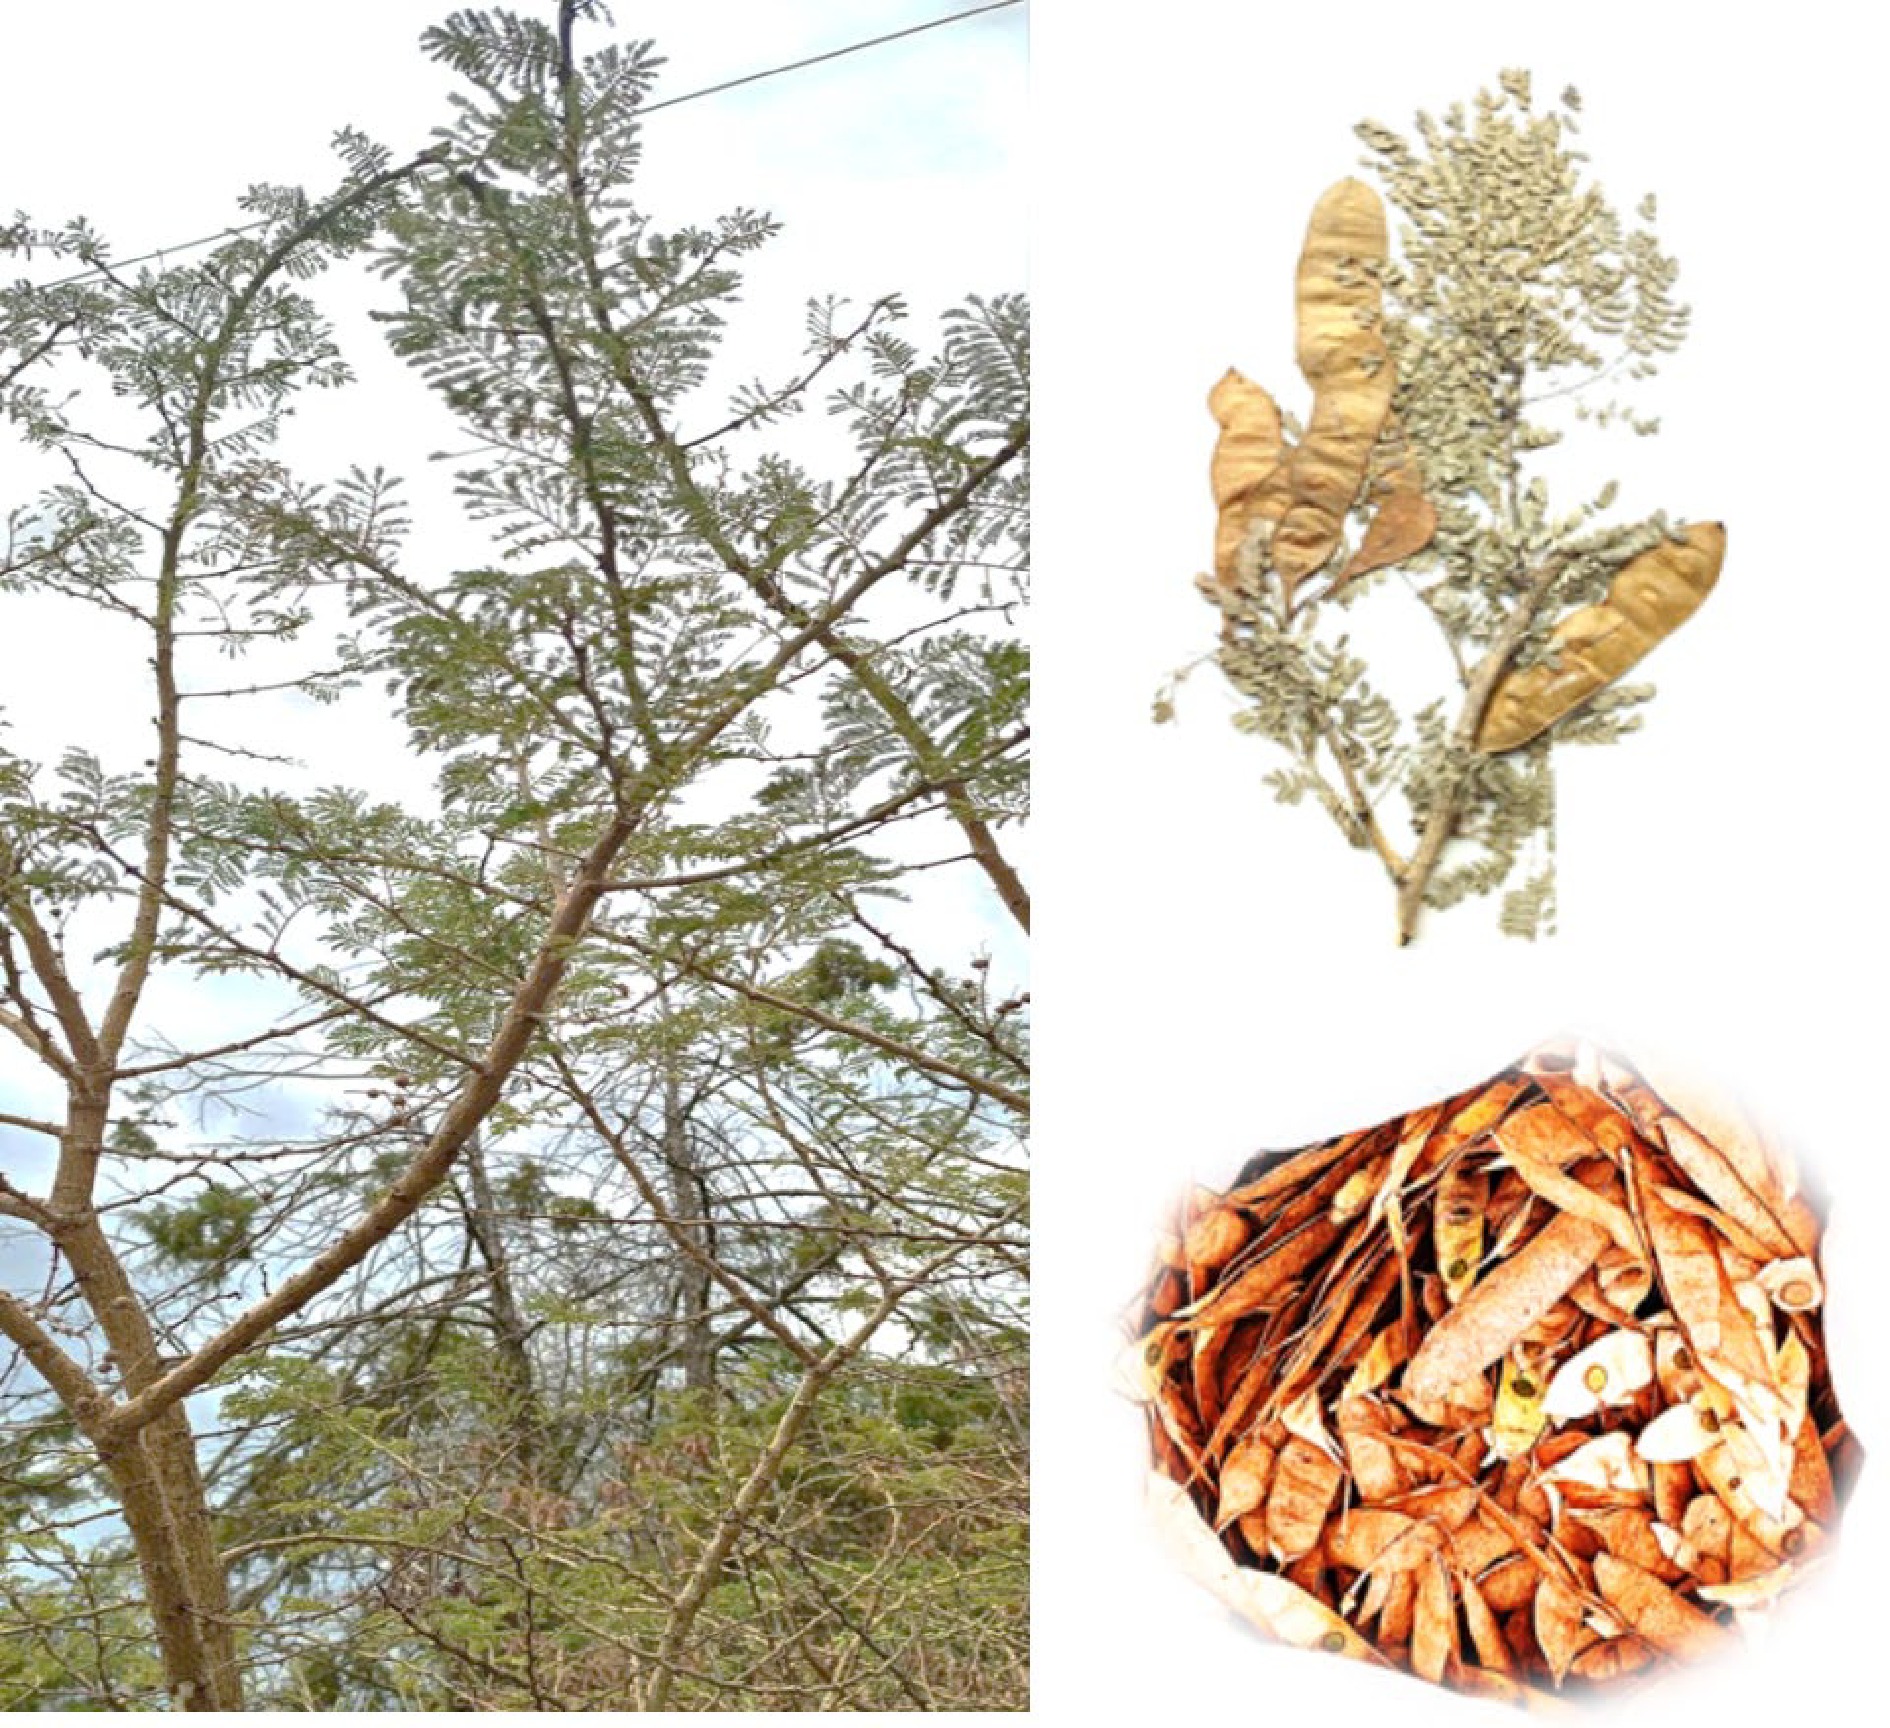
Figure 3.
Images of different parts of Senegalia venosa.
-
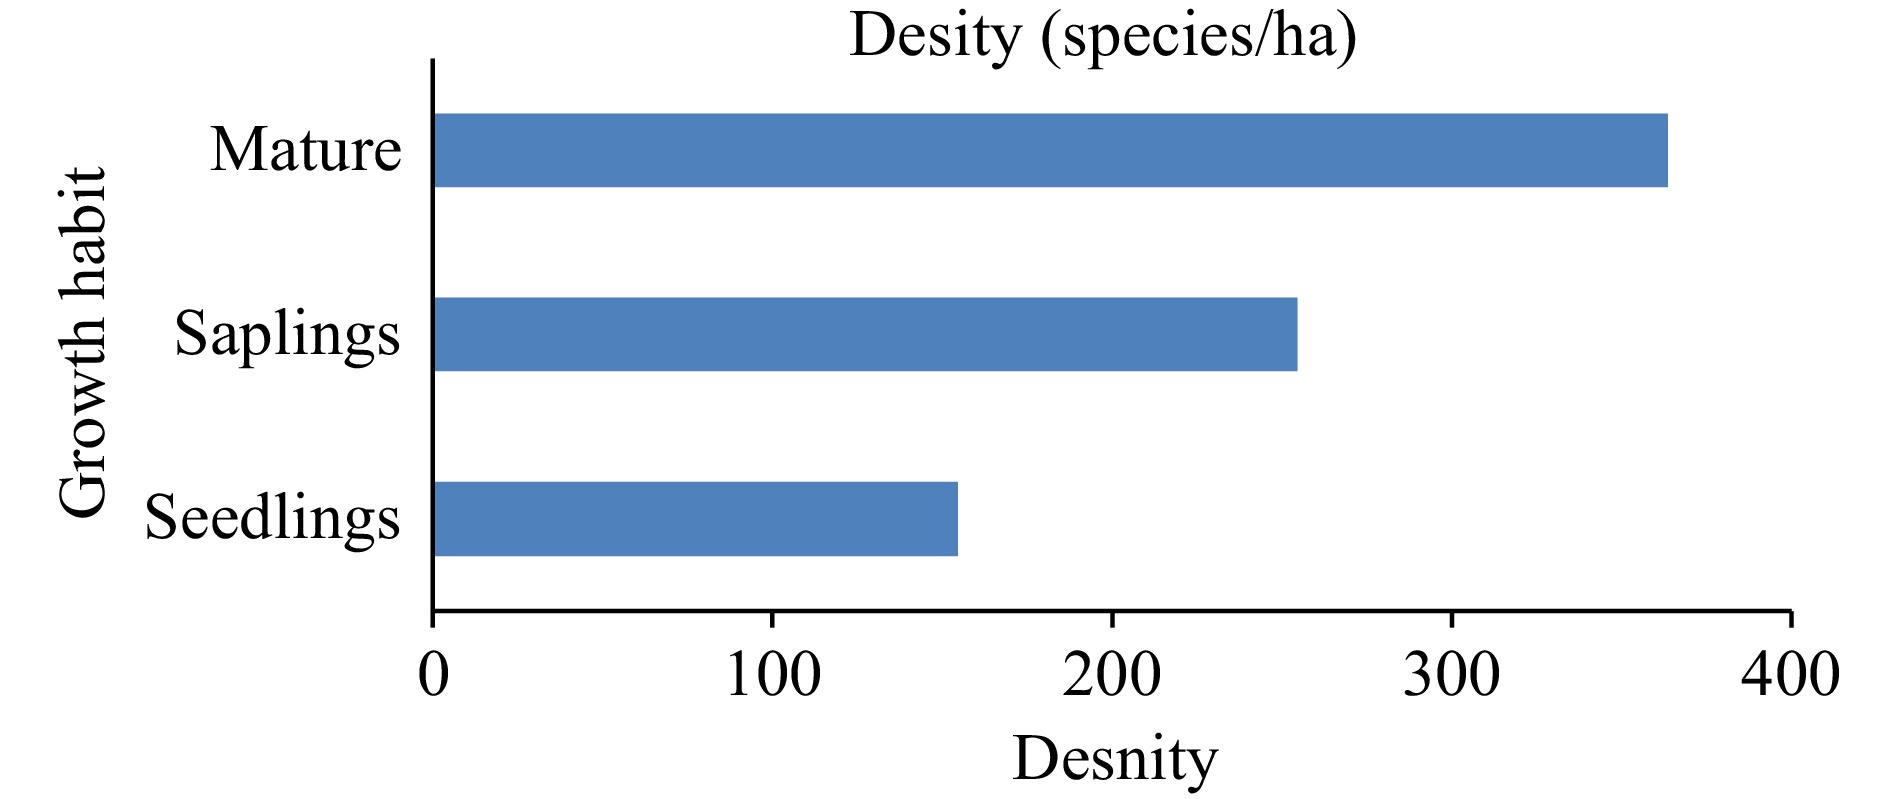
Figure 4.
Regeneration status of Senegalia venosa.
-
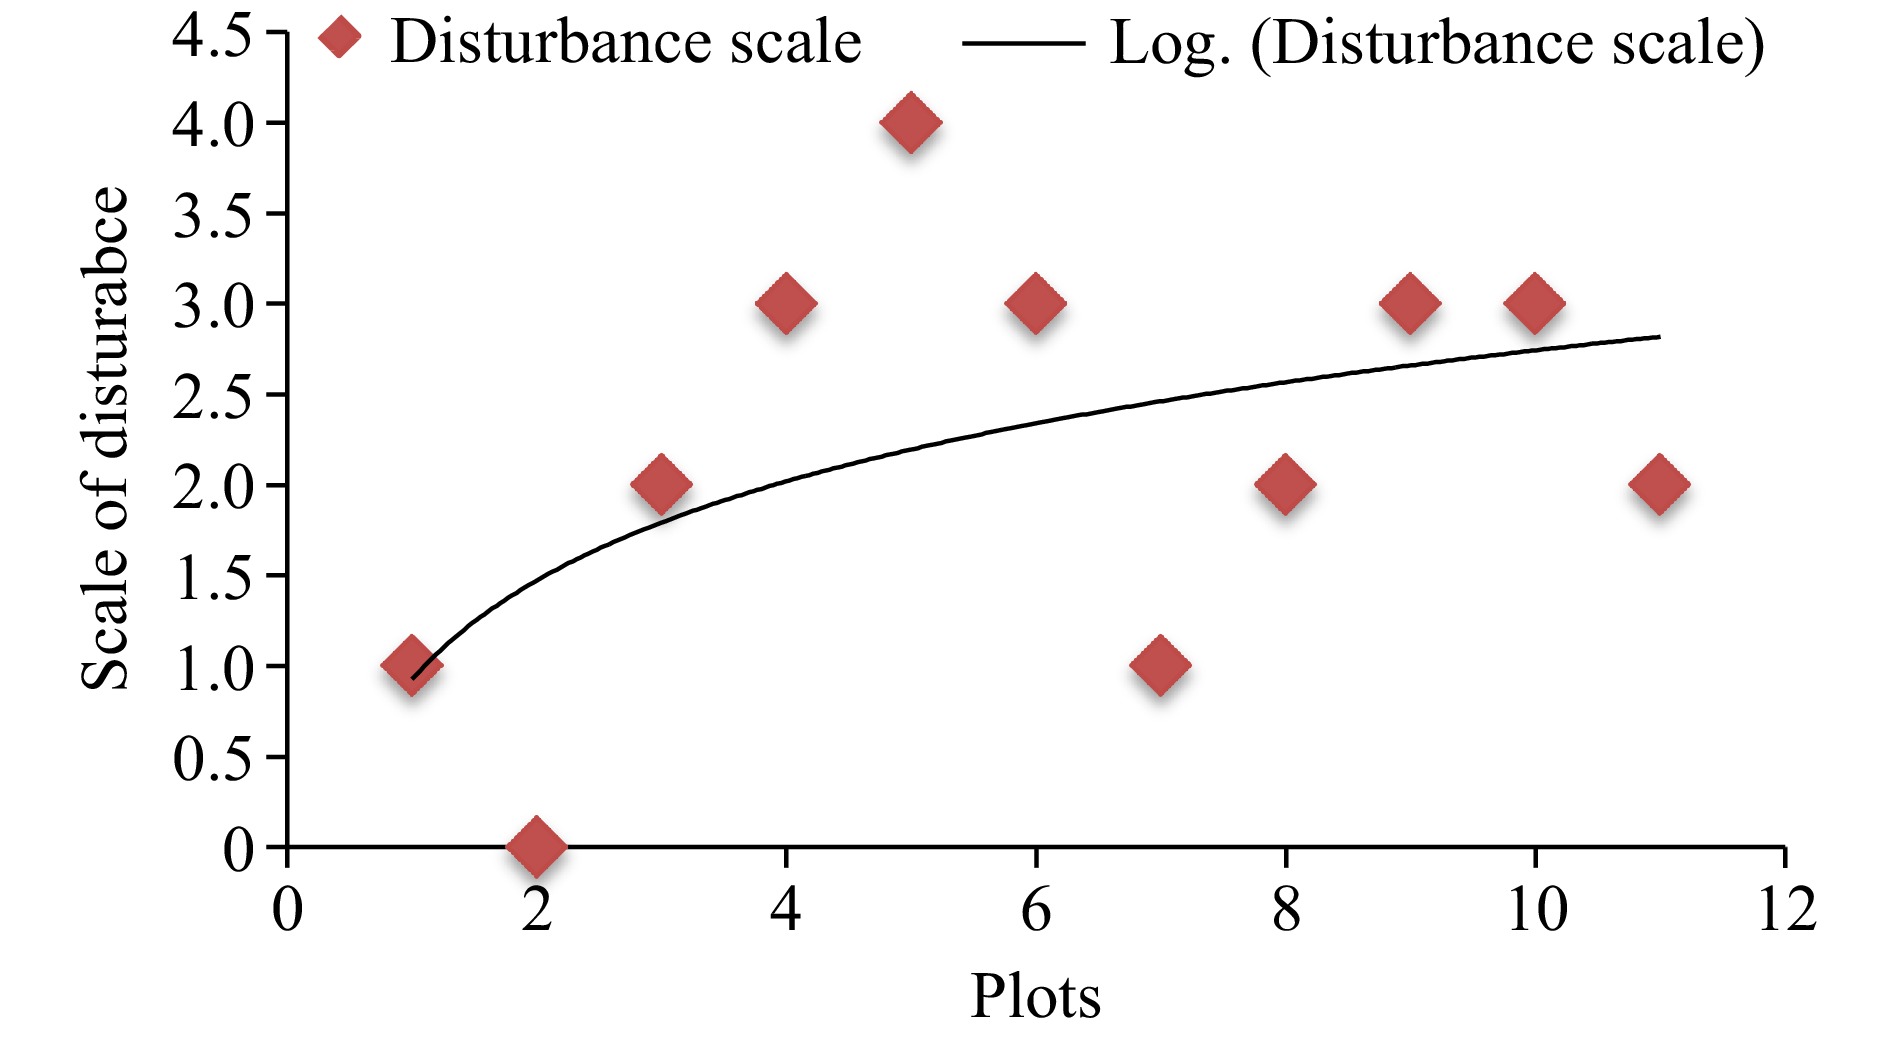
Figure 5.
Scale of disturbance in the sample plots.
-
Plot Latitude Longitude Types of disturbance 1 13.85504 38.31161 Cutting 2 13.86265 38.29898 No 3 13.91186 38.28886 Grazing 4 13.94372 38.2816 Cutting and grazing 5 13.94241 38.30817 Charcoal production & cutting 6 13.94287 38.30928 Charcoal production & cutting 7 13.94889 38.30065 Trampling 8 13.98725 38.31893 Cutting 9 13.981472 38.26925 Grazing & trampling 10 13.996350 38.326788 Cutting and cutting 11 14.02838 38.2858 Grazing Table 1.
Locations and types of disturbance in sampled plots.
Figures
(5)
Tables
(1)