-
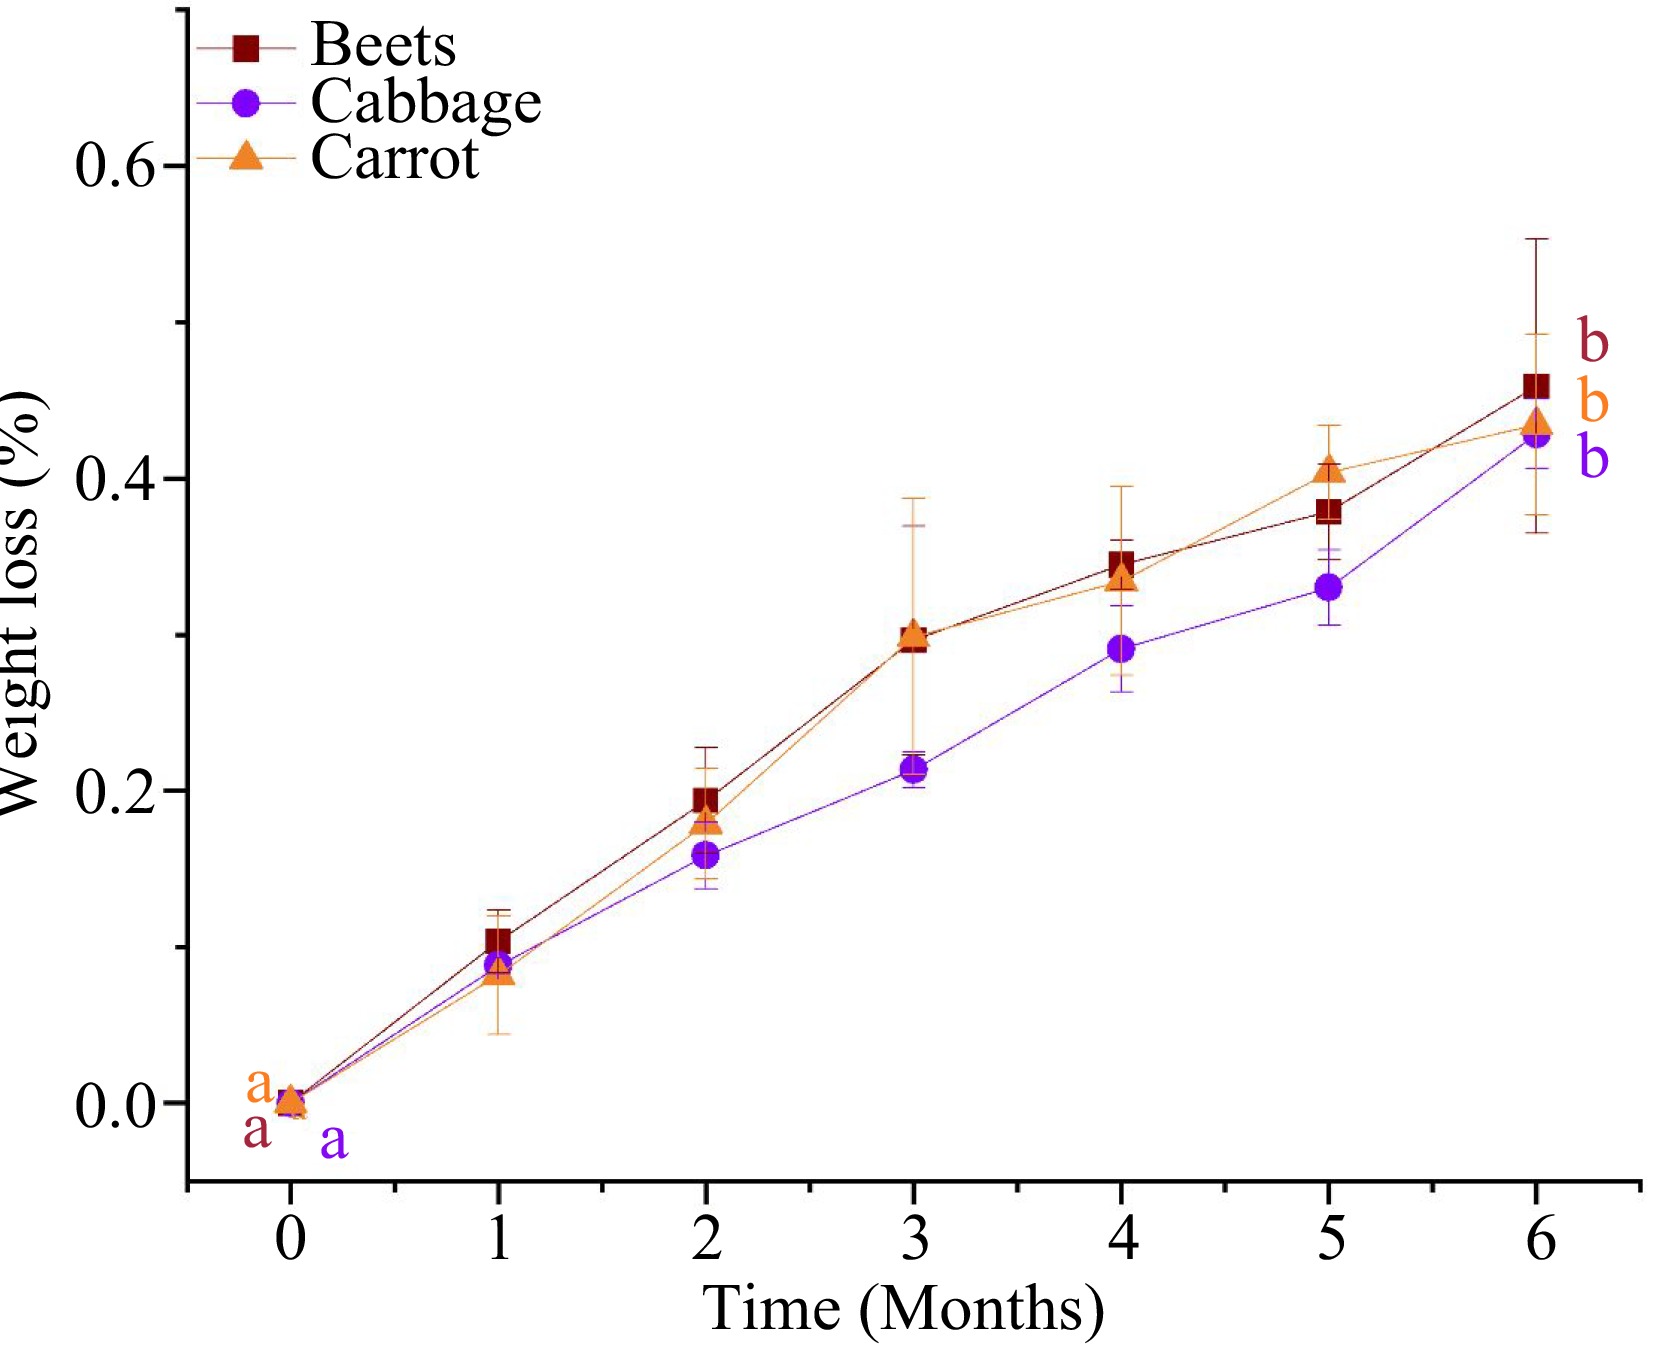
Figure 1.
Weight loss of the MATS- processed beetroot, cabbage, and carrot puree samples during 6 months of storage at 37.8 °C (n = 3). Values with the same superscript letters are not significantly different (p > 0.05).
-
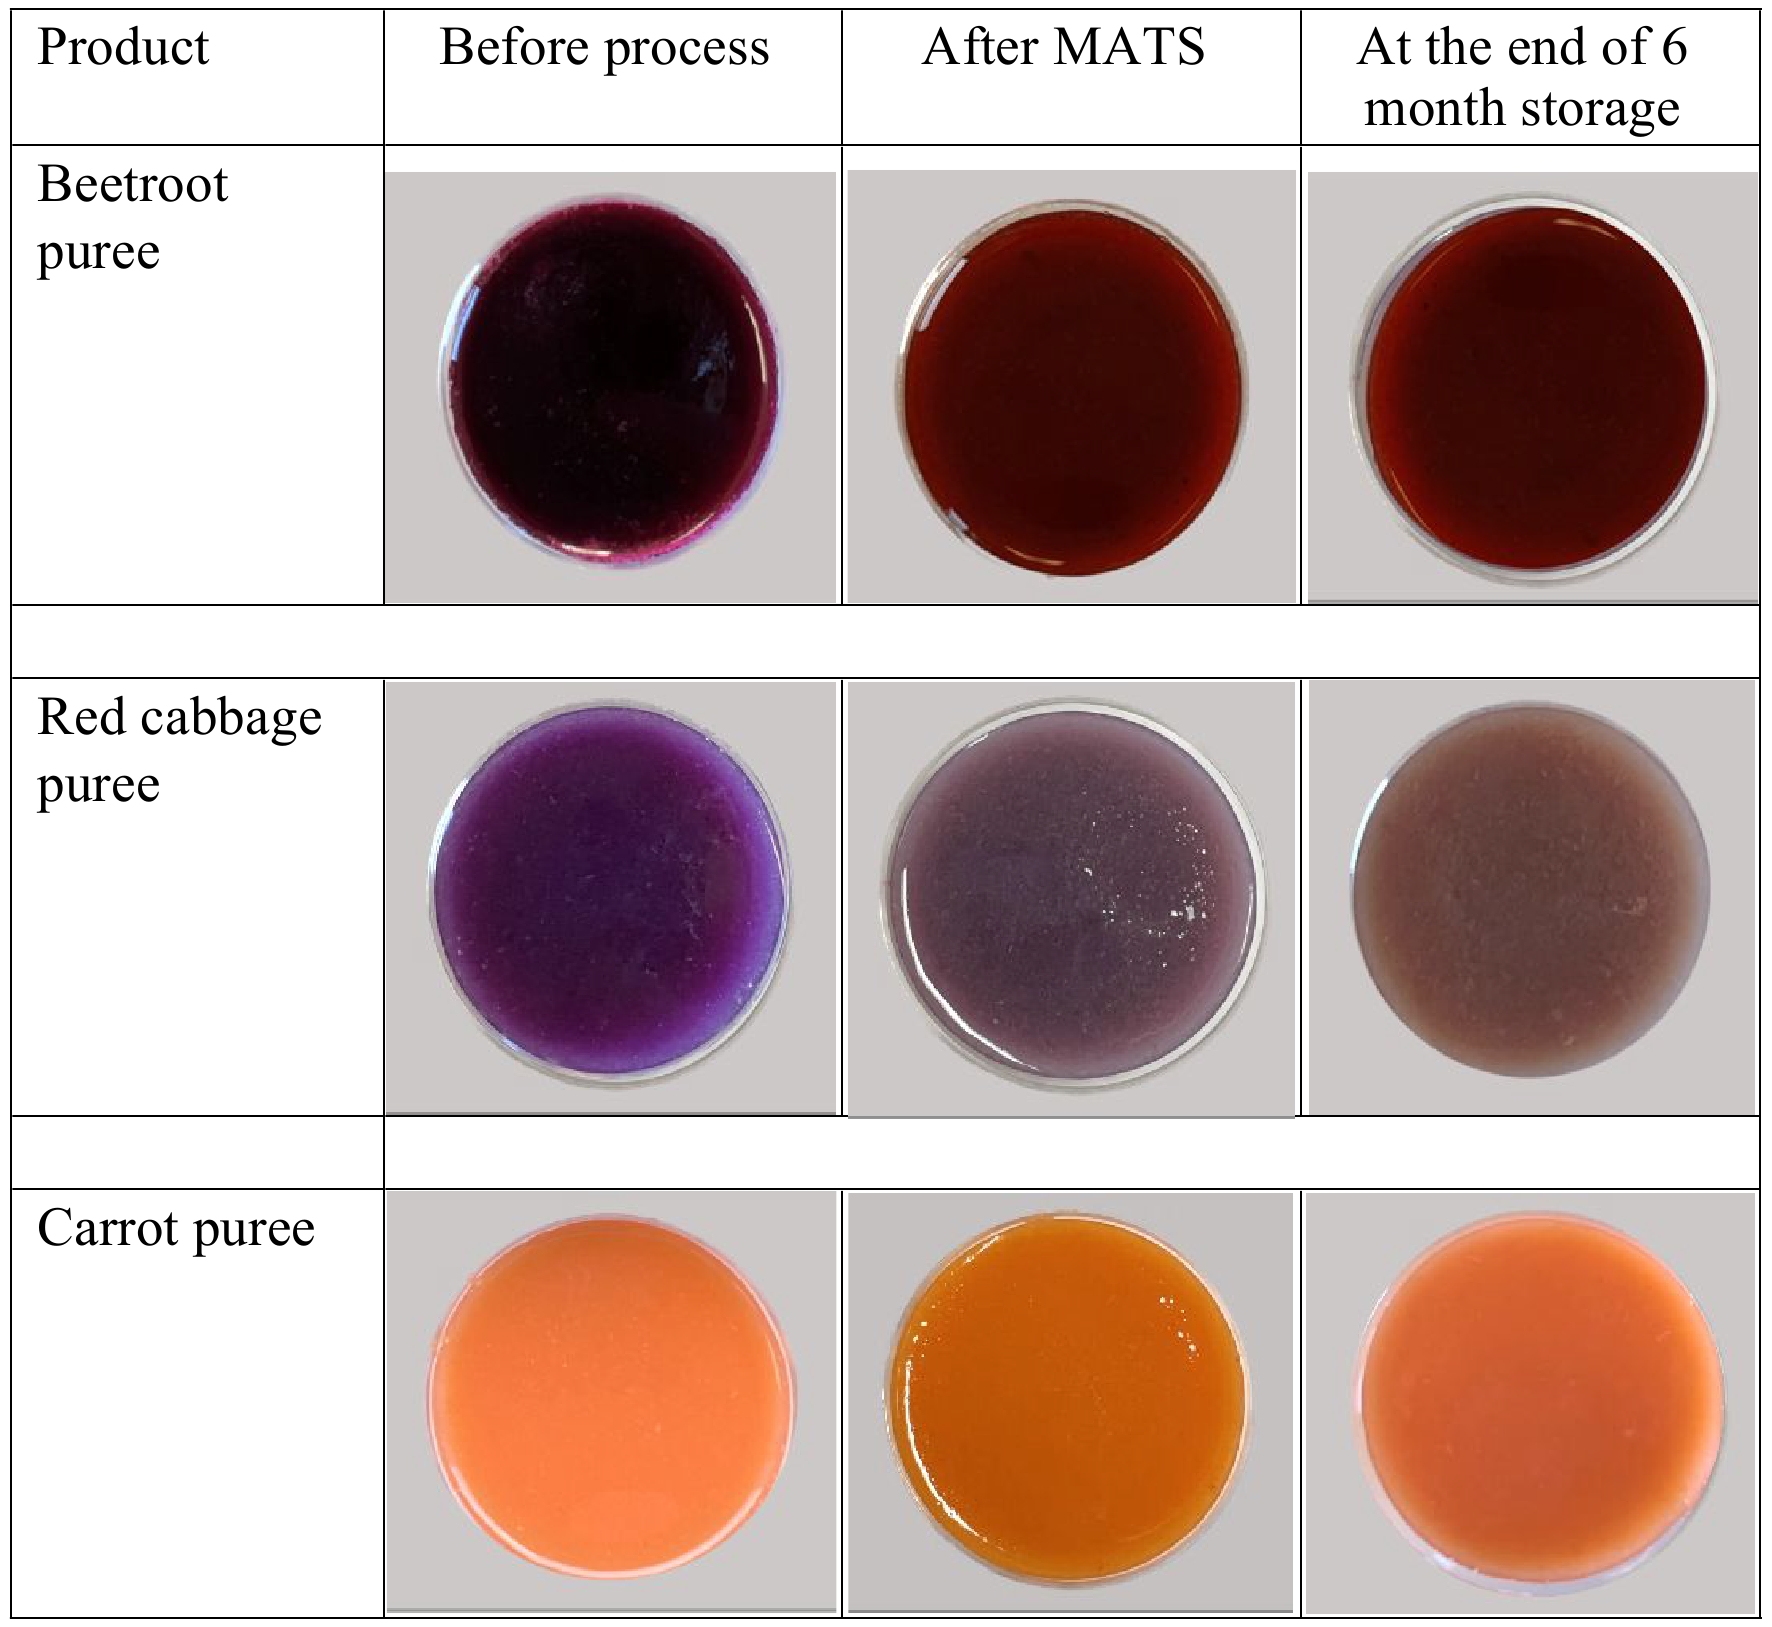
Figure 2.
The changes in visual color in beetroot, red cabbage, and carrot purees after the MATS treatment and at the end of 6 months of storage at 37.8 °C.
-
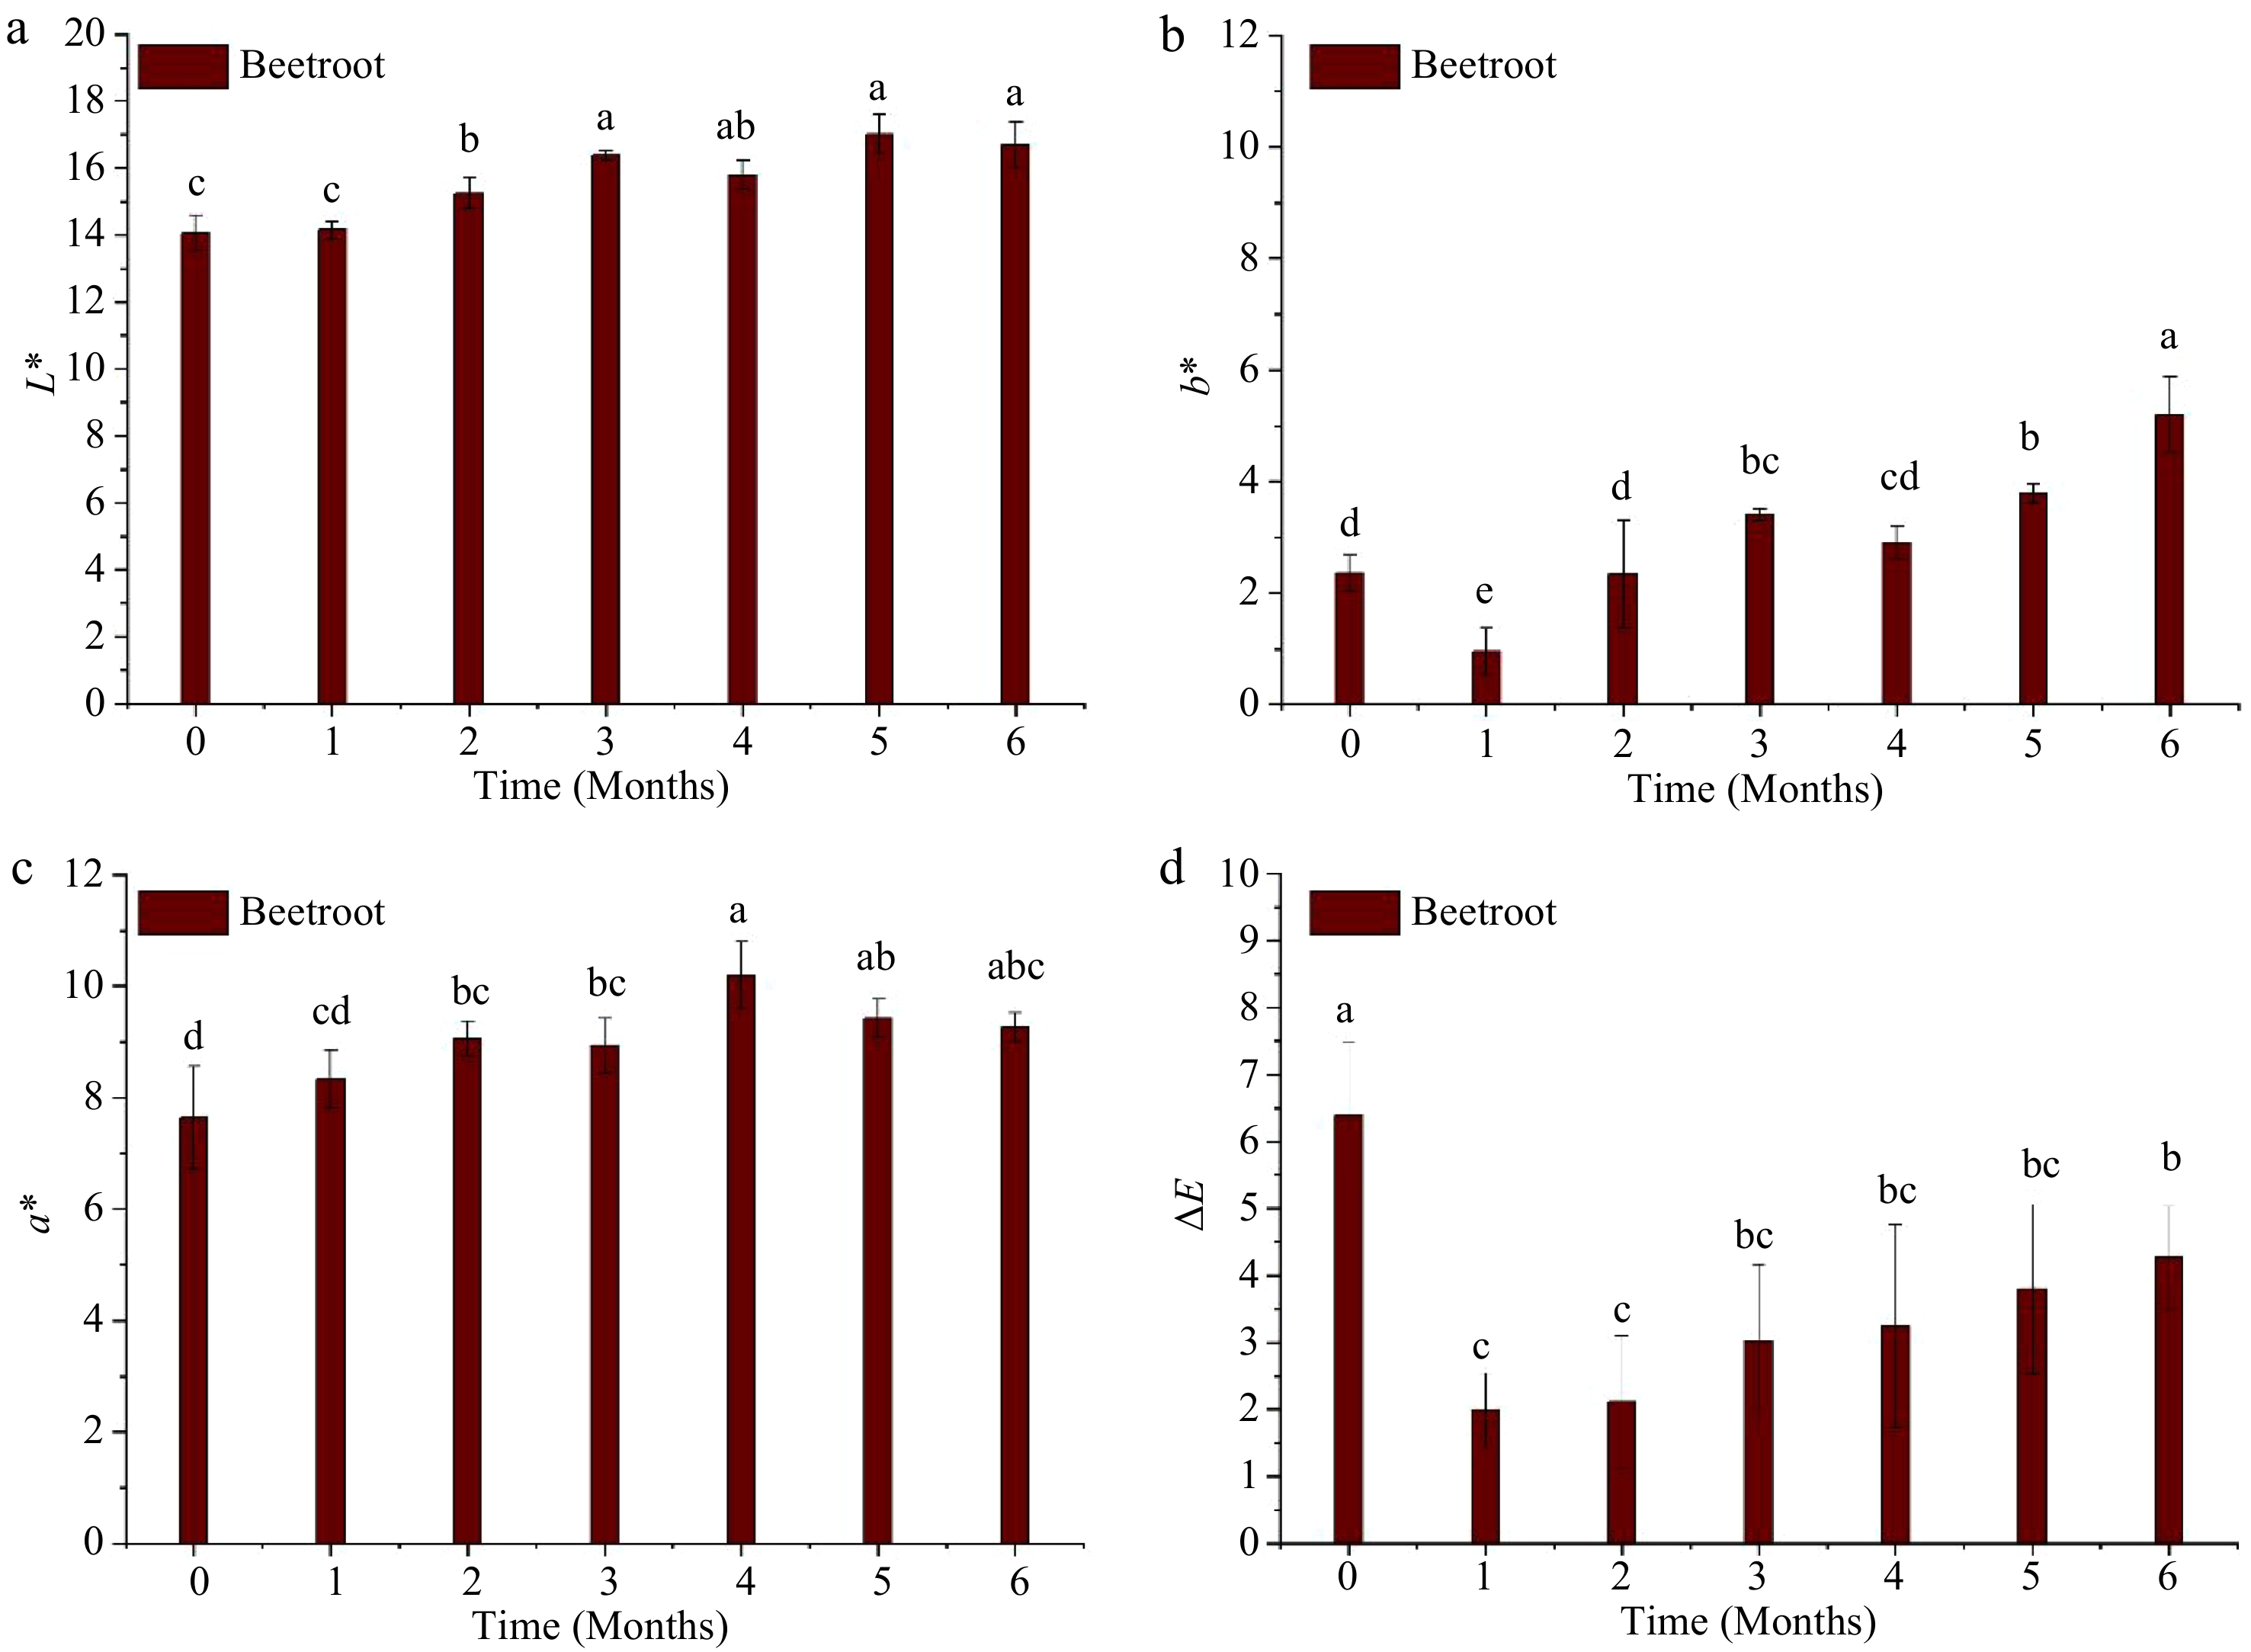
Figure 3.
Instrumental color changes of the MATS-processed beetroot during 6 months of storage at 37.8 °C: (a) lightness, (b) yellowness, (c) redness, and (d) total color difference, values with the same superscript letters are not significantly (p > 0.05) different, n = 6.
-
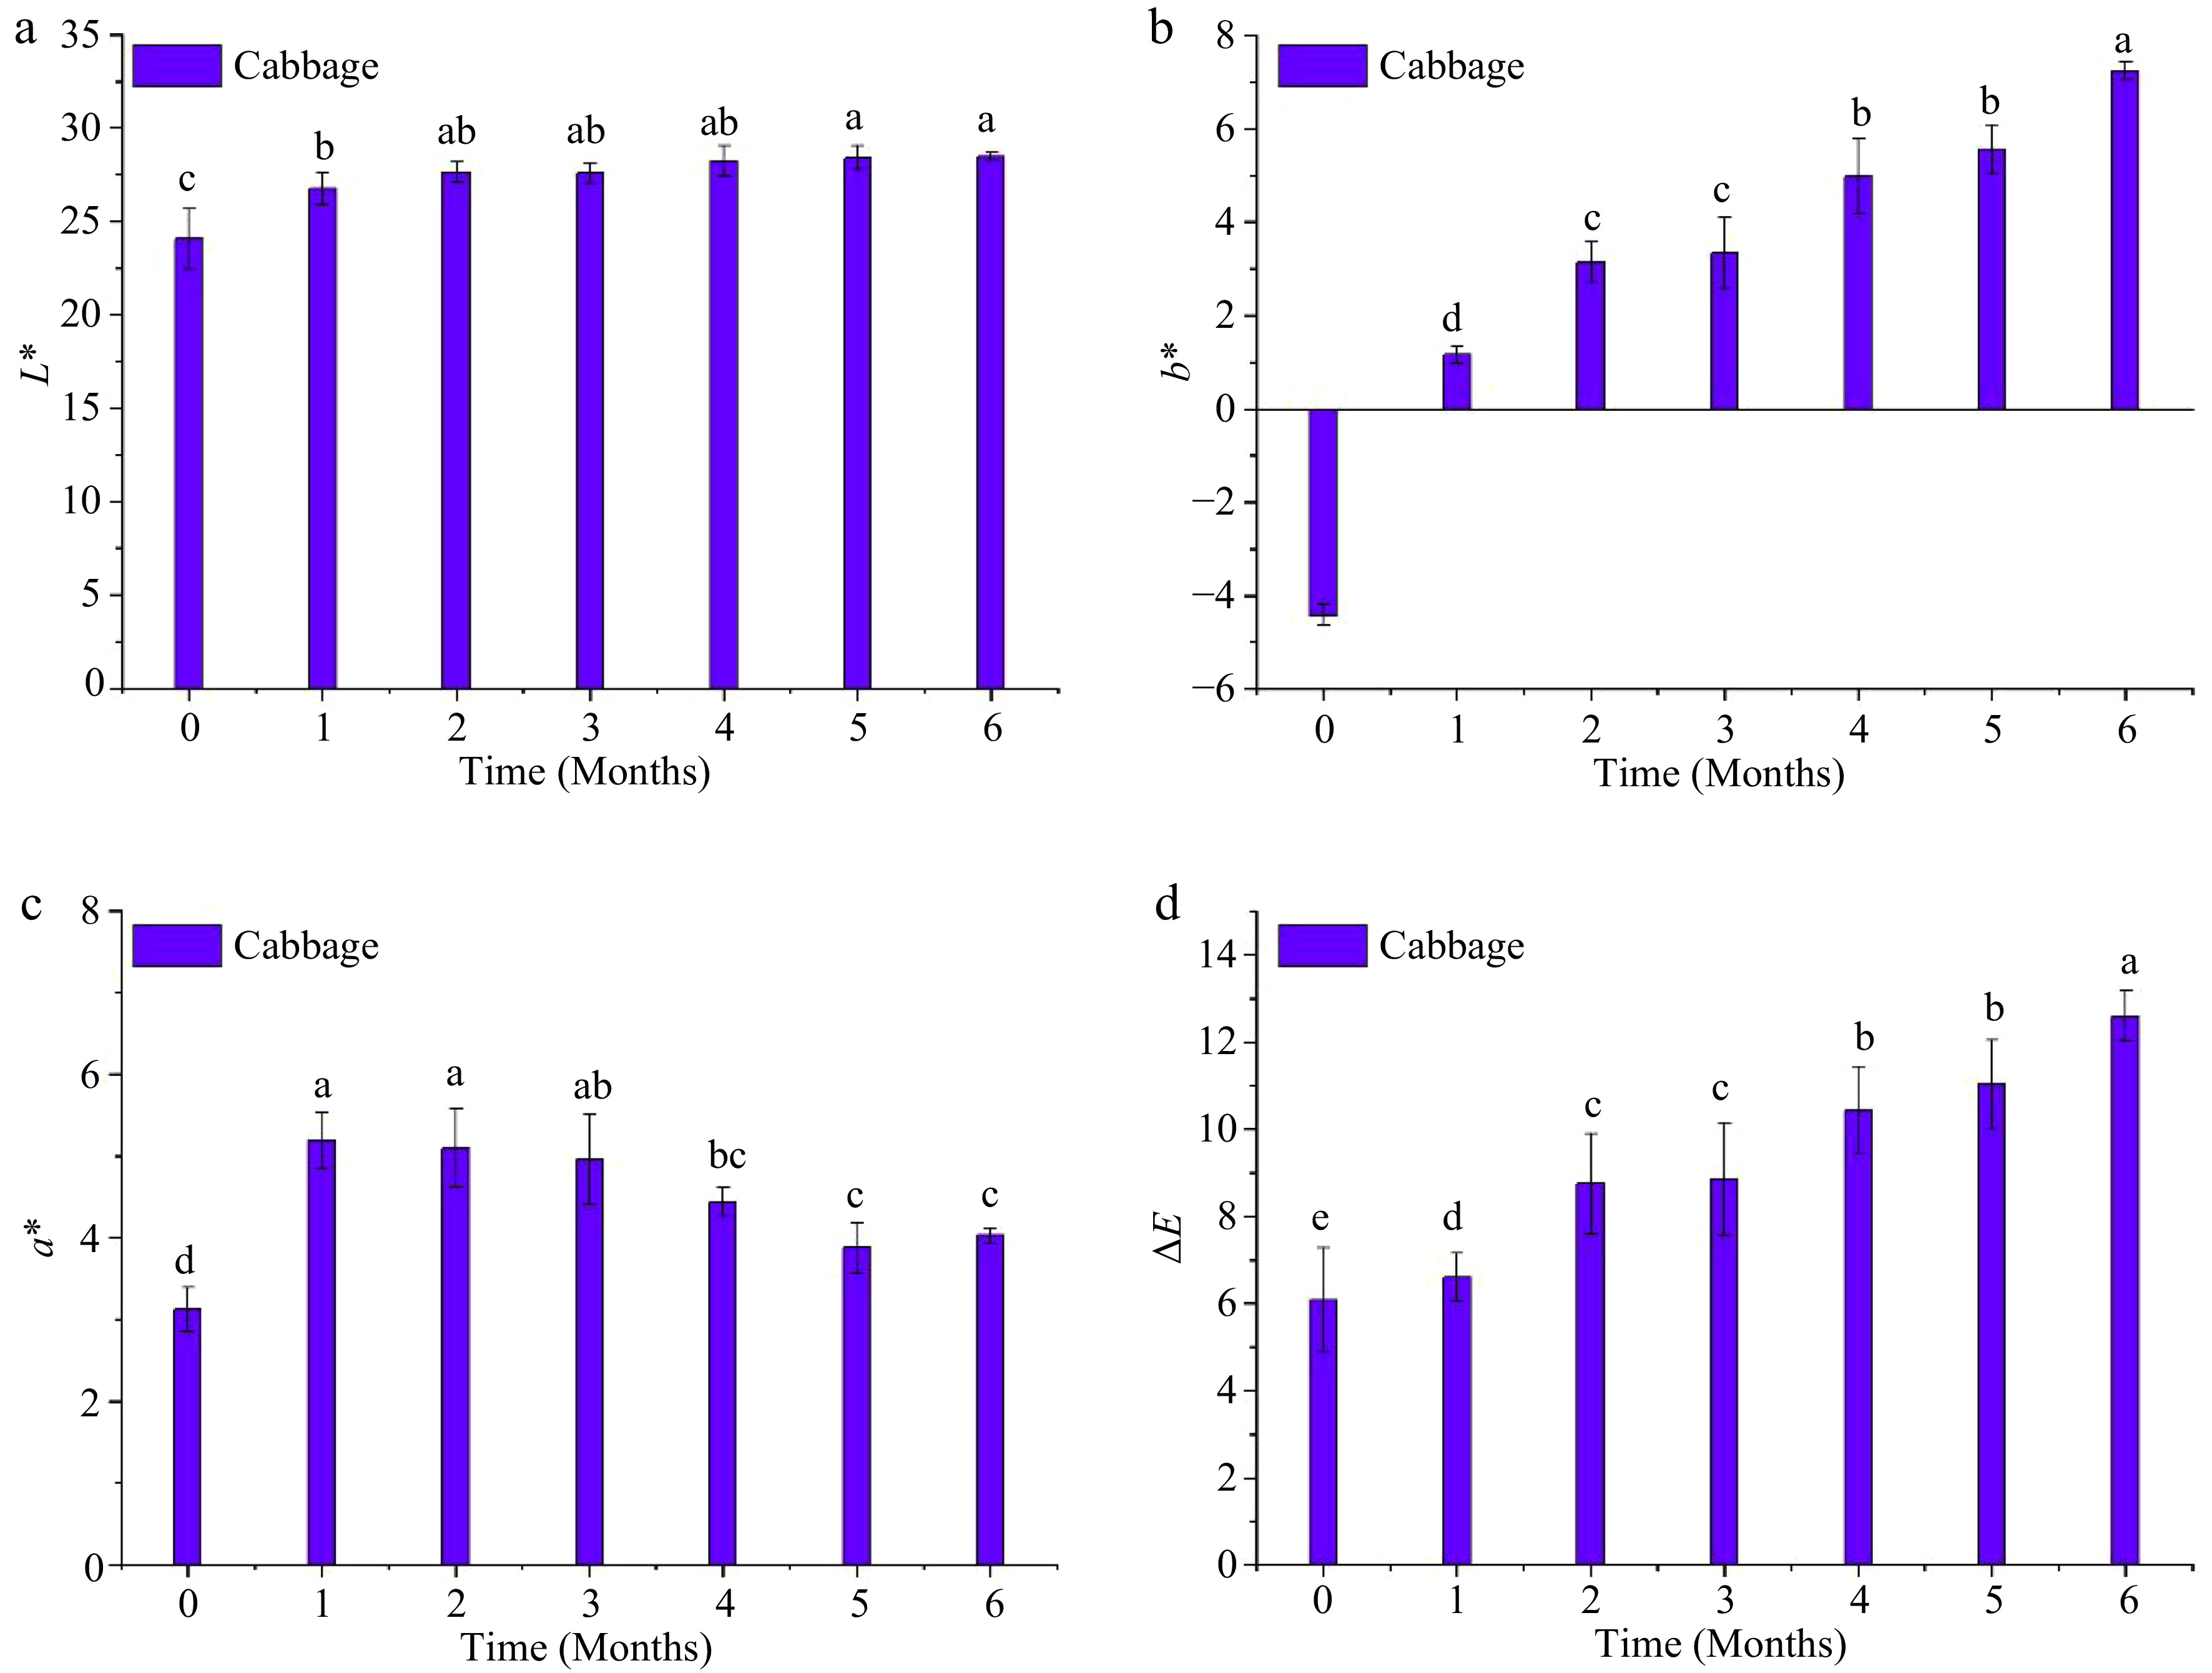
Figure 4.
Instrumental color changes of the MATS-processed cabbage puree during 6 months of storage at 37.8 °C: (a) lightness, (b) redness, (c) blueness, and (d) total color difference. Values with the same superscript letters are not significantly different (p > 0.05), n = 6.
-
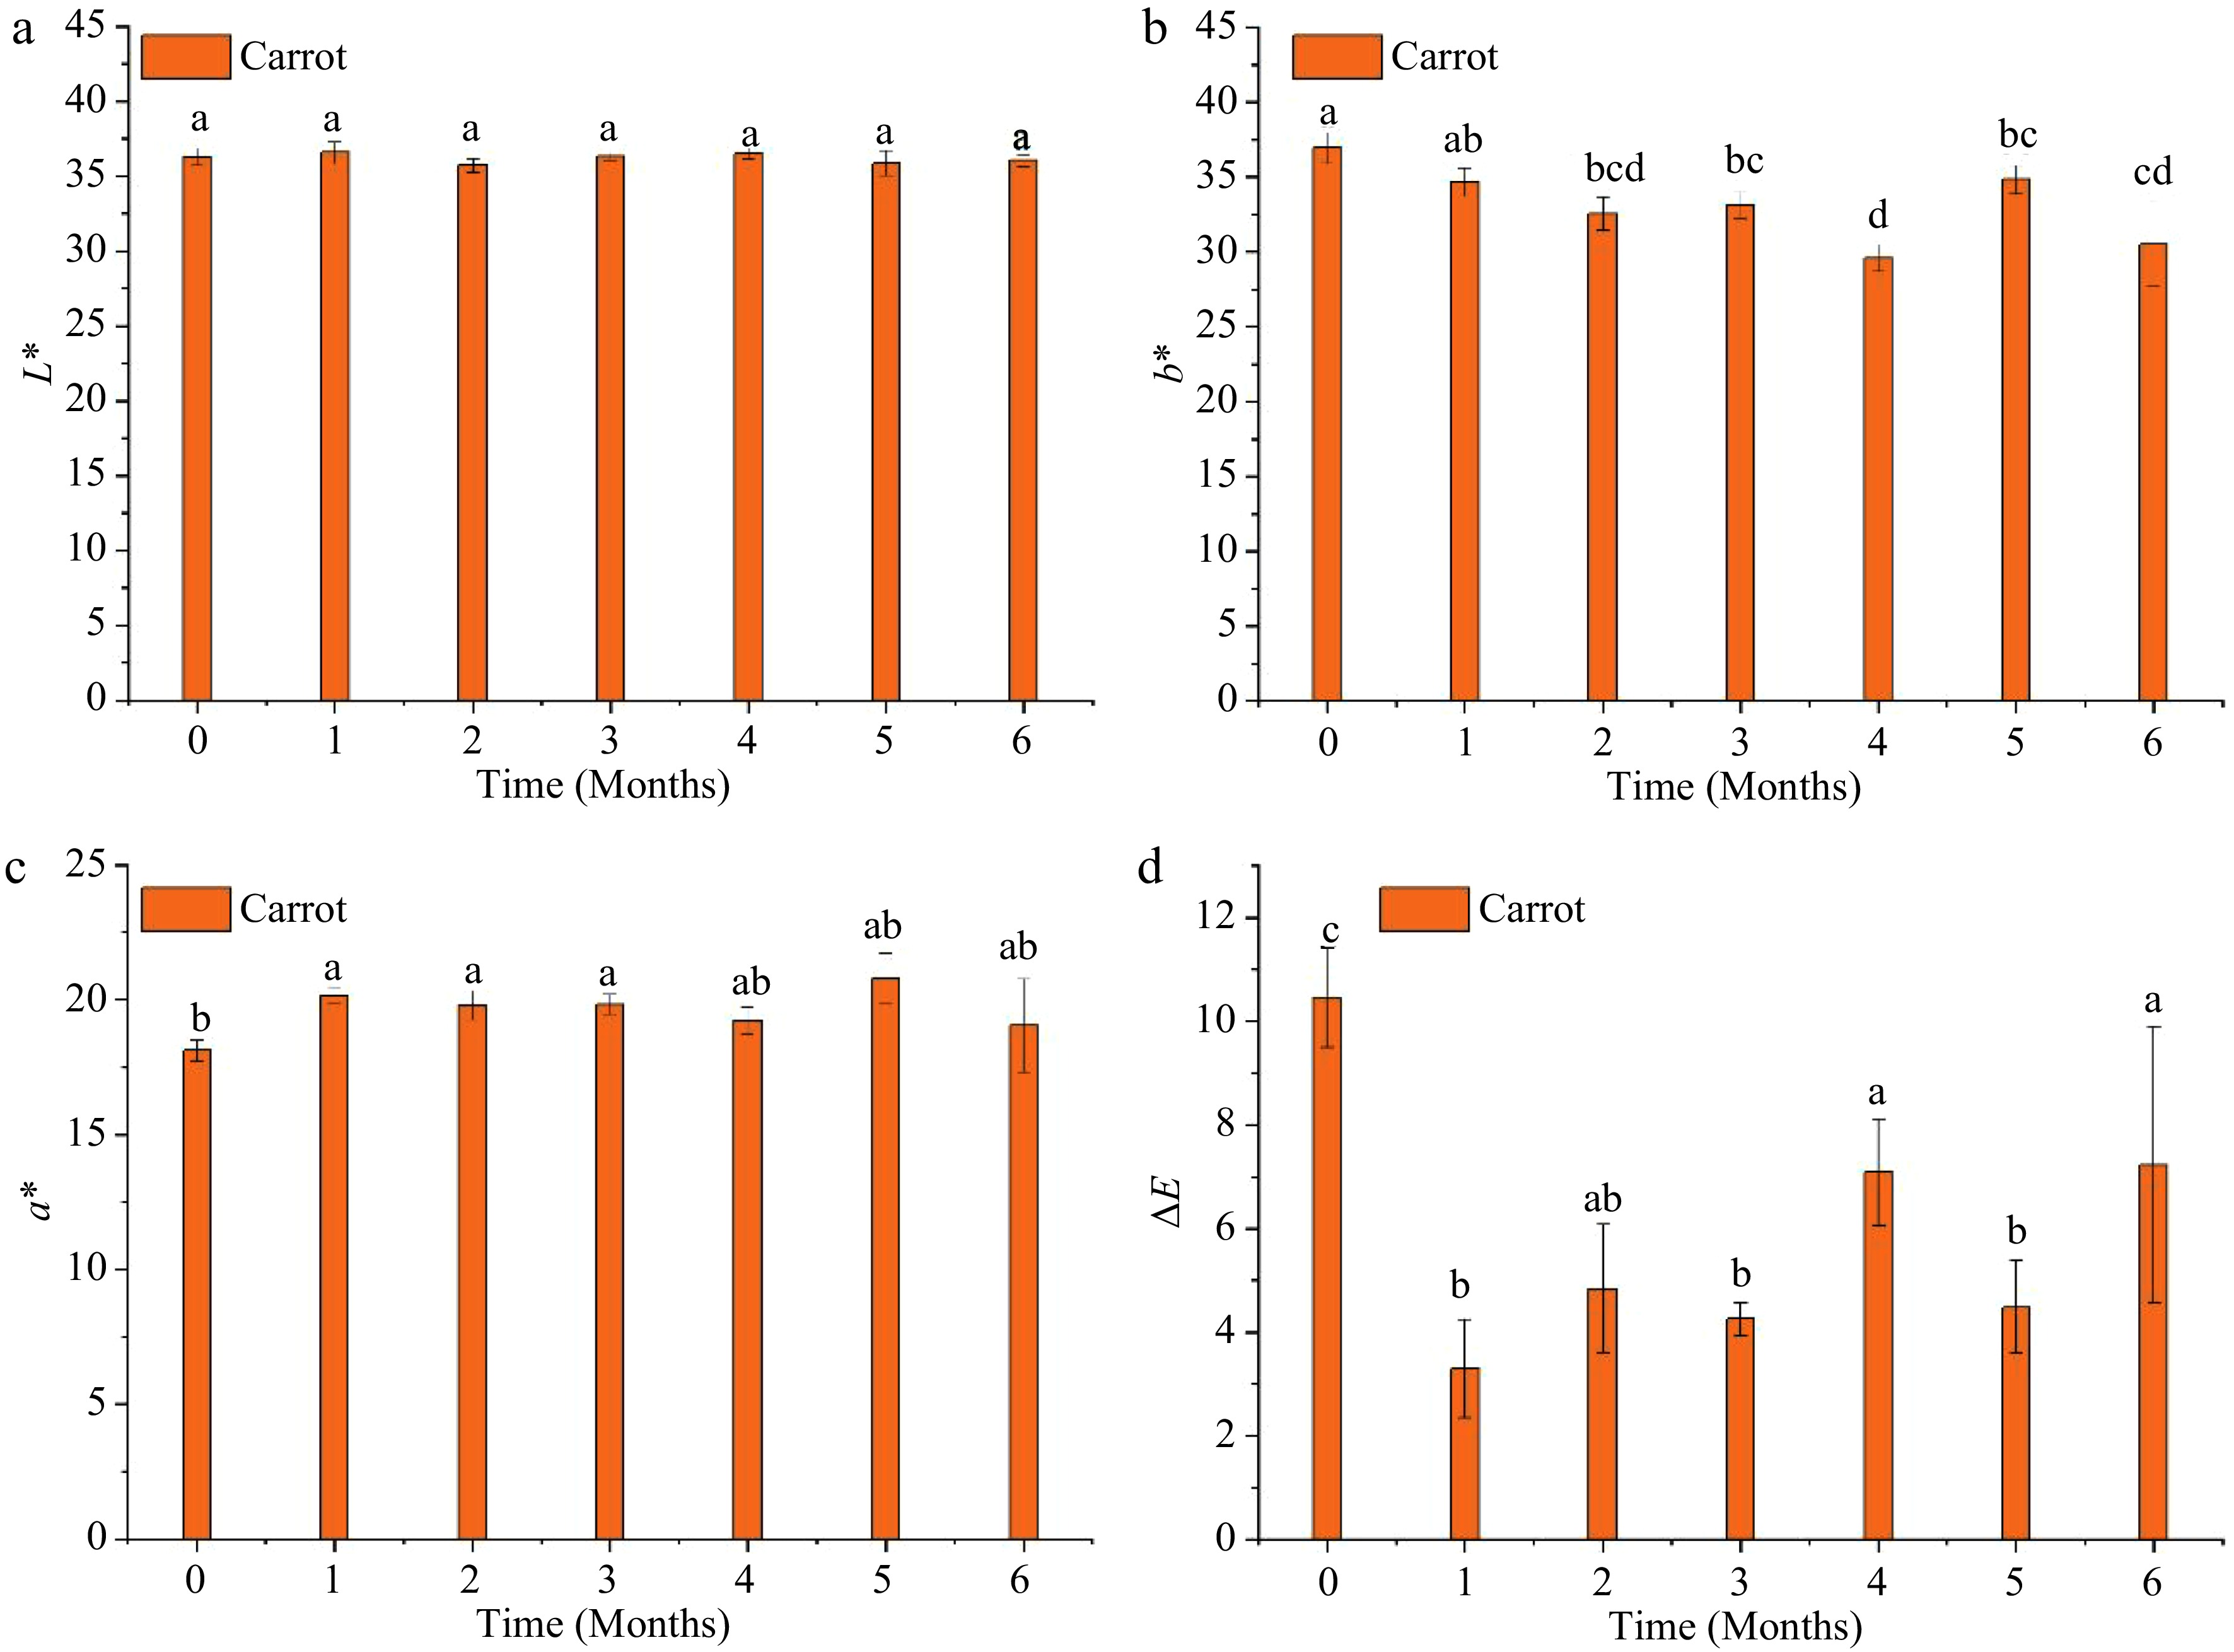
Figure 5.
Instrumental color changes of the MATS-processed carrot puree during 6 months of storage at 37.8 °C: (a) lightness, (b) redness, (c) yellowness, and (d) total color difference. Values with the same superscript letters are not significantly different (p > 0.05), n = 6.
-
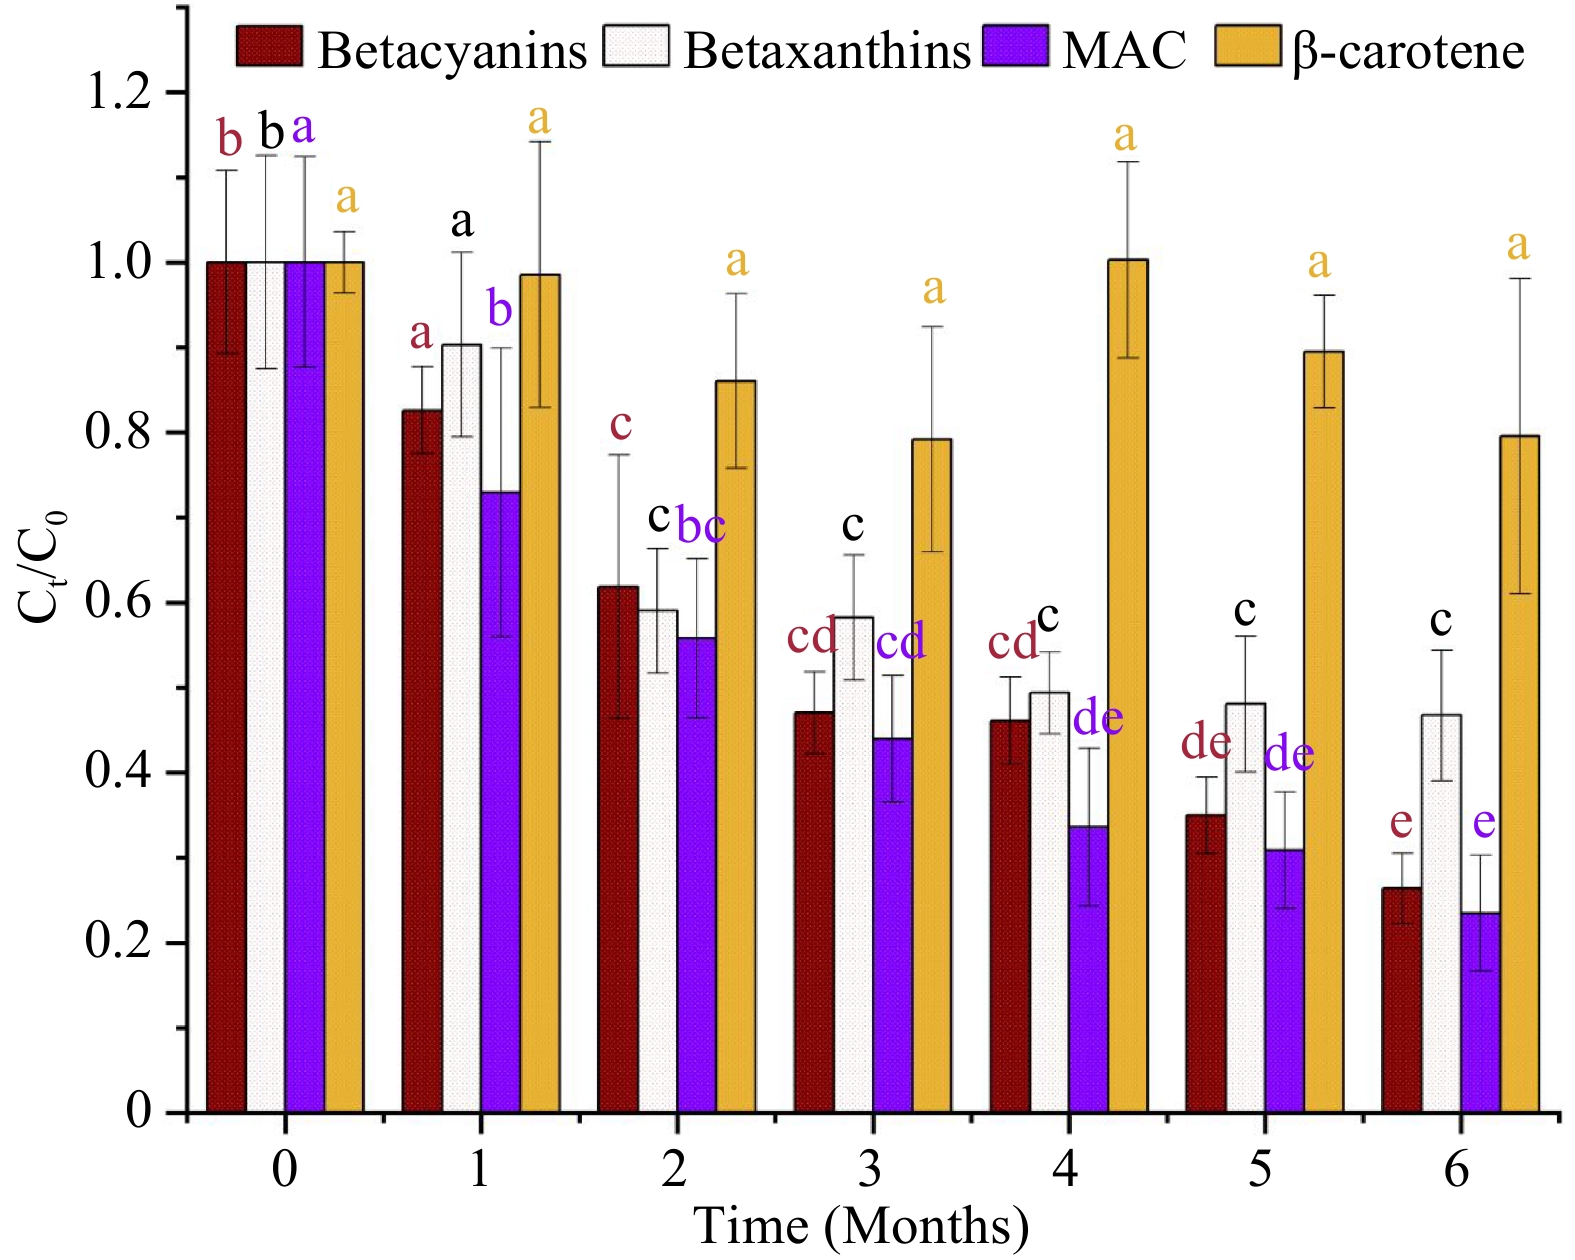
Figure 6.
Concentration of natural pigments (betacyanins, betaxanthins, total monomeric anthocyanins (MAC), and beta-carotene) in MATS-processed beetroot puree samples during 6 months of storage at 37.8 °C (n = 6). Values with the same color and superscript letters are not significantly different (p > 0.05).
-
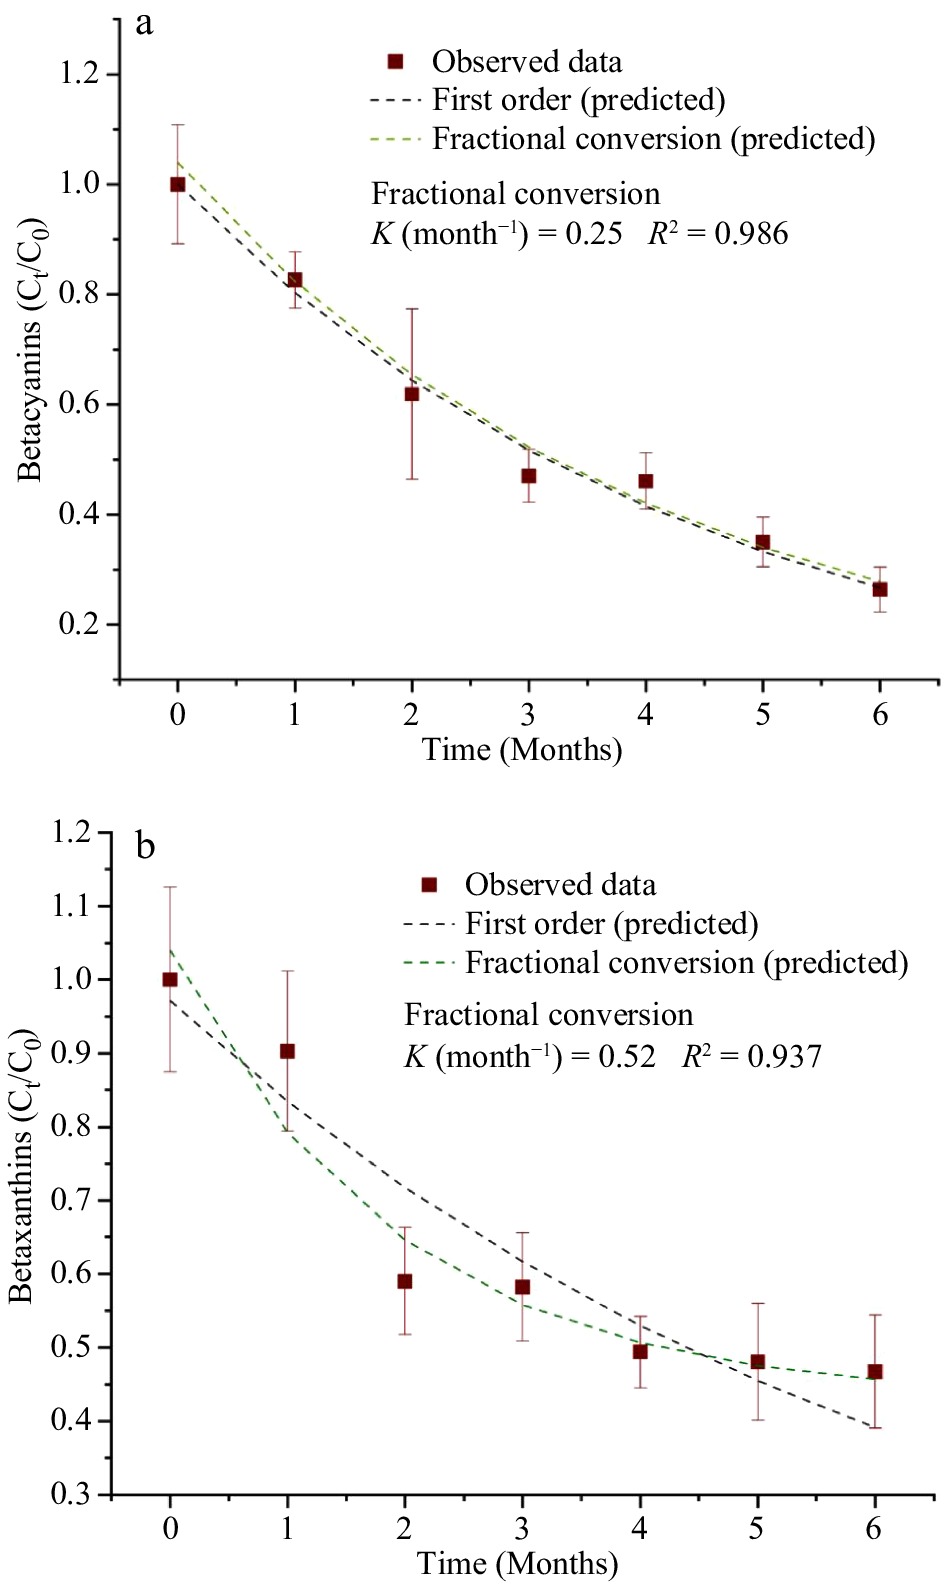
Figure 7.
Concentration of betalains [(a) betacyanins, (b) betaxanthins] during the 6 months of storage at 37.8 °C fitted with the first order and fractional conversion models, n = 6.
-
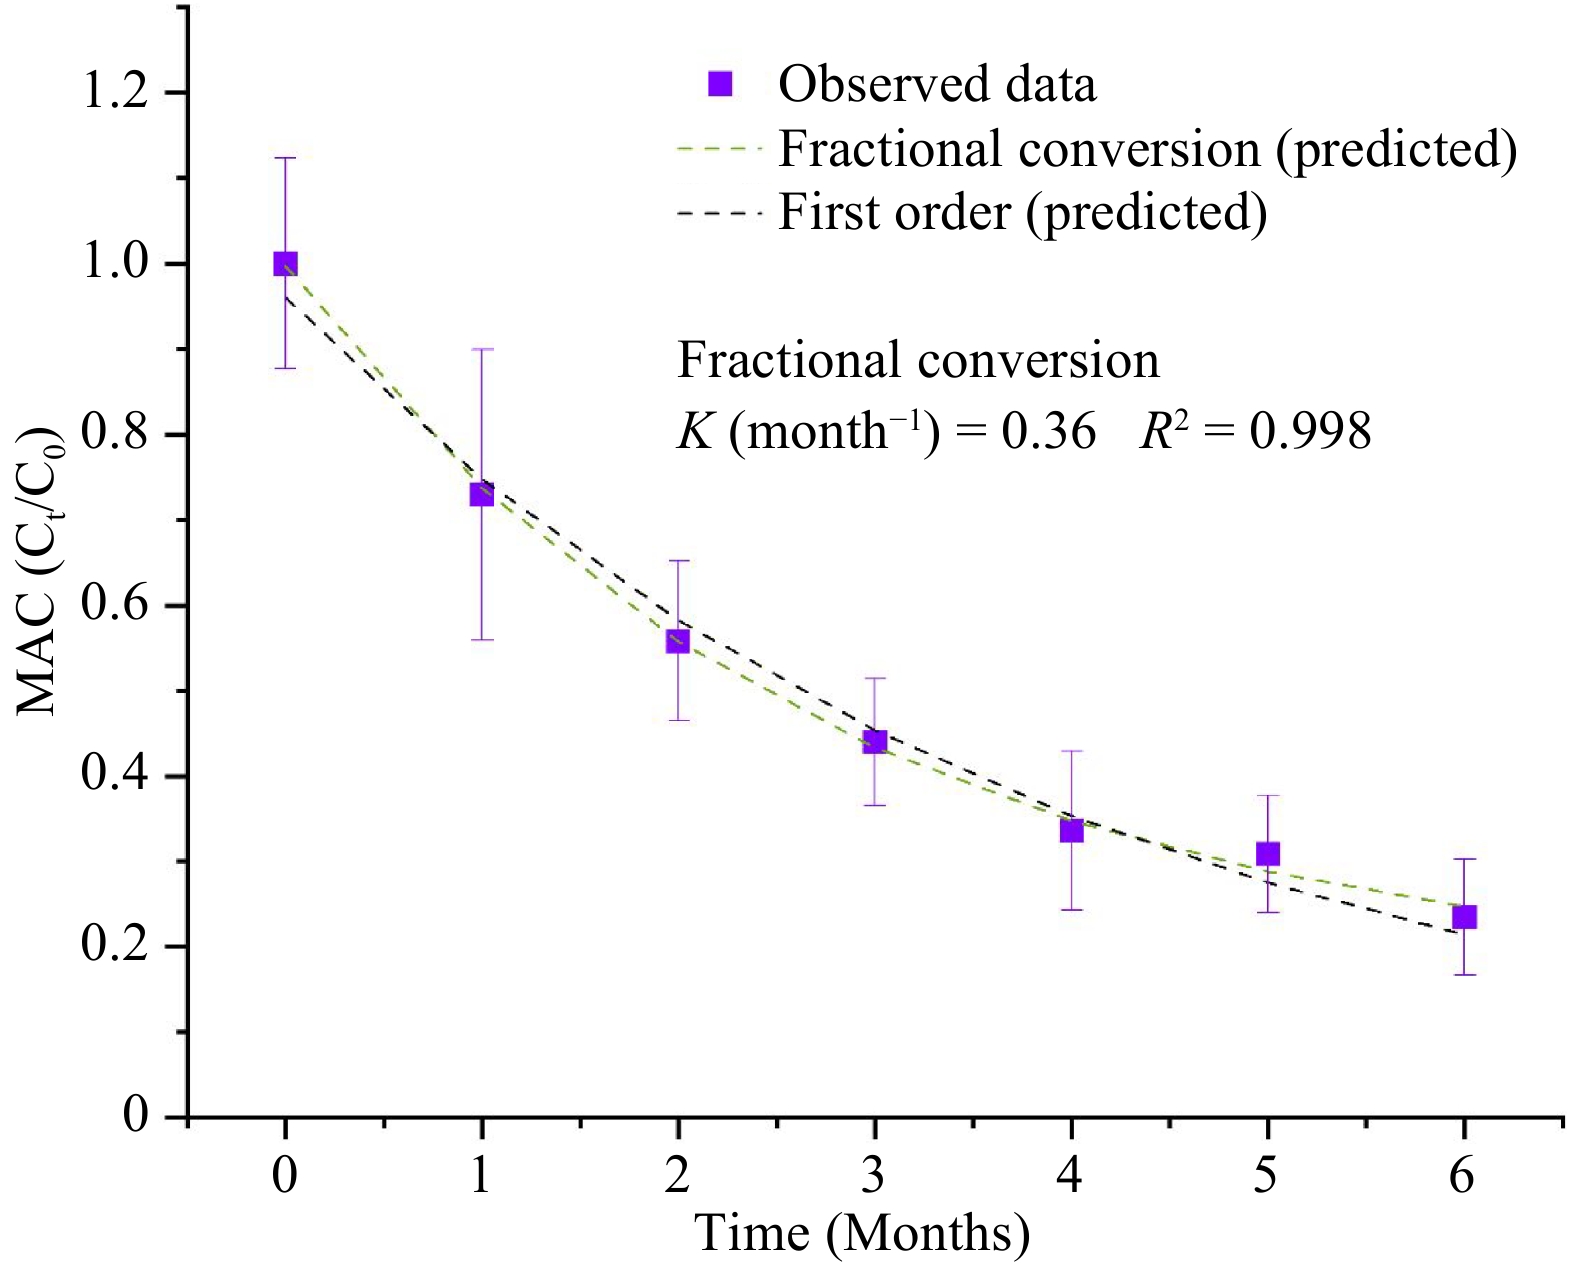
Figure 8.
Concentration of total monomeric anthocyanins (MAC) during the 6 months of storage at 37.8 °C fitted with the first order and fractional conversion models, n = 6.
-
MATS processing parameters Unit Product Carrot puree Beetroot puree Cabbage puree Pre-heating temperature °C 61 61 61 Pre-heating time min 20 20 20 Water temperature in microwave heating section °C 124 124 124 Microwave heating time min 3.04 3.40 3.70 Water temperature in the holding section °C 124 124 124 Holding time min 3.12 3.49 3.80 Cooling water temperature °C 20 20 20 Cooling time min 5 5 5 Belt speed inch/min 42.0 37.5 34.5 Microwave power for cavities (both 1st and 2nd/3rd/4th cavities) kW 11.7/3.2/
3.711.7/3.2/
3.711.7/3.2/
3.7Table 1.
Processing conditions of the three MATS treatments for the purees.
-
Vegetable puree Quality attribute Before MATS After MATS Beetroot pH 6.30 ± 0.02a 6.03 ± 0.19b L* 12.5 ± 0.65a 14.05 ± 0.53b a* 1.90 ± 0.20a 7.64 ± 0.93b b* 0.22 ± 0.16a 2.36 ± 0.31b ΔE None 6.39 ± 1.09 BC (mg/100 g) 33.7 ± 4.86a 27.0 ± 2.91b BX (mg/100 g) 21.7 ± 2.97a 15.4 ± 1.93b Cabbage pH 5.90 ± 0.02a 5.62 ± 0.01b L* 19.1 ± 0.48a 24.1 ± 1.61b a* 5.32 ± 0.23a 3.13 ± 0.27b b* –6.92 ± 0.17a –4.42 ± 0.22b ΔE None 6.09 ± 1.20 MAC (mg/100 g) 47.45 ± 4.00a 35.09 ± 4.34b Carrot pH 5.57 ± 0.04a 5.35 ± 0.03b L* 40.9 ± 0.52a 36.3 ± 0.55b a* 27.3 ± 0.78a 18.1 ± 0.38b b* 36.0 ± 1.33a 37.0 ± 1.02b ΔE None 10.5 ± 0.97 β-Carotene (μg/g) 55.1 ± 12.1a 57.4 ± 2.07a BC: betacyanin in beetroot puree, BX: betaxanthin in beetroot puree, and MAC: total monomeric anthocyanins in cabbage puree. Values with the same superscript letters are not significantly different (p > 0.05). Table 2.
Quality attributes of vegetable purees after the MATS treatment, n = 6.
-
Food product Type of processing Processing conditions Total color change (ΔE) Ref. Beetroot juice HPP 600 MPa for 3 min at ambient temperatures 3.49 ± 0.04 [24] Beetroot puree In-package thermal pasteurization 90 °C for 10 min in hot water bath 2.44 ± 0.06 to 2.89 ± 0.12 [12] Beetroot puree PATS 600 MPa at for 5 min at 90 °C 2.49 ± 0.18 [25] Beetroot slices HPP HPP 600 MPa for 3–30 min at ambient temperature 21.80 ± 0.30 to 27.60 ± 0.90 [26] Beetroot puree MATS 124 °C, 6.89 min 6.39 ± 1.09 Present study Cabbage puree In-package thermal pasteurization 90 °C for 10 min in hot water bath 2.81 ± 0.03 to 3.59 ± 0.03 [12] Purple mashed potato PATS 600 MPa at for 5 min at 90 °C 9.99 ± 0.24 [25] Pomegranate juice HTST 110 °C/8.6 s 6.83 ± 1.06 [27] Strawberry puree HPP 600 MPa for 3min 2.12 ± 0.07 [28] Blackberry puree HPP 600 MPa for 3min 2.15 ± 0.03 [28] Cabbage puree MATS 124 °C, 8.8 min 6.09 ± 1.20 Present study Carrot puree In-package thermal pasteurization 90 °C for 10 min in hot water bath 1.02 ± 0.64 to 2.89 ± 0.12 [13] Pumkin puree PATS 600 MPa at for 5 min at 90 °C 3.37 ± 2.59 [25] Carrot juice HPP 600 MPa at for 5 min at 4 °C 5.39 ± 0.01 [29] Carrot puree MATS 124 °C, 8.12 min 10.50 ± 0.97 Present study HPP: high pressure processing, PATS: pressure-assisted thermal sterilization, and HTST: high temperature short time processing. Table 3.
Color assessment studies of foods processed with high pressure and thermal processes.
-
Model Natural pigments ΔE of vegetable purees Betacyanins Betaxanthins Anthocyanins Beetroot Cabbage Carrot First order k (month−1) 0.22 ± 0.01 0.14 ± 0.03 0.25 ± 0.01 * * 0.15 ± 0.04 t1/2 (month−1) 3.16 ± 0.20 4.80 ± 0.92 2.82 ± 0.15 * * 4.51 ± 1.23 R2 0.986 0.870 0.989 * * 0.784 RMSE 0.0291 0.070 0.0262 * * 0.740 Fractional conversion kf (month−1) 0.25 ± 0.09 0.52 ± 0.18 0.36 ± 0.03 * * * C∞ 0.06 ± 0.16 0.43 ± 0.06 0.15 ± 0.03 * * * t1/2 (month−1) 2.78 ± 0.98 1.34 ± 0.47 1.93 ± 0.19 * * * R2 0.986 0.937 0.998 * * * RMSE 0.0287 0.0505 0.0112 * * * Zero order k (month−1) 0.11 ± 0.01 0.08 ± 0.02 0.11 ± 0.02 0.46 ± 0.04 1.16 ± 0.07 0.78 ± 0.68 t1/2 (month−1) 4.07 ± 0.45 5.46 ± 1.48 5.46 ± 1.48 3.89 ± 0.61 2.40 ± 0.14 1.55 ± 0.40 R2 0.938 0.771 0.898 0.972 0.957 0.750 RMSE 0.0606 0.0959 0.898 0.138 0.396 0.762 R2 is correlation factor, and RMSE is root mean square error, n = 6, * R2 value was low due to poor fit of the model. Table 4.
Estimated parameters of the kinetics models for the natural pigments' degradation and overall color changes during the storage of 6 months at 37.8 °C.
Figures
(8)
Tables
(4)