-
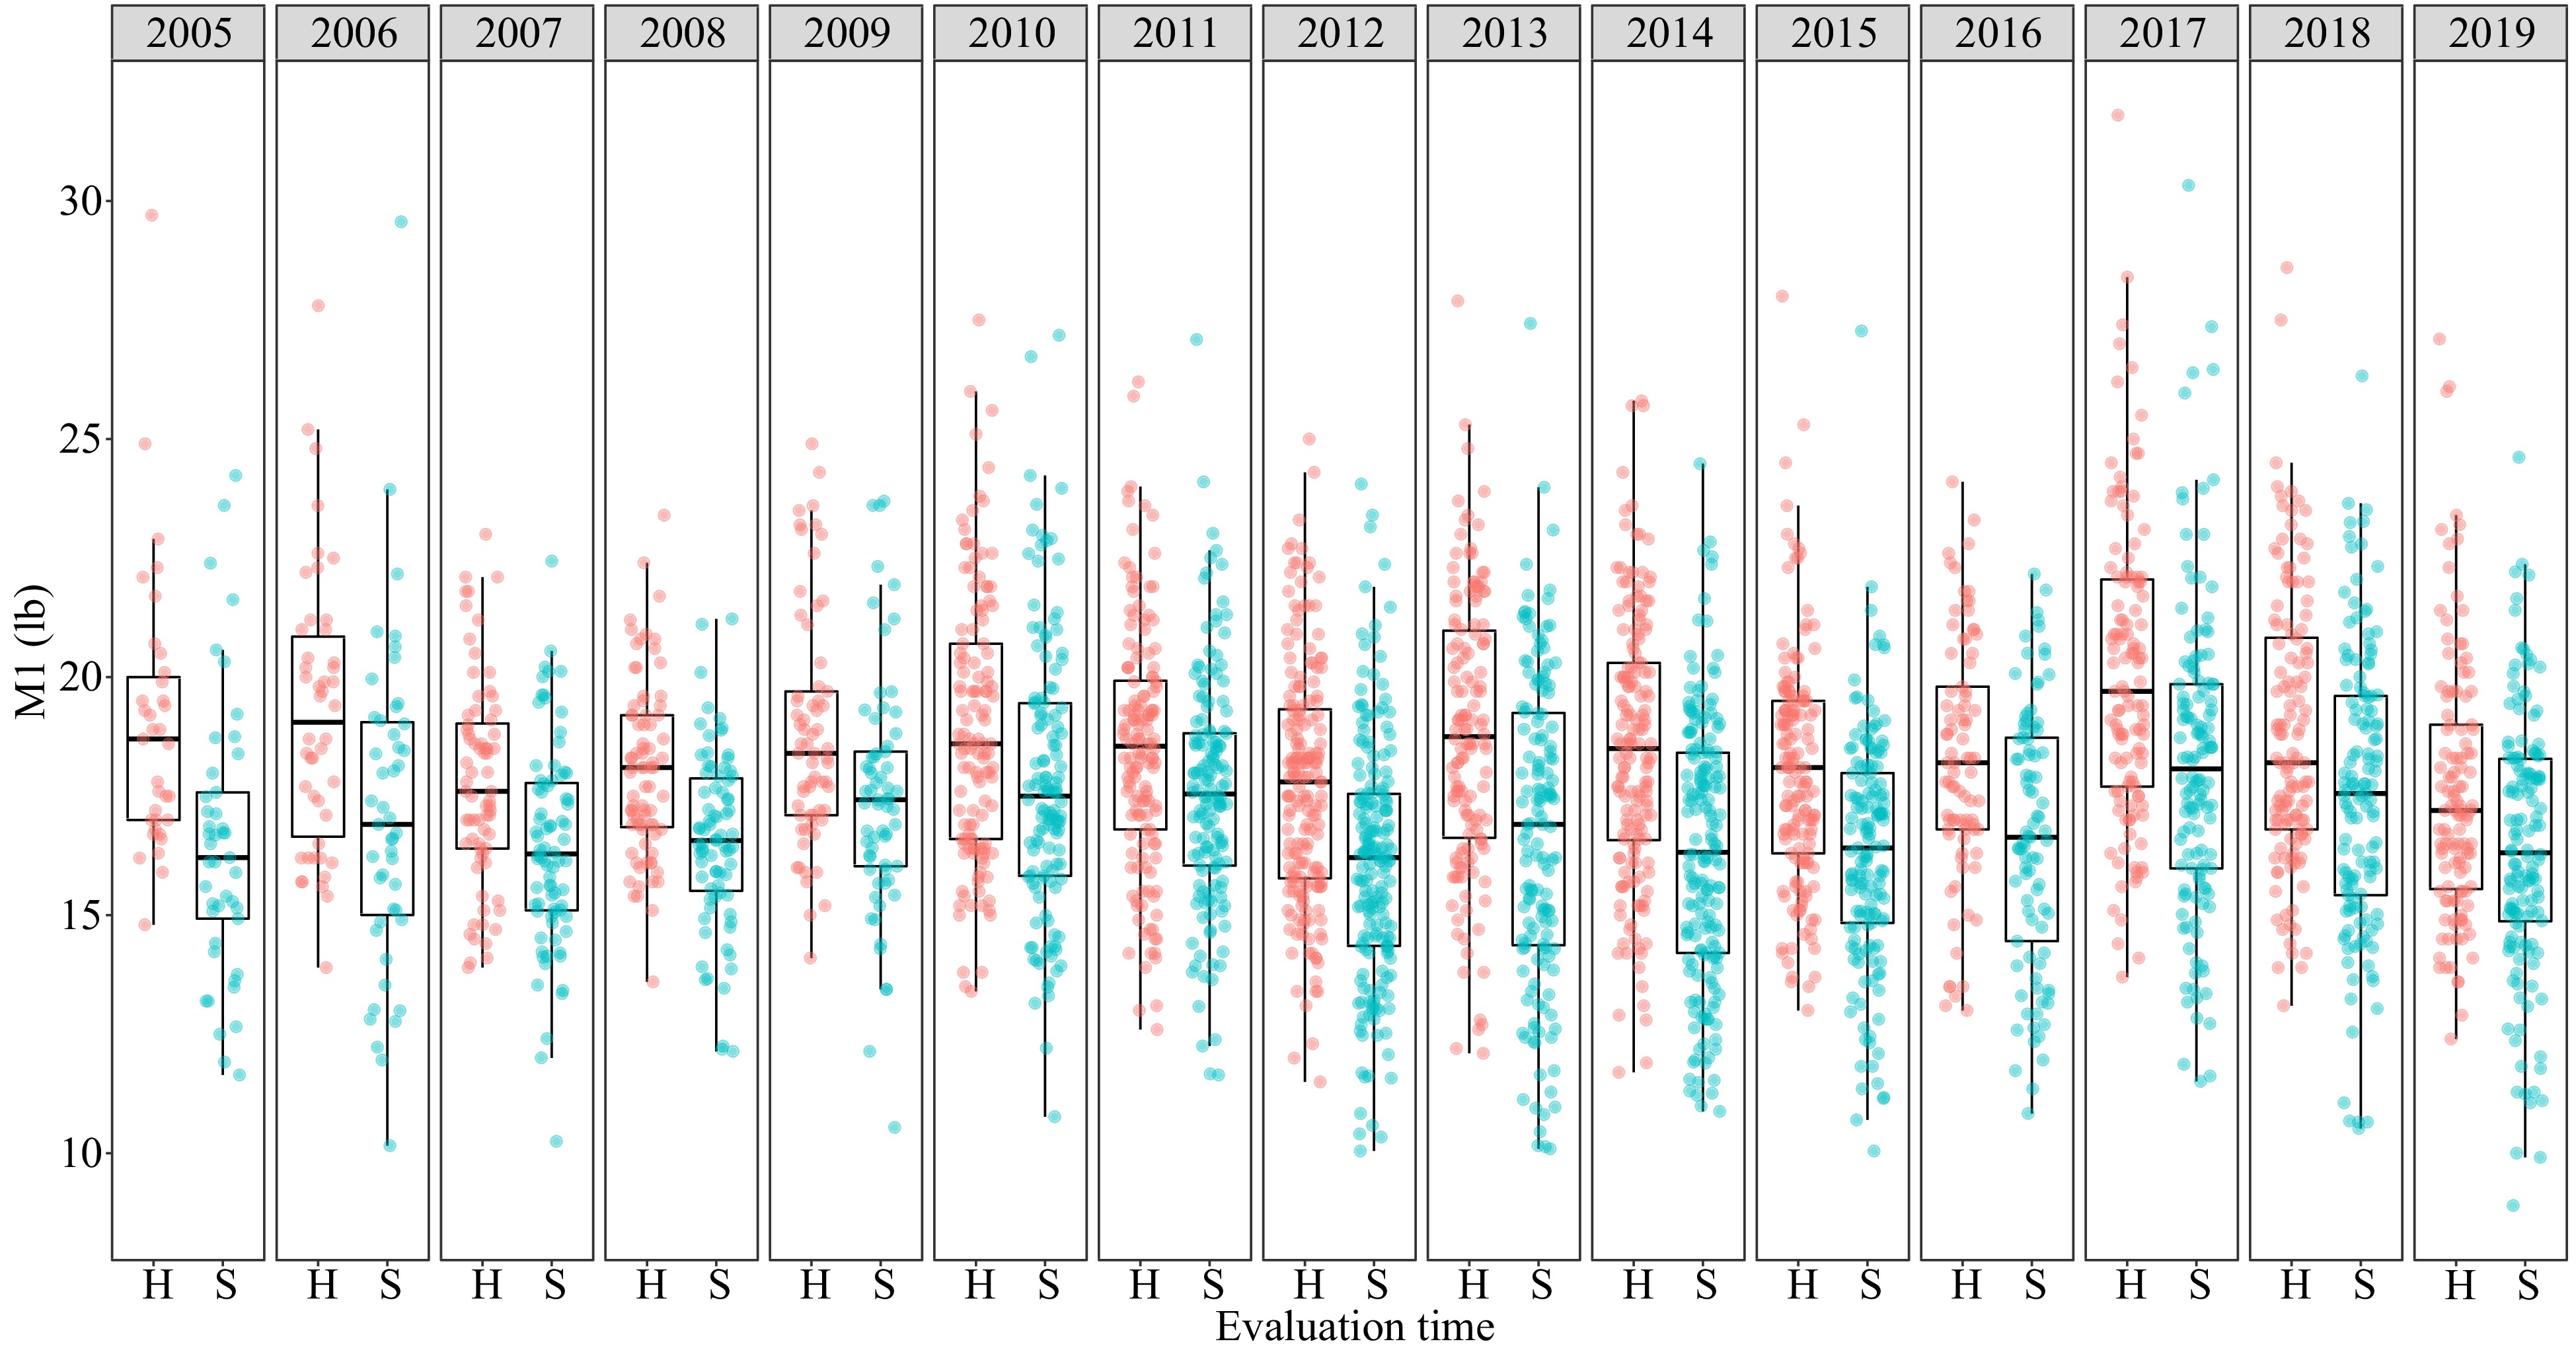
Figure 1.
Boxplots and data distribution of outer cortex fruit firmness (M1 – maximum hardness at region one) for 'H' – at harvest (i.e., before storage) and 'S' – after storage (i.e., after 2-month cold storage) apple samples of Phase Two accessions from 2005 to 2019.
-
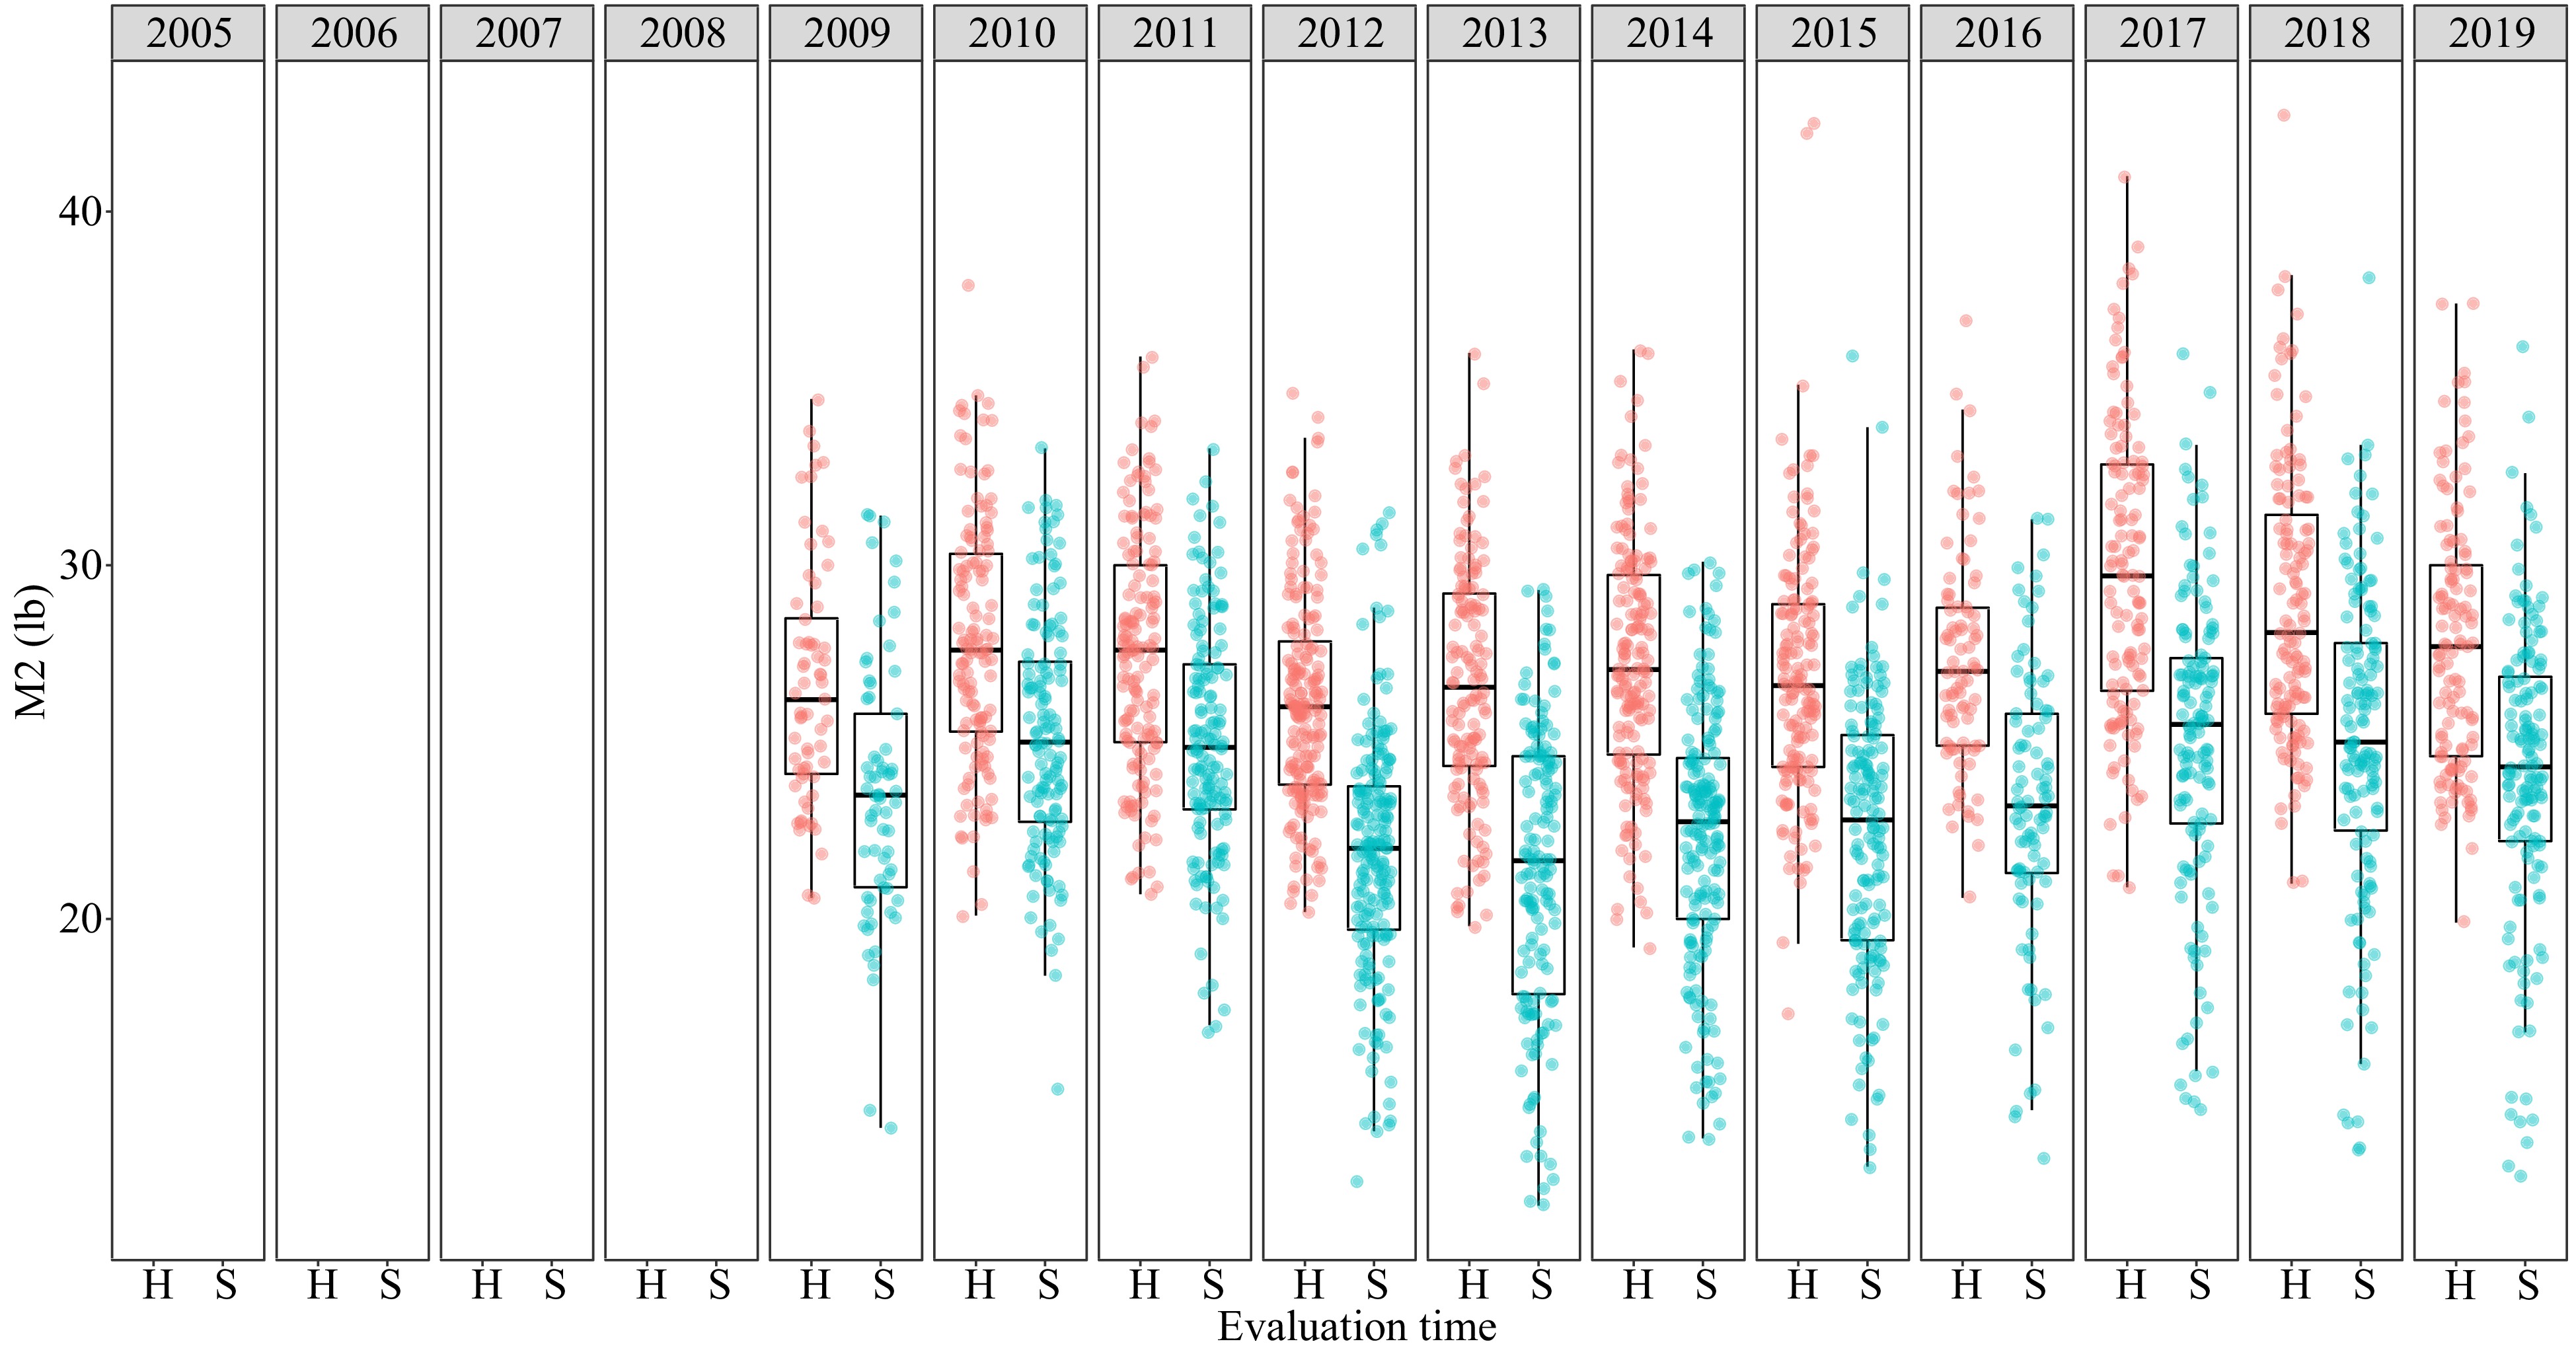
Figure 2.
Boxplots and data distribution of inner cortex fruit firmness (M2 – maximum hardness at region two) for 'H' – at harvest (i.e., before storage) and 'S' – after storage (i.e., after 2-month cold storage‡) apple samples of Phase Two accessions from 2009 to 2019. ‡ After storage ('S') also included 7 d at room temperature following 2 months of cold storage from 2012 onwards. M2 measurements started in 2009 with the acquisition of the MDT penetrometer.
-
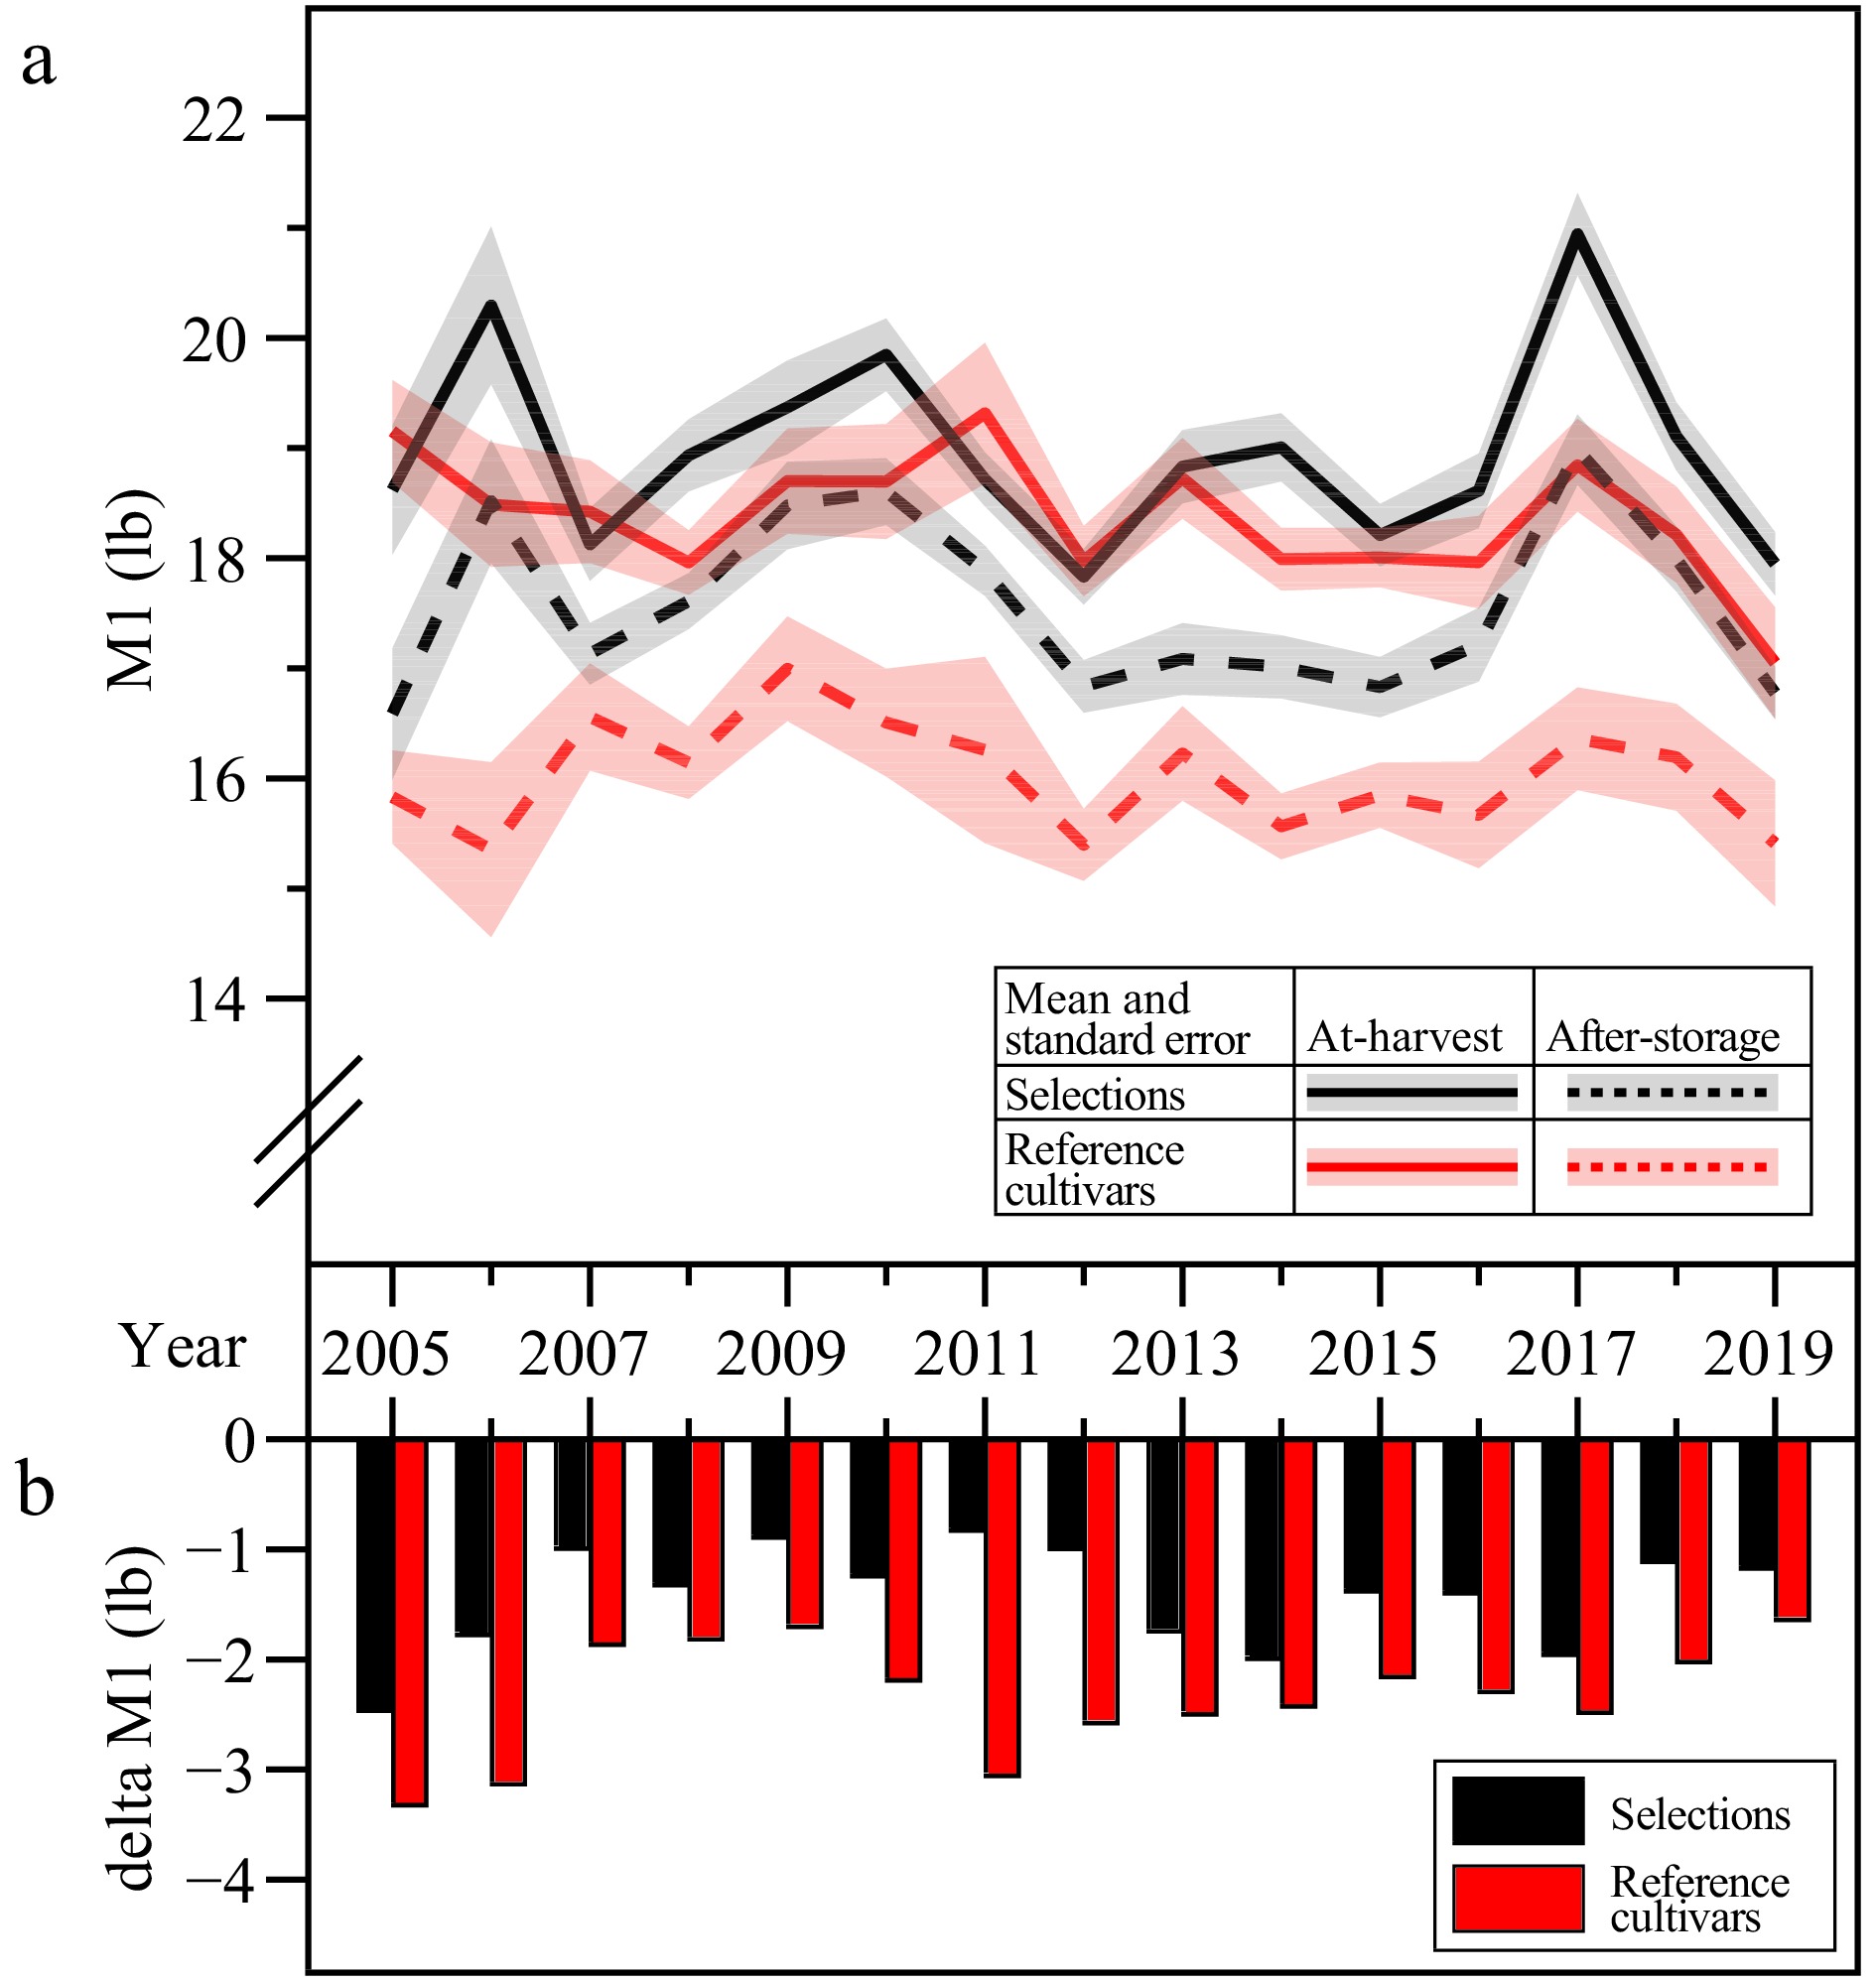
Figure 3.
Trends of outer cortex fruit firmness (M1 – maximum hardness at region one) at-harvest ('H') and after-storage ('S') from 2005 to 2019. (a) Means as lines and standard errors as shades, of selections in black and reference cultivars in red, where 'H' samples were shown as continuous lines and 'S' samples as dotted lines. (b) Deltas or differentials between harvest and after-storage M1 of selections (black)/cultivars (red) was calculated by subtracting 'H' M1 from 'S' M1.
-
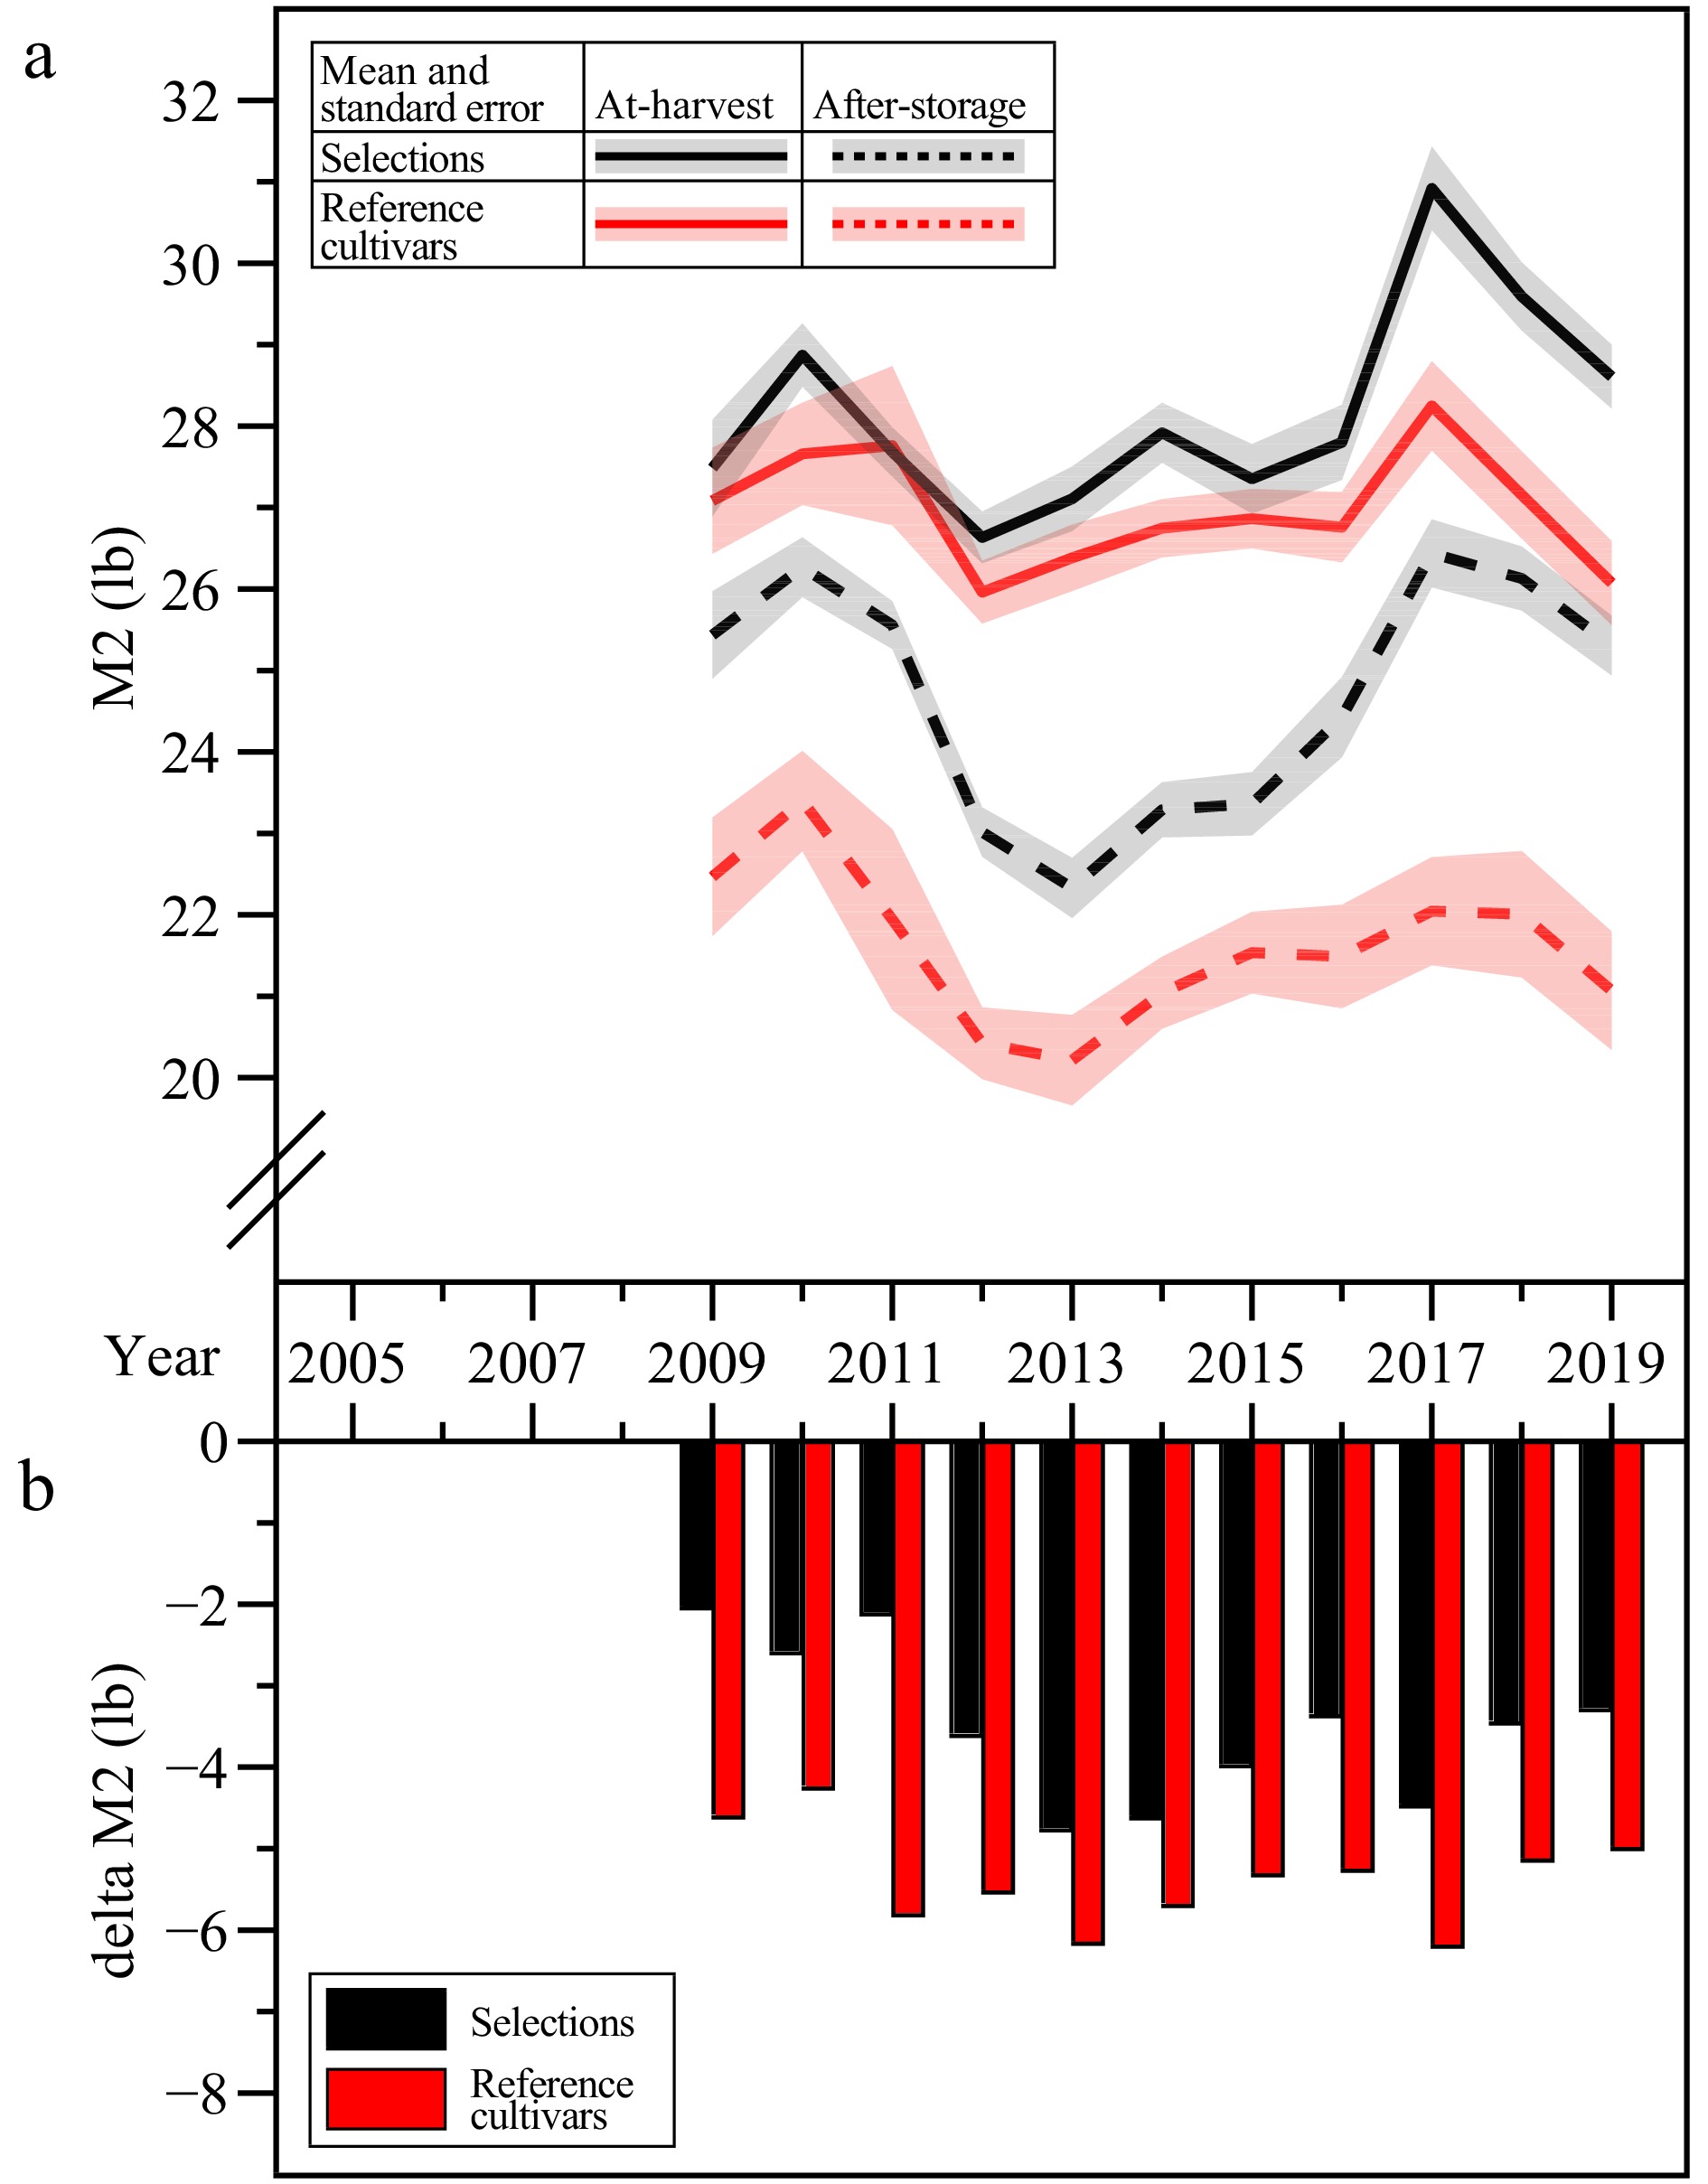
Figure 4.
Trends of inner cortex fruit firmness (M2 – maximum hardness at region two) at-harvest ('H') and after-storage ('S') from 2005 to 2019. (a) Means as lines and standard errors as shades, of selections in black and reference cultivars in red, where 'H' samples were shown as continuous lines and 'S' samples as dotted lines. (b) Deltas or differentials between at-harvest and after-storage M2 of selections (black)/cultivars (red) was calculated by subtracting 'H' M2 from 'S' M2.
-
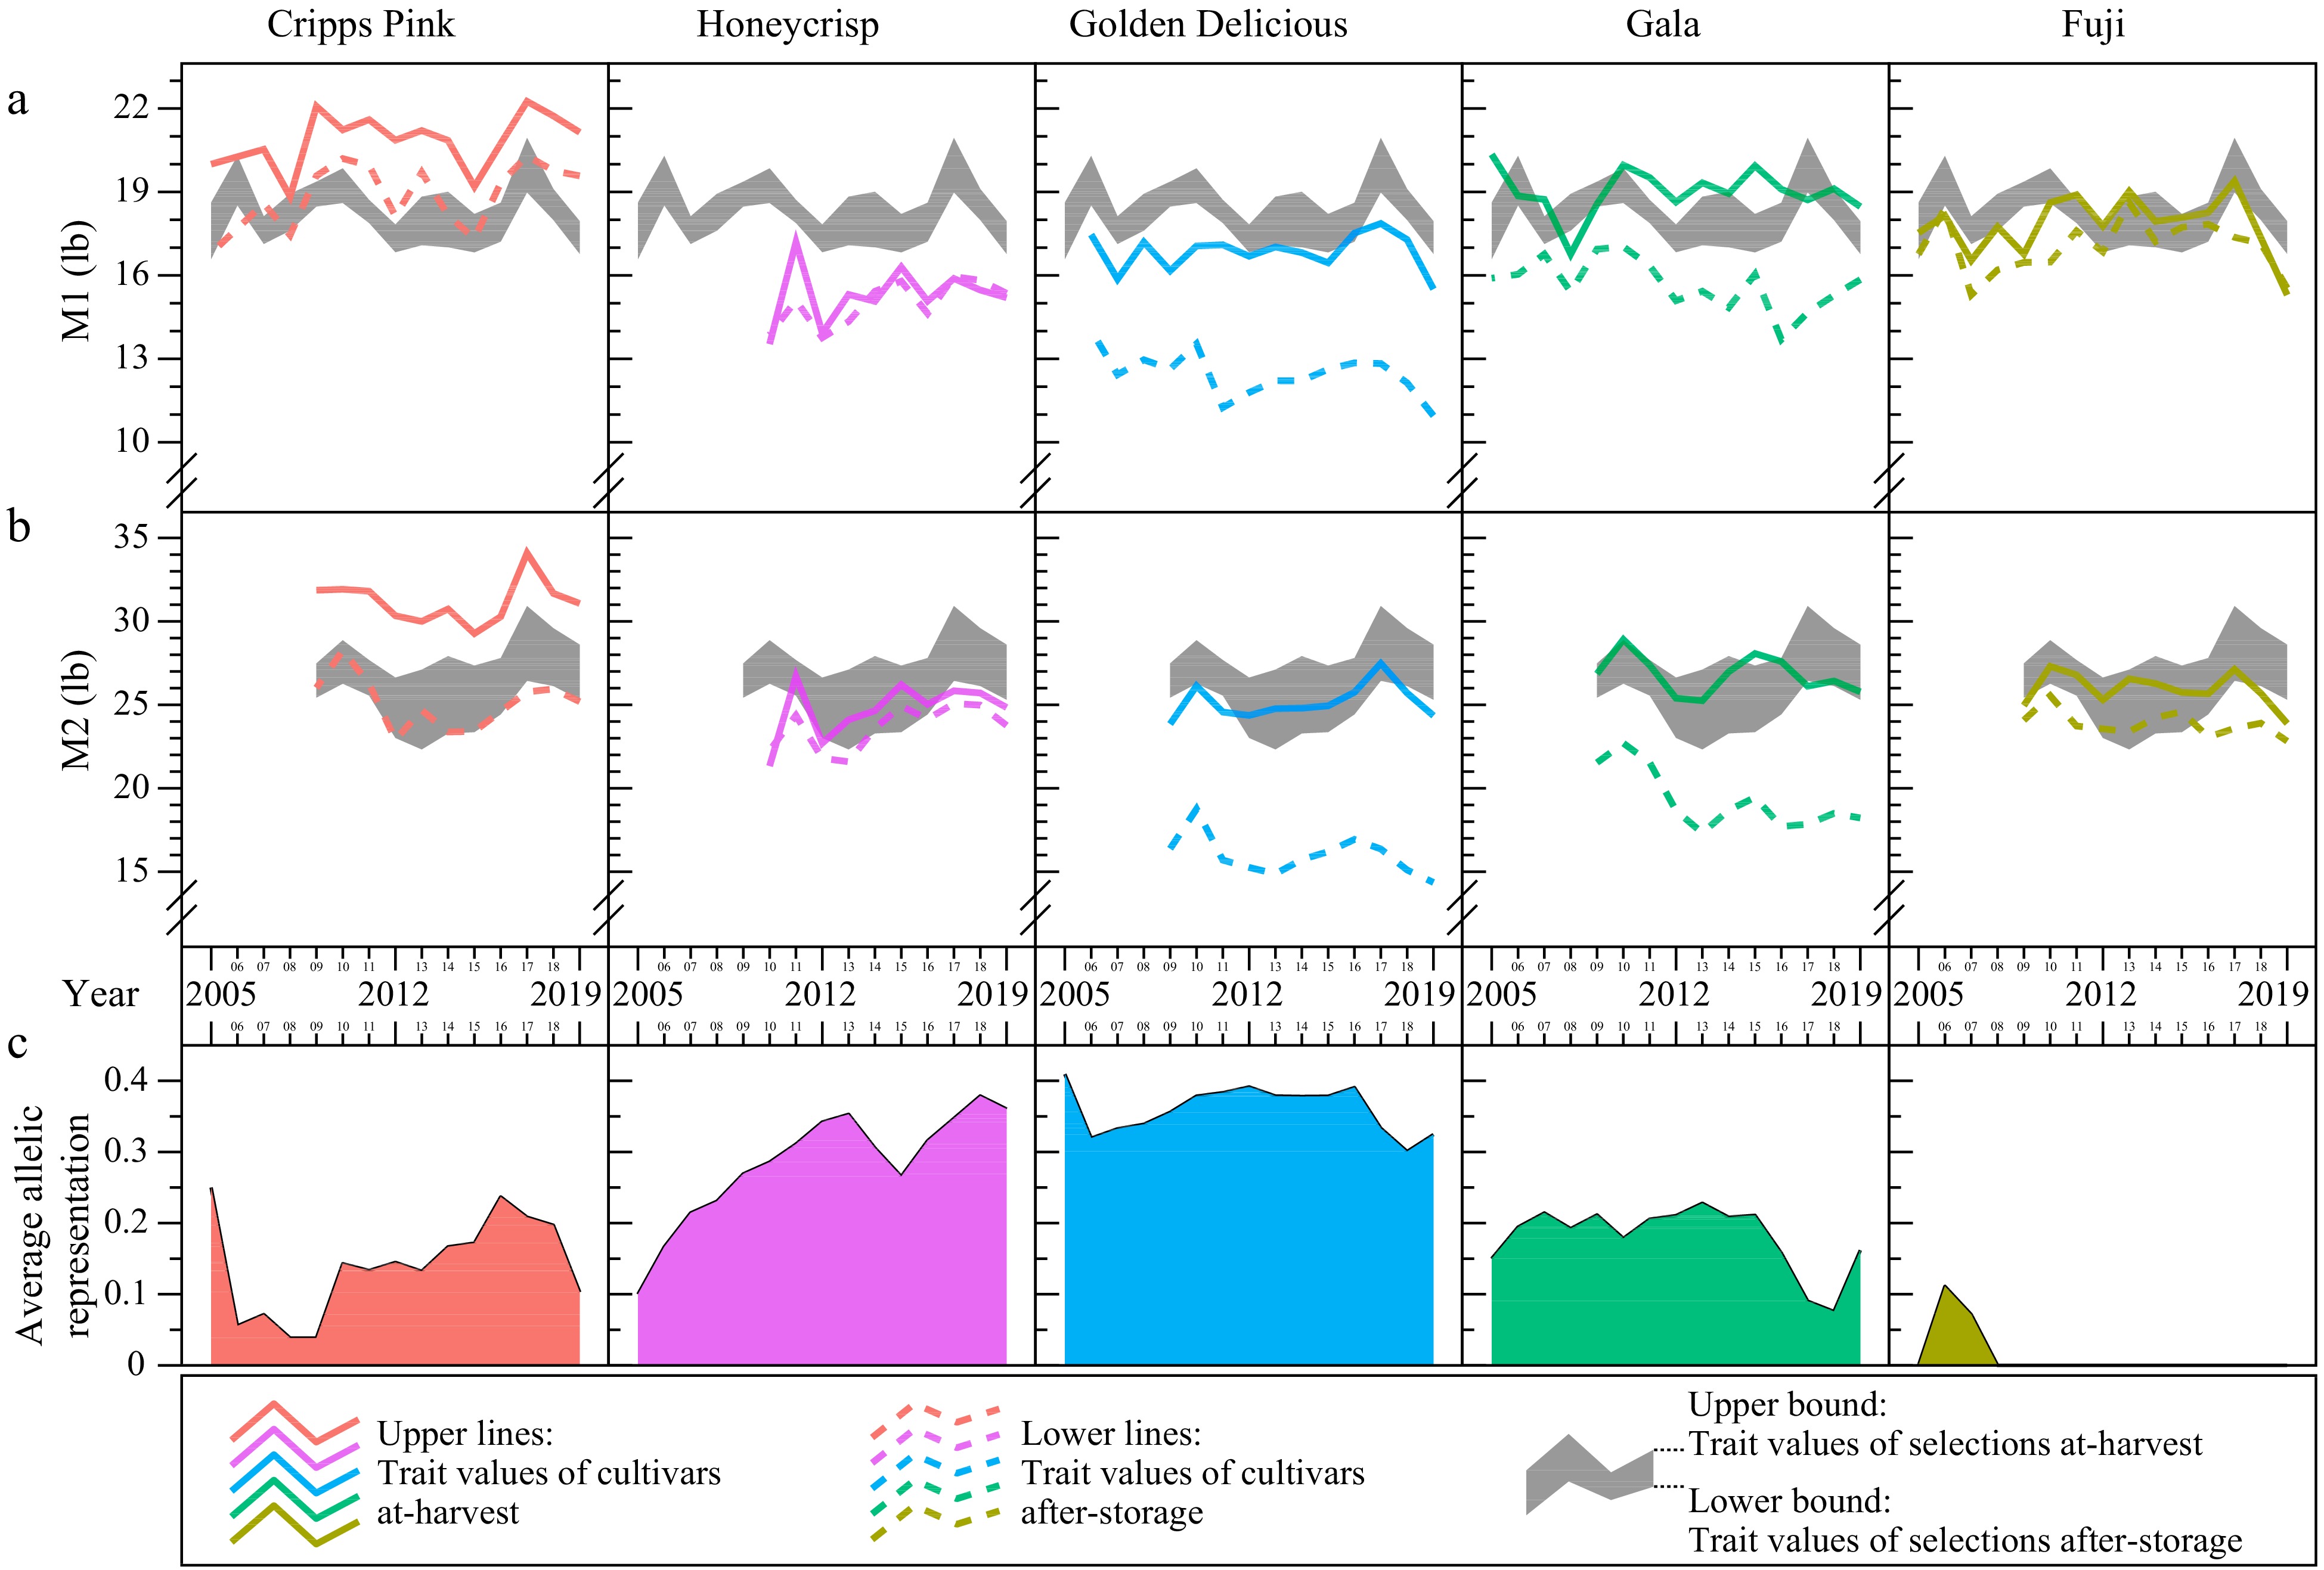
Figure 5.
Trends of outer cortex fruit firmness (M1 – maximum hardness at region one) and inner cortex fruit firmness (M2 – maximum hardness at region two) at-harvest ('H') and after-storage ('S') of Phase Two (P2) selections and individual reference cultivars from 2005 to 2019. (a) Shaded regions are M1 values for selections, (b) shaded regions are M2 values for selections, where the upper bound is selections averaged 'H' M1, while the lower bound is selections averaged 'S' M1. Colored lines correspond to individual reference cultivar's M1 (continuous – 'H'; dotted – 'S'). (c) Average allelic representations of five cultivars among P2 selections.
-
2005 2006 2007 2008 2009 2010 2011 2012 2013 2014 2015 2016 2017 2018 2019 Braeburn 1 1 1 1 1 1 1 1 1 − − − − − − Co-op 15 1 1 − − − − − − − − − − − − − Cripps Pink 1 − 2 2 2 3 2 5 6 5 5 3 3 4 3 Fuji 1 1 2 2 2 3 1 5 6 5 5 3 4 4 3 Gala 1 2 3 3 3 4 5 6 7 5 5 2 2 2 2 Golden Delicious − 1 1 1 1 2 2 4 5 6 6 3 3 3 3 Honeycrisp − − − − − 1 1 3 4 5 5 3 3 3 4 Scifresh − − − 1 1 1 − − − − − − − − − Note the changing compositions of reference cultivars over time. Table 1.
Number of five-fruit samples evaluated for each reference cultivar from 2005 to 2019.
Figures
(5)
Tables
(1)